 Bohdan Petrenko
 Liudmyla Kozak
 Elena Kronberg
 Roman Akhmetshyn1
- 1Department of Astronomy and Space Physics, Taras Shevchenko National University of Kyiv, Kyiv, Ukraine
- 2Space Research Institute of the National Academy of Sciences of Ukraine and the State Space Academy of Ukraine, Kyiv, Ukraine
- 3Department of Earth and Environmental Sciences, Ludwig Maximilian University of Munich, Munich, Germany
In our work, for the first time, we conducted a comprehensive multispacecraft wave study of flapping current sheet oscillations in Earth’s magnetotail. Measurements taken from the Magnetospheric Multiscale (MMS) mission were analyzed for two flapping events with different morphologies of oscillation behavior: stationary-like and kink-like type. A comparison of the results calculated by the methods of phase difference, wave surveyor, and Multipoint Signal Resonator technique was carried out. For the first time, using observations, it was found that the energy distribution of wavy magnetic field contains complex multi-branch dispersion dependencies on
Introduction
Flapping motions are wave-like oscillations of the current sheet (CS), and they often accompany explosive activity released in the geomagnetic tail (Sitnov et al., 2019). During such events, the magnetometers of the spacecraft (SC), which is located in the tail of Earth’s magnetosphere, register fluctuations of the
Flapping oscillations began to be studied more than half a century ago (Speiser and Ness, 1967), and since then, a sufficient number of quantitative methods have been developed to describe the processes in the current sheet. The minimum variance analysis and timing analysis (Harvey 1998; Sonnerup 1967) make it possible to estimate the phase speed of CS oscillations and its thickness
Currently, the question of what is the contribution of flapping oscillations to the energy budget of the geomagnetic tail and what type of instability is responsible for flapping motions in one or another case remains open. Among the possible triggers are considered external—solar wind, interplanetary magnetic field and internal—ion–ion kink instability (Karimabadi et al., 2003), magnetic double-gradient instability (Erkaev et al., 2007), and reconnection (Zhang et al., 2020a).
Gao et al. (2018) conducted a statistical study of 79 flapping events and found that when approaching from the midnight sector to the flanks, the CS normal has larger angles with the z-axis, and stationary oscillations turn into kink-type oscillations; in fact, two motion types are a manifestation of the same wave propagation. In our work, for two specific events based on the data of the MMS mission, we will also determine the oscillation type and the phase speed of their propagation.
Dispersion analysis of such waves is absolutely important, which will make it possible to consider the trigger instability present. The main dispersive features of flapping oscillations have already been considered in the works of Richard et al. (2021) and Rong et al. (2018). In our work, we will apply a number of multispacecraft methods, which will allow us to quantitatively and qualitatively assess the contribution of various low-frequency modes to the general picture of flapping. In addition, the range of frequencies and wave vectors is significantly expanded compared to the works of Richard et al. (2021) and Rong et al. (2018). Consideration in stationary and moving coordinate systems, taking into account the Doppler shift, will make it possible to estimate which modes do not undergo this shift and are independent of fast plasma flows.
Multispacecraft methodology
Turbulent or wave-like fluctuations of plasma parameters during measurements onboard a SC have mixed manifestations of spatial and temporal variations due to the dynamics of the environment itself. Therefore, the distribution of such plasma disturbances in terms of frequency and spatial range plays the most important role in identifying their spectral properties, including spectral laws, dispersion branches, and turbulence features (Borovsky et al., 1997; Song and Russell, 1999; Kozak et al., 2018; Lin et al., 2022). A wide variety of methods are used to obtain an experimental
First, we describe the phase difference method (Beall et al., 1982; Balikhin 1997). It is used for measurements of two SC, or any two sensors, such as in seismology. The mathematical basis is the use of continuous wavelet transformation, which allows finding several wave modes at a fixed frequency with their power, and moreover, omits the assumptions about the planarity of waves and the small amplitude of wave packets (Dudok de Wit T., 2013).
For two scalar time series
Phase
Having found
After that, the power spectrum is calculated as follows:
Alternatively,
A fast method for finding dispersion patterns is the wave surveyor technique (Vogt, 2008; Kozak, 2019), which directly gives the functional dependence
Here,
Raising to the power of -1 means taking the inverse matrix or pseudo-inverse (for cases with S = 2,3).
where
Here,
The k-filtering method has become widely used in the geophysical field studies (Capon, 1969; Pinçon et al., 1998). Unlike the previous methods, with the help of k-filtering, the power spectrum
The specificity of other methods based on the search for eigenvalues consists of the formation of additional matrices, which contain a vector of columns of eigenvectors and diagonal elements formed from eigenvalues (Pinçon et al., 1998; Narita 2012). In our work, we used one of these methods—the MSR technique—which has two significant advantages over other k-filtering methods, namely, in detecting waves with close wavelengths and in reducing background noise. The MSR technique is good for increasing the signal-to-noise ratio in power spectra compared to other methods but has the limitation of the finite number of wave modes that could be reconstructed from the signal.
The power spectrum according to the MSR method is calculated as follows (Narita, 2011):
The trace of the power matrix
Here,
Later in the paper, we will consider all spectra and dispersion patterns depending on the usual frequency in Hz and not on the angular frequency:
Observations
Analysis the CS flapping oscillations in Earth’s magnetotail was performed using measurements from the four-spacecraft Magnetospheric Multiscale (MMS) mission. Magnetic field data have been given from fluxgate magnetometer (FGM) instruments (Russell et al., 2016) and particle moments from Fast Plasma Investigation (FPI) (Pollock et al., 2016). During 26 August 2020, the spacecraft registered CS flapping oscillations of the CS. MMS for these time intervals was located at points
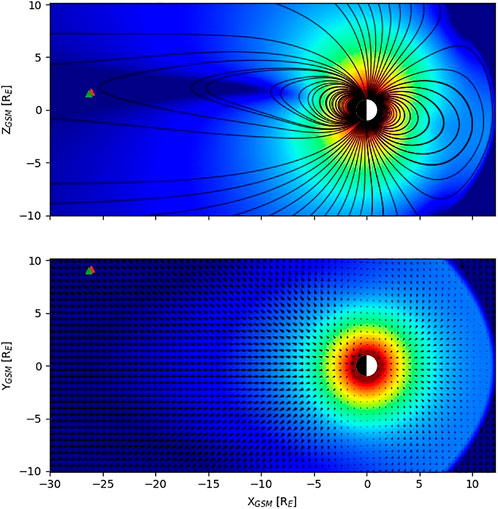
FIGURE 1. Position of MMS spacecraft during two flapping events on 2020/08/26 (red triangle indicates the location of the first event, and green indicates the location of the second event) in the XZ and XY GSM planes. The color gradation indicates the magnetic field magnitude (carried out with the SpacePy package).
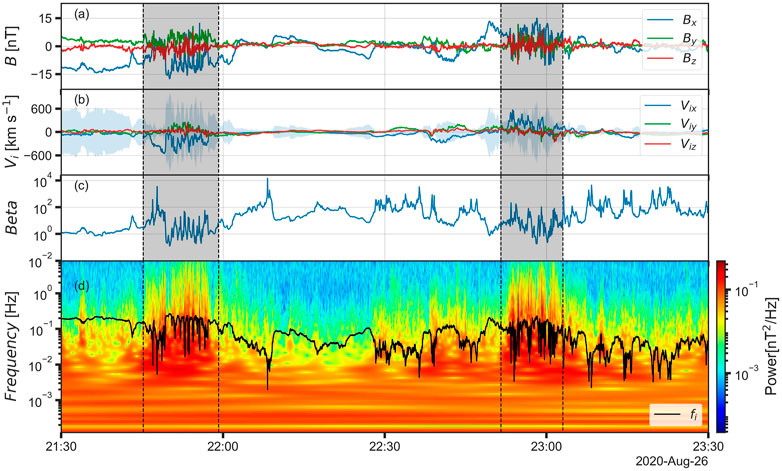
FIGURE 2. Flapping events 2020/08/26 (highlighted in gray) as observed by MMS. (A) Magnetic field. (B) Plasma flow velocity. The shadow shows local Alfven velocity calculated from FPI and resampled FGM MMS data. Plasma bulk velocities do not exceed the Alfven velocity almost throughout all flapping intervals. (C) β ion parameter. (D) Wavelet power spectrum of the magnetic field vector. The black line indicates proton gyrofrequency.
Results
For two flapping events, an analysis of the minimum variation (MVA) was applied to the magnetic field for the selected intervals, where a change in the sign of the
The first event shows the alternation of the κ parameter (+1, −1, +1...), which means a stationary type of flapping, that is, an up–down oscillation. For the second event
We calculated the phase difference spectra for each component of vector
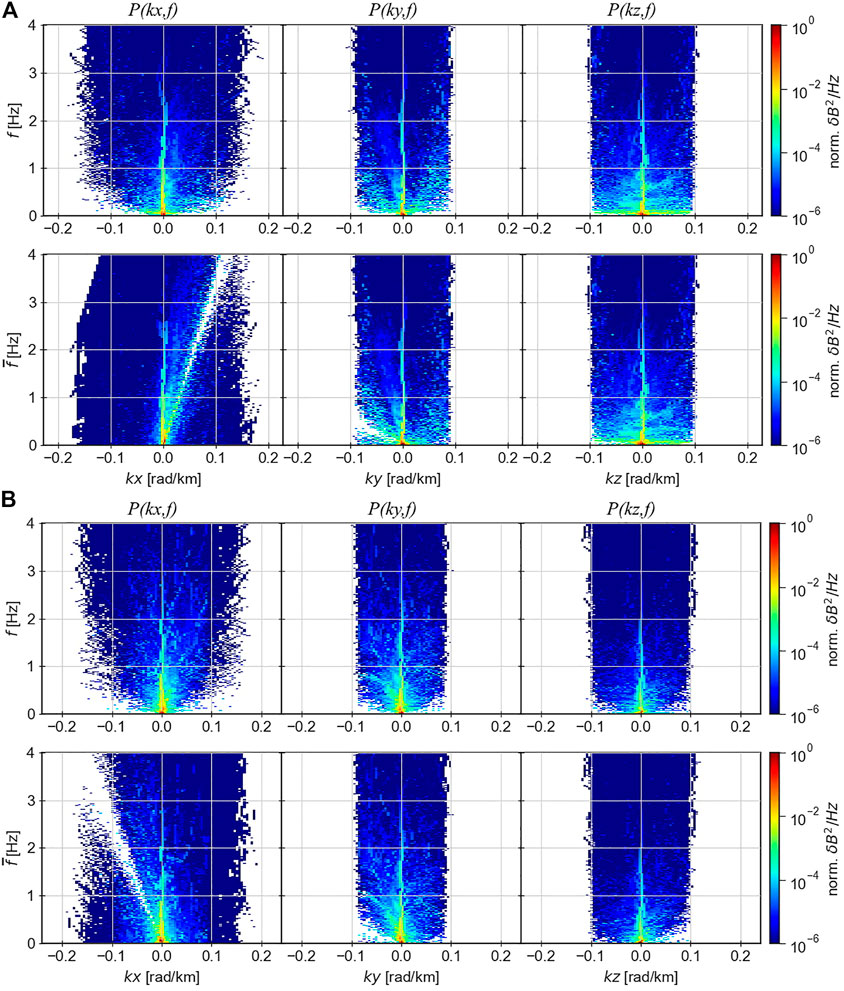
FIGURE 3. P (k,f) spectrum of the magnetic field vector for (A) the first event and (B) the second flapping event 2020/08/26. The spectra panels with
This makes it possible to correctly compare the results of this method with two others: the wave survey and the MSR method. The energy distribution was transferred to the plasma moving system using the Doppler correction (
The binning of frequencies is performed in a linear way, since it allows us to provide a Doppler shift for a specific value of
Let’s analyze the dispersion patterns constructed by the wave surveyor method (Figure 4). For the first event, one group of points is identical for the spectra obtained by the phase difference method. For the second event, we see some differences between the results of the two methods. This is due to the fact that the wave surveyor method is based on the Fourier transform, which allows viewing of the plane waves. Instead, phase difference spectra constructed from wavelet spectra can effectively identify the wave packets inherent to turbulent plasma. This is confirmed in the simple visual identification of the magnetic field time series—the second event contains a larger number of transient structures and intermittent patterns. However, the dispersion pattern
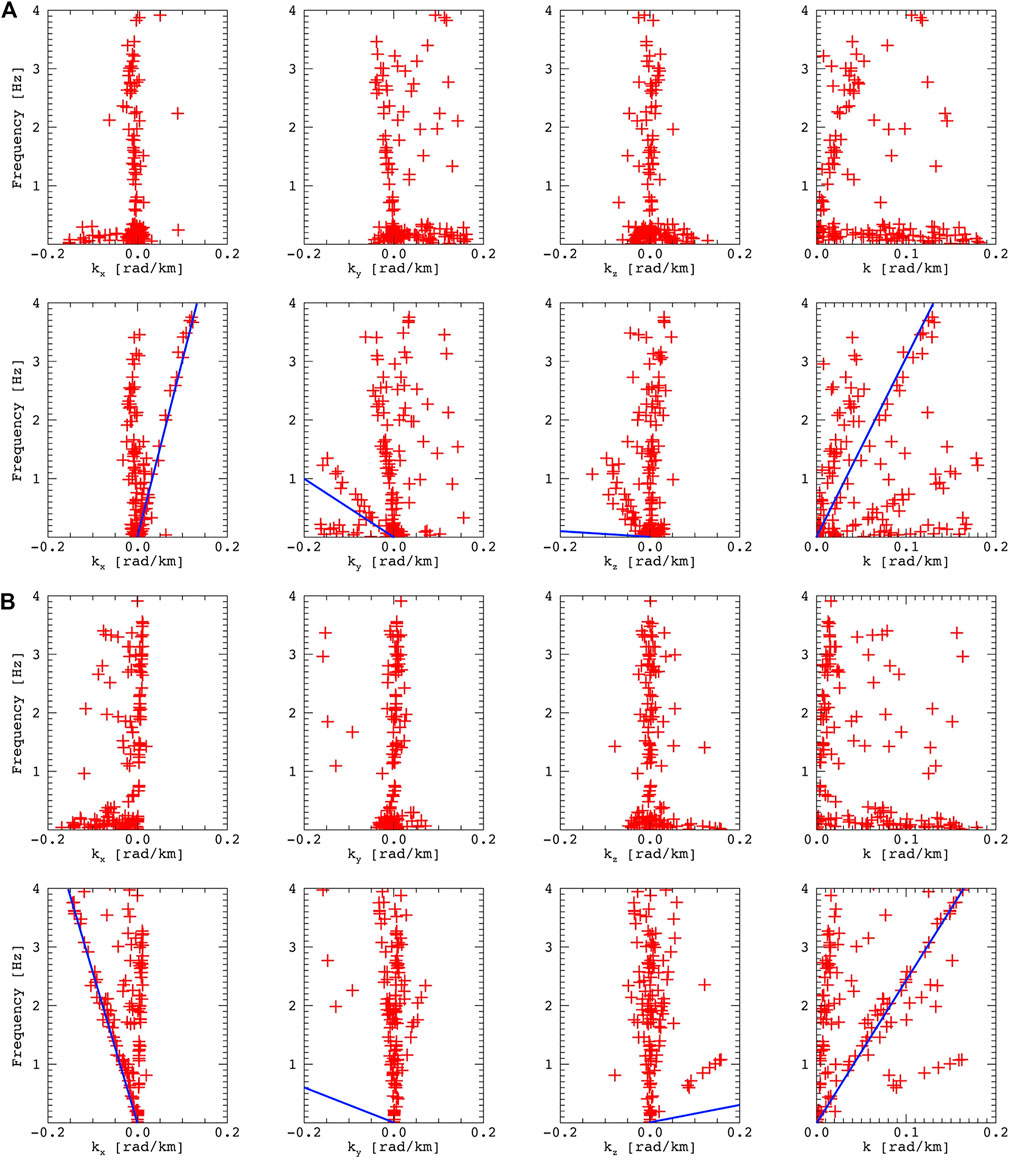
FIGURE 4. (A) f–k dispersion patterns of
Spectra obtained using the MSR method are constructed for a separate set of three frequencies. The latter corresponds to the maxima of the wavelet power for the corresponding intervals. A set with the dominant frequencies of 0.02, 0.05, and 0.5 Hz was selected for the first flapping and 0.02, 0.046, and 0.5 Hz for the second. For a simplified visualization of the obtained 3D spectra
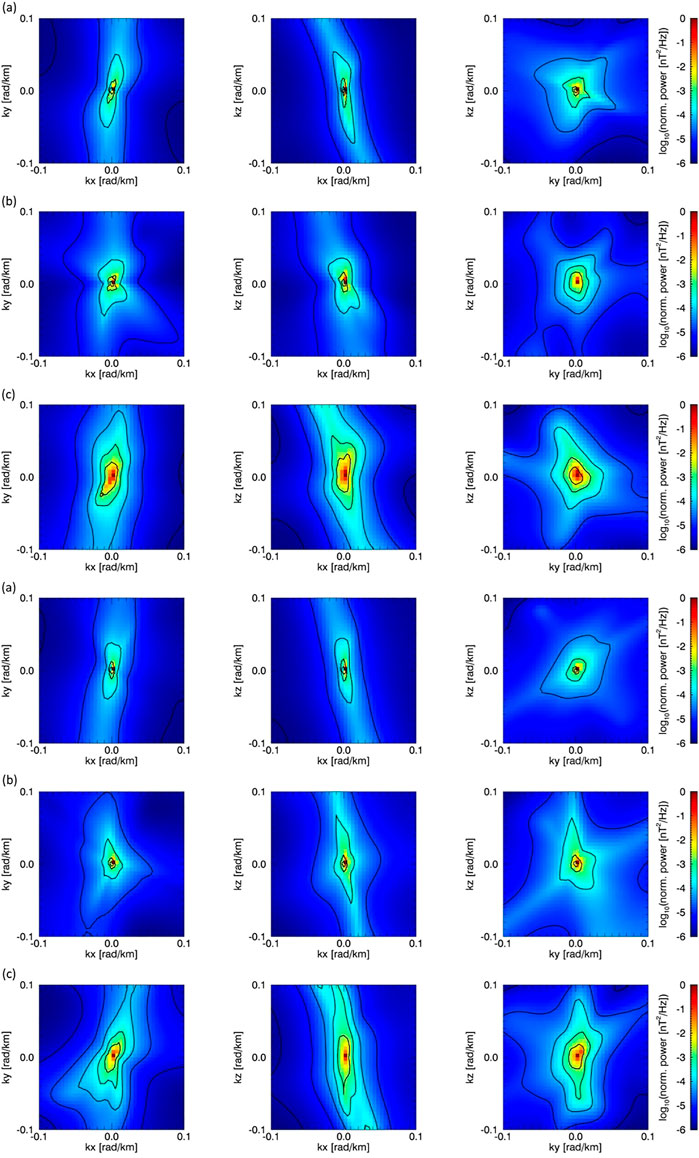
FIGURE 5. MSR 3D power spectra of
Conclusion
We present, for the first time, a low-frequency multispacecraft wave analysis for two flapping oscillation events with high-speed plasma flows. It was found from magnetic polarity that two events of flapping oscillations differ in their type: the first event is characterized by up-and-down movements, and the second event demonstrates kink-type oscillations.
We found that the energy distribution of fluctuations of the magnetic field vector contains previously undetected complex multi-branch dispersion dependences on
The used methods complement each other, and their differences made it possible to assess the presence of non-linear wave packets when considering kink flapping and the asymmetry of the CS profile in the azimuthal direction (Burch et al., 2016).
Data availability statement
Publicly available datasets were analyzed in this study. These data can be found at: https://lasp.colorado.edu/mms/sdc/public/about/browse/mms1/fgm/srvy/l2/2020/08/ https://lasp.colorado.edu/mms/sdc/public/about/browse/mms2/fgm/srvy/l2/2020/08/ https://lasp.colorado.edu/mms/sdc/public/about/browse/mms3/fgm/srvy/l2/2020/08/ https://lasp.colorado.edu/mms/sdc/public/about/browse/mms4/fgm/srvy/l2/2020/08/ https://lasp.colorado.edu/mms/sdc/public/about/browse/mms1/fpi/fast/l2/dis-moms/2020/08/.
Author contributions
LK proposed to conduct a comparative analysis of the results of specific multispacecraft methods. EK and RA made valuable suggestions about data visualization and text readability.
Funding
This work was supported by grant No. 97742 of the Volkswagen Foundation (VW-Stiftung) and the Royal Society International Exchanges Scheme 2021 IES\R1\211177, BF/30-2021. The work of Elena Kronberg was supported by the German Research Foundation (DFG) under number KR 4375/2-1 within SPP “Dynamic Earth.”
Acknowledgments
The data used in this work are publicly available at the MMS Science Data Center website https://lasp.colorado.edu/mms/sdc/. The phase difference method was performed using the pyrfu package, available at https://github.com/louis-richard/irfu-python.
Conflict of interest
The authors declare that the research was conducted in the absence of any commercial or financial relationships that could be construed as a potential conflict of interest.
Publisher’s note
All claims expressed in this article are solely those of the authors and do not necessarily represent those of their affiliated organizations, or those of the publisher, the editors, and the reviewers. Any product that may be evaluated in this article, or claim that may be made by its manufacturer, is not guaranteed or endorsed by the publisher.
References
Balikhin, M., Dudok de Wit, T., Alleyne, H. S. C. K., Woolliscroft, L. J. C., Walker, S. N., Krasnosel’skikh, V., et al. (1997). Experimental determination of the dispersion of waves observed upstream of a quasi-perpendicular shock. Geophys. Res. Lett. 24, 787–790. doi:10.1029/97gl00671
Beall, J. M., Kim, Y. C., and Powers, E. J. (1982). Estimation of wavenumber and frequency spectra using fixed probe pairs. J. Appl. Phys. 53, 3933–3940. doi:10.1063/1.331279
Borovsky, J., Elphic, R., Funsten, H., and Thomsen, M. (1997). The Earth's plasma sheet as a laboratory for flow turbulence in high-β MHD. J. Plasma Phys. 57 (1), 1–34. doi:10.1017/S0022377896005259
Burch, J. L., Moore, T. E., Torbert, R. B., and Giles, B. L. (2016). Magnetospheric multiscale overview and science objectives. Space Sci. Rev. 199 (1–4), 5–21. doi:10.1007/s11214-015-0164-9
Capon, J. (1969). High resolution frequency-wavenumber spectrum analysis. Proc. IEEE 57, 1408–1418. doi:10.1109/PROC.1969.7278
DiBraccio, G. A., Dann, J., Espley, J. R., Gruesbeck, J. R., Soobiah, Y., Connerney, J. E. P., et al. (2017). MAVEN observations of tail current sheet flapping at Mars. J. Geophys. Res. Space Phys. 122, 4308–4324. doi:10.1002/2016JA023488
Dudok de Wit, T., Alexandrova, O., Furno, I., Sorriso-Valvo, L., and Zimbardo, G. (2013). Methods for characterising microphysical processes in plasmas. Space Sci. Rev. 178, 665–693. doi:10.1007/s11214-013-9974-9
Erkaev, N. V., Semenov, V. S., and Biernat, H. K. (2007). Magnetic double gradient instability and flapping waves in a current sheet. Phys. Rev. Lett. 99, 235003. doi:10.1103/PhysRevLett.99.235003
Gao, J. W., Rong, Z. J., Cai, Y. H., Lui, A. T. Y., Petrukovich, A. A., Shen, C., et al. (2018). The distribution of two flapping types of magnetotail current sheet: Implication for the flapping mechanism. J. Geophys. Res. Space Phys. 123, 7413–7423. doi:10.1029/2018JA025695
Harvey, C. C. (1998). Spatial gradients and volumetric tensor, in Analysis methods for multi-spacecraft data. International Space Science Institute Scientific, 307–322. Bern, Switzerland.
Karimabadi, H., Daughton, W., Pritchett, P. L., and Krauss-Varban, D. (2003). Ion-ion kink instability in the magnetotail: 1. Linear theory. J. Geophys. Res. 108 (A11), 1400. doi:10.1029/2003JA010026
Kozak, L., Petrenko, B., Lui, A., Kronberg, E., Grigorenko, E., and Prokhorenkov, A. (2018). Turbulent processes in the Earth's magnetotail: Spectral and statistical research. Ann. Geophys. 36 (5), 1303–1318. doi:10.5194/angeo-36-1303-2018
Kozak, L. V., Petrenko, B. A., Lui, A. T. Y., Kronberg, E. A., and Daly, P. W. (2021). Processes in the current disruption region: From turbulence to dispersion relation. J. Geophys. Res. Space Phys. 126, e2020JA028404. doi:10.1029/2020JA028404
Lin, R., He, J., Zhu, X., Zhang, L., Duan, D., Sahraoui, F., et al. (2022). Power anisotropy, dispersion signature and turbulence diffusion region in the 3D wavenumber domain of space plasma turbulence. Astrophysical J. 939 (2), 121. doi:10.3847/1538-4357/ac8e07
Narita, Y., Glassmeier, K. H., and Motschmann, U. (2011). High-resolution wave number spectrum using multi-point measurements in space – The multi-point signal resonator (MSR) technique. Ann. Geophys. 29 (2), 351–360. doi:10.5194/angeo-29-351-2011
Narita, Y. (2012). Plasma turbulence in the solar system. Springer, Berlin, Germany. doi:10.1007/978-3-642-25667-7
Pinçon, J. L., and Motschmann, U. (1998). Multi-spacecraft filtering: General framework, in Analysis methods for multi-spacecraft data. (ESA Publication), 65–78. Paris, France.
Pollock, C., Moore, T., Jacques, A., Burch, J., Gliese, U., Saito, Y., et al. (2016). Fast plasma investigation for magnetospheric multiscale. Space Sci. Rev. 199 (1–4), 331–406. doi:10.1007/s11214-016-0245-4
Richard, L., Khotyaintsev, Y. V., Graham, D. B., Sitnov, M. I., Le Contel, O., and Lindqvist, P.-A. (2021). Observations of short-period ion-scale current sheet flapping. J. Geophys. Res. Space Phys. 126, e2021JA029152. doi:10.1029/2021JA029152
Rong, Z. J., Barabash, S., Stenberg, G., Futaana, Y., Zhang, T. L., Wan, W. X., et al. (2015). Technique for diagnosing the flapping motion of magnetotail current sheets based on single-point magnetic field analysis. J. Geophys. Res. Space Phys. 120, 3462–3474. doi:10.1002/2014ja020973
Rong, Z. J., Cai, Y. H., Gao, J. W., Lui, A. T. Y., Shen, C., Petrukovich, A. A., et al. (2018). Cluster observations of a dispersive flapping event of magnetotail current sheet. J. Geophys. Res. Space Phys. 123, 5571–5579. doi:10.1029/2018JA025196
Rong, Z. J., Barabash, S., Stenberg, G., Futaana, Y., Zhang, T. L., Wan, W. X., et al. (2015). The flapping motion of the Venusian magnetotail: Venus Express observations. J. Geophys. Res. Space Phys. 120, 5593–5602. doi:10.1002/2015JA021317
Russell, C. T., Anderson, B. J., Baumjohann, W., Bromund, K. R., Dearborn, D., Fischer, D., et al. (2016). The magnetospheric multiscale magnetometers. Space Sci. Rev. 199 (1–4), 189–256. doi:10.1007/s11214-014-0057-3
Sahraoui, F., Belmont, G., Goldstein, M. L., and Rezeau, L. (2010). Limitations of multispacecraft data techniques in measuring wave number spectra of space plasma turbulence. J. Geophys. Res. Space Phys. 115 (A4). doi:10.1029/2009JA014724
Schmidt, R. O. (1986). Multiple emitter location and signal parameter estimation. IEEE Trans. Ant. Prop. AP- 34, 276–280. doi:10.1109/tap.1986.1143830
Sergeev, V., Runov, A., Baumjohann, W., Nakamura, R., Zhang, T. L., Balogh, A., et al. (2004). Transient, small-scale field-aligned currents in the plasma sheet boundary layer during storm time substorms. Geophys. Res. Lett. 31, 4841–4849. doi:10.1002/2016GL068768
Sitnov, M., Birn, J., Ferdousi, B., Gordeev, E., Khotyaintsev, Y., Merkin, V., et al. (2019). Explosive magnetotail activity. Space Sci. Rev. 215 (4), 31. doi:10.1007/s11214-019-0599-5
Song, P., and Russell, C. (1999). Time series data analyses in space physics. Space Sci. Rev. 87, 387–463. doi:10.1023/A:1005035800454
Sonnerup, B. Ö., and Cahill, L. J. (1967). Magnetopause structure and attitude from Explorer 12 observations. J. Geophys. Res. 72 (1), 171–183. doi:10.1029/jz072i001p00171
Speiser, T. W., and Ness, N. F. (1967). The neutral sheet in the geomagnetic tail: Its motion, equivalent currents, and field line connection through it. J. Geophys. Res. 72, 131–141. doi:10.1029/JZ072i001p00131
Vogt, J., Narita, Y., and Constantinescu, O. D. (2008). The wave surveyor technique for fast plasma wave detection in multi-spacecraft data. Ann. Geophys. 26, 1699–1710. doi:10.5194/angeo-26-1699-2008
Zhang, C., Rong, Z. J., Gao, J. W., Zhong, J., Chai, L. H., Wei, Y., et al. (2020b). The flapping motion of mercury's magnetotail current sheet: MESSENGER observations. Geophys. Res. Lett. 47, e2019GL086011. doi:10.1029/2019GL086011
Keywords: flapping motions, phase difference, MMS, current sheet, magnetic field
Citation: Petrenko B, Kozak L, Kronberg E and Akhmetshyn R (2023) Multispacecraft wave analysis of current sheet flapping motions in Earth’s magnetotail. Front. Astron. Space Sci. 9:1071824. doi: 10.3389/fspas.2022.1071824
Received: 17 October 2022; Accepted: 21 December 2022;
Published: 12 January 2023.
Edited by:
Stanislav Boldyrev, University of Wisconsin-Madison, United StatesReviewed by:
Zhaojin Rong, Institute of Geology and Geophysics (CAS), ChinaOwen Wyn Roberts, Space Research Institute, Austrian Academy of Sciences, Austria
Copyright © 2023 Petrenko, Kozak, Kronberg and Akhmetshyn. This is an open-access article distributed under the terms of the Creative Commons Attribution License (CC BY). The use, distribution or reproduction in other forums is permitted, provided the original author(s) and the copyright owner(s) are credited and that the original publication in this journal is cited, in accordance with accepted academic practice. No use, distribution or reproduction is permitted which does not comply with these terms.
*Correspondence: Bohdan Petrenko, Ym9nZGFuYXJ0OTZAZ21haWwuY29t