 Le Ngoc Tram1*
 Thiem Hoang2,3*
- 1Max-Planck-Institut für Radioastronomie, Bonn, Germany
- 2Korea Astronomy and Space Science Institute, Daejeon, South Korea
- 3Korea University of Science and Technology, Daejeon, South Korea
Modern understanding of dust astrophysics reveals that radiative torques (RATs) arising from the radiation–dust interaction can induce two fundamental effects: grain alignment and rotational disruption. Here, we review the recent progress in the theoretical development and observational testing of these effects using dust polarization observed toward star-forming regions (SFRs). We first review the basic theory of the RAT alignment and RAT disruption, which are referred to as RAT-A and RAT-D effects, respectively. We then briefly describe the numerical method used to model polarized thermal dust emission by accounting for both RAT-A and RAT-D and theoretical predictions of dust polarization for observations. Next, we review our observational efforts to search for observational evidence of the RAT-A and RAT-D effects using thermal dust polarization toward SFRs. Finally, we discuss magnetic fields inferred from dust polarization observed toward these SFRs and implications of the RAT paradigm for different astrophysical conditions, including protostellar environments, dust evolution, and time-domain astrophysics.
1 Introduction
Dust is an essential component of the interstellar medium (ISM) and plays an important role in many astrophysical phenomena, from ISM evolution, star formation, and planet formation to surface chemistry. The dust properties, including the size, shape, and composition, determine the extinction of starlight and re-emission in infrared emission, which control the appearance of the Universe (Draine, 2011). Thermal dust emission is at the foundation of infrared, submm/mm astronomy, a central topic which is the formation process of stars and planets. In particular, the discovery of starlight polarization (Hall, 1949; Hiltner, 1949) revealed that dust grains are non-spherical and aligned with a preferred direction in space, which demonstrated the existence of the interstellar magnetic field.
A magnetic field is believed to play an important role in various astrophysical phenomena, including the evolution of the ISM, star formation (Crutcher, 2012), and cosmic ray acceleration and transport. Therefore, observations of the magnetic field have important implications for understanding astrophysical phenomena. Motivated by the discovery of starlight polarization and grain alignment, Davis (1951) and Chandrasekhar and Fermi (1953) introduced a technique to measure the field strength using dust polarization orientations, which is based on the energy balance between turbulent energy and magnetic energy (known as DCF technique). Hildebrand (1988) realized that polarization of far-IR thermal emission from dust grains aligned with the magnetic field can be used to trace the field morphology in very cold regions where young stars are being formed because long-wavelength photons can propagate a long distance. These enabled the rapid development of far-IR/submm polarimetric capabilities in the last decades, including SMA (Marrone and Rao 2008), CSO/SHARP (Li et al., 2008), Planck (Planck Collaboration et al., 2014), BLAST-Pol (Galitzki et al., 2014), PILOT (Misawa et al., 2014), APEX/POLKA (Wiesemeyer et al., 2014), CARMA (Hull and Plambeck, 2015), ALMA (Nagai et al., 2016), JCMT/POL2 (Friberg et al., 2018), and SOFIA/HAWC+ (Harper et al., 2018). As a result, significant progress in understanding the role of magnetic fields in the interstellar process has been made, from diffuse interstellar clouds (e.g., Heiles and Crutcher 2005; Planck Collaboration et al., 2015) and star-forming regions (e.g., Curran and Chrysostomou, 2007; Chuss et al., 2019; Doi et al., 2020; Arzoumanian et al., 2021; Devaraj et al., 2021; Guerra et al., 2021; Kwon et al., 2022, see also Pattle et al., 2022 for reviews) to extra-galactic scales (e.g., Jones et al., 2020; Lopez-Rodriguez et al., 2020; Borlaff et al., 2021; Lopez-Rodriguez 2021; Pattle et al., 2021a).
However, questions of how dust grains get aligned and whether dust polarization is a reliable tracer of magnetic field are long-standing questions in astrophysics (see Lazarian, 2007 for a review). In principle, the process of grain alignment includes two stages: 1) the alignment of the grain axis of maximum inertia moment (i.e., the shortest axis) with its angular momentum (the so-called internal alignment) and 2) the alignment of the grain angular momentum with a preferred axis in space (i.e., axis of grain alignment), which includes the external magnetic field and radiation direction (so-called external alignment). The leading process for the internal alignment of interstellar grains is the Barnett relaxation effect (Barnett, 1909; Purcell, 1979). The Barnett effect is the reverse of the Einstein–de Haas effect (Einstein and de Haas 1915), arising from the dissipation of grain rotational energy into heat due to rotating magnetization within a paramagnetic grain rotating around a non-principal axis.
For the ISM (e.g., the diffuse ISM and molecular clouds (MCs)) where grains are essentially small (of radius of a < 1 μm), the Barnett relaxation is usually much faster than the randomization of grain orientation by gas collisions, resulting in the perfect internal grain alignment (i.e., the grain axis of maximum inertia moment is parallel to its angular momentum; see e.g., Hoang, 2022). For external alignment, the leading theory of grain alignment is based on radiative torques (hereafter RATs, Dolginov and Mitrofanov, 1976; Draine and Weingartner, 1996; Lazarian and Hoang, 2007a) and/or mechanical torques (METs; Lazarian and Hoang 2007b; Hoang et al., 2018. Many predictions of the RAT alignment (or RAT-A) theory were successfully tested with observations (Andersson et al., 2015). The fast Larmor precession establishes the magnetic field as a preferred axis of external alignment (see e.g., Hoang, 2022). Therefore, dust polarization is an established, reliable tracer of magnetic fields in such conditions, which is the focus of this review.
Yet, for special environments where the radiation intensity is strong while the magnetic field is weak or grain susceptibility is negligible (e.g., carbonaceous dust), or the gas is very dense (e.g., protostellar cores/disks and protoplanetary disks, in which grains could grow to very large size of
While dust polarization orientations have become a powerful method to measure the magnetic field, the dust polarization degree (p) provides a unique probe into dust properties and dust fundamental physics. Indeed, the degree of dust polarization depends on the grain alignment efficiency, grain properties, local density, and magnetic field structure (e.g., Draine and Fraisse, 2009; Guillet et al., 2018). According to the RAT-A theory, the alignment efficiency of dust grains depends on local conditions such as gas properties and radiation (Hoang et al., 2021b) and grains’ geometric properties (size and shape) and magnetic properties (Lazarian and Hoang, 2007a; Hoang and Lazarian, 2008, 2016a; Herranen et al., 2021). Therefore, p allows to probe physics of grain alignment and physical properties of dust grains such as grain sizes and composition. The variation of p with the total emission intensity (I) permits a popular analysis of polarimetric data to study the variation of grain alignment and magnetic field geometry across the observed region. The general trend observed toward molecular clouds is p ∝ I−α with the power-index α between 0 and 1 (e.g., Coudé et al., 2019; Pattle et al., 2019; Ngoc et al., 2021). If the magnetic field is uniform, α = 0, indicating that grain alignment is uniform, whereas α = 1 implies that grain alignment only occurs in the outer layer of the cloud and becomes completely lost in the inner region (Whittet et al., 2008). If magnetic fields are completely random, the uniform grain alignment results in a slope of α ≈ 0.5 (see Jones et al., 1992, 2015).
Nevertheless, the p − I relation is not a perfect tracer of grain alignment because of the complex dependence of the emission intensity on the gas density and dust properties. Indeed, the total emission intensity observed at frequency ν is Iν ∝ B (Td)τν ∼ fd/gNH × B (Td) × κν, where fd/g is the dust-to-gas mass ratio and κν is the dust opacity, which is the product of gas column density (NH), dust temperature (Td), and dust opacity (i.e., grain size distribution and composition) along the line of sight. Therefore, the p − I relation reflects the overall dependence of p on the product of three key parameters (gas density, radiation field, and grain size distribution). To disentangle the effect of the radiation field from the gas density, it is required to analyze the variation of the polarization degree with the dust temperature and the gas column density. The first analysis directly reveals the grain alignment by RATs, whereas the second one reflects the effect of grain randomization induced by gas collisions. The dust polarization is predicted to increase with radiation emission intensity (or Td) by theory (Hoang et al., 2021b), numerical modeling (Lee et al., 2020), and numerical simulations (Reissl et al., 2016). A detailed analysis of the polarization data for various clouds by Planck Collaboration et al. (2020) shows that the polarization degree at 850 μm decreases with dust temperature for Td ≥ 19 K (see their Figure 18). This observed feature challenges the classical picture of the RAT-A theory.
Recently, a new fundamental effect induced by RATs, namely, radiative torque disruption (or RAT-D), has been realized by Hoang et al. (2019); Hoang (2019). The effect is based on the fact that an irregular dust grain exposed to a strong radiation field could be disrupted into small fragments when the centrifugal stress induced by suprathermal rotation by RATs exceeds the maximum binding energy of the grain material (i.e., tensile strength). Since RATs are stronger for larger grains (Lazarian and Hoang, 2007a; Hoang and Lazarian, 2008), RAT-D is effective for large grains, which then determines the upper cutoff of the grain size distribution (GSD) and causes the variation of GSD with the radiation field. The modified GSD by RAT-D, in turn, affects dust optical-UV extinction, thermal emission from infrared to radio wavelengths, and polarization (see Hoang, 2020 for a review). The RAT-D effect has been studied in many astrophysical environments, including extinction curves toward starburst galaxies (Hirashita and Hoang, 2020), light curve of type Ia supernovae (Giang et al., 2020) and gamma-ray burst (GRB) afterglows (Hoang et al., 2020), evolution of ice in protoplanetary disks (Tung and Hoang, 2020) and cometary comae (Hoang and Tung, 2020), circumsolar dust (Hoang et al., 2021a), rotational desorption of interstellar organic molecules (Hoang and Tram, 2020), spinning dust nanoparticles in circumstellar envelopes of evolved stars (Tram et al., 2020), radiation pressure feedback from massive protostars (Hoang, 2021b), and dust evolution across cosmic time (Hoang, 2021a). In particular, Lee et al. (2020) performed numerical modeling of multi-wavelength polarized thermal dust emission from aligned grains and disruption by RATs in MCs. They showed that the polarization at 850 μm first increases and then decreases with Td, which could reproduce the p − Td trend observed by Planck (Planck Collaboration et al., 2020). Tram et al. (2021a) carried out a detailed modeling to interpret the p − Td of Ophiuchus, a cloud observed by SOFIA/HAWC+ with higher resolution than Planck. The authors demonstrated that the combination of the RAT-A and RAT-D effects could successfully reproduce the observational data. Since then, more observations have shown evidences for the RAT-D mechanism (e.g., Tram et al., 2021b; Ngoc et al., 2021; Hoang T. D. et al., 2022).
High-resolution polarimetric observations toward starless cores (e.g.,Alves et al., 2014; Jones et al., 2015) and protostars (e.g., Hull et al., 2014; Cox et al., 2018; Pattle and Fissel, 2019) usually report the decrease of the polarization degree with increasing column density or intensity of dust emission, also known as “polarization hole”. Moreover, two popular reasons proposed to explain the polarization hole includes the decrease of grain alignment efficiency toward denser gas/lower radiation fields and the tangling of the magnetic field (Goodman et al., 1992, 1995; Hull et al., 2014). In the case of protostars, one expects, however, an increase of grain alignment efficiency toward the protostar due to the increasing incident radiation flux in accordance with the RAT-A theory. Hence, an increase in the induced polarization degree is expected in proximity to the peak intensity. Therefore, the underlying origin of the polarization hole toward protostars is difficult to understand and reconcile in terms of grain alignment theory. The miss-match between theory and observations has been reported in Pillai et al. (2020) and Zielinski et al. (2021). Hoang et al. (2021b) showed that the rotational disruption by RATs could occur in the vicinity of protostars and suggested the combination of grain alignment and disruption by RATs as a plausible origin of the polarization hole. For MCs without embedded sources or line of sights far away from the source, the polarization hole may be dominated by the effect of B-field tangling and grain alignment loss (see Pattle and Fissel, 2019).
In this review, we summarize the fundamentals of grain alignment in the context of suprathermal rotation and disruption by RATs and internal and external alignment processes within conditions of the molecular cloud in Section 2. In Section 3, we summarize the numerical modeling that predicts the polarized thermal dust emission of molecular cloud irradiated by a nearby luminosity source in the framework of the RAT paradigm (RAT-A and RAT-D effects). We review some representative observational interpretations in Section 4. In Section 5, we discuss grain alignment to trace magnetic fields in molecular clouds and very dense conditions in protostellar cores/disks, including a polarization hole within the RAT paradigm, effects of RAT paradigm in time-domain astrophysics and on grain growth and evolution, and suprathermal rotation induced by mechanical torques.
2 Grain alignment and disruption by radiative torques: The RAT paradigm
2.1 Radiative torques and its fundamental effects
Dolginov and Mitrofanov (1976) first suggested that the interaction of an anisotropic radiation with a helical grain can induce RATs due to the differential scattering/absorption of left- and right-handed circularly polarized photons. Latter, RATs were numerically demonstrated in Draine and Weingartner (1996) for three irregular grain shapes. Lazarian and Hoang (2007a) introduced an analytical model (AMO) of RATs, which is based on a helical grain consisting of an oblate spheroid and a weightless mirror. The AMO is shown to reproduce the basic properties of RATs obtained from numerical calculations for realistically irregular grain shapes (Lazarian and Hoang, 2007a; Hoang and Lazarian, 2008; Herranen et al., 2021), and it enables us to make quantitative predictions for various conditions (Hoang and Lazarian, 2014) and dust compositions (Lazarian and Hoang, 2008; Hoang and Lazarian, 2009, 2016a). Many predictions from the RAT alignment (hereafter RAT-A) theory were observationally tested (see Andersson et al., 2015 Lazarian et al., 2015 for recent reviews).
As shown in previous studies (Draine and Weingartner, 1997; Lazarian and Hoang, 2007a; Hoang and Lazarian, 2008), RATs in general can induce three fundamental effects on grain rotational dynamics: 1) the grain precession around the radiation direction, 2) spin-up the grain to suprathermal rotation as well as spin-down to thermal rotation, and 3) align the grain with J along the radiation k.
2.2 Grain model and magnetic properties
2.2.1 Grain model
Let us define an irregular grain of size a and mass density ρ (Figure 1). In the fixed grain’s frame, this irregular shape is described by three principal axes
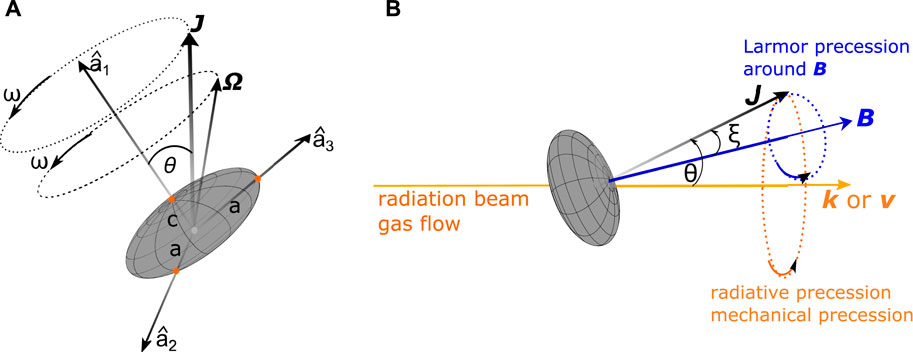
FIGURE 1. (A) Illustration of internal alignment between the angular momentum (J) and the short axis (a1). (B) Illustration of external alignment between J and the external magnetic field (B) or radiation direction (k) or gas flow (v). Ω is the angular velocity, and ω is the angular frequency. Figures are taken from Hoang T. et al. (2022).
For an isolated grain, the angular momentum J is conserved, and the grain axis of maximum inertia in general makes an angle with J. Figure 1A describes the torque-free motion of the oblate grain, which includes the precession of angular velocity of Ω or momentum J with a frequency of ω along the grain shortest axis. In the presence of an external magnetic field, radiation field, or a gas flow, the angular momentum J precesses around the magnetic field, radiation field, or incident gas flow, see Figure 1B (Lazarian and Hoang, 2007a,b).
2.2.2 Grain magnetic properties
Magnetic properties of dust are essential for their interaction with the ambient magnetic field and grain alignment. We consider grains with embedded iron atoms (such as silicate grains). The presence of iron atoms with unpaired electrons makes interstellar dust a natural paramagnetic material. When iron atoms are diffusely distributed, the grain is called paramagnetic (PM). When iron atoms are distributed as iron clusters, dust grains become superparamagnetic materials (SPM, see Hoang and Lazarian, 2016a).
The magnetic susceptibility of a paramagnetic grain at rest is given as follows:
with
For a superparamagnetic grain, we get the following:
Here, Ncl is the number of Fe atoms per cluster, and ϕsp is the volume filling factor of iron cluster in grain. Ncl could vary from 20 to 105 (Jones and Spitzer, 1967). One can see that iron inclusion significantly increases the magnetic property of grains.
For a grain rotating at a frequency ω, the magnetic susceptibility is a complex number with the imaginary part that describes the absorption properties of magnetic energy, given as follows:
where τel = 2.9 × 10⁻¹²/fpn23 is the spin–spin relaxation time with n23 = n/1023 cm−3 being the atomic density of material, and fp the fraction of Fe atoms in the grain (e.g., fp = 1/7 for MgFeSiO4 grains, see Hoang et al., 2014).
Let us define a quantity K(ω) = χ2(ω)/ω, which yields
and
with
where τsp is the timescale of thermally activated remagnetization, given as follows:
The supermagnetic grain has enormously increased magnetic susceptibility (Jones and Spitzer, 1967), and the coupling with the magnetic field is stronger than in an ordinary paramagnetic grain. Note that a superparamagnetic grain behaves like a paramagnetic grain in the absence of an external magnetic field.
2.3 Grain suprathermal rotation by RATs and rotational damping
Let us consider a grain exposed to a radiation field of the energy density of urad (erg cm−3), a mean wavelength of
The rotation of an irregular grain of size a is described by the suprathermal number St = Ω/ΩT with
One of the important effects of RATs is to spin-up the dust grains of irregular shapes. On the another hand, gas collisions and IR re-emission spin-down the grain. The timescale characterizing the grain rotational damping by gas collisions and IR emission is
where τgas and FIR are the gas collision damping timescale and the ratio of the IR re-emission to collisional damping times, which are
with n3 = nH/(103 cm−3) the gas volume density, T1 = Tgas/10 K the gas temperature, a−5 = a/(10−5 cm) the grain size,
The balance between the spin-up by RATs and spin-down by gas collisions and IR emission establishes the maximum rotation rate of grains due to RATs. For a simple case of a constant luminosity source2, the maximum angular velocity that an irregular grain acquired by RATs is
where
The RAT efficiency strongly depends on the ratio of radiation wavelength and grain size as
Because the RAT efficiency changes its slope at
for
for
For regions where the gas density is very high and the radiation strength is rather small (i.e., FIR ≪ 1), such as in pretostellar cores and the mid-plane of protoplanetary disks, one can see that StRAT ∝ U/n3T1. For regions with very strong radiation fields but a low gas density (i.e., FIR ≫ 1), such as in the vicinity of a radiation source, one has StRAT ∝ U1/3. Note that StRAT also strongly depends on the size of the grains, the bigger grain size, the faster rotation induced by RATs. Therefore, large grains are easily to be spun-up suprathermally in strong radiation fields.
2.4 Internal alignment
The internal alignment describes the alignment of the angular momentum J with the short axis a1 of the grain, as illustrated in Figure 1A. Here, we discuss three relaxation processes that induce internal alignment, including Barnett relaxation, nuclear relaxation, and inelastic relaxation, as well as show the critical grain sizes for each internal alignment.
2.4.1 Barnett relaxation
The most important process relies on the Barnett relaxation (Purcell, 1979). A rotating (super)paramagnetic grain will be magnetized due to the Barnett effect, which results in the dissipation of rotational energy due to the rotating component perpendicular to a1. The dissipation will eventually bring Ω and J aligned with a1, which is the minimum energy state. The stage of J ⊥a1 is called “right internal alignment”.
The relaxation times by the Barnett effect for a paramagnetic (so-called Barnett relaxation) and a supermagnetic grain (so-called super-Barnett relaxation) are given as follows:
where V = 4π/3a3 is the grain volume, γe = −geμB/ℏ is the gyromagnetic ratio of an electron (ge ≃ 2 and μB ≃ 9.26 × 10⁻²¹ erg G−1),
However, gas collisions can strongly randomize the internal alignment if the Barnett relaxation is slower than the grain randomization by gas collisions. Therefore, grains have efficient internal alignment when the timescale for the Barnett relaxation is shorter than that for gas rotational damping. Thus, the maximum size that a paramagnetic and superparamagnetic grain has the internal alignment with J along the short axis a1 can be determined by the balance between these two timescales, which yields the following (Hoang T. et al., 2022):
and
where Ncl,4 = Ncl/104 (Hoang T. et al., 2022). One can see that amax,aJ increases with grain rotation as St1/3 and decreases with gas density as
2.4.2 Nuclear relaxation
Atomic nuclei within the grain can also have nuclear paramagnetism due to unpaired protons and nucleons. The attachment of H atoms to the grain or water ice mantle induces nuclear magnetism due to proton spin (Purcell, 1979). Nuclear paramagnetism can also induce internal relaxation as the Barnett effect for electron spins (Lazarian and Draine, 1999). The nuclear relaxation (NR) time is given by
where γn is nuclear gyromagnetic ratio, ne is the number density of unpaired electrons in the dust, nn is the number density of nuclei that has the magnetic moment μn, and μN = eℏ/2mpc = 5.05 × 10⁻²⁴ erg G−1, where mp is the proton mass is the nuclear magneton,
The maximum size for internal alignment induced by nuclear relaxation is given by Hoang (2022), as follows:
It increases with the suprathermal rotation as St1/3 for ω < 2/τn but decreases as St−1/3 for ω > 2/τn due to suppression of nuclear magnetism at fast rotation. For the typical density of n = 103 cm−3, large grains of size upto a ∼ 3 μm can have efficient internal alignment by nuclear relaxation.
2.4.3 Inelastic relaxation
Atoms and molecules in a rotating grain experience a centrifugal force that stresses them out from the grain central of mass. The chemical attractive forces, on the other hand, tend to tight them together. These effects cause the grain deformation. If grains are made up inelastic materials, the deformation results in the dissipation of rotational energy, which eventually brings the angular momentum J to align with the grain’s shortest axis a1 (see Purcell, 1979; Lazarian and Efroimsky, 1999). This internal alignment mechanism is named as inelastic relaxation.
The characteristic time of inelastic relaxation for an oblate spheroidal grain can be estimated as follows (see Hoang T. et al., 2022):
where Q is the quality factor of grain material (Q = 100 for a silicate rocks, Efroimsky and Lazarian 2000), μ is the modulus of rigidity (μ ∼ 107 erg cm−3 for cometary, Knapmeyer et al., 2018). Ω0 = StΩT, μ8 = μ/(108 erg cm3), Q3 = Q/103, and g′ = 2.2s3/2g(s) with g(s) the geometrical factor as follows:
which corresponds to g(s) = 7.0 and 4.6 for s = 1/2 and 1/3, respectively.
Following Hoang et al. (2022a), the maximum grain size for efficient inelastic relaxation is defined by τiER = τgas and given by
which implies that large grains of a ∼ 1.55 μm can be efficiently aligned via inelastic relaxation even at thermal rotation of St = 1, and large grains can be aligned for St > 1.
Figure 2 shows the comparison of grains having internal alignment by Barnett relaxation for superparamagnetic grains (color lines) and inelastic relaxation (black lines) as functions of the gas density. Grains are assumed to be spun-up by RATs. First, the Barnett relaxation is not effective in very dense regions (e.g., nH > 109 cm−3) because of the gas rotational damping and lower StRAT. For a given gas density, one can see that Barnett relaxation is more efficient, but the inelastic relaxation is able to align larger grains (panel (a)). The reason is that the maximum grain size for inelastic relaxation scales as ∼ St2/3, whereas it scales as ∼ St1/3 for Barnett relaxation. For stronger radiation fields, the inelastic relaxation is efficient in denser gas (panel (b)), which is due to the fact that inelastic timescale reduces as ∼ St−1/3.
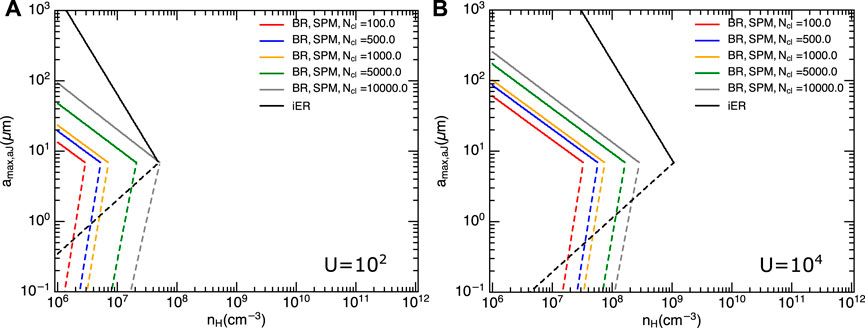
FIGURE 2. Comparison of minimum (dashed line) and maximum (solid line) size of grains having internal alignment by Barnett relaxation (BR) for superparamagnetic grain (SPM, color lines) and inelastic mechanism (iER, black lines) with respect to a large range of gas density (figure adopted from Hoang T. et al., 2022). The grains are spun-up by RATs with U = 102 (A) and U = 104 (B).
For a typical density of the ISM (nH ≃ 103 cm−3), one can see that the Barnett relaxation for PM/SPM grains are much more effective than the inelastic relaxation. However, unlike the PM/SPM, diamagnetic grains (e.g., carbonaceous dust) does not experience the Barnett relaxation effect, but they could still have efficient internal alignment for size a < amax,aJ (iER) due to inelastic relaxation, because this relaxation is independent from the grain magnetic properties.
2.5 External alignment
The external alignment describes the alignment of the grain angular momentum J with a preferred direction in space, which can be the ambient magnetic field or the radiation direction (see Figure 1B).
2.5.1 Alignment with magnetic fields (magnetic alignment): Larmor precession and magnetic relaxation
2.5.1.1 Larmor precession
The interaction between the grain magnetic moment due to the Barnett effect with the magnetic field induces the Larmor precession of J around B, resulting the first coupling of the grain with the magnetic field (see e.g., Hoang, 2022).
The rate of the Larmor precession for (super)paramagnetic grains are respectively given by
and
When the Larmor precession is faster than the gas randomization, the magnetic field becomes an axis of grain alignment, which is known as magnetic alignment. The maximum size for the fast Larmor precession around the B-field is defined by τB = τgas, which is
and
for PM and SPM grains, respectively.
2.5.1.2 Para- and superparamagnetic relaxation
The angle between J and the magnetic field can be reduced by paramagnetic relaxation, resulting in the magnetic alignment of J with B. This mechanism is known as the DG relaxation (Davis and Greenstein, 1951). As numerically shown in Hoang and Lazarian (2016a,b), magnetic relaxation alone is not enough to produce efficient grain alignment when grains have thermal rotation (i.e., St ≤ 1) due to strong internal thermal fluctuations and gas randomization. Yet, the joint action of suprathermal rotation by RATs and magnetic relaxation however can make grains to achieve high degree of alignment.
The characteristic times of the DG relaxation for the PM and SPM grains are given by (see e.g., Hoang and Lazarian, 2016a)
and
The respective maximum of size that grain alignment can still be affected by the DG magnetic relaxation is defined by τmag = τgas and is equal to (Hoang T. et al., 2022)
and
One can see that the gas density and B-field strength determine which grains are aligned with B-field as
2.5.2 The RAT alignment paradigm
Here, we describe the basic elements of the RAT alignment paradigm, including radiative precession, grain alignemnt at low-J and high-J attractors, and the minimum size for RAT alignment.
2.5.2.1 Radiative precession
In the presence of an anisotropic radiation field, irregular grains experience radiative precession due to RATs, with the grain angular momentum precessing around the radiation direction (k). For a grain with angular momentum J, the radiative precession time is given by (Lazarian and Hoang, 2007a; Hoang and Lazarian, 2014),
where
In the absence of magnetic field, radiative precession can be much faster than gas damping time for a thermal rotation of St ∼ 1 (Eq. 11). In this case, the anisotropic radiation direction is the axis of grain alignment, which is known as k-RAT alignment.
Low − J and high − J Attractor Alignment by RATs: In addition to radiative precession, RATs can align grains at high-J attractors and low − J attractors. In general, a fraction of grains (fhigh-J) can be aligned at a high − J attractor due to the aligning and spin-up effects of RATs (Lazarian and Hoang, 2007a; Hoang and Lazarian, 2008). Grains aligned at the high − J attractor have the suprathermal rotation with Sthigh-J > 1. On the other hand, due to the aligning and spin-down effects of RATs, the 1 − fhigh-J fraction of grains, are aligned at the low − J attractor with Stlow-J ∼ 1 (Hoang and Lazarian, 2014). The RAT alignment process can occur on a timescale smaller than the gas damping time, which is called fast alignment (Lazarian and Hoang, 2007a, 2021) with a strong radiation field. Grains can be stably aligned at low −J attractors when the grain randomization by gas collisions is not considered. Otherwise, the gas randomization could randomize grains at low − J attractors and eventually transport them to the high − J attractor after a timescale greater than the gas damping time, which is usually called slow alignment (Hoang and Lazarian, 2008; Lazarian and Hoang, 2021). The fast RAT alignment occurs in the local environment of intense transient radiation sources such as supernova (Giang et al., 2020), kilonova, and gamma-ray bursts (Hoang et al., 2020), whereas the slow RAT alignment occurs in most astrophysical environments, from the ISM, MCs, to SFRs. A detailed discussion of fast and slow alignment by RATs is discussed in detail in Lazarian and Hoang (2021).
The exact value of fhigh-J depends on the grain properties (shape and size) and magnetic susceptibility. For grains with ordinary paramagnetic material (e.g., silicate), Herranen et al. (2021) found that fhigh-J can be about 10–70% based on calculations of RATs for an ensemble of Gaussian random shapes. The presence of iron inclusions embedded in the grains increases grain magnetic suceptibility and superparamagnetic relaxation, which can produce in the universal high − J attractors (i.e., fhigh-J ∼ 100%) (Hoang and Lazarian, 2016a; Lazarian and Hoang, 2021).
2.5.2.2 Minimum size of RAT alignment
Due to gas collisions, grains can be efficiently aligned only when they rotate suprathermally at a high-J attractor. Hoang and Lazarian (2008) and Hoang and Lazarian (2014) demonstrated that grain alignment is stablized under the gas randomization when ΩRAT ≡ 3 ×ΩT (or StRAT = 3). This criteria yields the minimum size for grain alignment by RATs as
where γ−1 = γ/10–1. One can see that for a typical MC with nH = 103 cm−3, grains larger than aalign = 0.055 μm can be aligned by RATs. However, the radiation strength is not an observable quantity, thus we could use the dust temperature Td as a proxy for this strength. If we adopt
2.5.2.3 k-RAT vs. B-RAT Alignment
Using Eq. 31 one calculates the radiative precession (k-RAT) timescale for grains aligned at low − J attractors with St = 1 as
and for grains aligned at high − J attractors with St = StRAT from Eq. 14, one has
In the presence of a magnetic field, the grain experiences simultaneous Larmor precession and radiative precession. If the Larmor precession is faster than the radiative precession, i.e., τB < τk, the axis of grain alignment by RATs changes from with J along k to the magnetic field, B, which is known as B-RAT. The minimum grain size that grain alignment still occurs via k-RAT, which is also the maximum size grains can be aligned via B-RAT, is defined by τk = τB and is derived in Hoang T. et al. (2022). For grains aligned at a low − J attractor, one has
and
for PM and SPM grains, respectively. The above equations imply that the minimum size for k-RAT when grains aligned at low −J attractors is smaller for higher radiation strength as U−2/3, but larger for stronger magnetic field as B2/3. It is harder to bring SPM grains to align with the radiation direction because of their larger magnetic susceptibility and then faster Larmor precession.
Similarly, for grains aligned at a high − J attractor (Hoang T. et al., 2022)
and
One realizes that the minimum size for k-RAT alignment is very large for typical molecular clouds, especially when grains are aligned at high-J attractors. Therefore, in these conditions, grains are aligned with J along the magnetic field via B-RAT. Yet, for very strong radiation fields of strength of U ≫ 1, small grains at low-J attractors can have k-RAT alignment.
2.6 Radiative torque disruption (RAT-D)
2.6.1 The RAT-D mechanism
A dust grain rotating with an angular velocity Ω develops a tensile stress S = ρΩ2a2/4 on grain material. This stress points outward from the grain center of mass and tends to tear the grain apart. When the tensile stress exceeds the maximum tensile strength of the grain material, Smax, the grain is instantaneously disrupted in fragments. The maximum angular velocity beyond which the grain is disrupted is defined by S = Smax and reads
where Smax,7 = Smax/(107 erg cm−3). The exact value of Smax depends on the grain internal structure (see Hoang, 2020, and references therein). For example, composite grains have Smax ∼ 107 erg cm−3, whereas compact grains have a higher value.
Subject to a strong radiation field, dust grains will be spontaneously fragmented into many smaller species when the grain angular velocity spun-up by RATs, ΩRAT, exceeds the critical value Ωdisr. This is called the radiative torque disruption (RAT-D) mechanism, which was first introduced in Hoang et al. (2019). Due to the dependence of ΩRAT on the grain size and local conditions, there is a range of grain sizes that can be disrupted, as illustrated by the shaded areas in Figure 3. The minimum size of grains that can be disrupted by RAT-D is
and the maximum size of grains that can still be disrupted by RAT-D is as follows:
which depend on the local gas properties, radiation field, and the grain tensile strength (Hoang and Tram, 2020; Hoang et al., 2021b).
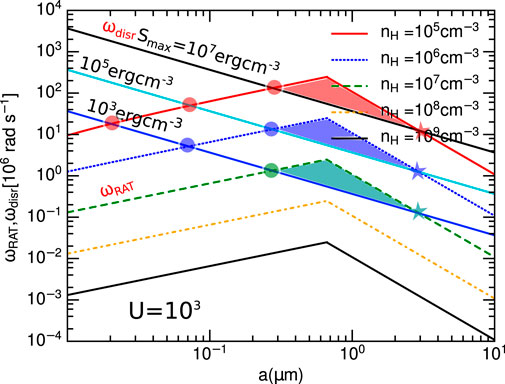
FIGURE 3. Illustration of the rotation rate by RATs and disruption limit for different tensile strength. The lower and upper intersections define the lower and upper disruption sizes. Figure adopted from Hoang (2020).
As shown, the RAT-D efficiency, described by the values of adisr and adisr, max, strongly depends on the local conditions, i.e., more efficient for higher radiation strength (U) or Td, but less efficient for higher nH.
2.6.2 Rotational desorption of ice mantles
Detection of interstellar complex organic molecules (COMs) are extensively reported toward low-/high-mass protostars and protoplanetary disks (see e.g., van Dishoeck, 2014, and references therein). As a popular scenario, COMs are believed to first form on the icy mantle of dust grains (e.g., Garrod et al., 2008; Jiménez-Serra et al., 2016), and subsequently desorbed to the gas phase during the warm and hot phase, where icy grain mantles can be heated to high temperatures Td ∼ 100 − −300 K (see e.g., Blake et al., 1987; Brown et al., 1988; Bisschop et al., 2007). However, icy mantles might not be survived under an intense radiation field before the critical temperature for thermal sublimation is reached (Hoang and Tram, 2020). The centrifugal force can break the icy mantel from the bare core, then the evaporation and sublimation processes are enhanced owing to smaller size of the icy fragments, enabling COMs to release (see Figure 4A). This non-thermal process is called the rotational desorption, and found to be effective at lower dust temperatures than the classical thermal sublimation, which is able to explain the detection of COMs in cold regions (see Hoang and Tram, 2020; Tram et al., 2021c for further details).
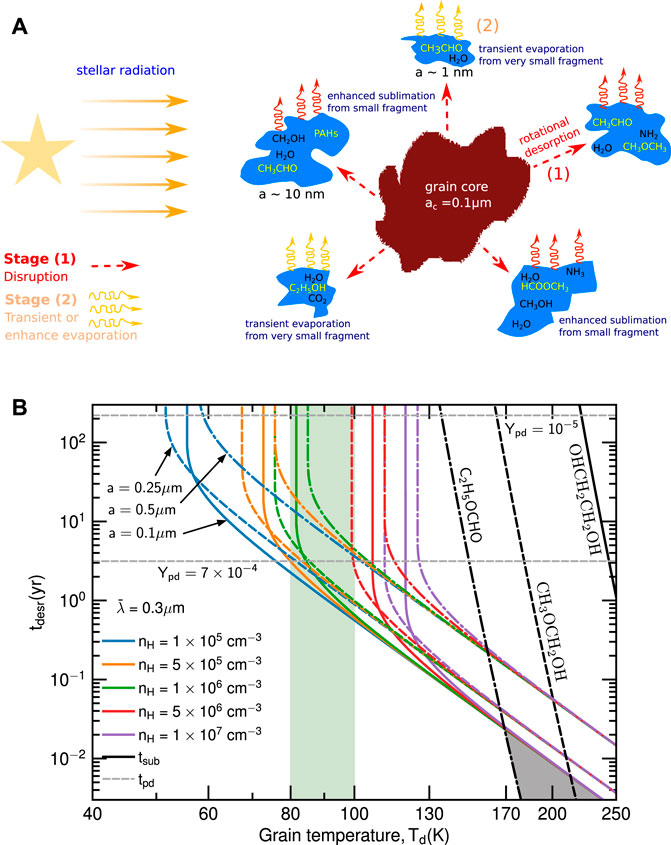
FIGURE 4. (A)Illustration of the rotational desorption process (figure adopted from Hoang and Tram, 2020). There are two stages: (1) disruption of icy mantles into small fragments by the RAT-D mechanism and (2) rapid evaporation due to thermal spikes for very small fragments or increased sublimation for larger fragments. The rotational desorption is thus able to desorb complex organic molecules (COMs) formed on the icy mantle. (B) Desorption timescales of some COMs having very high binding energy in Orion BN/KL (Figure adopted from Tram et al., 2021c). The rotational desorption and sublimation are shown by the colored and black lines, whereas the UV photo-desorption is displayed by the gray dashed lines. The rotational desorption is effective for Td ≃ 80 − 100 K at which these COMs are detected (cyan area). The gray area is where the sublimation is dominant.
Figure 4B shows an evidence for rotation desorption of COMs from Orion BN/KL region. The timescales of rotational desorption (color lines) and thermal sublimation (dashed dotted black lines) for three COMs with very high binding energy, including ethyl formate (C2H5OCHO), methoxymethanol (CH3OCH2OH) and ethylene glycol (OHCH2CH2OH) that are reported in Tercero et al. (2018), are shown for comparison. One can see that for given low dust temperatures constrained by SOFIA/FORCAST observations (Td ≃ 80–100 K; De Buizer et al., 2012), rotational desorption is more effective than thermal sublimation in desorbing COMs from the grain surface. With regard to the UV photo-desorption (dashed horizontal lines), the rotational desorption could be as efficient as (or more effective than) the UV photo-desorption regarding to the photo-desorption yield uncertainty. However, UV photons are expected to be quickly attenuated by dust absorption, so that the volume in which photo-desorption is important is less extended than the rotational desorption which can work with optical-IR photons.
2.7 Summary of grain alignment and disruption in molecular clouds
In this section, we discuss the alignment of magnetic grains in a typical molecular cloud, which is irradiated by an ionization source (e.g., OB stars). We adopted the following representative parameters: nH = 103 cm−3, Tgas = Td = 30 K,
Figure 5A illustrates the relative importance of different alignment mechanisms. For the internal alignment, most grains are aligned with the angular momentum parallel to the short axis (i.e., J‖a1). The paramagnetic relaxation is much less efficient than the Larmor precession. Grains can be aligned by RATs along B-fields (B-RAT) up to sizes of 1.1 μm. Above that size, the radiative precession is faster than the Larmor precession such that grains are turned to align with the radiation direction (k-RAT). Hence, B-RAT is the most important alignment mechanism in the diffuse ISM and typical molecular clouds where dust grains could not grow to beyond 1 μm. Furthermore, if the grain’s structure is not very compact (e.g., with a low tensile strength of Smax = 108 erg cm−3), the RAT-D mechanism can disrupt large grains with size of 0.1–7.5 μm. The rotational fragmentation enhances the abundance of smaller grains, which, in turn, can allow more grains to align with the magnetic field.
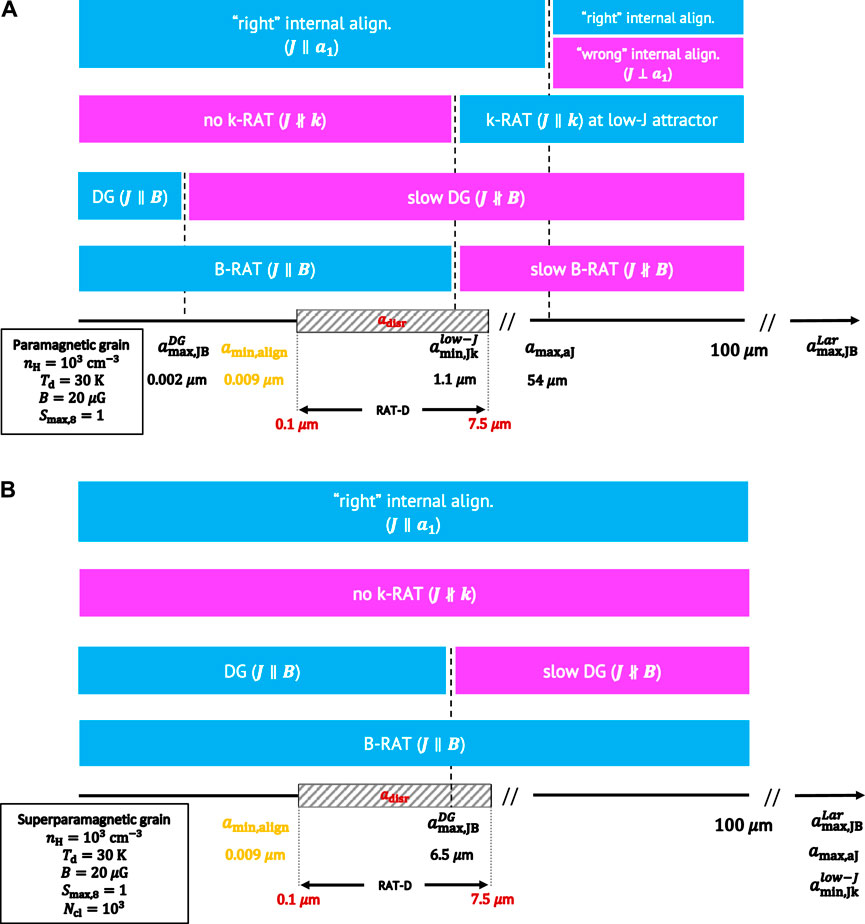
FIGURE 5. (A) Alignment of paramagnetic grains for a typical molecular cloud in proximity to an ionization source with γ = 1 and
Similarly, Figure 5B shows alignment for superparamagnetic grains with Ncl = 103 and ϕsp = 0.01. Due to the enhancement of susceptibility, all superparamagnetic grains are aligned with J‖a1 for the internal alignment. For the external alignment, B-RAT alignment is dominant over k-RAT. Even the DG mechanism is more effective for larger grains up to 6.5 μm compared to ordinary paramagnetic grains, yet the B-RAT is much more efficient than the superparamagnetic relaxation. Thus, superparamagnetic grains are precessed along the external magnetic fields.
Therefore, grain alignment is able to probe the magnetic field in typical molecular clouds. However, as shown in this section, the gas damping, the B-field strength and the radiation strength are as key to characterize which alignments take place. Hence, all of alignment sizes are subjected to change with the local conditions, and the picture of grain alignment become very complicated in very dense regions, such as protostellar cores/disks (see Section 5.2).
3 Modeling thermal dust polarization within the RAT paradigm
Polarized thermal dust emission depends on the grain properties (size, shape, and composition), grain alignment degree, and the magnetic field geometry (see e.g., Draine and Fraisse, 2009). Within the RAT paradigm, RATs can induce the simultaneous effects of RAT-A and RAT-D on dust grains. The RAT-A describes the alignment degree of grains of different sizes with the magnetic field, whereas RAT-D affects the grain size distribution. Therefore, an accurate physical model of polarized thermal dust emission requires the treatment of both RAT-A and RAT-D effects.
3.1 Assumptions and basic equations
To account for both the RAT-A and RAT-D effects on dust polarization, Lee et al. (2020) adopted a simple cloud model4 consisting of a homogeneous molecular cloud irradiated by a central radiation source, as illustrated in Figure 6A. The radiation strength (U) decreases with distance from the central star and varies along the line of sight (solid and dashed lines). For simplicity, all grains along each line of sight in the cloud are assumed to be illuminated by the constant radiation field of strength U.
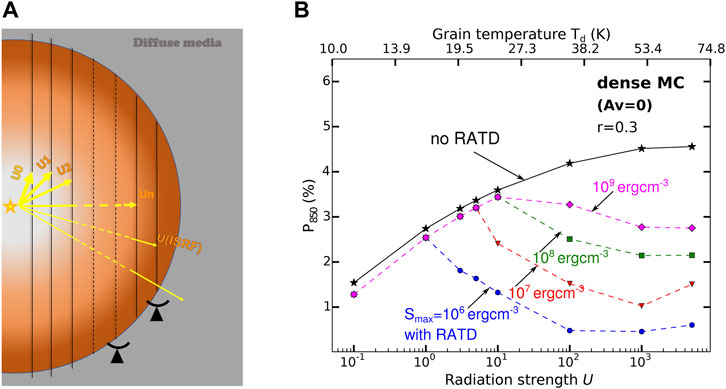
FIGURE 6. (A) Schematic illustration of the model. A molecular cloud is irradiated by the central star, so that the radiation strength decreases from U0 to UISRF. The color gradient indicates the increase of the gas density from the central star. Magnetic fields are assumed to be uniform. (B) An example of polarization degree vs. radiation strength (dust temperature) at 850 μm predicted by the numerical model (Lee et al., 2020). If we consider only the RAT-A effect, the polarization degree monotonically increases with increasing the radiation strength (dust temperature) as expected (black line). If we take into account the RAT-D mechanism, rotational disruption occurs when the radiation strength (dust temperature) is sufficiently high. Once this happens, the depletion of largest grains results in the decrease of the polarization degree (color lines). Figure taken from Lee et al. (2020) and Tram et al. (2021a).
As shown in Section 2.4 (also Section 2.7), both Barnett and inelastic relaxation effects are very efficient for standard grains in the ISM and MCs, leading to the perfect internal alignment of dust grains (see Figure 5). Therefore, grain alignment is mostly determined by external alignment by RATs. For the rotational damping, we consider only collisions with gas and re-emission of thermal dust as two main sources to damp the grain rotation against the spin-up by RATs. The variation of B-fields along the line of sight is neglected by assuming the uniform magnetic field (the field tangling effect is discussed in Section 4.5). The detailed description of this model was presented in Lee et al. (2020) and Tram et al. (2021a).
Dust grains are heated by absorption of the stellar radiation and cool down by re-emission in infrared radiation. Assuming a dust environment containing carbonaceous and silicate grains, the total dust emission intensity is given by
where amin and amax are the minimum and maximum grain sizes, NH is the hydrogen column density, Bλ(Td) is the Planck function at dust temperature Td, dP/dT is the grain temperature distribution function, dnj/da is the grain-size distribution of dust population j, and Qext is the extinction coefficient. The dust temperature distribution depends on the grain size, optical constant, and the radiation field (U), which is computed by the DustEM code (Compiègne et al., 2011, see e.g., Figure 8 in Lee et al., 2020).
If silicate and carbon dust populations are separated, then as paramagnetic grains, silicates can align with the ambient magnetic field, whereas carbonaceous grains cannot. Thus, the polarized emission intensity resulting from aligned grains is given by (Hoang and Lazarian, 2016a)
where
If silicate and carbon grains are mixed together (e.g., Jones et al., 2013; Draine and Hensley, 2021), which may be the case in dense clouds due to many cycles of photo-processing, coagulation, shattering, accretion, and erosion, carbon grains could be aligned with the ambient magnetic field and their thermal emission could be polarized. In the simplest case, assuming these grain populations have the same alignment parameters (i.e., aalign and f(a)), the total polarized intensity is as follows:
The extinction (Qext) and polarization coefficients (Qpol) are computed by the DDSCAT model (Draine and Flatau, 1994, 2008; Flatau and Draine, 2012). The maximum grain size is constrained by the RAT-D mechanism, amax ≡ adisr.
The fractional polarization of the thermal dust emission is the ratio of the polarized intensity (Ipol) to the total emission intensity (Iem), which yields the following:
3.2 Model parameters and numerical prediction
Our model parameters include the gas properties (gas number density, nH) and gas temperature, Tgas), the dust properties (size a, shape, internal structure described by the tensile strength Smax, and size distribution power index β), and the ambient properties (radiation field strength U, mean wavelength
Radiation strength cannot be constrained from observations, thus, the equilibrium temperature of dust grains is used as a proxy of the radiation strength, as
Figure 6B shows the predicted dependence of the polarization degree on radiation strength (or dust temperature) at a specific wavelength of 850 μm for nH = 104 cm−3. In the case of only RAT-A effect (black line), the polarization degree increases as radiation strength (dust temperature) increases. In the case of both RAT-A and RAT-D effects, the polarization degree first increases and turns to decrease toward higher dust temperature. The second trend is caused by the rotational disruption which occurs above a critical temperature. For dust temperatures lower than the critical temperature, RATs are not enough to spin-up grains to the disruption limit Ωdisr, so that the RAT-D cannot occur. Thus, the results are the same as in the case of only RAT-A effect. For dust temperatures higher than the critical value, RATs become stronger to trigger the RAT-D effect, resulting in rotational disruption of large grains into small fragments. This leads to a drop in the polarization degree due to the depletion of large grains. This critical temperature and the level of the decline depend on the internal structure of the grains controlled by Smax.
Figure 7 shows our understanding of the trend of polarization degree versus radiation strength/dust temperature shown in Figure 6B. For a given gas density, the polarization degree is mainly determined by the grain size distribution. If the only RAT-A effect is considered, the maximum grain size is fixed. The minimum size that is aligned by RATs is smaller for higher radiation strength (more small grains are able to be aligned). Hence, the size distribution of aligned grains becomes broader, which deduces the increment of the polarization degree. If the rotational disruption is taken into account along with the RAT-A effect, the maximum grain size could vary. In this case, if the radiation is insufficient strong the polarization degree is observed to increase with radiation strength as previous case. Once the radiation strength is sufficient to trigger disruption, the maximum grain size reduces from amax to adisr. The narrower size distribution of aligned grains causes the polarization degree to drop.
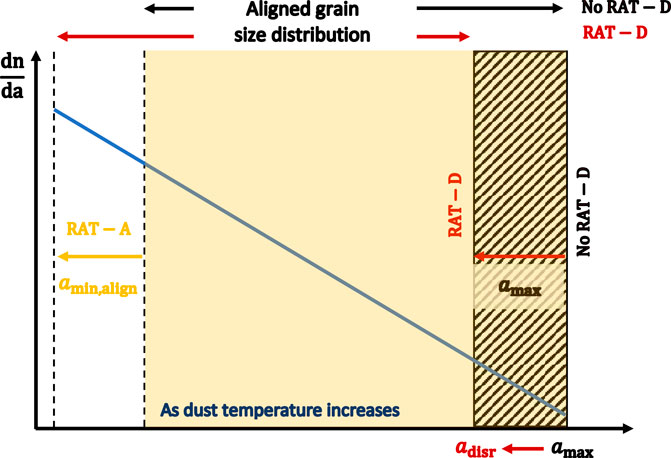
FIGURE 7. Understanding of thermal dust polarization. For a fixed maximum grain size (amax), higher radiation strength/dust temperature can bring smaller grains to align (smaller size of amin,align) so that the aligned grain size distribution becomes broader. This broad size distribution increases the degree of thermal dust polarization with radiation strength/dust temperature. If the maximum grain size is determined by the RAT-D mechanism and grains are composite (amax → adisr), higher radiation/dust temperature results in smaller adisr. The consequent narrower aligned grain size distribution drops the polarization degree.
As we mentioned, radiation strength is not an observable quantity, thus dust temperature could be used as a proxy. Therefore, the relation between polarization degree and dust temperature (p − Td) becomes a unique tool to study the joint effect of grain alignment and disruption by RATs.
4 Observational study of the RAT effects in star-forming regions
In this section, we review our observational results of thermal dust polarization observed toward star-forming molecular clouds, including ρ Ophiuchus-A, 30 Doradus, M 17, and Orion BN/KL. These star-forming MCs containing intense radiation sources are the ideal targets to test the RAT-A and RAT-D effects.
4.1 ρ Ophiuchus-A
ρ Ophiuchus-A (ρ Oph-A) is a molecular cloud in one of the closest dark cloud complex and star-forming region ρ Ophiuchi. The distance to this complex is reported to be ∼ 120–160 pc (Chini, 1981; de Geus et al., 1989; Ortiz-León et al., 2017). This cloud is irradiated by a high-mass star, namely Oph-S1, which is a young B3-type star (Vrba 1977; Hamaguchi et al., 2003).
Figure 8 shows the observational data of ρ Oph-A. The top panels show the maps of gas column density (panel (a)) and dust temperature (panel (b)) constructed from Herschel. Along the radial direction toward Oph-S1 (marked by the white star), the dust is hotter while the gas is more diffuse. The middle and bottom panels show the p − Td relations. Background shows the observational data at 89 (left) and 154 μm (right) observed by SOFIA/HAWC+. The polarization degree tends to first increase and then decrease as the dust temperature increases. One can see that the latter decrement occurs in vicinity of Oph-S1 where the gas density is lower. Therefore, the drop of p toward higher Td and lower nH is opposite to the fundamental prediction of the RAT-A effect.
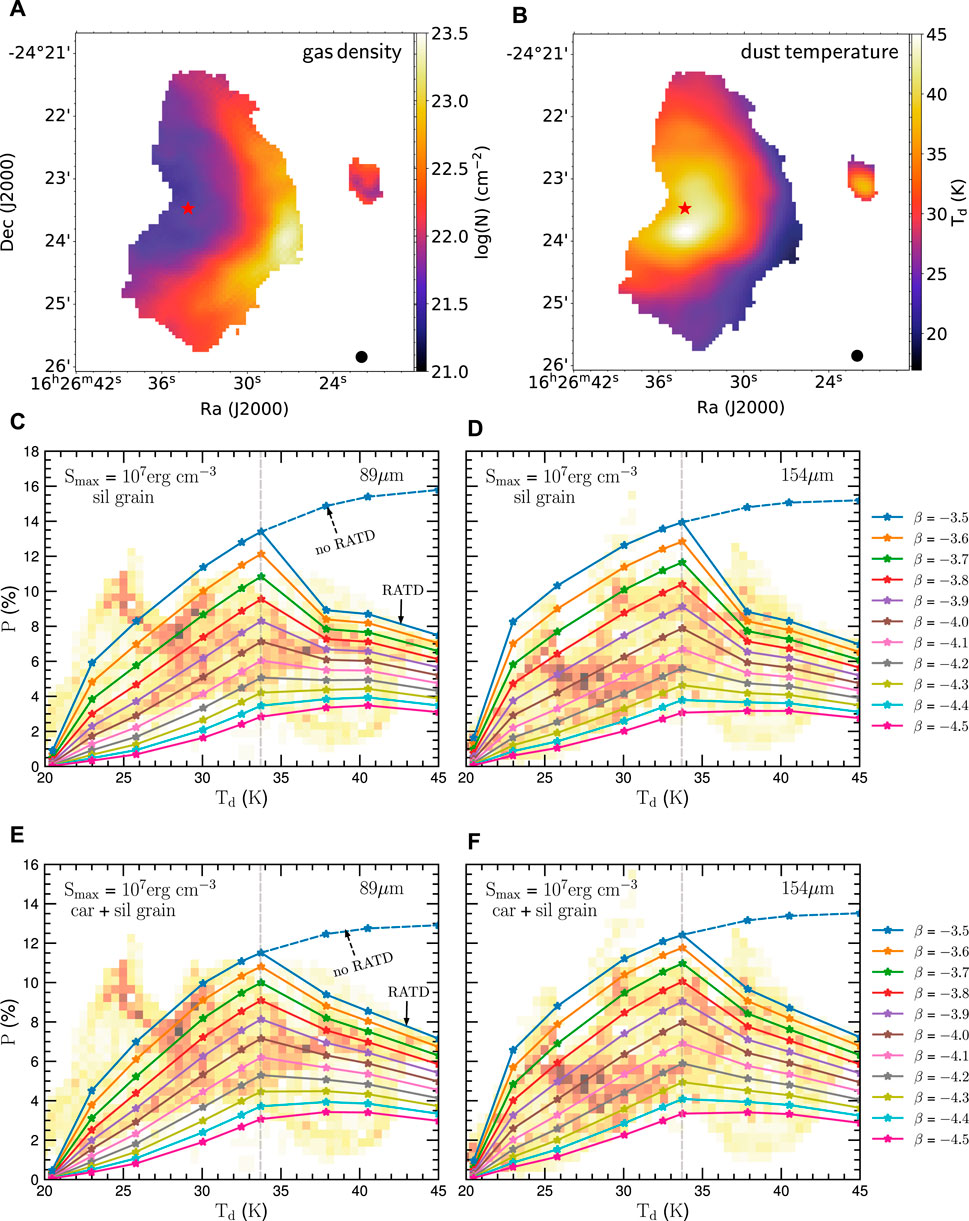
FIGURE 8. Top: gas column density (A) and dust temperature (B) constructed from Herschel data (figure adopted from Santos et al., 2019 and Tram et al., 2021a). A star symbol locates the radiation source Oph-S1. Close to this source, dust is hotter while gas is more diffuse. Middle: 2D-histogram of polarization degree observed with SOFIA/HAWC + at 89 μm (C) and 154 μm (D) and dust temperature (background). A dashed line is the prediction by only the RAT-A effect, which could not explain the decrease of p for Td > 34 K. The solid lines are the predictions made by both the RAT-A and RAT-D effects for only silicate grains with the grain-size distribution of dn/da ∼ aβ. Bottom: Similar to the middle panel but for and a mixture of silicate-carbonaceous grains at 89μm (E) and 154μm (F). The RAT paradigm (RAT-A and RAT-D) successfully reproduces both the increase and decrease part of the data. Figures adopted from Tram et al. (2021a).
The lines in Figure 8 show the results from our numerical modeling overplotted with the observational data at two wavelengths, assuming only silicate (panels (c,d)) or a combination of silicate and carbonaceous grains (panels (e,f)) with different slopes (β) of the size distribution. We considered two cases: only the RAT-A effect (no RAT-D, dashed line) and both RAT-A and RAT-D effects (solid lines).
• For the former case, the polarization degree monotonically increases with the dust temperature. This rising p − Td trend is caused by the increase in the alignment efficiency (i.e., decrease in the alignment size aalign) toward the Oph-S1 due to stronger radiation intensity and lower gas density. Obviously, the RAT-A effect is able to reproduce the first increasing part of the observational data, but not the second decreasing part.
• For the latter case, the polarization degree is similarly expected to increases for Td ≃ 34 K. At higher dust temperatures, the RAT-D happens for grains larger than adisr owing to the higher radiation intensity and the lower gas density, which reduces the polarization degree. The joint effect of RAT-A and RAT-D mechanisms is therefore able to reproduce the entire observational data.
4.2 30 Doradus
30 Doradus (30 Dor), the Tarantula Nebula, is an Hii region located in the Large Magellanic Cloud (LMC) at the distance of
Figure 9A shows the polarization degree map observed with SOFIA/HAWC+ at 214 μm. The location of ionization source R 136 is denoted by a red cross. For comparison, the contours show the map of gas column density. For further analysis, we selected two sub-regions, namely, north and south as highlighted respectively by a red box and a red ellipse. Figures 9B,C show the relation of the gas column density to the dust temperature in these two sub-regions, respectively. In the north, the gas density unambiguously increases and then decreases with increasing dust temperature. The transition is at Td ∼ 37–40 K. In the south, the relation is less clear. Yet, it is likely to behave similarly as in the north, in which the gas density positively correlates with the dust temperature upto Td ∼ 37–39 K, and negatively correlates with higher Td.
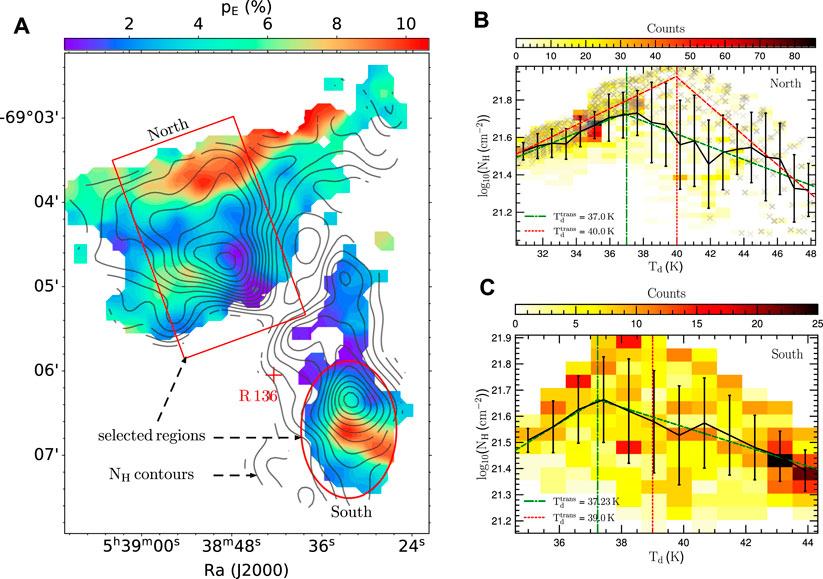
FIGURE 9. (A) SOFIA/HAWC + observations of 30 Dor at 214 μm. Contours are the map of gas column density. The stellar cluster R 136 is located by a red cross. We selected two sub-regions, namely, north and south, to further analysis. (B,C) 2D-histogram of gas column density vs. dust temperature in two selected sub-regions: north and south. The black line shows the weighted mean in each bin associated with 1 − σ uncertainty. The blue line is a double power-law fitting. In the north, we fit to an upper envelope of the distribution by a dashed red line. In the south, the plot is more scatter. However, these quantities are positively correlated upto Td ≃ 37 K and negatively correlated to higher Td. Figure adopted from Tram et al., 2021b.
Figure 10 shows the p − Td relations in the north (left panel) and in the south (right panel) for three SOFIA/HAWC + wavelengths (from top to bottom).
1 In the north, there is a complex relation for all wavelength. Note that Td increases toward R 136.
• For Td ≤ 37 − 40 K (region A), both dust temperature and gas column density increase. The polarization degree first rapidly drops, then rises, and finally slowly changes with increasing dust temperature. This trend could be explained by the RAT-A effect. Increasing gas density causes increased rotational damping by gas collisions, which is sufficiently efficient for larger aalign. As we discussed in Section 3, a higher value of aalign causes p to decrease. At some point in the cloud where Td is sufficient high, the variation of aalign might be small because of opposite effects of Td and NH. That makes p to slowly change.
• For Td > 37 − 40 K, the gas column density decreases, the polarization degree first increases slightly (regions B) and then drops again (region C). The negative slopes are steeper for longer wavelengths, namely −0.52, −0.72 and −0.83 at 89, 154 and 214 μm, respectively. As gas damping become less effective due to lower NH and higher Td, the RAT-A effect could explain the increase in p in region B (i.e., smaller aalign), but fails to explain the drop of p in region C. The latter is evidence for the RAT-D mechanism at work in proximity to radiation source where NH continues to be small while Td is highest. As the largest grains get disrupted, p decreases faster at longer wavelength. Thus, the observed drops of p in region C are expected by RAT-A and RAT-D.
2 In the south, the p − Td relation has a high degree of scatter and is ambiguous. There might be three reasons for the slow variation of p with Td. First, the saturation of RAT-D, which occurs at very high temperatures (i.e., Td is much larger than the disruption threshold temperature; see Figure 14 in Lee et al., 2020). Small grains resulting from the disruption do not experience RAT-D due to lower RATs. Second, when dust grains are very hot, IR damping is so strong and dominates the gas damping, resulting in the slow variation of adisr with Td. Third, effective gas damping due to the high gas density in the selected region (see Figure 9).
FIGURE 10. Relations between polarization degree and dust temperature in three bands (from top to bottom) in north (left panel) and south (right panel) regions highlighted in the left panel of Figure 9. The error bars connected by a line shows the weighted mean in each bin. The black dashed line shows the piecewise line fit to the data. In the north, a complex p − Td relation is found, but p decreases with higher Td. In the south, a weak p − Td relation is seen. Figure adopted from Tram et al., 2021b.
4.3 M17
M17, also known as the Omega Nebula or the Horseshoe Nebula is prominent Hii region with and associated molecular cloud and star-forming region (Povich et al., 2009; Lim et al., 2020). It is located in the constellation of Sagittarius at a distance of 1.98 kpc (Xu et al., 2011). M17 hosts the stellar cluster NGC 6618 and its relative closeness makes it an excellent target to test the RAT paradigm.
Figure 11A shows the SOFIA/HAWC + observations of M17. Generally, the stellar cluster NGC 6618 (the most massive stars in this cluster are indicated by the white star symbols) are responsible for ionizing and creating the Hii region. We divided M17 into two sub-regions, namely M17-N and M17-S. M17-S contains several compact sources as marked by white crosses. Figures 11B,C respectively show the relation between gas column density and dust temperature, and the relation of polarization degree with dust temperature. Lower density gas is associated with higher dust temperature.
• In M17-S, where the density is relatively high, and the dust temperature is relatively low, the observed polarization degree increases with increasing dust temperature. In this condition of high gas density and low temperatures, gas damping is more efficient so that RAT-D cannot occur. Therefore, the increase of p − Td is consistent with the prediction of the RAT-A effect.
• In M17-N, where the gas density is rather low and the dust temperature is relatively high (Td ≥ 60 K), the observed polarization tends to decrease with Td. In this condition of lower densities and high temperatures, RAT-D can easily occur due to weak gas damping and strong RATs. As a result, the decrease in p with increasing Td is consistent with the joint effect of RAT-A and RAT-D.
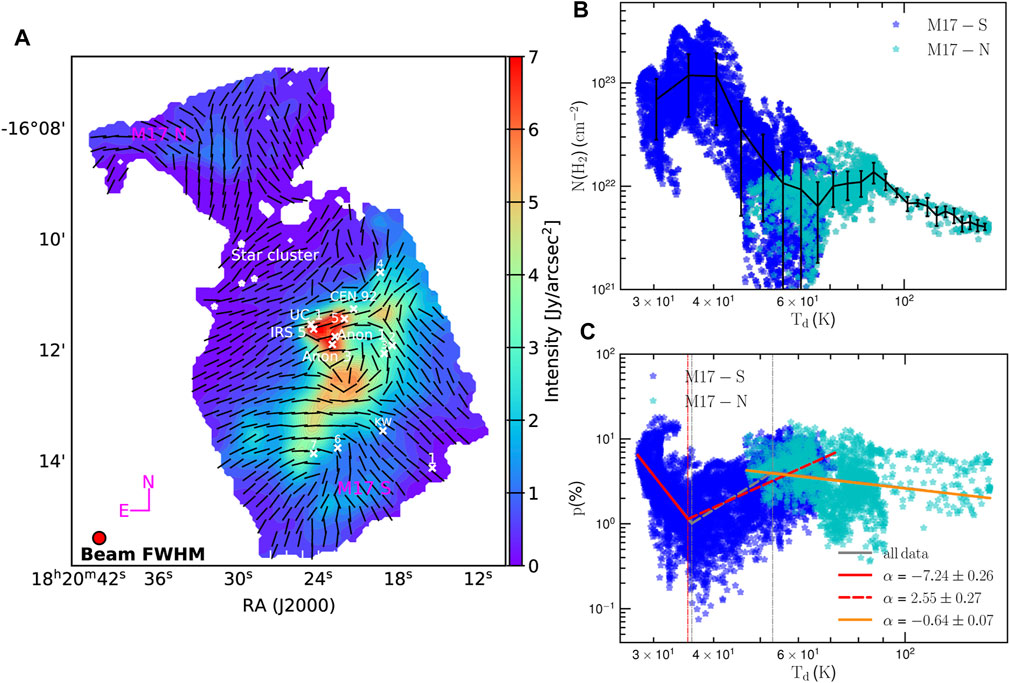
FIGURE 11. (A) SOFIA/HAWC + observations of M17. The color background shows the total continuum intensity (Stokes-I). The black vectors represent the magnetic field morphology. We divided M17 into two sub-regions: M17-N and M17-S. In the M17-S region, IR sources are denoted by the white crosses and numbered. The star cluster NGC 6618 is represented by star symbols. (B) The relation of gas column density vs. dust temperature in the two sub-regions. (C) The relation of polarization degree vs. dust temperature. Error bars connected by a line shows the weighted mean in each bin and illustrates that the lower density gas has a higher dust temperature. Color lines are the fitting to all data point (the grey line), to only M17-S (the red line), and to only M17-N (the orange line). The polarization increases with increasing dust temperature in M17-S, whereas it drops to higher Td and lower N(H2) in M17-N. Figure adopted from Hoang T. D. et al. (2022).
4.4 OMC-1 or Orion BN/KL
At a distance of ≃ 400pc (Menten et al., 2007; Kounkel et al., 2017), the Orion nebula is the closest and the most extensive studied region of massive star-forming region. Due to its proximity, the arcsecond resolution observations of polarized thermal dust that have been carried out sample scales of a few thousand AU (Pattle et al., 2017; Chuss et al., 2019; Ajeddig et al., 2022). These observations have provided a wealth of information of dust physics in the different physical environments of the Orion region. Here we focus on only OMC-1 region. This region can be divided into: 1) the Becklin–Neugebauer–Kleinmann–Low Nebula (BN/KL; Becklin and Neugebauer, 1967; Kleinmann and Low, 1967) which hosts on-going star formation; 2) the Southern clump (OMC-S; Batria et al., 1983) that is quiescent. These sub-regions are labeled in Figure 12A. We concentrated on the variation of the polarization degree along the main filament in Orion, in which we selected one more sub-region (OMC-N) north of BN/KL.
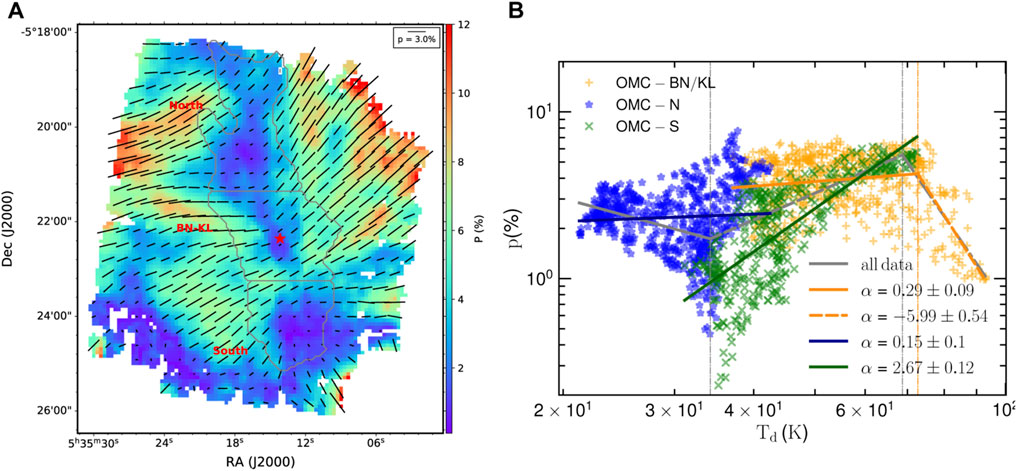
FIGURE 12. (A) SOFIA/HAWC + observations of OMC-1 at 214 μm. The background color is polarization degree. The black vectors illustrate the B-field morphology inferred from thermal dust polarization (Ngoc et al. in preparation). Three sub-regions, namely, BN-KL, north, and south are selected for further analysis. (B) The relation of polarization degree at 214 μm to dust temperature at three sub-regions in OMC-1 (Ngoc et al. in preparation). In OMC-N and OMC-S, p is seen to monotonically increases with Td. The increment in the first sub-region is faster than the latter one. It differs from OMC-BN/KL, for which p slightly increases before deeply decreasing to higher Td.
Figure 12B shows the variation of the polarization degree with the dust temperature for these three sub-regions. In two quiescent OMC-N and OMC-S, p increases with increasing Td, which is predicted by the RAT-A effect. Since Td is higher in OMC-S, the grain alignment is more efficient resulting in more significant increment in this region compared to OMC-N, which is understandable in the RAT-A framework. However, the p − Td relation in OMC-BN/KL is different from other regions. The polarization degree slightly increases and then decreases for Td ≥ 70 K. At such high Td, the rotational disruption is effective, leading to the decline of p. The RAT paradigm is therefore able to reproduce the p − Td relations in these three regions of OMC-1.
4.5 Can the anti-correlation of p vs. Td arise from B-field tangling?
We showed that the anti-correlation of p vs. Td is produced by RAT-D mechanism, assuming uniform magnetic fields. This disregard of the magnetic field tangling on variation of p could lead to biased conclusions. To check whether or not the field tangling could cause the decrease of p, we analyze the variation of the polarization angle dispersion function S as a function of Td. The biased dispersion at position r on the sight-line is given as follows:
where ψ(r) and ψ(r + δ) are the polarization angles at position r and r + δ, respectively. In practice, for a given position r we select all data points (N) within a circular aperture centered at this position with a diameter of two beam sizes.
Then the unbiased dispersion function is as follows:
whose an associated error is (see Eq. 8 in Planck Collaboration et al., 2020)
with σ(r) and σ(r + δ) the errors of polarization angle at the position r and r + δ.
Figure 13 shows the variation of the dispersion angle S with Td in 30 Dor (panel (a)) and in M17 (panel (b)). For 30 Dor, S is poorly correlated with Td, indicating that the field tangling could not be the main explanation for the anti-correlation of p vs. Td as shown in Figure 10. In the case of M17, S slowly varies for Td > 90 K. Similarly, the variation of the magnetic field ambiguously results in the p − Td relation in Figure 11). Via these two examples, one can see that the disruption of large grains in the vicinity of an intense radiation source is the major responsible for the decrease in p, instead of owing to the loss of alignment efficiency by gas collision and magnetic field tangling.
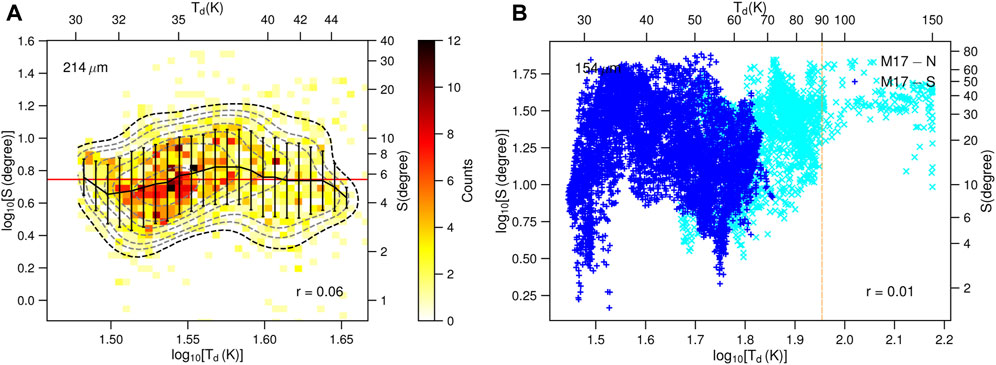
FIGURE 13. (A) 2D-histogram of S and Td in 30 Dor at 214 μm (figure adopted from Tram et al. in prep.). They have a loose relation with a correlation coefficient of r = 0.06. Thus, the variation of magnetic field could not be a main reason for a decrease in p with Td > 43 K, as shown in Figure 10. (B) Scatter plot of S vs. Td for M17 at 154 μm (figure adopted from Hoang T. D. et al., 2022) with a correlation coefficient of r = 0.01. In particular, S is weakly correlated with Td > 90 K (dashed vertical line) in M17-N and could not explain the drop of p for such high Td, as shown in Figure 11.
5 Discussion
5.1 Dust polarization as a reliable tracer of magnetic fields in star-forming regions
Magnetic fields are thought to play an important role in the evolution of the ISM and star formation. However, measurement of interstellar magnetic fields is rather difficult. One of the leading applications of dust polarization is tracing magnetic fields. Thus, the question of to what extent dust polarization can reliably trace the magnetic field is crucially important.
As reviewed in Section 2, grain alignment in the ISM and MCs is dominated by the RAT mechanism. The (super)paramagnetic material (e.g., silicate grains) is magnetized through the Barnett effect, which causes the grain to have rapid Larmor precession around the magnetic field. Moreover, Barnett and inelastic relaxation effects induce efficient internal alignment of grain shortest axis with the angular momentum. The external alignment of the grain angular momentum along the ambient magnetic fields is dominated by B− RAT alignment because the Larmor precession is much faster than the gas randomization as well as the radiative precession. Thus, grains are aligned with their longest axes perpendicular to the magnetic field. The polarization orientation of thermal dust emission is perpendicular to, whereas the polarization of starlight by dust extinction is parallel to the local magnetic field. As a result, dust polarization is a reliable tracer of magnetic fields in the diffuse ISM to molecular clouds to star-forming regions.
Dust polarization has been used widely to measure magnetic fields in star-forming regions when combined with DCF method. This enables us to quantify the role of magnetic fields in the star formation process (see Pattle and Fissel, 2019 for a recent review). Here, we discuss our recent study using dust polarization to measure magnetic fields in two star-forming regions discussed in Section 4 with SOFIA/HAWC+.
a) Mean magnetic field strength in M17
Knowing the variation of the magnetic fields (i.e., characterized by the polarization angle θ) induced by magnetically aligned dust grains, we can estimate the field strength using the DCF method as follows:
where fDCF is a factor adjusting for line-of-sight and beam-integration effects, ρ is the gas mass density, δv is the dispersion in velocity of non-thermal gas, and δθ is the one for polarization angle. The dispersion of non-thermal gas is derived from spectral lines of gas tracer, whereas we followed an modification made by Hildebrand et al. (2009) and Houde et al. (2009) that one replaces
b) Variation of magnetic field strength in 30 Dor
The DCF method expressed in Eq. 49 can be used to make maps of magnetic field strength (see Guerra et al., 2021). The maps of ρ, δv and Dθ are naturally required. The map of ρ is due to the width of cloud, which could be determined by the half-width at half-maximum of the polarized flux autocorrelation function (see e.g., Figure 1 in Houde et al., 2009). The map of δv is done by using a position-position-velocity datacube, whereas that of Dθ is acquired within a circular kernel of radius w (see Section 3.2 in Guerra et al., 2021 for a critical selection of a best kernel size.
Figure 14 shows the case of 30 Dor as an example. The magnetic field morphology (stream lines) is inferred from SOFIA/HAWC + observations (Tram et al., 2021b, 2022), which illustrates a complex but ordered structure. We constructed a map of the magnetic strength using the DCF method (panel (a)), and found a quite strong field with a maximum of few hundred micro-Gauss. Consequently, most of the material associated with 30 Dor is 1) sub-critical (i.e., λ < 1, panel (b)), meaning that the magnetic field is stronger than gravity; and 2) sub-Alfvénic (i.e,
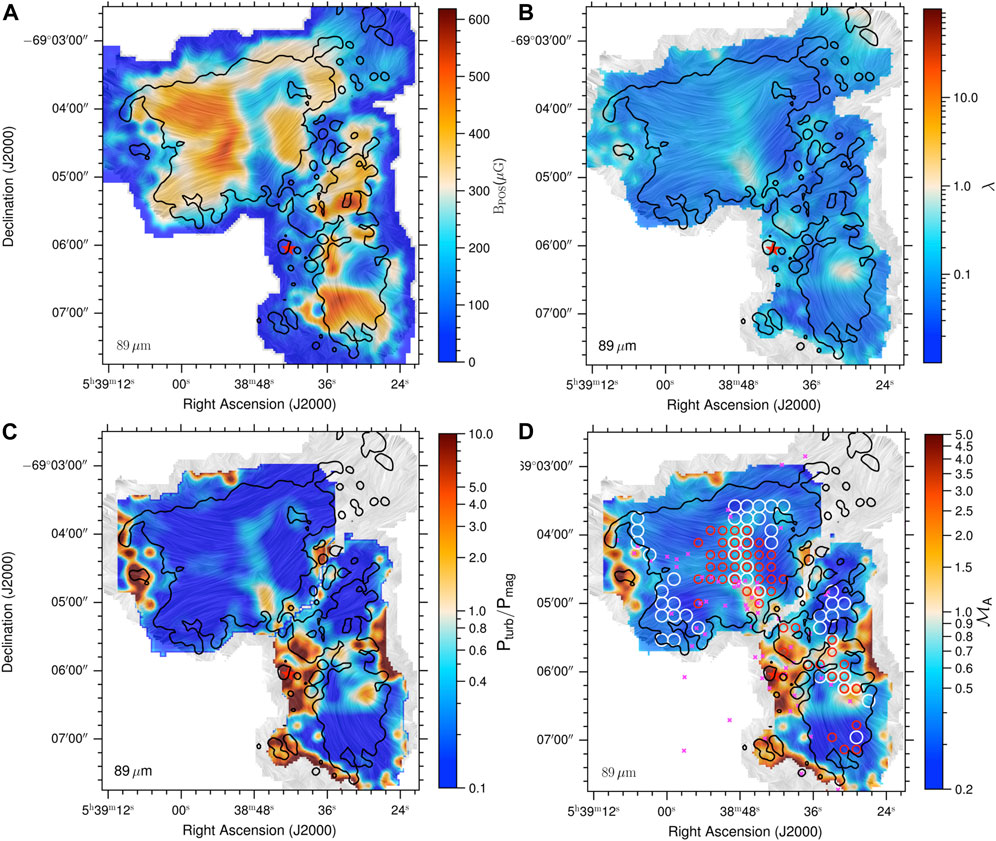
FIGURE 14. Maps of magnetic strength (A), of mass-to-flux ratio (B), of turbulence-to-magnetic pressure (C), and of Alfvénic Mach number (D) in 30 Dor (figure adopted from Tram et al., 2022). Stream lines are the magnetic field morphology inferred from thermal dust polarization. Star symbol locates the massive stellar cluster R 136. Black contours enclose the area where we trust the data. Circles indicate where the gas velocity gradient parallels to the field lines (red for CII and white for CO), whereas gas velocity gradient perpendiculars to the field lines. Magenta crosses are the YSOs candidates.1
5.2 Can thermal dust polarization trace magnetic fields in protostellar/protoplanetary disks?
In very dense regions such as protostellar cores and disks, the process of grain alignment is far more complicated than in molecular clouds, as studied in detail in Hoang T. et al. (2022). A detailed modeling of grain alignment in a protoplanetary disk by Tazaki et al. (2017) shows that very large grains tend to align along the radiation direction (k-RAT) instead of the magnetic field (B-RAT). As pointed out in Hoang T. et al. (2022) their study, however, evaluated the radiative precession rate for grains at low −J attractors, which overestimates the efficiency of k-RAT. They assumed that all grains have right internal alignment. This assumption is likely too simplistic knowing that grain alignment can be very complicated due to a complexity of gas density. Therefore, understanding both internal and external alignments of grains becomes the key to interpret dust polarization in protostellar environments (Hoang T. et al. 2022).
(Sub)millimeter polarization oberservations of protostars (e.g., Zhang et al., 2014; Cox et al., 2018; Sadavoy et al., 2019) showed that the pattern of thermal dust polarization is complicated and diverse. Thus, we need to establish a robust understanding of grain alignment in dense regions in order to interpret observations in a reliable way (whether or not the observed patterns actually trace magnetic fields). Detailed theoretical studies (Hoang T. et al., 2022) and numerical modeling (Giang et al. in preparation) indicate that thermal dust polarization does not always trace magnetic fields under such conditions. A diversity of polarization patterns can be the result of multiple alignment mechanisms, and inferring the magnetic field from rotating polarization vectors might lead to inaccurate conclusions (Hoang T. et al., 2022).
5.3 Polarization hole within the RAT paradigm
In this section, we review the polarization hole effect that is frequently reported in starless cores and protostars (e.g.,Alves et al., 2014; Hull et al., 2014; Jones et al., 2015; Cox et al., 2018; Pattle and Fissel, 2019) in the context of the RAT paradigm. As shown in Section 3, the alignment size aalign and maximum size amax are keys in determining the polarization degree of thermal dust emission. These sizes are, in turn, determined by the properties of radiation field and of environment (gas temperature and gas density). In the following we consider sources with different physical conditions, including starless cores and protostellar cores.
For simplicity’s sake, we also assume all grains have efficient internal alignment. Note that grain alignment under such conditions is much more complicated due to the complex gas density profile and interplay between different alignment mechanisms as discussed in Section 5.2.
Figure 15A shows the expected polarization degree versus the visual extinction from the cloud surface of a starless core (blue lines) and a protostellar core (orange line) within the RAT paradigm.
• For a starless core (a cloud is illuminated by the interstellar radiation field (ISRF) and has no embedded sources), grain alignment is controlled by this external field. The grain alignment becomes less efficient deeper inside the cloud due to the attenuation of the ISRF and increase of gas damping. The polarization degree gradually decreases with AV. Once the minimum aligned grain size is larger than the maximum grain size (aalign > amax), all grains completely lost their alignment, resulting at
• For a protostellar core, there is an internal radiation source located at within of the cloud, in addition to the external interstellar radiation field. The polarization degree similarly gradually decreases as
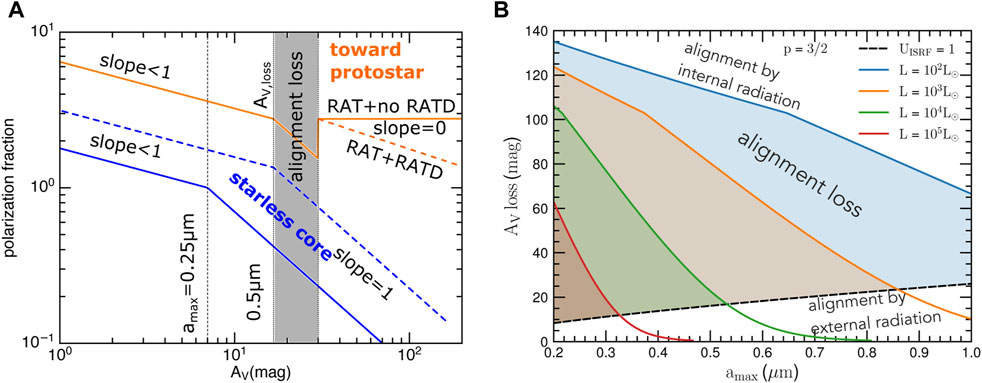
FIGURE 15. (A) Variation of the polarization fraction (arbitrary unit) with the visual extinction expected from the RAT paradigm, described by
Figure 15B shows the region from the cloud surface where grains are completely lost their alignment (AV,loss) in the case of a massive protostar. It is determined by both the internal and external radiation fields. For a given maximum grain size, the more luminous source, the narrower Av,loss, because this intense radiation field could align grains loser to the cloud surface by RATs. For a given luminosity, one can expect to have a similar narrower in range of AV,loss for larger grain size, because the RAT alignment efficiency is proportional to grain size as shown in Section 2.3. For a starless core, as mentioned, AV,loss is only dependent on the maximum grain size which implies that the observed polarization hole could help to constrain grain growth in such a condition.
5.4 Effects of RAT-A and RAT-D on grain growth and evolution, and observations
Grain growth is thought to occur in molecular clouds where grain alignment is ubiquitous as revealed by dust polarization. Therefore, the process of grain growth must involve the growth of aligned grains. Hoang (2022) suggested that the alignment of dust grains with ambient magnetic fields has an important effect on grain growth in molecular clouds. Due to grain alignment, the process of grain growth via gas accretion and grain–grain collisions is anisotropic instead of isotropic as induced by Brownian random motions. As a result, large grains grown by gas accretion are expected to have elongation increasing with it radius. Moreover, dust aggregates formed by grain–grain collisions contain binary structures with aligned axes (Hoang, 2022), which is recently reported in primitive interplanetary dust grains (Hu and Winarski, 2021).
On the other hand, the RAT-D induces the change of the grain size distribution, depending on the local radiation field and gas densities (Hoang, 2021b). This disruption affects both the upper cutoff size and the abundance of smaller grains (including nanoparticles), and hence imprints on dust extinction, emission and polarization. The RAT-D effect is also important for grain surface chemistry, including rapid desorption of ice mantles, enhancement of thermal desorption of water and COMs. Therefore, the effect of RAT-A and RAT-D on the grain evolution can be accessible from observations in a large window from optical-UV to infrared to radio wavelengths (see Hoang, 2020 for a review).
5.5 Effects of RAT-A and RAT-D in the era of time-domain astrophysics
Dust grains in the local environment of transient sources (as supernovae, kilonovae, and gamma-ray bursts) can be transiently illuminated by an intense radiation flash from the source and are transiently aligned by RAT with both high −J and low −J attractor (fast RAT alignment). The efficiency of fast RAT alignment and disruption is determined by
Therefore, a fraction
We note that the RAT-A and RAT-D effects also work for dust around other transient sources, including nova, episodic protostars, and AGN, which will be quantified in our future works.
5.6 Mechanical torque (MET) alignment
Lazarian and Hoang (2007b) and Hoang et al. (2018) realized that a gas flow could act to spin-up and align an irregular grain via the so-called mechanical torques (or METs). Instead of the effect of photons, as in the RAT paradigm, METs arises from the scattering of gas atoms by the grain surface that drifts through the ambient gas with the speed vd. The suprathermal number of a grain spun-up by METs is given by (Hoang T. et al., 2022)
where sd = vd/vT with vT the thermal gas velocity (sd,−1 = sd/0.1), and Qspinup,-3 = Qspinup/10–3 is the spin-up efficiency. Here Qspinup = 0 for a spherical grain, whereas Qspinup = 10–6 − 10–3 for irregular shapes (Hoang et al., 2018).
Interestingly, one can realize that StMET is independent to the gas density, and only depends on the grain properties and drift velocity. It differs from the corresponding value for the RATs, which is less efficient in dense gas due to the gas damping. Comparing StMET to StRAT from Section 2.3, we see that METs are more important than RATs for only the very small grains (e.g., a ≤ 0.02 μm for U = 106 and sd = 0.5) and for low density (nH = 103 cm−3). In higher density (nH = 108 cm−3), the effect of RATs is reduced significantly so that METs become dominant mechanism to spin-up grains. Therefore, METs play an important role in dense regions (e.g., protostellar cores or disks) as shown in Hoang T. et al. (2022). Similar to RATs, grains at low −J attractors induced by METs are likely to precess around the gas flow v, the so-called v-MET. Whereas grains at high −J attractors are likely experienced in precessing around B, the so-called B-MET. Therefore, the grain alignment and induced polarization due to METs need to be considered in modeling or simulation for a better interpretation of observations, as well as understanding physical properties of dust grain in such conditions.
Author contributions
TH led the theory part and LT led the observational data analysis part of the manuscript. LT wrote the first draft of the manuscript. TH outlined and revised significantly the manuscript. Both authors contributed to manuscript writing, revision, read, and approved the manuscript.
Funding
TH was funded by the National Research Foundation of Korea (NRF) grant funded by the Korean government (MSIT) (No. 2019R1A2C1087045).
Acknowledgments
We are grateful to the referees for helpful comments that improved our manuscript. We thank Karl Menten and Helmut Wiesemeyer for careful proof reading and comments, Nguyen Chau Giang and Nguyen Thi Phuong for useful suggestions, and Nguyen Bich Ngoc for allowing us to use her preliminary results.
Conflict of interest
The authors declare that the research was conducted in the absence of any commercial or financial relationships that could be construed as a potential conflict of interest.
Publisher’s note
All claims expressed in this article are solely those of the authors and do not necessarily represent those of their affiliated organizations, or those of the publisher, the editors, and the reviewers. Any product that may be evaluated in this article, or claim that may be made by its manufacturer, is not guaranteed or endorsed by the publisher.
Footnotes
1γ = 0 for an isotropic radiation field, and γ = 1 for an unidirectional radiation field. For a typical diffuse interstellar radiation field: γ ≃ 0.1. For molecular cloud: γ ≃ 0.7 (Draine and Weingartner 1996)
2If the radiation source varies in luminosity, the angular velociy ΩRAT is obtained by solving the equation of motion; see Eq. 12 in Hoang et al. (2019).
3The power index η describes the changes in RAT efficiency with respect to grain size; see Figure 1 in Hoang et al. (2021b).
4The state-of-the-art version is publicly available at https://github.com/lengoctram/DustPOL
References
Ajeddig, H., Adam, R., Ade, P., André, P., Artis, E., Aussel, H., et al. (2022). “Probing the role of magnetic fields in star-forming filaments: NIKA2-Pol commissioning results toward OMC-1,” in European Physical Journal Web of Conferences 257, 00002. arXiv:2111.14533. doi:10.1051/epjconf/202225700002
Alves, F. O., Frau, P., Girart, J. M., Franco, G. A. P., Santos, F. P., and Wiesemeyer, H. (2014). On the radiation driven alignment of dust grains: Detection of the polarization hole in a starless core. Astron. Astrophys. 569, L1. doi:10.1051/0004-6361/201424678
Andersson, B. G., Lazarian, A., and Vaillancourt, J. E. (2015). Interstellar dust grain alignment. Annu. Rev. Astron. Astrophys. 53, 501–539. doi:10.1146/annurev-astro-082214-122414
Arzoumanian, D., Furuya, R. S., Hasegawa, T., Tahani, M., Sadavoy, S., Hull, C. L. H., et al. (2021). Dust polarized emission observations of NGC 6334. BISTRO reveals the details of the complex but organized magnetic field structure of the high-mass star-forming hub-filament network. Astron. Astrophys. 647, A78. doi:10.1051/0004-6361/202038624
Barnett, S. J. (1909). On magnetization by angular acceleration. Science 30 (769), 413. doi:10.1126/science.30.769.413
Batria, W., Wilson, T., Bastien, P., and Ruf, K. (1983). Clumping in molecular clouds-the region between omc 1 and 2. Astron. Astrophys. 128, 279–290.
Becklin, E., and Neugebauer, G. (1967). Observations of an infrared star in the orion nebula. Astrophys. J. 147, 799. doi:10.1086/149055
Bisschop, S. E., Jørgensen, J. K., van Dishoeck, E. F., and de Wachter, E. B. M. (2007). Testing grain-surface chemistry in massive hot-core regions. Astron. Astrophys. 465, 913–929. doi:10.1051/0004-6361:20065963
Blake, G. A., Sutton, E. C., Masson, C. R., and Phillips, T. G. (1987). Molecular abundances in OMC-1: The chemical composition of interstellar molecular clouds and the influence of massive star formation. Astrophys. J. 315, 621. doi:10.1086/165165
Borlaff, A. S., Lopez-Rodriguez, E., Beck, R., Stepanov, R., Ntormousi, E., Hughes, A., et al. (2021). Extragalactic magnetism with SOFIA (legacy program). I. The magnetic field in the multiphase interstellar medium of M51. Astrophys. J. 921, 128. doi:10.3847/1538-4357/ac16d7
Brown, P. D., Charnley, S. B., and Millar, T. J. (1988). A model of the chemistry in hot molecular cores. Mon. Not. R. Astron. Soc. 231, 409–417. doi:10.1093/mnras/231.2.409
Chandrasekhar, S., and Fermi, E. (1953). Magnetic fields in spiral arms. Astrophys. J. 118, 113. doi:10.1086/145731
Chini, R. (1981). Multicolour photometry of stars in the Ophiuchus dark cloud region. Astron. Astrophys. 99, 346–350.
Chuss, D. T., Andersson, B. G., Bally, J., Dotson, J. L., Dowell, C. D., Guerra, J. A., et al. (2019). HAWC+/SOFIA multiwavelength polarimetric observations of OMC-1. Astrophys. J. 872, 187. doi:10.3847/1538-4357/aafd37
Compiègne, M., Verstraete, L., Jones, A., Bernard, J. P., Boulanger, F., Flagey, N., et al. (2011). The global dust SED: Tracing the nature and evolution of dust with DustEM. Astron. Astrophys. 525, A103. doi:10.1051/0004-6361/201015292
Coudé, S., Bastien, P., Houde, M., Sadavoy, S., Friesen, R., Di Francesco, J., et al. (2019). The JCMT BISTRO survey: The magnetic field of the barnard 1 star-forming region. Astrophys. J. 877, 88. doi:10.3847/1538-4357/ab1b23
Cox, E. G., Harris, R. J., Looney, L. W., Li, Z.-Y., Yang, H., Tobin, J. J., et al. (2018). ALMA’s polarized view of 10 protostars in the perseus molecular cloud. Astrophys. J. 855, 92. doi:10.3847/1538-4357/aaacd2
Crutcher, R. M. (2012). Magnetic fields in molecular clouds. Annu. Rev. Astron. Astrophys. 50, 29–63. doi:10.1146/annurev-astro-081811-125514
Curran, R. L., and Chrysostomou, A. (2007). Magnetic fields in massive star-forming regions. Mon. Not. R. Astron. Soc. 382, 699–716. doi:10.1111/j.1365-2966.2007.12399.x
Davis, J. L., and Greenstein, J. L. (1951). The polarization of starlight by aligned dust grains. Astrophys. J. 114, 206. doi:10.1086/145464
Davis, L. (1951). The strength of interstellar magnetic fields. Phys. Rev. 81, 890–891. doi:10.1103/PhysRev.81.890.2
De Buizer, J. M., Morris, M. R., Becklin, E. E., Zinnecker, H., Herter, T. L., Adams, J. D., et al. (2012). First science observations with SOFIA/FORCAST: 6-37 μm imaging of orion BN/KL. Astrophys. J. 749, L23. doi:10.1088/2041-8205/749/2/l23
de Geus, E. J., de Zeeuw, P. T., and Lub, J. (1989). Physical parameters of stars in the Scorpio-Centaurus OB association. Astron. Astrophys. 216, 44–61.
De Marchi, G., Paresce, F., Panagia, N., Beccari, G., Spezzi, L., Sirianni, M., et al. (2011). star formation in 30 Doradus. Astrophys. J. 739, 27. doi:10.1088/0004-637X/739/1/27
Devaraj, R., Clemens, D. P., Dewangan, L. K., Luna, A., Ray, T. P., and Mackey, J. (2021). Magnetic fields and star formation around H II regions: The S235 complex. Astrophys. J. 911, 81. doi:10.3847/1538-4357/abe9b1
Doi, Y., Hasegawa, T., Furuya, R. S., Coudé, S., Hull, C. L. H., Arzoumanian, D., et al. (2020). The JCMT BISTRO survey: Magnetic fields associated with a network of filaments in NGC 1333. Astrophys. J. 899, 28. doi:10.3847/1538-4357/aba1e2
Dolginov, A. Z., and Mitrofanov, I. G. (1976). Orientation of cosmic dust grains. Astrophys. Space Sci. 43, 291–317. doi:10.1007/BF00640010
Draine, B. T., and Flatau, P. J. (1994). Discrete-dipole approximation for scattering calculations. J. Opt. Soc. Am. A 11, 1491–1499. doi:10.1364/JOSAA.11.001491
Draine, B. T., and Flatau, P. J. (2008). Discrete-dipole approximation for periodic targets: Theory and tests. J. Opt. Soc. Am. A 25, 2693. doi:10.1364/JOSAA.25.002693
Draine, B. T., and Fraisse, A. A. (2009). Polarized far-infrared and submillimeter emission from interstellar dust. Astrophys. J. 696, 1–11. doi:10.1088/0004-637X/696/1/1
Draine, B. T., and Hensley, B. S. (2021). The dielectric function of “astrodust” and predictions for polarization in the 3.4 and 10 μm features. Astrophys. J. 909, 94. doi:10.3847/1538-4357/abd6c6
Draine, B. T., and Weingartner, J. C. (1996). Radiative torques on interstellar grains. I. Superthermal spin-up. Astrophys. J. 470, 551. doi:10.1086/177887
Draine, B. T., and Weingartner, J. C. (1997). Radiative torques on interstellar grains. II. Grain alignment. Astrophys. J. 480, 633–646. doi:10.1086/304008
Dufour, R. J., Shields, G. A., and Talbot, R. J. (1982). The carbon abundance in the Magellanic Clouds from IUE observations of H II regions. Astrophys. J. 252, 461–473. doi:10.1086/159574
Efroimsky, M., and Lazarian, A. (2000). Inelastic dissipation in wobbling asteroids and comets. Mon. Not. R. Astron. Soc. 311, 269–278. doi:10.1046/j.1365-8711.2000.03036.x
Einstein, A., and de Haas, W. J. (1915). Experimental proof of the existence of Ampère’s molecular currents. K. Ned. Akad. Wet. Proceed. Series B Phys. Sci. 18, 696–711.
Flatau, P. J., and Draine, B. T. (2012). Fast near field calculations in the discrete dipole approximation for regular rectilinear grids. Opt. Express 20, 1247. doi:10.1364/OE.20.001247
Friberg, P., Berry, D., Savini, G., Bintley, D., Dempsey, J., Graves, S., et al. (2018). “Characterizing and reducing the POL-2 instrumental polarization,” in Millimeter, submillimeter, and far-infrared detectors and instrumentation for astronomy IX. Editors J. Zmuidzinas, and J.-R. Gao, 10708, 107083M. Society of Photo-Optical Instrumentation Engineers (SPIE) Conference Series. doi:10.1117/12.2314345
Galitzki, N., Ade, P. A. R., Angilè, F. E., Benton, S. J., Devlin, M. J., Dober, B., et al. (2014). “The balloon-borne large aperture submillimeter telescope for polarimetry-BLASTPol: performance and results from the 2012 antarctic flight,” inGround-based and airborne telescopes V. Editors L. M. Stepp, R. Gilmozzi, and H. J. Hall, 9145, 91450R. Society of Photo-Optical Instrumentation Engineers (SPIE) Conference Series. doi:10.1117/12.2054759
Galliano, F., Madden, S. C., Tielens, A. G. G. M., Peeters, E., and Jones, A. P. (2008). Variations of the mid-IR aromatic features inside and among galaxies. Astrophys. J. 679, 310–345. doi:10.1086/587051
Garrod, R. T., Widicus Weaver, S. L., and Herbst, E. (2008). Complex chemistry in star-forming regions: An expanded gas-grain warm-up chemical model. Astrophys. J. 682, 283–302. doi:10.1086/588035
Giang, N. C., Hoang, T., and Tram, L. N. (2020). Time-varying extinction, polarization, and colors of type Ia supernovae due to rotational disruption of dust grains. Astrophys. J. 888, 93. doi:10.3847/1538-4357/ab5d37
Goodman, A. A., Jones, T. J., Lada, E. A., and Myers, P. C. (1992). The structure of magnetic fields in dark clouds: Infrared polarimetry in B216–217. Astrophys. J. 399, 108. doi:10.1086/171907
Goodman, A. A., Jones, T. J., Lada, E. A., and Myers, P. C. (1995). Does near-infrared polarimetry reveal the magnetic field in cold dark clouds? Astrophys. J. 448, 748. doi:10.1086/176003
Guerra, J. A., Chuss, D. T., Dowell, C. D., Houde, M., Michail, J. M., Siah, J., et al. (2021). Maps of magnetic field strength in the OMC-1 using HAWC+ FIR polarimetric data. Astrophys. J. 908, 98. doi:10.3847/1538-4357/abd6f0
Guillet, V., Fanciullo, L., Verstraete, L., Boulanger, F., Jones, A. P., Miville-Deschênes, M. A., et al. (2018). Dust models compatible with Planck intensity and polarization data in translucent lines of sight. Astron. Astrophys. 610, A16. doi:10.1051/0004-6361/201630271
Hall, J. S. (1949). Observations of the polarized light from stars. Science 109, 166–167. doi:10.1126/science.109.2825.166
Hamaguchi, K., Corcoran, M. F., and Imanishi, K. (2003). Chandra observations of a young embedded magnetic B star in the ρ Ophiuchus cloud. Publ. Astron. Soc. Jpn. Nihon. Tenmon. Gakkai. 55, 981–987. doi:10.1093/pasj/55.5.981
Harper, D. A., Runyan, M. C., Dowell, C. D., Wirth, C. J., Amato, M., Ames, T., et al. (2018). HAWC+, the far-infrared camera and polarimeter for SOFIA. J. Astron. Instrum. 7, 1840008–1841025. doi:10.1142/S2251171718400081
Heiles, C., and Crutcher, R. (2005). “Magnetic fields in diffuse HI and molecular clouds,” in Cosmic magnetic fields. Editors R. Wielebinski, and R. Beck, 664, 137. doi:10.1007/11369875_7
Herranen, J., Lazarian, A., and Hoang, T. (2021). Alignment of irregular grains by radiative torques: Efficiency study. Astrophys. J. 913, 63. doi:10.3847/1538-4357/abf096
Hildebrand, R. H., Kirby, L., Dotson, J. L., Houde, M., and Vaillancourt, J. E. (2009). Dispersion of magnetic fields in molecular clouds. I. Astrophys. J. 696, 567–573. doi:10.1088/0004-637X/696/1/567
Hiltner, W. A. (1949). Polarization of light from distant stars by interstellar medium. Science 109, 165. doi:10.1126/science.109.2825.165
Hirashita, H., and Hoang, T. (2020). Effects of rotational disruption on the evolution of grain size distribution in galaxies. Mon. Not. R. Astron. Soc. 494, 1058–1070. doi:10.1093/mnras/staa793
Hoang, T., and Lazarian, A. (2008). Radiative torque alignment: Essential physical processes. Mon. Not. R. Astron. Soc. 388, 117–143. doi:10.1111/j.1365-2966.2008.13249.x
Hoang, T., and Lazarian, A. (2009). Radiative torques alignment in the presence of pinwheel torques. Astrophys. J. 695, 1457–1476. doi:10.1088/0004-637X/695/2/1457
Hoang, T., and Lazarian, A. (2014). Grain alignment by radiative torques in special conditions and implications. Mon. Not. R. Astron. Soc. 438, 680–703. doi:10.1093/mnras/stt2240
Hoang, T., and Lazarian, A. (2016a). A unified model of grain alignment: Radiative alignment of interstellar grains with magnetic inclusions. Astrophys. J. 831, 159. doi:10.3847/0004-637X/831/2/159
Hoang, T., and Lazarian, A. (2016b). Polarization of magnetic dipole emission and spinning dust emission from magnetic nanoparticles. Astrophys. J. 821, 91. doi:10.3847/0004-637X/821/2/91
Hoang, T., and Tram, L. N. (2020). Rotational desorption of ice mantles from suprathermally rotating grains around young stellar Objects. Astrophys. J. 891, 38. doi:10.3847/1538-4357/ab6eff
Hoang, T., and Tung, N.-D. (2020). Evolution of dust and water ice in cometary comae by radiative torques. Astrophys. J. 901, 59. doi:10.3847/1538-4357/abafa5
Hoang, T., Lazarian, A., and Martin, P. G. (2014). Paramagnetic alignment of small grains: A novel method for measuring interstellar magnetic fields. Astrophys. J. 790, 6. doi:10.1088/0004-637X/790/1/6
Hoang, T., Cho, J., and Lazarian, A. (2018). Alignment of irregular grains by mechanical torques. Astrophys. J. 852, 129. doi:10.3847/1538-4357/aa9edc
Hoang, T., Tram, L. N., Lee, H., and Ahn, S.-H. (2019). Rotational disruption of dust grains by radiative torques in strong radiation fields. Nat. Astron. 3, 766–775. doi:10.1038/s41550-019-0763-6
Hoang, T., Giang, N. C., and Tram, L. N. (2020). Gamma-ray burst Afterglows: Time-varying extinction, polarization, and colors due to rotational disruption of dust grains. Astrophys. J. 895, 16. doi:10.3847/1538-4357/ab8ae1
Hoang, T., Lazarian, A., Lee, H., Cho, K., Gu, P.-G., and Ng, C.-H. (2021a). Effect of dust rotational disruption by radiative torques and implications for the F-corona decrease revealed by the parker solar probe. Astrophys. J. 919, 91. doi:10.3847/1538-4357/ac126e
Hoang, T., Tram, L. N., Lee, H., Diep, P. N., and Ngoc, N. B. (2021b). Grain alignment and disruption by radiative torques in dense molecular clouds and implication for polarization holes. Astrophys. J. 908, 218. doi:10.3847/1538-4357/abd54f
Hoang, T., Tram, L. N., Phan, V. H. M., Chau Giang, N., Phuong, N. T., and Dieu, N. D. (2022a). On internal and external alignment of dust grains in protostellar environments. arXiv e-prints. arXiv:2205.02334.
Hoang, T. D., Ngoc, N. B., Diep, P. N., Tram, L. N., Hoang, T., Pattle, K., et al. (2022b). Studying magnetic fields and dust in M17 using polarized thermal dust emission observed by SOFIA/HAWC+. Astrophys. J. 929, 27. doi:10.3847/1538-4357/ac5abf
Hoang, T. (2019). A dynamical constraint on interstellar dust models from radiative torque disruption. Astrophys. J. 876, 13. doi:10.3847/1538-4357/ab1075
Hoang, T. (2020). Rotational disruption of astrophysical dust and ice—theory and applications. Galaxies 8, 52. doi:10.3390/galaxies8030052
Hoang, T. (2021a). Effect of dust rotational disruption by radiative torques on radiation pressure feedback from massive protostars. Astrophys. J. 921, 21. doi:10.3847/1538-4357/ac185d
Hoang, T. (2021b). Variation of dust properties with cosmic time implied by radiative torque disruption. Astrophys. J. 907, 37. doi:10.3847/1538-4357/abccc8
Hoang, T. (2022). Effects of grain alignment with magnetic fields on grain growth and the structure of dust aggregates. Astrophys. J. 928, 102. doi:10.3847/1538-4357/ac5408
Houde, M., Vaillancourt, J. E., Hildebrand, R. H., Chitsazzadeh, S., and Kirby, L. (2009). Dispersion of magnetic fields in molecular clouds. II. Astrophys. J. 706, 1504–1516. doi:10.1088/0004-637X/706/2/1504
Hu, Z. W., and Winarski, R. P. (2021). Elementary composite binary and grain alignment locked in dust growth. Astrophys. J. Lett. 923, L4. doi:10.3847/2041-8213/ac391e
Hu, Y., Yuen, K. H., Lazarian, V., Ho, K. W., Benjamin, R. A., Hill, A. S., et al. (2019). Magnetic field morphology in interstellar clouds with the velocity gradient technique. Nat. Astron. 3, 776–782. doi:10.1038/s41550-019-0769-0
Hu, Y., Lazarian, A., and Stanimirović, S. (2021). Revealing gravitational collapse in the serpens G3-G6 molecular cloud using velocity gradients. Astrophys. J. 912, 2. doi:10.3847/1538-4357/abedb7
Hull, C. L. H., and Plambeck, R. L. (2015). The 1.3mm full-Stokes polarization system at CARMA. J. Astron. Instrum. 4, 1550005. doi:10.1142/S2251171715500051
Hull, C. L. H., Plambeck, R. L., Kwon, W., Bower, G. C., Carpenter, J. M., Crutcher, R. M., et al. (2014). TADPOL: A 1.3 mm survey of dust polarization in star-forming cores and regions. Astrophys. J. Suppl. Ser. 213, 13. doi:10.1088/0067-0049/213/1/13
Jiménez-Serra, I., Vasyunin, A. I., Caselli, P., Marcelino, N., Billot, N., Viti, S., et al. (2016). The spatial distribution of complex organic molecules in the L1544 pre-stellar core. Astrophys. J. 830, L6. doi:10.3847/2041-8205/830/1/L6
Jones, R. V., and Spitzer, L. (1967). Magnetic alignment of interstellar grains. Astrophys. J. 147, 943. doi:10.1086/149086
Jones, T. J., Klebe, D., and Dickey, J. M. (1992). Infrared polarimetry and the galactic magnetic field. II. Improved models. Astrophys. J. 389, 602. doi:10.1086/171233
Jones, A. P., Fanciullo, L., Köhler, M., Verstraete, L., Guillet, V., Bocchio, M., et al. (2013). The evolution of amorphous hydrocarbons in the ISM: dust modelling from a new vantage point. Astron. Astrophys. 558, A62. doi:10.1051/0004-6361/201321686
Jones, T. J., Bagley, M., Krejny, M., Andersson, B. G., and Bastien, P. (2015). Grain alignment in starless cores. Astron. J. 149, 31. doi:10.1088/0004-6256/149/1/31
Jones, T. J., Kim, J.-A., Dowell, C. D., Morris, M. R., Pineda, J. L., Benford, D. J., et al. (2020). HAWC+ far-infrared observations of the magnetic field geometry in M51 and NGC 891. Astron. J. 160, 167. doi:10.3847/1538-3881/abada8
Kleinmann, D., and Low, F. (1967). Discovery of an infrared nebula in orion. Astrophys. J. 149, L1. doi:10.1086/180039
Knapmeyer, M., Fischer, H.-H., Knollenberg, J., Seidensticker, K., Thiel, K., Arnold, W., et al. (2018). Structure and elastic parameters of the near surface of Abydos site on comet 67P/Churyumov–Gerasimenko, as obtained by SESAME/CASSE listening to the MUPUS insertion phase. Icarus 310, 165–193. doi:10.1016/j.icarus.2017.12.002
Kounkel, M., Hartmann, L., Loinard, L., Ortiz-León, G. N., Mioduszewski, A. J., Rodríguez, L. F., et al. (2017). The gould’s belt distances survey (gobelins). ii. distances and structure toward the orion molecular clouds. Astrophys. J. 834, 142. doi:10.3847/1538-4357/834/2/142
Kwon, W., Pattle, K., Sadavoy, S., Hull, C. L. H., Johnstone, D., Ward-Thompson, D., et al. (2022). B-fields in star-forming region observations (BISTRO): Magnetic fields in the filamentary structures of serpens main. Astrophys. J. 926, 163. doi:10.3847/1538-4357/ac4bbe
Lazarian, A., and Draine, B. T. (1999). Nuclear spin relaxation within interstellar grains. Astrophys. J. 520, L67–L70. doi:10.1086/312137
Lazarian, A., and Efroimsky, M. (1999). Inelastic dissipation in a freely rotating body: application to cosmic dust alignment. Mon. Not. R. Astron. Soc. 303, 673–684. doi:10.1046/j.1365-8711.1999.02235.x
Lazarian, A., and Hoang, T. (2007a). Radiative torques: analytical model and basic properties. Mon. Not. R. Astron. Soc. 378, 910–946. doi:10.1111/j.1365-2966.2007.11817.x
Lazarian, A., and Hoang, T. (2007b). Subsonic mechanical alignment of irregular grains. Astrophys. J. 669, L77–L80. doi:10.086/523849
Lazarian, A., and Hoang, T. (2008). Alignment of dust with magnetic inclusions: Radiative torques and superparamagnetic Barnett and nuclear relaxation. Astrophys. J. 676, L25–L28. doi:10.1086/586706
Lazarian, A., and Hoang, T. (2021). Alignment and rotational disruption of dust. Astrophys. J. 908, 12. doi:10.3847/1538-4357/abd02c
Lazarian, A., Andersson, B. G., and Hoang, T. (2015). “Grain alignment: Role of radiative torques and paramagnetic relaxation,” in Polarimetry of stars and planetary systems, 81.
Lazarian, A. (2007). Tracing magnetic fields with aligned grains. J. Quant. Spectrosc. Radiat. Transf. 106, 225–256. doi:10.1016/j.jqsrt.2007.01.038
Lee, H., Hoang, T., Le, N., and Cho, J. (2020). Physical model of dust polarization by radiative torque alignment and disruption and implications for grain internal structures. Astrophys. J. 896, 44. doi:10.3847/1538-4357/ab8e33
Li, H., Dowell, C. D., Kirby, L., Novak, G., and Vaillancourt, J. E. (2008). Design and initial performance of SHARP, a polarimeter for the SHARC-II camera at the Caltech Submillimeter Observatory. Appl. Opt. 47, 422–430. doi:10.1364/AO.47.000422
Lim, W., Buizer, J. M. D., and Radomski, J. T. (2020). Surveying the giant h ii regions of the milky way with SOFIA. II. m17. Astrophys. J. 888, 98. doi:10.3847/1538-4357/ab5fd0
Lopez, L. A., Krumholz, M. R., Bolatto, A. D., Prochaska, J. X., and Ramirez-Ruiz, E. (2011). What drives the expansion of giant H II regions?: A study of stellar feedback in 30 Doradus. Astrophys. J. 731, 91. doi:10.1088/0004-637X/731/2/91
Lopez-Rodriguez, E., Dowell, C. D., Jones, T. J., Harper, D. A., Berthoud, M., Chuss, D., et al. (2020). SOFIA/HAWC+ traces the magnetic fields in NGC 1068. Astrophys. J. 888, 66. doi:10.3847/1538-4357/ab5849
Lopez-Rodriguez, E. (2021). The magnetic field across the molecular warped disk of Centaurus A. Nat. Astron. 5, 604–614. doi:10.1038/s41550-021-01329-9
Marrone, D. P., and Rao, R. (2008). “The submillimeter array polarimeter,” in Millimeter and submillimeter detectors and instrumentation for astronomy IV. Editors W. D. Duncan, W. S. Holland, S. Withington, and J. Zmuidzinas 7020, 70202B. Society of Photo-Optical Instrumentation Engineers (SPIE) Conference Series. doi:10.1117/12.788677
Mathis, J. S., Mezger, P. G., and Panagia, N. (1983). Interstellar radiation field and dust temperatures in the diffuse interstellar matter and in giant molecular clouds. Astron. Astrophys. 500, 259–276.
Menten, K. M., Reid, M. J., Forbrich, J., and Brunthaler, A. (2007). The distance to the orion nebula. Astron. Astrophys. 474, 515–520. doi:10.1051/0004-6361:20078247
Misawa, R., Bernard, J. P., Ade, P., André, Y., de Bernardis, P., Bouzit, M., et al. (2014). “Pilot: a balloon-borne experiment to measure the polarized FIR emission of dust grains in the interstellar medium,” in Millimeter, submillimeter, and far-infrared detectors and instrumentation for astronomy VII. Editors W. S. Holland, and J. Zmuidzinas, 9153, 91531H. Society of Photo-Optical Instrumentation Engineers (SPIE) Conference Series. doi:10.1117/12.2055506
Nagai, H., Nakanishi, K., Paladino, R., Hull, C. L. H., Cortes, P., Moellenbrock, G., et al. (2016). ALMA science verification data: Millimeter continuum polarimetry of the bright radio quasar 3C 286. Astrophys. J. 824, 132. doi:10.3847/0004-637X/824/2/132
Ngoc, N. B., Diep, P. N., Parsons, H., Pattle, K., Hoang, T., Ward-Thompson, D., et al. (2021). Observations of magnetic fields surrounding LkHα 101 taken by the BISTRO survey with JCMT-POL-2. Astrophys. J. 908, 10. doi:10.3847/1538-4357/abd0fc
Ortiz-León, G. N., Loinard, L., Kounkel, M. A., Dzib, S. A., Mioduszewski, A. J., Rodríguez, L. F., et al. (2017). The gould’s belt distances survey (GOBELINS). I. Trigonometric parallax distances and depth of the Ophiuchus complex. Astrophys. J. 834, 141. doi:10.3847/1538-4357/834/2/141
Pattle, K., and Fissel, L. (2019). Submillimeter and far-infrared polarimetric observations of magnetic fields in star-forming regions. Front. Astron. Space Sci. 6, 15. doi:10.3389/fspas.2019.00015
Pattle, K., Ward-Thompson, D., Berry, D., Hatchell, J., Chen, H.-R., Pon, A., et al. (2017). The JCMT BISTRO survey: The magnetic field strength in the orion A filament. Astrophys. J. 846, 122. doi:10.3847/1538-4357/aa80e5
Pattle, K., Lai, S.-P., Hasegawa, T., Wang, J.-W., Furuya, R. S., Ward-Thompson, D., et al. (2019). JCMT BISTRO survey observations of the Ophiuchus molecular cloud: Dust grain alignment properties inferred using a ricean noise model. Astrophys. J. 880, 27. doi:10.3847/1538-4357/ab286f
Pattle, K., Gear, W., Redman, M., Smith, M. W. L., and Greaves, J. (2021a). Submillimetre observations of the two-component magnetic field in M82. Mon. Not. R. Astron. Soc. 505, 684–688. doi:10.1093/mnras/stab1300
Pattle, K., Lai, S.-P., Wright, M., Coudé, S., Plambeck, R., Hoang, T., et al. (2021b). OMC-1 dust polarization in ALMA band 7: diagnosing grain alignment mechanisms in the vicinity of orion source I. Mon. Not. R. Astron. Soc. 503, 3414–3433. doi:10.1093/mnras/stab608
Pattle, K., Fissel, L., Tahani, M., Liu, T., and Ntormousi, E. (2022). Magnetic fields in star formation: from clouds to cores. arXiv e-prints. arXiv:2203.11179.
Pillai, T. G. S., Clemens, D. P., Reissl, S., Myers, P. C., Kauffmann, J., Lopez-Rodriguez, E., et al. (2020). Magnetized filamentary gas flows feeding the young embedded cluster in Serpens South. Nat. Astron. 4, 1195–1201. doi:10.1038/s41550-020-1172-6
Planck Collaboration Ade, P. A. R., Aghanim, N., Alves, M. I. R., Armitage-Caplan, C., Arnaud, M., et al. (2014). Planck 2013 results. I. Overview of products and scientific results. Astron. Astrophys. 571, A1. doi:10.1051/0004-6361/201321529
Planck Collaboration Ade, P. A. R., Aghanim, N., Alina, D., Alves, M. I. R., Armitage-Caplan, C., et al. (2015). Planck intermediate results. xix. an overview of the polarized thermal emission from galactic dust. Astron. Astrophys. 576, A104. doi:10.1051/0004-6361/201424082
Planck Collaboration Aghanim, N., Akrami, Y., Alves, M. I. R., Ashdown, M., Aumont, J., et al. (2020). Planck 2018 results. XII. Galactic astrophysics using polarized dust emission. Astron. Astrophys. 641, A12. doi:10.1051/0004-6361/201833885
Povich, M. S., Churchwell, E., Bieging, J. H., Kang, M., Whitney, B. A., Brogan, C. L., et al. (2009). THE EXTENDED ENVIRONMENT OF m17: A star formation history. Astrophys. J. 696, 1278–1306. doi:10.1088/0004-637x/696/2/1278
Purcell, E. M. (1979). Suprathermal rotation of interstellar grains. Astrophys. J. 231, 404–416. doi:10.1086/157204
Reissl, S., Wolf, S., and Brauer, R. (2016). Radiative transfer with POLARIS. I. Analysis of magnetic fields through synthetic dust continuum polarization measurements. Astron. Astrophys. 593, A87. doi:10.1051/0004-6361/201424930
Roman-Duval, J., Gordon, K. D., Meixner, M., Bot, C., Bolatto, A., Hughes, A., et al. (2014). Dust and gas in the magellanic clouds from the HERITAGE Herschel key project. II. Gas-to-dust ratio variations across interstellar medium phases. Astrophys. J. 797, 86. doi:10.1088/0004-637X/797/2/86
Sadavoy, S. I., Stephens, I. W., Myers, P. C., Looney, L., Tobin, J., Kwon, W., et al. (2019). Dust polarization toward embedded protostars in Ophiuchus with ALMA. III. Survey overview. Astrophys. J. Suppl. Ser. 245, 2. doi:10.3847/1538-4365/ab4257
Santos, F. P., Chuss, D. T., Dowell, C. D., Houde, M., Looney, L. W., Lopez Rodriguez, E., et al. (2019). The far-infrared polarization spectrum of ρ ophiuchi A from HAWC+/SOFIA observations. Astrophys. J. 882, 113. doi:10.3847/1538-4357/ab3407
Tazaki, R., Lazarian, A., and Nomura, H. (2017). Radiative grain alignment in protoplanetary disks: Implications for polarimetric observations. Astrophys. J. 839, 56. doi:10.3847/1538-4357/839/1/56
Tercero, B., Cuadrado, S., López, A., Brouillet, N., Despois, D., and Cernicharo, J. (2018). Chemical segregation of complex organic O-bearing species in Orion KL. Astron. Astrophys. 620, L6. doi:10.1051/0004-6361/201834417
Tram, L. N., Hoang, T., Soam, A., Lesaffre, P., and Reach, W. T. (2020). Modeling rotational disruption of grains and microwave emission from spinning dust in AGB envelopes. Astrophys. J. 893, 138. doi:10.3847/1538-4357/ab7b5e
Tram, L. N., Hoang, T., Lee, H., Santos, F. P., Soam, A., Lesaffre, P., et al. (2021a). Understanding polarized dust emission from ρ ophiuchi A in light of grain alignment and disruption by radiative torques. Astrophys. J. 906, 115. doi:10.3847/1538-4357/abc6fe
Tram, L. N., Hoang, T., Lopez-Rodriguez, E., Coudé, S., Soam, A., Andersson, B. G., et al. (2021b). SOFIA observations of 30 Doradus. I. Far-Infrared dust polarization and implications for grain alignment and disruption by radiative torques. Astrophys. J. 923, 130. doi:10.3847/1538-4357/ac13a1
Tram, L. N., Lee, H., Hoang, T., Michail, J. M., Chuss, D. T., Nickerson, S., et al. (2021c). Observational evidence for rotational desorption of complex molecules by radiative torques from orion BN/KL. Astrophys. J. 908, 159. doi:10.3847/1538-4357/abccbe
Tram, L. N., Bonne, L., Hu, Y., Lopez-Rodriguez, E., Guerra, J. A., Lesaffre, P., et al. (2022). SOFIA observations of 30 Doradus: II – magnetic fields and large scale gas kinematics. arXiv e-prints. arXiv:2205.12084.
Tung, N.-D., and Hoang, T. (2020). Rotational disruption of dust and ice by radiative torques in protoplanetary disks and the implications for observations. Astrophys. J. 901, 6. doi:10.3847/1538-4357/abacbf
van Dishoeck, E. F. (2014). Astrochemistry of dust, ice and gas: Introduction and overview. Faraday Discuss. 168, 9–47. doi:10.1039/C4FD00140K
Vrba, F. J. (1977). Role of magnetic fields in the evolution of five dark cloud complexes. Astron. J. 82, 198–208. doi:10.1086/112031
Whittet, D. C. B., Hough, J. H., Lazarian, A., and Hoang, T. (2008). The efficiency of grain alignment in dense interstellar clouds: a reassessment of constraints from near-infrared polarization. Astrophys. J. 674, 304–315. doi:10.1086/525040
Wiesemeyer, H., Hezareh, T., Kreysa, E., Weiss, A., Güsten, R., Menten, K. M., et al. (2014). Submillimeter polarimetry with PolKa, a reflection-type modulator for the APEX telescope. Publ. Astron. Soc. Pac. 126, 1027–1047. doi:10.1086/679002
Xu, Y., Moscadelli, L., Reid, M. J., Menten, K. M., Zhang, B., Zheng, X. W., et al. (2011). Trigonometric parallaxes of massive star-forming regions. VIII. G12.89+0.49, G15.03–0.68 (M17), and G27.36–0.16. Astrophys. J. 733, 25. doi:10.1088/0004-637x/733/1/25
Zhang, Q., Qiu, K., Girart, J. M., Liu, H. B., Tang, Y.-W., Koch, P. M., et al. (2014). Magnetic fields and massive star formation. Astrophys. J. 792, 116. doi:10.1088/0004-637X/792/2/116
Keywords: interstellar medium, astrophysical dust processes, interstellar dust, interstellar dust extinction, dust continuum emission, starlight polarization, interstellar magnetic fields, star formation
Citation: Tram LN and Hoang T (2022) Recent progress in theory and observational study of dust grain alignment and rotational disruption in star-forming regions. Front. Astron. Space Sci. 9:923927. doi: 10.3389/fspas.2022.923927
Received: 19 April 2022; Accepted: 29 August 2022;
Published: 07 October 2022.
Edited by:
Yanxia Zhang, National Astronomical Observatories (CAS), ChinaReviewed by:
Alex Lazarian, University of Wisconsin-Madison, United StatesVladimir A. Sreckovic, University of Belgrade, Serbia
Copyright © 2022 Tram and Hoang. This is an open-access article distributed under the terms of the Creative Commons Attribution License (CC BY). The use, distribution or reproduction in other forums is permitted, provided the original author(s) and the copyright owner(s) are credited and that the original publication in this journal is cited, in accordance with accepted academic practice. No use, distribution or reproduction is permitted which does not comply with these terms.
*Correspondence: Le Ngoc Tram, bmxlQG1waWZyLWJvbm4ubXBnLmRl; Thiem Hoang, dGhpZW1ob2FuZ0BrYXNpLnJlLmty