 Angelo Pidatella1*
 David Mascali1
 Matteo Bezmalinovich2,3
 Giulia Emma1,4
 Maria Mazzaglia1
 Bharat Mishra1,4Giorgio Finocchiaro1,4
 Alessio Galatà5Salvo Marletta1
 Giorgio Sebastiano Mauro1
 Eugenia Naselli1
 Domenico Santonocito1
 Giuseppe Torrisi1
 Sergio Cristallo3,6
 Marco La Cognata1
 Albino Perego7,8
 Roberta Spartà1
 Aurora Tumino1,9
 Diego Vescovi10
- 1INFN, LNS, Catania, Italy
- 2Department of Science and Technology, University of Camerino, Camerino, Italy
- 3INFN, Sezione di Perugia, Perugia, Italy
- 4Department of Physics and Astronomy, University of Catania, Catania, Italy
- 5INFN, LNL, Legnaro, Italy
- 6INAF, Osservatorio Astronomico d’Abruzzo, Teramo, Italy
- 7Department of Physics, University of Trento, Trento, Italy
- 8TIFPA, INFN, Trento, Italy
- 9Department of Engineering and Architecture, University of Enna “Kore”, Enna, Italy
- 10Institute for Applied Physics, Goethe University Frankfurt, Frankfurt am Main, Germany
Electromagnetic transients known as kilonovae (KN), are among the photonic messengers released in the post-merger phase of compact binary objects, for example, binary neutron stars, and they have been recently observed as the electromagnetic counterpart of related gravitational-wave (GW) events. Detection of the KN signal plays a fundamental role in the multi-messenger astronomy entering in a sophisticated GW-detecting network. The KN light curve also delivers precious information on the composition and dynamics of the neutron-rich post-merger plasma ejecta (relying on r-process nucleosynthesis yields). In this sense, studying KN becomes of great relevance for nuclear astrophysics. Because of the highly heterogeneous composition, plasma opacity has a great impact both on radiative transport and spectroscopic observation of KN. Theoretical models attempting in encoding the opacity of this system often fail, due to the complexity of blending plethora of both light- and heavy-r nuclei transition lines, requesting for more complete atomic database. Trapped magneto-plasmas conceived in PANDORA could answer to these requests, allowing experimental in-laboratory measurements of optical properties and opacities, at plasma electron densities and temperatures resembling early-stage plasma ejecta’s conditions, contributing to shed light on r-process metallic species abundance at the blue-KN diffusion time. A numerical study has been recently performed, supporting the choice of first physics cases to be investigated and the design of the experimental setup. In this article, we report on the feasibility of metallic plasmas on the basis of the results from the systematic numerical survey on optical spectra computed under non-local thermodynamic equilibrium (NLTE) for several light-r nuclei. Results show the great impact of the NLTE regime of laboratory magneto-plasmas on the gray opacity contribution contrasted with those under the astrophysical LTE assumption. A first experimental attempt of reproducing ejecta plasma conditions has been performed on the operative Flexible Plasma Trap (FPT) at the INFN-LNS and here presented, together with first plasma characterization of density and temperature, via non-invasive optical emission spectroscopy (OES). The measured plasma parameters have supported numerical simulations to explore optical properties of NLTE gaseous and metallic plasmas, in view of the near-future plasma opacity measurements through spectroscopic techniques. The novel work so far performed on these under-dense and low-temperature magneto-plasmas, opens the route for the first-time to future in-laboratory plasma opacity measurements of metallic plasma species relevant for KN light curve studies.
1 Introduction
The interplaying network of observations, combining both gravitational-wave (GW) signals and their electromagnetic (EM) counterparts, is representative of the outstanding window on the cosmos offered by multi-messenger astronomy (Rosswog, 2015). In this context, the mergers of compact binary (CB) objects—such as the coalescence of two neutron stars—provide a unique physical opportunity to advance knowledge on the heavy elements nucleosynthesis (Korobkin et al., 2012; Kasen et al., 2017), and to study the post-merger ejecta dynamics (Perego et al., 2014; Wu et al., 2022). The CB merger powers EM transient signals, following the GW event, known as kilonovae (Metzger, 2019) (hereafter, KN), which are fed by a peculiar balance of thermalization and radioactive heating processes (Li and Paczyński, 1998). Depending on the non-trivial merging dynamics and on the ejecta neutron richness, large neutron fluxes could lead to the production of n-rich isotopes far from the beta-stability valley, enriching the CB merger ejecta both of heavy (mass number A ≳140) and light (A ≲140) nuclei, synthesized via the rapid neutron capture nucleosynthesis process (r-process). The bolometric light curve broadband evolution of the bright optical transient AT2017gfo (Korobkin et al., 2012; Arcavi et al., 2017), detected after the GW170817 event (Abbott et al., 2017), has shown a fair agreement with the expected heating rate and opacity from freshly synthesized heavy elements (Metzger et al., 2010; Kasen et al., 2017), resulting from multi-component mass ejection and evolution. The r-process-powered KN transient emission has therefore a key role in the study of the complexity of r-process final abundance pattern, which relies on both thermodynamic conditions and radioactive decays. However, because of its heterogeneous composition, the CB merger ejecta opacity (κ) largely affects the KN emission, in turn influencing both the KN light-curve and the spectral energy distribution. Opacity reflects the plasma atomic level population distribution and the related radiative cross sections. It regulates the energy exchange between plasma and radiation through several absorption-scattering reactions driven by a plethora of atomic line transitions (Tanaka et al., 2020). Ejecta enriched in light r-process elements result in low opacity (κ ≲ 1 cm2 g−1), propagating optical light fading in days (blue-KN), whereas heavy r-process elements enlarges the opacity (κ⪆ 10 cm2 g−1), with redder light curves lasting even for weeks (red-KN) (Kasen et al., 2017). The color characterizing a specific phase of a KN event therefore acts as a diagnostics for the produced nuclei. However, state-of-the-art literature widely request for progresses on opacity modeling (Barnes and Kasen, 2013; Rosswog, 2015; Barnes et al., 2016; Metzger, 2019; Tanaka et al., 2020) to improve KN predictions. Indeed, limited experimental data on opacity of complex (d)- and (f)-shell elements (Bailey et al., 2009; Hoarty et al., 2010; Zhang et al., 2011; Bailey et al., 2015), as well as of their level structure and reaction rates, along with atomic constraints provided by oversimplified theoretical models, could lead to inconsistent results if compared with observations. Therefore, an experimental benchmark closing the gap between theory and observations would be highly desirable to draw quantitative conclusions on the nucleosynthetic yield from observations. At the INFN-LNS, a new plasma trap called PANDORA is under construction (Mascali et al., 2022a). The trap has been developed within the INFN funded PANDORA (Plasma for Astrophysics, Nuclear Decays Observation and Radiation for Archaeometry) project, with the aim to study weak-interaction rates in controlled and monitored electron cyclotron resonance (ECR) plasmas, reproducing stellar-like conditions, in terms of temperature and ion charge state distribution, and opening the route to interdisciplinary experiments relevant for the astrophysics and nuclear astrophysics. In the framework of opacity measurements interesting for the KN light-curve study, trapped magneto-plasmas conceived in PANDORA offer an outstanding controlled environment, allowing first-of-its-kind in-laboratory measurements of optical properties and opacities, at plasma electron densities and temperatures resembling early-stage plasma ejecta’s conditions, contributing to shed light on r-process metallic species abundance at the blue-KN diffusion time. A numerical study has been recently performed, supporting the choice of first physics cases to be investigated and the design of the experimental setup (Pidatella et al., 2021). In this article, we report on further considerations about the possibility of producing metallic light r-process plasmas eligible for the opacity measurements, using the PANDORA plasma trap (Section 2.1). On this track, we report on the first experimental attempt of reproducing ejecta plasma conditions carried out on the already operative Flexible Plasma Trap (FPT) at the INFN-LNS (Section 2.2.1), presenting first plasma characterization of density and temperature (Section 2.2.2), via non-invasive optical emission spectroscopy (OES). The measured plasma parameters have supported numerical simulations to explore optical properties of non-local thermodynamic equilibrium (NLTE) gaseous and metallic plasmas (Section 2.3), in view of the near-future plasma opacity measurements using spectroscopic techniques. Results of in-plasma spectroscopic measurements and of numerical investigations on plasma optical properties is presented and discussed in (Sections 3.1, 3.2), respectively. Finally, conclusion and possible outlook of the work is provided in (Section 4).
2 Methods
In the following, we report on the methodologies and experimental techniques employed in this work. Technological aspects are discussed in Section 2.1, based on the know-how gained at the INFN laboratories (LNS and LNL) on injection methods of metallic atoms into magnetically confined plasmas, and on the numerical feasibility study (Pidatella et al., 2021), providing further constraints on the physics cases suitable for opacity measurements. Moreover, a full description of the flexible plasma trap facility, the experiment design, and diagnostics techniques employed are provided in Section 2.2. Finally, details on the numerical calculations performed to study magneto-plasma optical properties are reported in Section 2.3.
2.1 On kilonovae ejecta constraints for in-laboratory electron cyclotron resonance plasma experiments: Metallic element injection
Fundamental elements for the interpretation of the KN light-curve are the r-process yields (determining the heating term) and opacities (leading the energy exchange between radiation and plasma). The AT2017gfo spectrum delivers absorption signatures suitable with blending of many atomic lines expected from actinides and lanthanides. For earlier-stages spectrum (
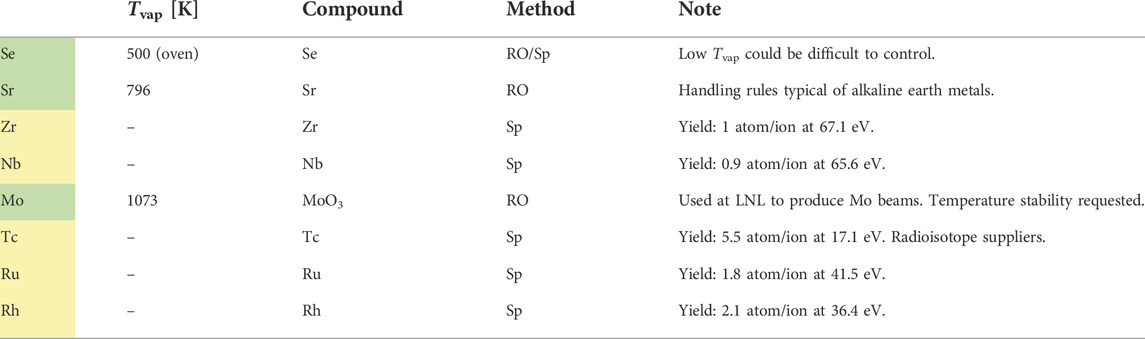
TABLE 1. Light r-process elements of interest for opacity measurements for the blue-KN stage. Tvap [K] is the evaporation temperature of the species. Species with larger injection efficiency and easier production are marked in green (▪), while those presenting some efficiency or availability limitations in yellow (▪).
2.2 First characterization of plasma parameters for gaseous electron cyclotron resonance plasmas
In this section, the main characteristics of the FPT are highlighted. The trap represents the outcome of the experience gained in the physics of plasma ion source at the INFN-LNS in the last decades (Gammino et al., 2017). It is characterized by a peculiar flexibility in terms of possible magnetic field configurations and microwaves heating frequency, exploiting the known ECR heating mechanism (Geller, 1996). Plasma parameters mostly depend on the particular tuning of the field profile, RF frequency and power, and gas buffer pressure, leading to many possible scenarios. Generated plasmas are suitable for studies of astrophysics, nuclear, and multidisciplinary physics, especially on the basis of their stellar-like temperature conditions. In this context, a particular effort has been spent at the INFN-LNS to develop a multi-diagnostics system to allow both a full characterization of the plasma parameters for all electron and ion species involved and interdisciplinary studies (Mazzaglia et al., 2018; Naselli et al., 2019a; Mazzaglia et al., 2019; Naselli et al., 2022a; Mascali et al., 2022b; Torrisi et al., 2022). The FPT is therefore a valuable experimental facility operative at the INFN-LNS to benchmark monitoring diagnostics and experimental techniques to be employed in PANDORA, of course on a larger scale, which is precious for the future envisaged in-laboratory plasma measurements relevant for the KN study. In the following, we report on the experimental setup adopted for the first non-invasive characterization of gaseous ECR plasma only via OES, generated, confined, and sustained via the FPT (Section 2.2.1). We also provide a general picture of the multi-diagnostic setup used in the experiment, particularly focusing on OES diagnostic, and the applied line-ratio method (Fantz, 2006; Fantz et al., 2006) for estimating electron plasma density and temperature for low-Z plasma buffer (Section 2.2.2), that is, hydrogen (H2) and argon (Ar).
2.2.1 Experimental setup: Flexible plasma trap and diagnostic system
The FPT magnetic field is provided by means of three solenoids, which allow the tuning of the field profile. The plasma characterization in the FPT has been performed in both simple mirror and quasi B-flat configuration, adequately tuning the Bmin/BECR, used as figure of merit for the plasma stability (Mazzaglia et al., 2018; Naselli et al., 2019b), and also modifying source parameters: microwave power (PRF), heating frequency (fRF), and gas neutral pressure (p0). In the Figure 1A view of the FPT setup including all diagnostics used is shown. The FPT plasma has been generated via the radial microwave injection (perpendicular to the chamber longitudinal axis), leaving the parallel axis available for the diagnostics. The injection is carried at frequencies ranging between 4 and 7 GHz. The signal is generated by a Rohde & Schwarz generator, amplified by a traveling wave tube (TWT) and sent to the FPT by WRD350 waveguides. A directional coupler allows to measure forward and reflected power, while an insulator safeguards the TWT by the power reflected backward. A differentially pumped system, using a small orifice (dosing valve), connects the plasma chamber vacuum with the vacuum reservoir developed for performing mass spectrometry. The two vacuum systems work at very different pressures (e.g., pchamber = 10−4÷−2 mbar, pspectrometer ≤ 10–5 mbar) and requires the development of an independent vacuum piping system. A compact residual gas analyzer (RGA) was used for the vacuum diagnostics and for mass spectroscopy (Pfeiffer Vacuum—QMG 250 PrismaPro®). A view of the apparatus is shown in Figures 1C,D. The diagnostic line is quite complex, with the intent to perform non-invasive on-line cross-measurements in multi-diagnostics:
1) A pin-hole setup, coupled to a high-resolution CCD camera, able to perform space-resolved X-ray imaging of plasma emission (Rácz et al., 2016). The system is supported by an algorithm, which can analyze the single-photon counting (SPhC) images for energy-resolved investigation pixel-by-pixel to study the local plasma-emitted spectrum in a high-dynamic range (HDR) mode by distinguishing the fluorescence lines of the materials of the plasma chamber (Ti and Ta) from plasma, for example, (Ar) fluorescence lines (Naselli et al., 2022b);
2) OES has been developed to characterize the cold electron population (kBTe ≤ 30 eV). It consists of an energy-calibrated spectrometer (i-HR 550 Horiba, diffraction grating 2,400 gr/mm, with nominal resolution of 35 pm at 486 nm, ranging from 300 to 750 nm), with relative calibration in intensity, coupled to a CCD detector (26 μm pixels)—a view of the detection system is shown in Figure 1B. OES allows not only to estimate the electron density and temperature of cold electrons in the plasma bulk (Mazzaglia et al., 2019) but also to advance knowledge on the relative percentage of the ion species within the plasma, by means of the line-ratio method (Fantz, 2006);
3) Microwave interfero-polarimetry to measure the line-of-sight integrated density of the whole plasma. Microwave polarimetry setup is able to investigate on the magnetoplasma-induced Faraday rotation in a compact plasma trap, monitoring plasma ignition, stability, and whole-density modulation led by changes in the source parameters (Mascali et al., 2022b);
4) RF probe placed axially and connected to an 80 Gsample/s oscilloscope, included to probe kinetic plasma instability and to make time-resolved measurements of the latter, based on the detection of emitted RF signals from the unstable plasma.
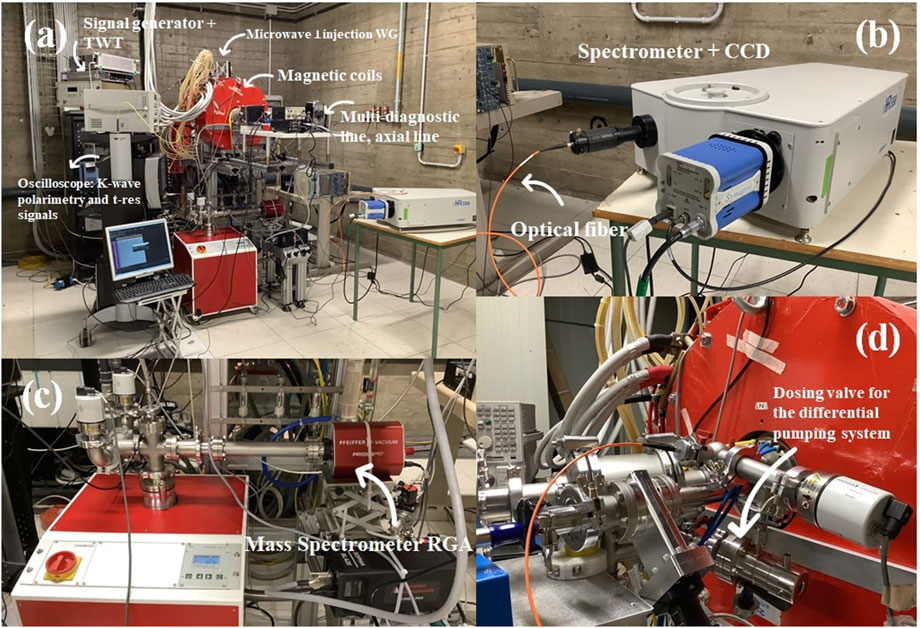
FIGURE 1. FPT experimental room and apparatus. (A) View of the FPT setup, including the chamber, magnetic coils, the RF instrumentation, and the axial diagnostic line. (B) Horiba spectrometer and the CCD detector, connected to the optical fiber. (C) RGA and the differential pumping system set to perform mass spectroscopy of gases in the chamber. (D) Part of the X-ray diagnostic line, with focus on the orifice to dose gas into the RGA.
In this work, despite the synergistic effort spent to develop the aforementioned diagnostic system, we will only provide further insights on the OES diagnostic (b), and its related methods to investigate on optical properties of generated plasmas.
2.2.2 Plasma optical emission spectroscopy for hydrogen and argon plasmas
To interpret intensities measured by OES, a model describing the correlation between atomic level population densities of excited states with plasma parameters, for example, the electron density (ρe) and, if the electron energy distribution function (EEDF) is Maxwellian, the electron temperature (Te) must be used. Collisional-radiative (CR) models well suite typical NLTE plasma generated via the ECR mechanism (Fantz, 2006; Fantz et al., 2006). The models provide this description by balancing reactions that imply a change in the electron energy level of atoms or molecules in a plasma: the time-derivative of the population density np of an excited state p can be written as a function of the other state densities,
with ρe being the electron density, Aqp is the Einstein coefficient for the transition from state q to p, χq→p is the rate coefficient for electron collision excitation (if Eq ≤ Ep) and de-excitation (if Eq ≥ Ep). This quantity describes, given an initial and a final state, the number of considered electron collision processes per unit of time normalized by the densities of the colliding particles. In Eq. 1, by taking p = 1, … , N, with N being the total number of excited levels of the considered emitting particle specie, a whole set of coupled differential equations, describing the temporal evolution of the population density of each excited state, is obtained. Such set is a simplified example of a CR model, which includes some of the most relevant processes for a low-pressure and low-temperature plasma. However, more processes can be included making models progressively closer to the reality. The resulting population densities np can be written in terms of population coefficients,
Thus, the line-ratio method only requires the analyzed spectra to have relatively calibrated their lines, making it more viable since no absolute intensity calibration is needed. However, the method is not fully exploitable for absolute information carried by single-line emission, leaving a possible full line interpretation only to absolutely calibrated spectra. With this limitation in mind, in the following we will present results on the basis of the line-ratio method, supported by a complete error analysis above the experimental results and the estimated plasma parameters. Several configurations of the plasma trap have been explored, and systematic data acquisition has been carried out. All spectra have been measured collecting the visible (VIS) light in the range 350–750 nm, via an optical fiber (NA = 0.22, core ø = 200 μm), connecting the spectrometer to a quartz window of a vacuum flange (see Figure 1D). Different acquisitions, ranging in 1–2 s, have been used dependent on the RF power employed to sustain the plasma. Figure 2 shows both magnetic field profiles used to confine the plasma and typical spectra collected in the VIS for both single-H2 and H2-Ar gas-mixture plasma. Further information on each experimental run are reported in Table 2.
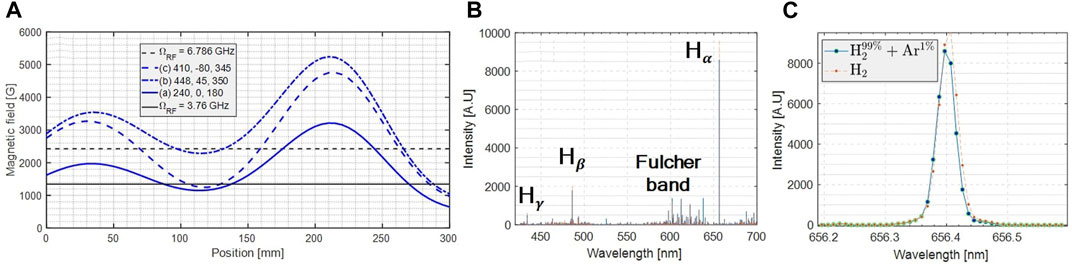
FIGURE 2. (A) Numerical calculation of the magnetic field profiles as function of solenoids currents, for the three configurations explored with OES, as reported in the legend. The microwave frequency (BRF = me2πfRF/e), fRF = 6.786(3.76) is drawn as solid (dashed) black line. (B) Spectra of emission-lines from H2 plasma (orange) and
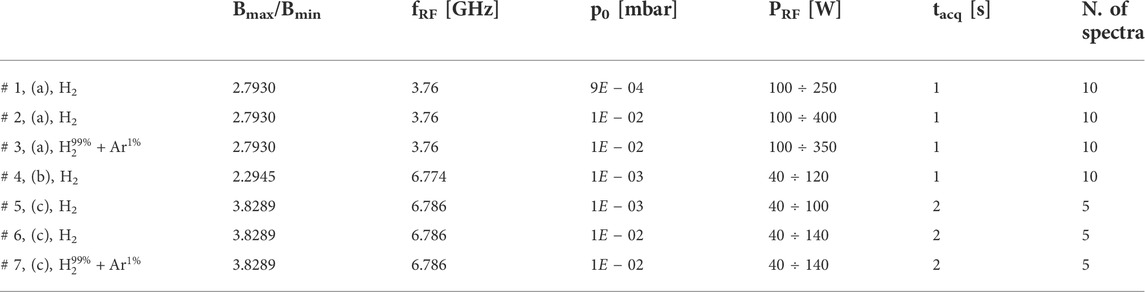
TABLE 2. OES experimental run details. Pure hydrogen (H2) and hydrogen–argon mixture
2.3 Numerical investigation on electron cyclotron resonance plasma optical properties
Experimental activities would widely benefit of numerical studies of the plasma optical properties. The latter shows not only interesting properties as being an active medium but also ECR magneto-plasmas in trap are present with peculiar properties, such as high inhomogeneity and anisotropic energy distribution, due to the EM heating and the magnetic confinement. Therefore, in-laboratory ECR plasmas become an interesting physical mean to be described in terms of radiation–matter coupling, in order to support the envisaged experimental spectroscopic measurements. In the following, we present some numerical results concerning the impact of a layered plasma mean on the optical features of the plasma, in terms of varying electron density and temperature along one line-of-sight, including or not the presence of an external perturbing black-body radiation field (Section 2.3.1). By means of the same numerical approach, we provide some quantitative constraints on typical light-source properties, which can be compatible with the maximization of plasma opacity at given electron density and temperature, resulting from the OES experimental measurements (Section 2.3.2).
2.3.1 Impact of non-homogeneous plasma stratification on transmission spectroscopy
The problem of determining plasma parameters and structure from optically thin emission lines, whose emission coefficients and frequency-integrated intensities depend on both electron temperature and density, is widely discussed in the literature (Craig and Brown, 1976; Thompson et al., 1992), especially facing the fundamental limitations of observed spectral line-ratios as well-posed diagnostic method for inferring plasma parameters (Judge and Hubeny, 1995; Judge et al., 1997). The inverse problem is affected by large uncertainties in the case of non-isothermal and inhomogeneous emitting source, since the latter could be structured and layered along the line-of-sight of the detector, thus producing a convoluted spectral distribution with an emission measure differential both in density and temperature. These layered-emission properties can be easily related to ECR plasmas. Therefore, studying this spectroscopic problem is of relevant interest for supporting experimental measurements. In this context, we performed numerical calculations of synthetic spectroscopic observables of emitting ECR plasmas, with a layered structure along one line-of-sight, at specific electron density and temperature. These latter are taken from previous self-consistent numerical simulations (Mishra et al., 2021) carried out to reproduce experimentally observed X-ray fluorescence emission of argon plasma, magnetically confined in a minimum-B profile, ignited, and sustained with microwave frequency and power, 12.84 GHz and 30 W, respectively. The numerical tool used is able to collect plasma electrons with similar parameters (density, EEDF) in regions of interest (ROIs) based on their mean energy content. Clustering of electrons in ROIs has been performed looking at electrons in the [0,2] keV energy range, along the longitudinal axis of the plasma chamber, crossing, the closed resonating magnetic isosurface at B = BECR = 0.46 T, as well as one of the employable spectroscopic line-of-sight designed for the plasma trap. Figure 3 shows the collection of nested mean energy isosurfaces inside the simulation domain, along with the ECR isosurface. A multi-slicing plot is superimposed on this, providing a cross-view of the space-dependent plasma’s electron mean energy upon moving along the longitudinal axis. Seven main ROIs have been located here and are indicated as R in the figure. For each of these ROIs, one collective electron density and temperature (assuming a Maxwellian EEDF) is assigned. This simulation allows us to provide a hint of the structured plasma parameters along the experimental line. Electron density and temperature estimated supply the next numerical calculations by means of the ion population kinetics code known as FLYCHK (Chung et al., 2005). The code suite takes as inputs the plasma parameters to compute spectral observables of the plasma, such as opacity, emissivity, and intensity, according to the degree of plasma ionization and atomic level population distribution. Calculations have been performed in NLTE regime, which is typical of ECR sources, by solving the rate matrix equations arising from the CR model considered in the code suite, including both the collisional and radiative processes. The code is also capable to include the effects of external radiation field, on the basis of an input file containing the intensity of the source as a function of the radiation wavelength, which has been included and processed in our calculations. This latter has been performed to show the impact of a light source on the stratified optical properties of plasmas. Focusing on the numerical structure of opacity, this is computed in terms of the cross section for both bound–bound transitions (κBB), bound–free transitions (κBF), and free–free transitions (κFF). Radiation from BB transition peaks at a wavelength corresponding to the energy difference between two levels. BF transition is recombination radiation, whose wavelength corresponds to the sum of the kinetic energy of the recombining electron and the binding energy of the shell that the electron falls to. Bremsstrahlung radiation is emitted from FF transitions when free electrons lose their kinetic energy colliding with electrons or ions. While the FF process involves continuum states, whose opacity mostly depends on electron density and temperature, the BF and BB also depend on the ion stage population of excited levels in the atomic shell. For instance, the BB opacity is given as
where the population density of the upper (lower) level is u(ℓ), Nu(Nℓ), gu(gℓ) are the degeneracy factors, ρ [g cm−3] is the density of the specie, fℓu is the oscillator strength, and φ is the line profile function. At low-temperature blue-KN ejecta conditions (T⩽104 K), together with a low ionization level, typically κBB results to be prominent among the other terms. The numerical results from calculations of the plasma opacity including all three possible contributions, and performed for the argon plasma as structured from self-consistent simulations are presented and discussed in Section 3.2.
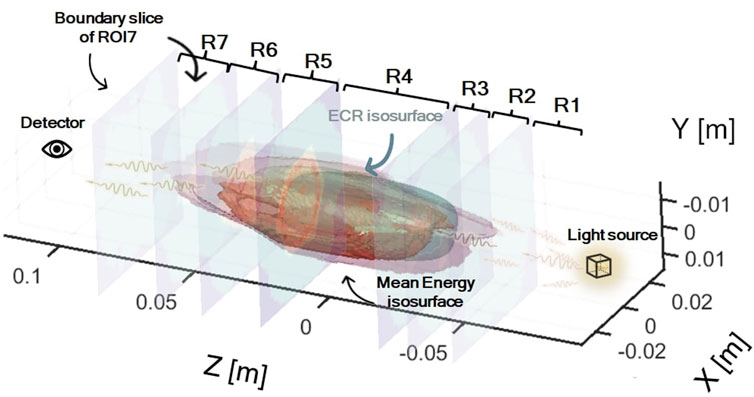
FIGURE 3. Representation of simulated plasma slicing along the longitudinal z-axis for studying the layered optical properties of Ar plasma. Nested isosurfaces refer to the volumetric collection of electron with the same mean energy content. Magnetic isosurface at the ECR (light-blue) is also shown. Along the z-axis regions of interest (R) have been selected and indicated in the figure, intersecting inhomogeneous plasma regions with different electron density ρe and energy kBTe, both numerically extracted in the [0,2] keV energy interval, and associated to each R. All the R is assumed as homogeneous plasma slab to be studied in FLYCHK, in the presence or not of a light source black-body radiation field.
2.3.2 Light-source dimensioning for electron cyclotron resonance plasma spectroscopy based on optical emission spectroscopy measurements
Numerical calculations by using FLYCHK can also support the experimental design, and in particular the light-source dimensioning in terms of power and/or spectral irradiance to be used for transmission spectroscopy, and for measuring the line-integrated opacity of emitting plasma. We have performed calculations of synthetic spectral observables, focusing on the opacity term, to study the impact of external black-body radiation fields on the latter, for gaseous as well as for metallic species of interest for the KN studies. Contrarily to what has been carried out about the layered plasma emission, described earlier in Section 2.3.1, plasma parameters used in these calculations are not derived from 3D numerical simulations, but rather they are constrained by the estimates from OES observations during the experiment, as described in Section 2.2.2, which results are present in Section 3.1. In doing this, we have assumed plasma parameters for metallic plasmas similar to the gaseous experimentally explored so far, given that metallic species atom fractions with respect to the plasma buffer gas (e.g., Ar) is usually not exceeding 1 %. Moreover, and for simplicity, no structured emission is considered in these calculations, but a rather homogeneous emitting plasma source. We aim at finding a good experimental trade-off among light-source intensity and the evidence of more opaque spectral region, whose absorption feature are better observable during the transmission measurements.
3 Results and discussion
In the following, we report on the experimental data collected via OES, and on the data analysis performed to estimate both electron density and temperature, along with their experimental uncertainties, as resulting from the line-ratio method applied to the hydrogen Balmer’s lines (Hα, Hβ, and Hγ). Moreover, numerical results concerning the plasma optical properties arose by the calculations with FLYCHK will be presented, focusing on the predicting power of simulations to support future experimental measurements, as well as to investigate on the plasma stratification problem, and thus on the light-emission convolution, along experimental line-of-sights.
3.1 Experimental data analysis
Several plasma trap configurations (hereafter, cfgs) have been investigated, but only seven of these have been chosen to make systematics in terms of RF power (PRF), based on the plasma stability and reproducibility, as reported in Table 2. The latter, beyond the capability of the plasma trap to engage, ignite, and sustain, the plasma at a given frequency (fRF) and magnetic confinement, has been probed via OES by looking at the stability of Hα,β,γ emission lines, and in particular on their ratios, that is, Hαβ =Hα/Hβ, and Hβγ =Hβ/Hγ, during many acquisitions at fixed PRF. Example of such on-line analysis is shown in Figures 4A,B for one of the configurations. The ratios employed for monitoring are calculated from the analysis performed on each spectrum. A dedicated code written in MATLAB ⓒ has been developed to perform the spectral analysis, by means of least-square fit procedure of emission peak of interest, along with the error derivation from the fit procedure. Multiple-Gaussian fits are employed to improve the fit procedure, and the peak area is used as a central value of the ratios. In the end, the error analysis including both statistical error and uncertainty led by the fit procedure is computed via the error propagation formulas. The following analysis flow is considered:
• Fitting procedure on the peaks of the H-spectra. The general formula for the peak’s area calculation fit by N Gaussian function (f(λ) = a ⋅ exp( − (λ − b)2/c2) ), is given as
where N is the number of Gaussian functions used, ai, ci, are the i-th coefficients from fit parameters, Δλ is the spectral bin width. Areas of the peaks refer to the related line-intensities, and to the population rate coefficients, accordingly to Eq. 2.
• Calculation of the ratios,
• Error propagation procedure to estimate uncertainties. For each spectrum, each calculated area below the peaks carries an error, given as
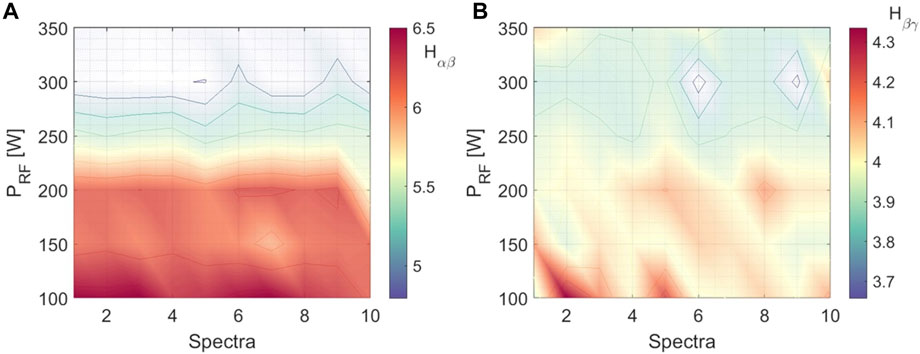
FIGURE 4. Monitoring of Hαβ (A) and of Hβγ (B) in the RF power (PRF [W]) - spectra plane. Both refer to the experimental run 3, at fRF = 3.76 GHz, p0 = 1E − 03 mbar.
with σa,c the standard deviation on a, c fit coefficients, and σac the correlation coefficients from the covariance matrix. The latter terms contribute to the total error only in case of correlations among the fit coefficients in the Eq. 4. The covariance analysis has shown generally non-zero correlation elements σac, which however are negligible with respect the other terms, and hence they have been ruled out from later on estimates of errors. By means of Eqs 4, 5, error propagates also to the ratios as
• Since we have a set of S independent measurements of the peaks area, each of them equally important, but with some of them carrying unequally large uncertainties, it is sounder computing the so-called inverse variance weighting, onto a weighted mean of ratios, which gives more weight to the measurements with less uncertainty (Taylor, 1996; Knoll, 2010). Thus, we proceed calculating the weighted mean ratio for each configuration, ⟨Hαβ⟩ and ⟨Hβγ⟩, according to
with
In Figures 5A,B the mean ratios given as from Eq. 7, and related uncertainties from the error analysis are shown as a function of RF power, for all the configurations examined. Considering the mean line-ratios and their experimental uncertainties, we therefore compared the latter to the theoretical ones, as resulting from numerical calculations using the Yacora CR model (Wünderlich et al., 2020). Theoretical ratios,
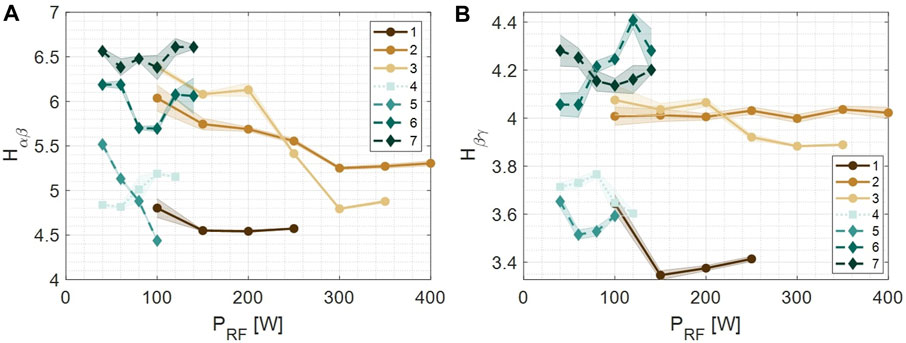
FIGURE 5. Averaged ⟨Hαβ⟩ (A) and ⟨Hβγ⟩ (B) vs. PRF over all spectra for each RF power, including uncertainty from error propagation (shaded region). Different experimental run are labeled according to Table 2 and shown in the legend.
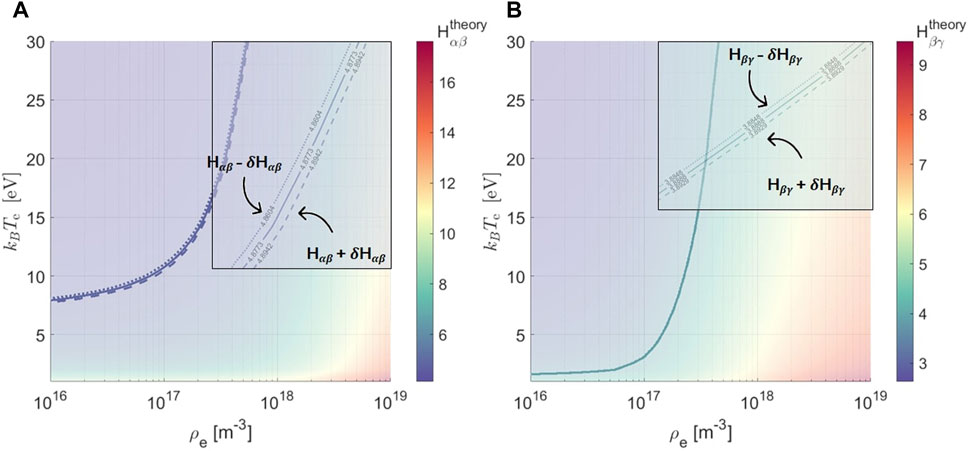
FIGURE 6. Surface-contour plot of experimental ⟨Hαβ⟩ isoline (solid line) on top of theoretical
which if exists, should be unique. In other words, this is equivalent to find a cross-point in the (ρe, Te) plane between the experimental isolines Hαβ and Hβγ. If it exists, then a solution to the system of Eq. 9 exists too, and this provides an estimate of the averaged electron density and temperature, along the spectroscopic line-of-sight. The error committed in the estimates should be calculated propagating the uncertainties of measured ratios in the equation system. However, this is not an easy task to be accomplished. Beyond the degree of complexity in solving this uncertainty analysis, due to the non-linearity nature of the problem, and to the lack of analytical functions describing both
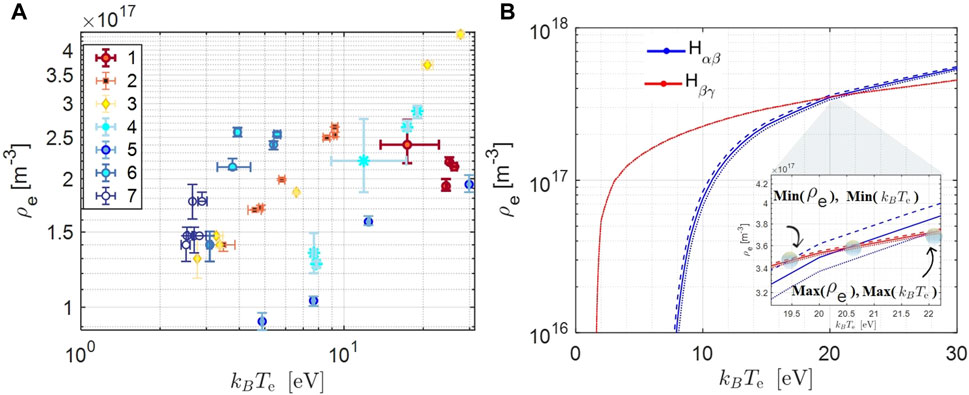
FIGURE 7. (A) Electron density ρe [m−3] - energy kBTe [eV] grid with uncertainties range (±δρe, ±δkBTe) on both (ρe, kBTe). Points belonging to the same experimental run are labeled according to the Table 2 and indicated in the legend. (B) Typical cross between experimental line ratios, Hαβ, Hβγ on the (ρe, kBTe) plane, as arising from Figure 6. Same carried out for the increased (decreased) ratios by respective uncertainties, plot as dashed (dotted) lines. Blobs in the inset indicate the cross, and represent the estimates for the central value and uncertainty on electron density and electron energy. The data refer to the experimental run 3, at fRF = 3.76 GHz, p0 = 1E − 03 mbar, and PRF = 350 W.
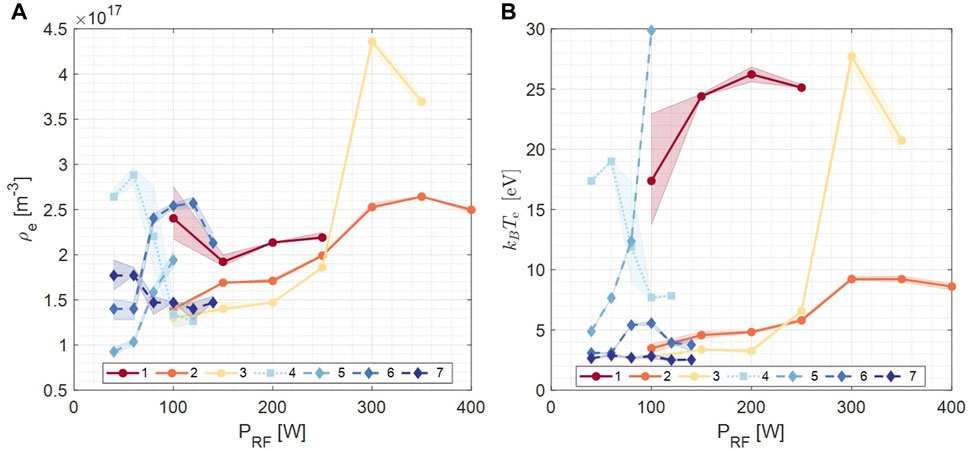
FIGURE 8. (A) Averaged density ρe [m−3] vs. PRF [W] over all spectra for each RF power, including uncertainty range from the graphical solution of the non-linear system, as shown in Figure 6 (shaded region). (B) Averaged electron energy kBTe [eV] vs. PRF over all spectra for each RF power, including uncertainty range from the graphical solution of the non-linear system, as shown in Figure 6 (shaded region). Different experimental run are labeled according to Table 2 and shown in the legend.
3.2 Numerical results on optical properties
The numerical results on the plasma opacity performed by using FLYCHK for the argon plasma as structured from self-consistent simulations are presented and discussed here. Despite no numerical data are available yet on plasma conditions that could be suitable for opacity measurements, like those at high-pressure and low-power, which could provide under-dense and low-temperature plasmas in FPT, as shown in Section 3.1, the main goal for the moment is to demonstrate that we are able to unfold non-uniform plasma data collection. The latter in order to get reliable results from the observable that we need to measure: the opacity. Thus, according to the numerical tools we have described in Section 2.3.1, it is more straightforward to start from a higher energy content plasma than it is actually needed. In Table 3 we report on the density and temperature numerically estimated for each of the ROIs considered along the line-of-sight. As it can be evinced, there is a gradual increase of density upon moving toward the center of the chamber axis (ROI 4), where the plasmoid core is expected to be more dense, with respect to the external (halo) region. The same ROI presents a higher temperature compared to the external ROIs, however smaller if compared with neighboring ones, ROI 3 and 5, which correspond to the ECR layer and to the regions maximizing the electron heating, thus their energy. Because of the relative high electron temperature, the total amount of opacity in the VIS range turns out to be very low (κ < 10–4 cm2g−1), as it is possible to observe in Figure 9. Indeed, electrons with hundreds of eV of energy will impact more on level population distribution and atomic line transitions belonging to higher energy states, in the soft-X-ray emission range, which is out of the EM range of interest for this work. The influence of higher-density ROIs in Figure 9 is also highlighted, where as expected the most opaque plasma arises from the inner plasmoid region in between of the ECR layers. Furthermore, we also explored the influence of an external black-body radiation field to the plasma opacity, which results are shown in Figures 9B,C, with a photon flux of
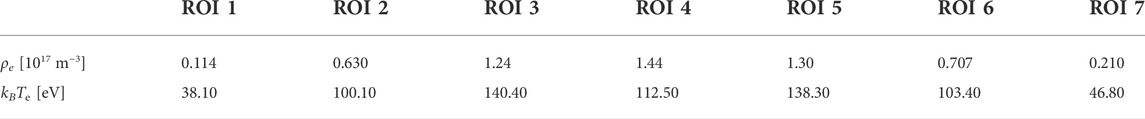
TABLE 3. Plasma parameters, electron density ρe [m−3], and energy kBTe [eV], estimated from numerical simulations along the longitudinal z-axis of the plasma chamber, for argon plasma confined in minimum-B-field, sustained by 12.84 GHz frequency and microwave power of 30 W.
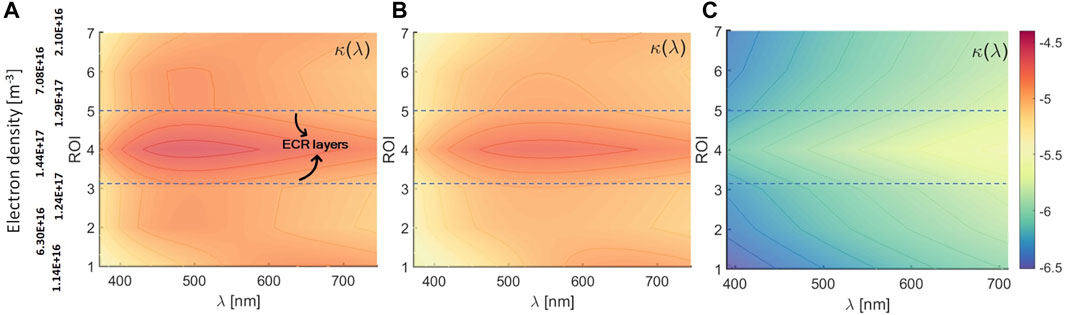
FIGURE 9. Numerical opacity κ(λ) [cm2g−1] (log scale) of argon plasma in the VIS range, as resulting from NLTE CR calculations in FLYCHK, for (A) unperturbed self-emitting plasma, and plasma perturbed by an external black-body radiation field [erg m−2 s−1 Hz−1] at 8000 K, with smaller (B) and larger (C) intensities. Opacity is shown in the wavelength λ [nm] - n. ROI (electron density ρe [m−3]) plane. The ROI n. label increases upon moving from negative to positive z-axis position along the longitudinal z-axis of numerically simulated plasma , as described in Section 2.3.1 and shown in Figure 3. ECR layers are shown (blue-dashed lines).
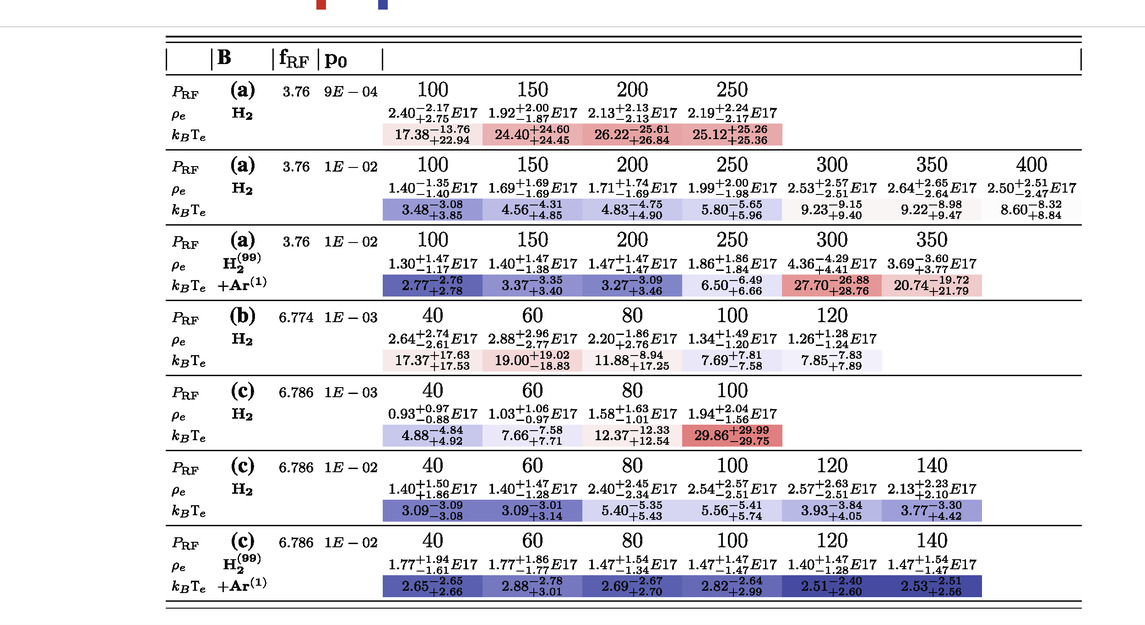
TABLE 4. Plasma parameters (electron density ρe [m−3], and energy kBTe [eV]), estimated from OES measurements for different experimental configurations, in terms of B-field (Injection, Mid, and Extraction coil polarized current) [(a): 240 A, 0 A, 180 A; (b): 448 A, 45 A, 350 A; (c): 410 A, − 80 A, 345 A], RF frequency (fRF [GHz]), gas pressure p0 [mbar], and RF power PRF [W]. Gradient-color (red–white–blue) provides indications on the energy (temperature) gradient ( hotter,
 colder) for the many configurations explored. Gas-mixture cases are explicitly reported in the table.
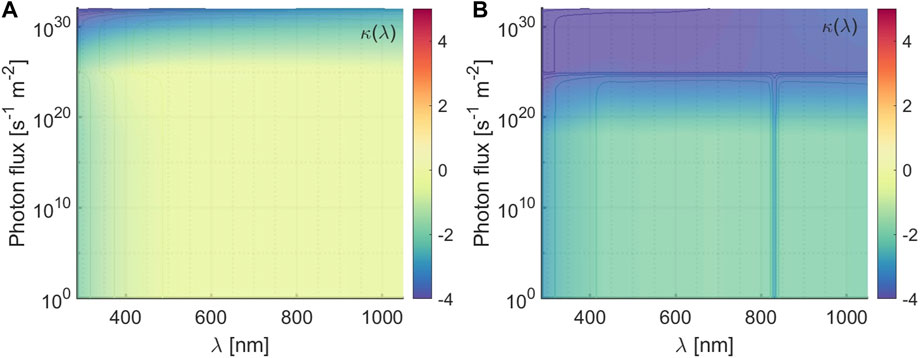
FIGURE 10. Numerical opacity κ(λ) [cm2g−1] (log scale) of argon plasma in the VIS range, as resulting from NLTE CR calculations in FLYCHK, at electron density ρe = 1.4 ⋅ 1017 m−3, and energy of (A) kBTe = 2.43 eV, and (B) kBTe = 7.88 eV. Opacity is shown in the wavelength λ [nm] - external radiation photon flux s−1m−2 plane. Plasma parameters of (A) have been selected from OES data from cfg. 7, at PRF = 120 W (see Table 4), while for (B) the density has been maintained equal and the energy increased.
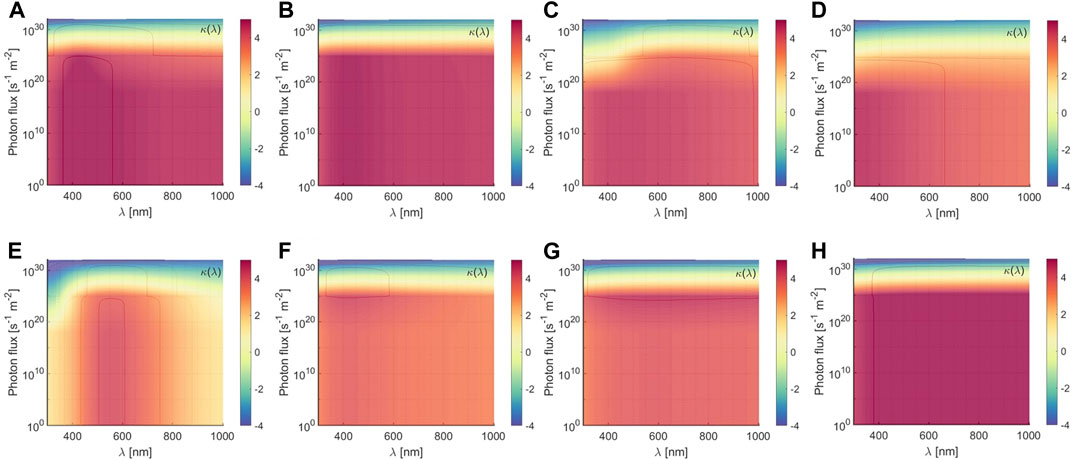
FIGURE 11. Numerical opacity κ(λ) [cm2g−1] (log scale) of metallic plasmas in the VIS range, as resulting from NLTE CR calculations in FLYCHK, for (A,E) selenium (Se), (B,F) strontium (Sr), (C,G) zirconium (Zr), and (D,H) niobium (Nb), at electron density ρe = 1.4 ⋅ 1017 m−3, and energy kBTe = 2.43 eV (A–D), and kBTe = 7.88 eV (E–H). Opacity is shown in the wavelength λ [nm] - external radiation photon flux s−1m−2 plane.
4 Conclusion
In this work, we have reported on the first experimental attempt of reproducing kilonovae ejecta plasma conditions, carried out on the Flexible Plasma Trap at the INFN-LNS. The kilonovae signal plays a fundamental role in the multi-messenger astronomy, entering in a sophisticated GW-detecting network and delivers precious information on the composition and dynamics of the neutron-rich post-merger plasma ejecta. The ejecta opacity largely impacts on the kilonovae study, with consequent highly demanded experimental efforts to make progresses on the kilonovae opacity characterization. The novel work so far performed on under-dense and low-temperature magneto-plasmas opens the route for the first-of-its-kind in-laboratory plasma opacity measurements of metallic plasma species relevant for kilonovae light curve studies, foreseen within the PANDORA project. Plasma parameter measurements have provided sounder bases for the reproducibility under early-stage kilonovae conditions and also benchmarked the efficiency of plasma diagnostics. Numerical efforts have been also spent to support future opacity measurements, by looking at the radiation–plasma matter interactions in the framework of highly inhomogeneous and anisotropic magnetically confined ECR plasmas. A synergistic use of spectroscopic measurements and numerical tools allowed to give some hints on typical light source to be employed in transmission spectroscopic measurements, designed for the future opacity measurements of light r-process element plasmas interesting for the kilonovae study. Experimental electron density and temperature obtained for high-pressure and high-frequency ECR plasmas are the most promising among the totality of experimental configurations explored, encouraging to extend experimental characterizations at larger pressures, in order to further decrease the average electron temperature, and hence to better reproduce conditions of the blue-kilonovae stage. The use of argon as contaminant looks promising for two reasons: first, an apparent beneficial effect as a thermal regulator in these plasmas, which requires further investigations; second, having theoretical line-ratios for argon line transitions will allow to make cross-check on the plasma parameters estimates arising from the hydrogen spectra analysis, thus providing more robust results. On the other side, numerical results have highlighted the influence on plasma opacity led by layered plasma parameters in the space, with important consequences for the convoluted line emission detected along the spectroscopic line-of-sight. Moreover, the study of the influence of external radiation acting on the plasma source optical observables has shown peculiar effects in terms of tuning the plasma opacity, accordingly to the level population of atoms involved, dependent on the electronic shell configurations and plasma temperature. Further numerical investigations are planned, extending CR calculations performed to three-dimensional properties of ECR plasmas, including spatial-dependent charge state distribution and ions residence time due to the magnetic confinement, not taken into account in the FLYCHK code suite. Next experimental steps are planned to perform opacity measurements of gaseous and metallic plasma sources based on the plasma trap configurations reported in this work.
Data availability statement
The original contributions presented in the study are included in the article/Supplementary Material; further inquiries can be directed to the corresponding author.
Author contributions
Conceptualization: AP, DM SC, ML, AP, and DV. Numerical simulations: AP, MB, GE, BM, and AG. Experimental data: AP, GE, MB, MM, BM, SM, DM GM, GF, EN, DS, and GT. Data analysis: AP, MB, GE, MM, DM, and BM. Funding acquisition: DM and DS. Writing—original draft: AP. Writing— review and editing: AP, DM, SC, DV, AG, AT, RS, GE, MB, BM, ML, and AP. All authors have read and agreed to the published version of the manuscript.
Acknowledgments
The authors wish to thank INFN for the support through the project PANDORA Gr3 funded by third Nat. Sci. Comm. and the whole PANDORA collaboration. DV acknowledges the financial support from the German-Israeli Foundation (GIF No. I-1500–303.7/2019).
Conflict of interest
The authors declare that the research was conducted in the absence of any commercial or financial relationships that could be construed as a potential conflict of interest.
Publisher’s note
All claims expressed in this article are solely those of the authors and do not necessarily represent those of their affiliated organizations, or those of the publisher, the editors, and the reviewers. Any product that may be evaluated in this article, or claim that may be made by its manufacturer, is not guaranteed or endorsed by the publisher.
References
Abbott, B. P., Abbott, R., Abbott, T. D., Acernese, F., Ackley, K., Adams, C., et al. (2017). GW170817: Observation of gravitational waves from a binary neutron star inspiral. Phys. Rev. Lett. 119, 161101. doi:10.1103/PhysRevLett.119.161101
Antaya, T. A. (1989). A review of studies for the variable frequency superconducting ecr ion source project at msu. J. Phys. Colloq. 50, C1-707–C1-726. doi:10.1051/jphyscol:1989176
Arcavi, I., Hosseinzadeh, G., Howell, D. A., McCully, C., Poznanski, D., Kasen, D., et al. (2017). Optical emission from a kilonova following a gravitational-wave-detected neutron-star merger. Nature 551, 64–66. doi:10.1038/nature24291
Bailey, J. E., Nagayama, T., Loisel, G. P., Rochau, G. A., Blancard, C., Colgan, J., et al. (2015). A higher-than-predicted measurement of iron opacity at solar interior temperatures. Nature 517, 56–59. doi:10.1038/nature14048
Bailey, J. E., Rochau, G. A., Mancini, R. C., Iglesias, C. A., MacFarlane, J. J., Golovkin, I. E., et al. (2009). Experimental investigation of opacity models for stellar interior, inertial fusion, and high energy density plasmas. Phys. Plasmas 16, 058101. doi:10.1063/1.3089604
Barnes, J., and Kasen, D. (2013). Effect of a high opacity on the light curves of radioactively powered transients from compact object mergers. Astrophys. J. 775, 18. doi:10.1088/0004-637x/775/1/18
Barnes, J., Kasen, D., Wu, M. R., and Martínez-Pinedo, G. (2016). Radioactivity and thermalization in the ejecta of compact object mergers and their impact on kilonova light curves. Astrophys. J. 829, 110. doi:10.3847/0004-637x/829/2/110
Chung, H. K., Chen, M., Morgan, W., Ralchenko, Y., and Lee, R. (2005). Flychk: Generalized population kinetics and spectral model for rapid spectroscopic analysis for all elements. High. Energy Density Phys. 1, 3–12. doi:10.1016/j.hedp.2005.07.001
Craig, I. J. D., and Brown, J. C. (1976). Fundamental limitations of X-ray spectra as diagnostics of plasma temperature structure. Astronomy Astrophysics 49, 239–250.
Delaunay, M. (1992). Influence of ionization cross sections on the gas mixing effect for the production of ar9+ ions in a caprice ecr source. Rev. Sci. Instrum. 63, 2861–2863. doi:10.1063/1.1142778
Domoto, N., Tanaka, M., Wanajo, S., and Kawaguchi, K. (2021). Signatures of r-process elements in kilonova spectra. Astrophys. J. 913, 26. doi:10.3847/1538-4357/abf358
Fantz, U. (2006). Basics of plasma spectroscopy. Plasma Sources Sci. Technol. 15, S137–S147. –S147. doi:10.1088/0963-0252/15/4/s01
Fantz, U., Falter, H., Franzen, P., Wünderlich, D., Berger, M., Lorenz, A., et al. (2006). Spectroscopy—A powerful diagnostic tool in source development. Nucl. Fusion 46, S297–S306. doi:10.1088/0029-5515/46/6/s10
Gammino, S., Celona, L., Mascali, D., Castro, G., Torrisi, G., Neri, L., et al. (2017). The flexible plasma trap (FPT) for the production of overdense plasmas. J. Instrum. 12, P07027. doi:10.1088/1748-0221/12/07/p07027
Geller, R. (1996). Electron cyclotron resonance ion sources and ECR plasmas. United Kingdom: Institute of Physics.
Gillanders, J. H., McCann, M., Sim, S., Smartt, S., and Ballance, C. P. (2021). Constraints on the presence of platinum and gold in the spectra of the kilonova at2017gfo. Mon. Notices R. Astronomical Soc. 506, 3560–3577. doi:10.1093/mnras/stab1861
Gillanders, J. H., Smartt, S. J., Sim, S. A., Bauswein, A., and Goriely, S. (2022). Modelling the spectra of the kilonova at2017gfo – i: The photospheric epochs. doi:10.48550/ARXIV.2202.01786
Hoarty, D. J., James, S. F., Brown, C. R. D., Williams, B. M., Guymer, T., Hill, M., et al. (2010). High temperature, high density opacity measurements using short pulse lasers. J. Phys. Conf. Ser. 244, 012002. doi:10.1088/1742-6596/244/1/012002
Judge, P. G., Hubeny, V., and Brown, C. J. (1997). Fundamental limitations of emission‐line spectra as diagnostics of plasma temperature and density structure. Astrophys. J. 475, 275–290. doi:10.1086/303511
Judge, P. G., and Hubeny, V. (1995). Solution to the bivariate integral inversion problem: The determination of emission measures differential in temperature and density. Astrophysical J. 448, 61–64. doi:10.1086/309594
Kasen, D., Metzger, B., Barnes, J., Quataert, E., and Ramirez-Ruiz, E. (2017). Origin of the heavy elements in binary neutron-star mergers from a gravitational-wave event. Nature 551, 80–84. doi:10.1038/nature24453
Korobkin, O., Rosswog, S., Arcones, A., and Winteler, C. (2012). On the astrophysical robustness of the neutron star merger r-process. Mon. Notices R. Astronomical Soc. 426, 1940–1949. doi:10.1111/j.1365-2966.2012.21859.x
Li, L. X., and Paczyński, B. (1998). Transient events from neutron star mergers. Astrophys. J. 507, L59–L62. doi:10.1086/311680
Mascali, D., Naselli, E., and Torrisi, G. (2022). Microwave techniques for electron cyclotron resonance plasma diagnostics. Rev. Sci. Instrum. 93, 033302. doi:10.1063/5.0075496
Mascali, D., Santonocito, D., Amaducci, S., Andò, L., Antonuccio, V., Biri, S., et al. (2022). A novel approach to β-decay: Pandora, a new experimental setup for future in-plasma measurements. Universe 8, 80. doi:10.3390/universe8020080
Mauro, G. S., Celona, L., Torrisi, G., Pidatella, A., Naselli, E., Russo, F., et al. (2022). An innovative superconducting magnetic trap for probing β-decay in plasmas. Front. Phys. 10. doi:10.3389/fphy.2022.931953
Mazzaglia, M., Castro, G., Mascali, D., Briefi, S., Fantz, U., Celona, L., et al. (2018). Study of the influence of magnetic field profile on plasma parameters in a simple mirror trap. J. Instrum. 13, C11014. doi:10.1088/1748-0221/13/11/c11014
Mazzaglia, M., Castro, G., Mascali, D., Celona, L., Neri, L., Torrisi, G., et al. (2019). Improvement of the characterization of the proton source for the European spallation source by means of optical emission spectroscopy. Phys. Rev. Accel. Beams 22, 053401. doi:10.1103/PhysRevAccelBeams.22.053401
Metzger, B. D., Martínez-Pinedo, G., Darbha, S., Quataert, E., Arcones, A., Kasen, D., et al. (2010). Electromagnetic counterparts of compact object mergers powered by the radioactive decay of r-process nuclei. Mon. Not. R. Astron. Soc. 406, 2650–2662. doi:10.1111/j.1365-2966.2010.16864.x
Mishra, B., Galata, A., Pidatella, A., Racz, R., Biri, S., Torrisi, G., et al. (2020) “Modelling space-resolved ion dynamics in ECR plasmas for predicting in-plasma β-decay rates,” in Frontiers in physics - research topics: Nuclear physics and astrophysics in plasma traps. forthcoming (Lausanne, Switzerland: frontiers).
Mishra, B., Pidatella, A., Biri, S., Galatà, A., Naselli, E., Rácz, R., et al. (2021). A novel numerical tool to study electron energy distribution functions of spatially anisotropic and non-homogeneous ecr plasmas. Phys. Plasmas 28, 102509. doi:10.1063/5.0061368
Naselli, E., Mascali, D., Biri, S., Caliri, C., Castro, G., Celona, L., et al. (2019). Multidiagnostics setups for magnetoplasmas devoted to astrophysics and nuclear astrophysics research in compact traps. J. Instrum. 14, C10008. doi:10.1088/1748-0221/14/10/c10008
Naselli, E., Mascali, D., Mazzaglia, M., Biri, S., Rácz, R., Pálinkás, J., et al. (2019). Impact of two-close-frequency heating on ECR ion source plasma radio emission and stability. Plasma Sources Sci. Technol. 28, 085021. doi:10.1088/1361-6595/ab32f9
Naselli, E., Rácz, R., Biri, S., Mazzaglia, M., Celona, L., Gammino, S., et al. (2022). Innovative analytical method for x-ray imaging and space-resolved spectroscopy of ecr plasmas. Condens. Matter 7, 5. doi:10.3390/condmat7010005
Naselli, E., Rácz, R., Biri, S., Mazzaglia, M., Galatà, A., Celona, L., et al. (2022). Quantitative analysis of an ECR ar plasma structure by x-ray spectroscopy at high spatial resolution. J. Instrum. 17, C01009. doi:10.1088/1748-0221/17/01/c01009
Perego, A., Rosswog, S., Cabezón, R. M., Korobkin, O., Käppeli, R., Arcones, A., et al. (2014). Neutrino-driven winds from neutron star merger remnants. Mon. Notices R. Astronomical Soc. 443, 3134–3156. doi:10.1093/mnras/stu1352
Perego, A., Vescovi, D., Fiore, A., Chiesa, L., Vogl, C., Benetti, S., et al. (2022). Production of very light elements and strontium in the early ejecta of neutron star mergers. Astrophys. J. 925, 22. doi:10.3847/1538-4357/ac3751
Phelps, A. V. (1992). Collisions of h+, h2+, h3+, arh+, h-h, and h2 with ar and of ar+ and arh+ with h2 for energies from 0.1 ev to 10 kev. J. Phys. Chem. Reference Data 21, 883–897. doi:10.1063/1.555917
Pidatella, A., Cristallo, S., Galatà, A., La Cognata, M., Mazzaglia, M., Perego, A., et al. (2021). In-plasma study of opacity relevant for compact binary ejecta. Il Nuovo Cimento C 44, 4. doi:10.1393/NCC/I2021-21065-X
Rácz, R., Biri, S., Pálinkás, J., Mascali, D., Castro, G., Caliri, C., et al. (2016). X-ray pinhole camera setups used in the atomki ecr laboratory for plasma diagnostics. Rev. Sci. Instrum. 87, 02A741. doi:10.1063/1.4933085
Rosswog, S. (2015). The multi-messenger picture of compact binary mergers. Int. J. Mod. Phys. D. 24, 1530012. doi:10.1142/S0218271815300128
Tanaka, M., Kato, D., Gaigalas, G., and Kawaguchi, K. (2020). Systematic opacity calculations for kilonovae. Mon. Not. R. Astron. Soc. 496, 1369–1392. doi:10.1093/mnras/staa1576
Tarvainen, O., Suominen, P., Ropponen, T., Kalvas, T., Heikkinen, P., and Koivisto, H. (2005). Effect of the gas mixing technique on the plasma potential and emittance of the jyfl 14 ghz electron cyclotron resonance ion source. Rev. Sci. Instrum. 76, 093304. doi:10.1063/1.2038647
Taylor, J. R. (1996). An introduction to error analysis: The study of uncertainties in physical measurements. 2 sub edn. Sausalito, CA: University Science Books.
Thompson, A. M., Brown, J. C., Craig, I. J. D., and Fulber, C. (1992). Inference of non-thermal electron energy distributions from hard X-ray spectra. Astronomy Astrophysics 265, 278–288.
Torrisi, G., Naselli, E., Donato, L. D., Mauro, G., Mazzaglia, M., Mishra, B., et al. (2022). RF and microwave diagnostics for compact plasma traps and possible perspectives for fusion devices. J. Instrum. 17, C01050. doi:10.1088/1748-0221/17/01/c01050
Watson, D., Hansen, C. J., Selsing, J., Koch, A., Malesani, D. B., Andersen, A. C., et al. (2019). Identification of strontium in the merger of two neutron stars. Nature 574, 497–500. doi:10.1038/s41586-019-1676-3
Wu, Z., Ricigliano, G., Kashyap, R., Perego, A., and Radice, D. (2022). Radiation hydrodynamics modelling of kilonovae with SNEC. Mon. Not. R. Astron. Soc. 512, 328–347. doi:10.1093/mnras/stac399
Wünderlich, D., Giacomin, M., Ritz, R., and Fantz, U. (2020). Yacora on the web: Online collisional radiative models for plasmas containing h, h2 or he. J. Quantitative Spectrosc. Radiat. Transf. 240, 106695. doi:10.1016/j.jqsrt.2019.106695
Keywords: plasma physics, nuclear astrophysics, multi-messenger astronomy, plasma spectroscopy, kilonovae
Citation: Pidatella A, Mascali D, Bezmalinovich M, Emma G, Mazzaglia M, Mishra B, Finocchiaro G, Galatà A, Marletta S, Mauro GS, Naselli E, Santonocito D, Torrisi G, Cristallo S, La Cognata M, Perego A, Spartà R, Tumino A and Vescovi D (2022) Experimental and numerical investigation of magneto-plasma optical properties toward measurements of opacity relevant for compact binary objects. Front. Astron. Space Sci. 9:931744. doi: 10.3389/fspas.2022.931744
Received: 29 April 2022; Accepted: 03 August 2022;
Published: 04 October 2022.
Edited by:
Isaac Vidana, Ministry of Education, Universities and Research, ItalyReviewed by:
Carlos Frajuca, Federal University of Rio Grande, BrazilIvano Lombardo, Università di Catania, Italy
Copyright © 2022 Pidatella, Mascali, Bezmalinovich, Emma, Mazzaglia, Mishra, Finocchiaro, Galatà, Marletta, Mauro, Naselli, Santonocito, Torrisi, Cristallo, La Cognata, Perego, Spartà, Tumino and Vescovi. This is an open-access article distributed under the terms of the Creative Commons Attribution License (CC BY). The use, distribution or reproduction in other forums is permitted, provided the original author(s) and the copyright owner(s) are credited and that the original publication in this journal is cited, in accordance with accepted academic practice. No use, distribution or reproduction is permitted which does not comply with these terms.
*Correspondence: Angelo Pidatella, cGlkYXRlbGxhQGxucy5pbmZuLml0