- 1Department of Electrical and Computer Engineering and Center for Space Physics, Boston University, Boston, MA, United States
- 2Citizen Scientist, Strathmore, AB, Canada
- 3Citizen Scientist, Fort Frances, ON, Canada
- 4Department of Physics and Astronomy, University of Calgary, Calgary, AB, Canada
- 5Department of Earth, Planetary and Space Sciences, University of California, Los Angeles, Los Angeles, CA, United States
This paper reviews key properties and major unsolved problems about Strong Thermal Emission Velocity Enhancement (STEVE) and the picket fence. We first introduce the basic characteristics of STEVE and historical observations of STEVE-like emissions, particularly the case on 11 September 1891. Then, we discuss major open questions about STEVE: 1) Why does STEVE preferentially occur in equinoxes? 2) How do the solar wind and storm/substorm conditions control STEVE? 3) Why is STEVE rare, despite that STEVE does not seem to require extreme driving conditions? 4) What are the multi-scale structures of STEVE? 5) What mechanisms determine the properties of the picket fence? 6) What are the chemistry and emission mechanisms of STEVE? 7) What are the impacts of STEVE on the ionosphere−thermosphere system? Also, 8) what is the relation between STEVE, stable auroral red (SAR) arcs, and the subauroral proton aurora? These issues largely concern how STEVE is created as a unique mode of response of the subauroral magnetosphere−ionosphere−thermosphere coupling system. STEVE, SAR arcs, and proton auroras, the three major types of subauroral emissions, require energetic particle injections to the pre-midnight inner magnetosphere and interaction with cold plasma. However, it is not understood why they occur at different times and why they can co-exist and transition from one to another. Strong electron injections into the pre-midnight sector are suggested to be important for driving intense subauroral ion drifts (SAID). A system-level understanding of how the magnetosphere creates distinct injection features, drives subauroral flows, and disturbs the thermosphere to create optical emissions is required to address the key questions about STEVE. The ionosphere−thermosphere modeling that considers the extreme velocity and heating should be conducted to answer what chemical and dynamical processes occur and how much the STEVE luminosity can be explained. Citizen scientist photographs and scientific instruments reveal the evolution of fine-scale structures of STEVE and their connection to the picket fence. Photographs also show the undulation of STEVE and the localized picket fence. High-resolution observations are required to resolve fine-scale structures of STEVE and the picket fence, and such observations are important to understand underlying processes in the ionosphere and thermosphere.
1 Introduction
Strong Thermal Emission Velocity Enhancement (STEVE) is a purple/mauve-colored arc that forms in the upper atmosphere equatorward of the auroral oval (MacDonald et al., 2018). STEVE can be associated with a green ray structure called the picket fence. Figure 1 shows two photographs of STEVE on 3 September 2016. The purple/mauve arc is STEVE. As in these photographs, STEVE sometimes consists of two emission layers (Liang et al., 2019), where the top part is more purplish and the bottom part is more whitish. The green rays underneath STEVE in the image at 5:22 UT are the picket fence. The two photographs were taken only 6 min apart, but the picket fence was not present earlier at 5:16 UT. Typically, STEVE appears first, and then the picket fence, if it exists, emerges during the course of STEVE (Yadav et al., 2021; Anderson and Anderson, 2021; Martinis et al., 2022). The picket fence can remain after STEVE disappears. Figure 2 shows a photograph from another event when the picket fence is present but STEVE is not visible. As described further in Section 2, STEVE was present earlier in this event, and the picket fence without STEVE appeared near the end of the lifetime of STEVE.
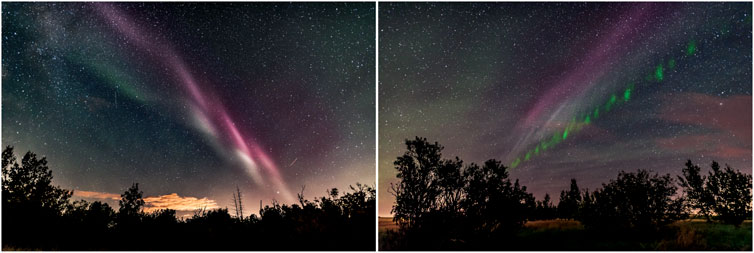
FIGURE 1. STEVE photographs that were taken at (left) 5:16 and (right) 5:22 UT on 3 September 2016 in Strathmore, Canada. The north is to the right in the left panel and to the left in the right panel. The faint green diffuse emission to the north of STEVE is the diffuse aurora in the auroral oval. The exposure time is 13 s.
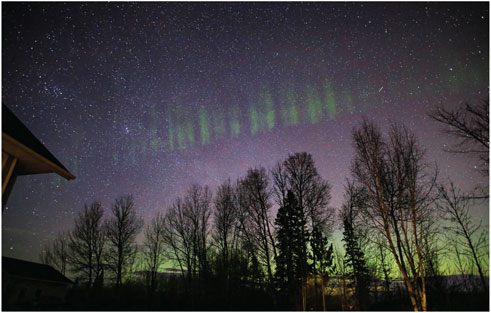
FIGURE 2. Photograph taken at 3:16 UT on 31 March 2017 in Fort Frances, Canada. This photograph shows the picket fence without STEVE. The north is to the bottom. The green diffuse emission to the north of STEVE is the diffuse aurora in the auroral oval. The exposure time is 3.2 s.
STEVE generally appears before magnetic midnight during the recovery phase of large substorms and lasts ∼1 h (Gallardo-Lacourt et al., 2018; Yadav et al., 2022). STEVE has a strong seasonal dependence, where its occurrence is the highest in equinoxes. STEVE is a narrow (∼20 km width) arc but can extend over ∼2000 km azimuthally. Unlike typical auroral emissions that are bright at particular spectral lines, the purple/mauve color is characterized by continuum emissions across 400–700 nm wavelengths (Gillies et al., 2019). STEVE is associated with intense subauroral ion drifts (SAID), ionospheric upflow, plasma density depletion (trough), temperature enhancements, and electromagnetic waves in the downward field-aligned currents (MacDonald et al., 2018; Nishimura et al., 2019; Nishimura et al., 2020a; Archer et al., 2019). These features are generally seen for enhanced subauroral flows (subauroral polarization streams or SAPS), but they are more pronounced and latitudinally narrow when STEVE appears. STEVE lacks energetic particle precipitation from space.
While STEVE gained attention through recent citizen scientist photographs, a similar phenomenon was reported in historical observations of the night sky. One of the most well-documented STEVE-like events was seen on the evening of 11 September 1891 across Ireland and the United Kingdom. It was reported as “a rare phenomenon” in a series of letters in Nature as summarized in Table 1. Wilson (1891) described the emission as “a luminous band stretching from the eastern horizon to the west … like a straight tail of a large comet.” A number of readers responded to his letter and reported their observations. This emission band was characterized by its white color (Rix, 1891) and southward drift (Dreyer, 1891), and it occurred during a magnetic disturbance (Tuckwell, 1891). It also involved short-lasting (10–15 s) rays (Marshall, 1891). These emission characters are distinctly different from regular auroral emissions and strikingly similar to STEVE. The observations were spread across ∼500 km in clear skies and did not appear on the next day, excluding the possibility of other types of lights. The interaction among the journal readers is analogous to the lively communication about STEVE sightings on social media in the modern era. The review by Bailey et al., (2018) documented an extensive list of STEVE-like emissions that were found in historical records dating back to the 18th century or even earlier. Hunnekuhl and MacDonald (2020) described the work by Stormer (1935), who observed STEVE-like emissions and recognized them as feeble homogeneous arcs.

TABLE 1. Nearly simultaneous observations of the STEVE-like “rare phenomenon” in the evening of 11 September 1891.
The following sections review more properties of STEVE and the picket fence and discuss outstanding unsolved issues about these phenomena. Readers are also encouraged to refer to the review papers by Gallardo-Lacourt et al., (2021) and Lyons et al., (2021) about the current understanding of STEVE.
2 Occurrence characteristics
As mentioned above, STEVE is most frequently observed in equinoxes (Gallardo-Lacourt et al., 2018). Although the occurrence statistics have not been normalized by total observation times, their results can be perceived as an equinox preference of STEVE, considering that observation times during equinoxes and winter are comparable. Many citizen scientists and general public watch the night sky in the winter, but reports of STEVE during the winter are much more limited. This seasonal dependence raises a question: why does STEVE occur preferentially in spring and fall?
Substorms are generally stronger during equinoxes (Tanskanen et al., 2011), due to Earth’s dipole tilt being closer to the Parker spiral of the interplanetary magnetic field (IMF) (Russell and McPherron, 1973). However, the difference in the substorm strength between equinoxes and winter is small (∼10%), and substorms occur more frequently during winter. The substorm occurrence characteristics do not explain the large contrast in the occurrence of STEVE between equinoxes and winter.
STEVE is closely associated with intense SAID and SAID tend to occur more often during equinoxes (He et al., 2014). The dusk side occurrence of SAID in the region of the downward field-aligned currents to the subauroral ionosphere could explain the dusk side preference of STEVE (see Section 5 on the mechanism). Thus, the equinox preference of SAID would be linked to the seasonal dependence of STEVE. However, the question remains as to why SAID are more common during equinoxes. Since SAID are closely associated with low conductance in the subauroral ionosphere, ionospheric structures may play a role in the seasonal dependence of SAID and STEVE.
In addition to the seasonal dependence, it is not understood whether STEVE has any longitudinal or hemispheric asymmetry. Observer locations and sky conditions pose a difficulty in comparing occurrence characteristics between regions. Space-based observations are necessary to answer these questions.
As Wilson (1891) recognized, another important characteristic of STEVE is that it is a rare phenomenon. STEVE tends to occur during moderate-to-large substorms under a weakly southward IMF (Gallardo-Lacourt et al., 2018). However, although SAID also favor a southward IMF, SAID strength and occurrence do not correlate with IMF Bz, By, storm strength, or substorm strength (Nishimura et al., 2022a). Many substorms can occur under a weakly southward IMF and without STEVE. It is puzzling why STEVE occurs only for a small number of substorms and why STEVE does not appear to require unique solar wind or geomagnetic conditions. The imaging of the auroral oval suggests that the substorm auroral surge during STEVE expands far duskward, while the substorm surge without STEVE stays till pre-midnight (Nishimura et al., 2020b). These works showed that substorms with STEVE inject more electrons to the dusk side inner magnetosphere and create stronger subauroral flows.
During the STEVE event in Figure 2, Time History of Events and Macroscale Interactions during Substorms (THEMIS) satellites were located in the dusk side magnetosphere. Figures 3A–D show selected mosaics of THEMIS all-sky imagers (ASIs). An auroral intensification started around 23 h MLT and 2:46 UT (Figure 3A). It rapidly moved duskward, crossed the footprint of THEMIS-D (Figure 3B) and even reached <19 h MLT (Figure 3C). STEVE appeared soon after the auroral surge that passed that region (Figure 3C). Figure 3D shows the snapshot near the end of STEVE at 3:16 UT, when the photograph in Figure 2 was taken near the region of the STEVE observation in the THEMIS ASI. The IMF Bz was mostly negative and AL and SYM-H were moderately elevated for many hours around this STEVE (Figures 3E–G). The auroral intensification at 2:46 UT was associated with a dipolarization (Figure 3H), flow burst (Figure 3I), and injection (Figures 3J, K) at THEMIS-D and an enhancement in |AL| (Figure 3F), marked by the vertical line. Interestingly, the strengths of those parameters during this auroral intensification were comparable to those for the other injections that are seen in this figure (at 0:20, 1:50, and 4:20 UT). The IMF and SYM-H also did not show any unique features for the 2:46 UT event. The only exception is the electron injection strength. The electron flux above a few tens of keV for the 2:46 UT event was substantially higher than that for the other injections (Figure 3K). This event supports the finding by Nishimura et al., (2020b) that the strong electron injection to the dusk side magnetosphere could be the driver for intense subauroral flows and STEVE. There may be special yet unknown conditions why the substorm energy release in the magnetotail occurs far away from midnight and transports energetic electrons more efficiently to the pre-midnight inner magnetosphere. It is important to understand what coupling processes in the global solar wind−magnetosphere−ionosphere system control the azimuthal progression of substorms, injection locations, and the development of subauroral flows.
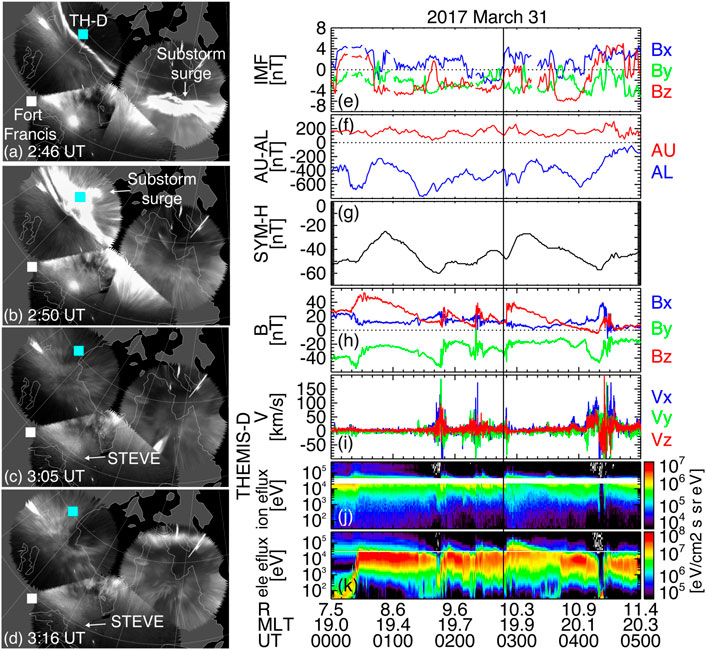
FIGURE 3. (A–D) THEMIS ASI mosaics at four selected times during the STEVE event in Figure 2. The white and cyan squares indicate the location of Fort Francis and the footprint of THEMIS-D. (E–G) OMNI IMF, AU and AL, and SYM-H. (H–K) THEMIS-D observations of the magnetic field, velocity, ion flux, and electron flux. The vertical line marks the initiation of the injection soon before STEVE (the ion injection first and then the electron injection and dipolarization).
3 Fine-scale structures of STEVE
STEVE, in some images, appears as a homogeneous arc with little structure along the arc [e.g., Archer et al., 2019b; Martinis et al., 2022; Parnikov et al., 2022]. Wilson (1891) and Stormer (1935) perceived STEVE-like emissions as a luminous band such as a comet tail and homogeneous arc. The high-altitude portion of STEVE in the right panel of Figure 1 is another example of a homogeneous arc. However, citizen scientist photographs have also revealed that STEVE has rich fine-scale structures within the arc. The photograph in Figure 4 shows that STEVE has ray structures, and the rays of STEVE are connected to individual rays of the picket fence. The low-altitude portion of the STEVE in Figure 1 also shows a similar connection to the picket fence. A number of STEVE photographs also show similar fine-scale structures along STEVE [e.g., MacDonald et al., 2018; Nishimura et al., 2019; Mende et al., 2019]. The fine-scale structures of STEVE drift westward along the arc, and the speed seems to correspond to the intense SAID flow speed (Gillies et al., 2020). The exposure time may affect the detectability of fine-scale structures in photographs, but the photographs by Martinis et al. (2022) and Figures 1 and 4, have similar exposure times (10, 13, and 10 s). There may also be conditions in the magnetosphere−ionosphere system that create fine-scale structures of STEVE. The presence of fine-scale structures raises questions about what the elementary structures of STEVE are and what mechanisms create the fine-scale structures of STEVE. There may also even be finer-scale structures that may be missed in photographs with exposure times longer than several seconds. High-speed imaging observations are necessary to identify what these elementary structures of STEVE are.
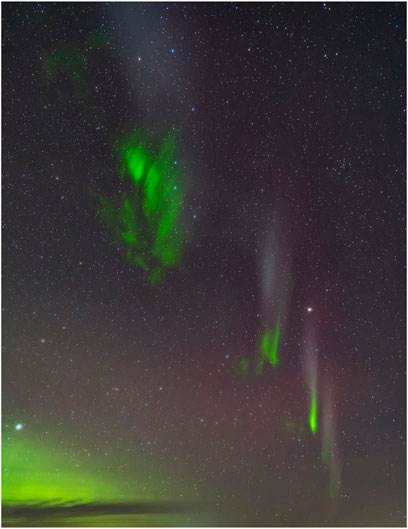
FIGURE 4. Photograph that was taken at 6:49 UT on 14 March 2021 in Strathmore, Canada. STEVE shows ray structures, and each ray of STEVE is connected to each ray of the picket fence. The north is to the left. The green diffuse emission to the north of STEVE is the diffuse aurora in the auroral oval. The exposure time is 10 s.
Figure 5 shows the evolution of the STEVE event of Figure 4 using the Transition Region Explorer (TREx) true color imager and spectrograph observations at Lucky Lake, Canada. STEVE appeared at around 6:10 UT and was illuminated at all wavelengths shown in Figures 5G–J, including the airglow continuum. It was initially a homogeneous arc in the purple/mauve color without the picket fence (Figure 5A). After ∼6:20 UT, the arc moved equatorward and the bottom part of the arc showed wave-like fine-scale structures as highlighted by the white arrows (Figure 5B). In keograms, fine-scale structures appear as the periodic modulation of the STEVE intensity (Figures 5H, J). This temporal variation at a fixed longitude occurs because fine-scale structures of STEVE drift westward. The fine-scale structures are tilted westward with an increasing altitude, which apparently starts first at higher latitudes in the keogram format. The azimuthal wavelength of fine-scale structures became shorter as time progressed (Figure 5C). After 6:43 UT, the picket fence appeared adjacent to (at a lower altitude) the bright parts of STEVE (Figure 5D). The picket fence can be seen as a nearly pure 557.7 nm intensification (Figure 5H). The picket fence became brighter and extended to lower altitudes, while it maintained the connection to the bright parts of STEVE, and a group of green rays developed under each bright part of STEVE (Figure 5E). The western (right) portion of Figure 5F corresponds to the citizen scientist photograph taken at Strathmore, about 500 km to the west of Lucky Lake. While STEVE that is highlighted by the right three arrows in this image was nearly aligned with the picket fence, STEVE that is highlighted by the left two arrows was shifted to the west of the picket fence. In the sequence of images, the trailing edge of STEVE was connected to the picket fence but the leading edge drifted westward faster than the picket fence. STEVE and the picket fence disappeared soon after 7:00 UT. This event showed interesting developments of the fine-scale structures of STEVE, the initiation of the picket fence, and the connection between the fine-scale structures of STEVE and the picket fence. It raises questions about how wave-like fine-scale structures of STEVE form and how they give rise to the picket fence. More observations about the evolution of STEVE and the picket fence are needed to understand how those emissions evolve over time and how they are related to each other.
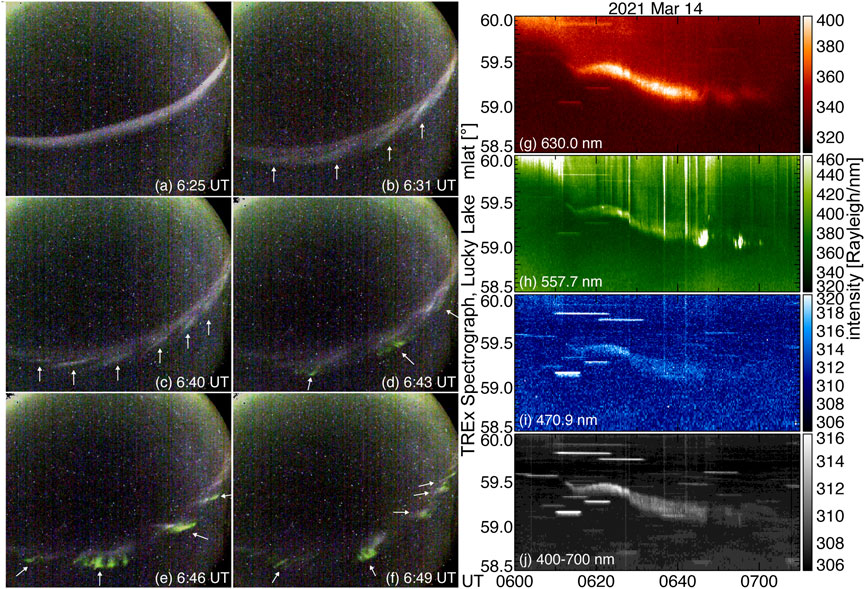
FIGURE 5. (A–F) TREx ASI images in Lucky Lake at six selected times during the STEVE event in Figure 4. The arrows indicate fine-scale structures of STEVE and the picket fence. The north is to the top. The green diffuse aurora is seen poleward of STEVE. The exposure time is 3 s. (G–J) TREx spectrograph keograms in Lucky Lake at 630.0, 557.7, and 470.9 and 400–700 nm. The horizontal streaks are stars.
4 Picket fence
Knowledge about the picket fence is more limited than that for STEVE. The picket fence typically appears with STEVE, but STEVE can appear without the picket fence. As shown in Figure 2, there are moments when the picket fence can be present without STEVE. Both STEVE and the picket fence drift westward, but the picket fence is substantially slower (Gillies et al., 2020). What are the processes that determine the occurrence, drift speed, and duration of the picket fence? It is also unclear what conditions set the wavelength of the picket fence.
Another peculiar appearance of the picket fence is that the picket fence can be localized to a small portion of STEVE. While the picket fence typically forms an arc with many rays, the photograph in Figure 6 shows that the picket fence can consist only of a few rays, despite that STEVE is much more extended. It is a challenge to explain what mechanisms can confine the picket fence to a small portion of STEVE. STEVE in this photograph has a small kink near the picket fence. A distortion of the SAID flow channel or trough density gradients may play a role in the formation of the picket fence. It is important to determine flow and density structures along STEVE in order to understand how the picket fence forms.
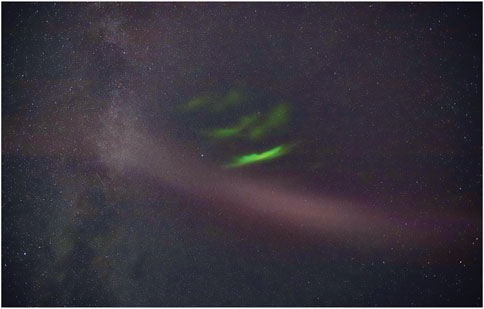
FIGURE 6. STEVE photograph taken at 5:08 UT on 23 July 2022 in Fort Frances, Canada. The picket fence is seen but only in a limited portion of STEVE. The north is to the top. The green diffuse emission to the north of STEVE is the diffuse aurora in the auroral oval. The exposure time is 4 s.
Although the picket fence was originally recognized as periodic ray structures (in an analogy to the pickets of a fence), high-speed imaging showed that the picket fence also has fine-scale structures (Semeter et al., 2020). The picket fence can have wave-like modulation, and the picket fence can have green streaks appearing below it. While the picket fence drifts westward along STEVE, the green streaks appear poleward of STEVE and drift toward STEVE. The picket fence in Figure 4 shows such streaks underneath and poleward of the picket fence. The picket fence may be a time-aliased form of more dynamic emission structures, and a simple notion of ray structures (i.e., pickets) may not correctly represent the actual form of the green emission. High-speed imaging is important to resolve the true structure and evolution of the picket fence. The 3D structure of each green emission, including the wavelength and alignment to the magnetic field, should also be determined.
How the magnetosphere plays a role in the generation of the picket fence is another important question. Although the green ray structure resembles rayed auroral arcs that are created by energetic electrons precipitating from the magnetosphere, so far there is no consensus about whether electron precipitation is involved in the picket fence. Several works support the precipitation hypothesis. Low-altitude satellite observations show energetic electrons when the picket fence is present (Nishimura et al., 2018). The altitude profile of the green emission can be explained by the energetic electron precipitation (Bennett and Bourassa, 2021). A simulation of the feedback instability indicates that electrons are accelerated along magnetic field lines and create a wave structure along STEVE (Mishin and Streltsov, 2019; 2022). On the other hand, the picket fence has a minimal
5 Chemistry and emission mechanisms
The characteristic features of STEVE in the ionosphere are the extreme flow velocity and heating in the subauroral region that generally lacks precipitation over STEVE. This unique state of the ionosphere seems to be the condition for the formation of STEVE. The continuum emission of STEVE led to a hypothesis that the STEVE emission arises from the reaction between
6 Ionosphere−thermosphere dynamics
Extreme temperature enhancements are a characteristic feature of STEVE. The extreme flow velocity could be related to the heating, but a simulation by Liang et al. (2021) showed that frictional heating alone does not explain the extreme electron temperature. Another heat source such as heat fluxes from the magnetosphere is required, but because of the difficulty of measuring heat fluxes, it is not known how large the heat fluxes over STEVE are. Enhanced heat fluxes are also thought to be the source of stable auroral red (SAR) arcs, another type of subauroral emission that is dominated by the red color, but what mechanisms distinguish the nature of heating between STEVE and SAR arcs are not understood (see also the next section).
The extreme velocity also brings a challenge to simulating ionosphere−thermosphere dynamics. An intense SAID velocity of ∼5 km/s corresponds to ∼1 eV (or ∼11,600 K) energy of
The extreme velocity and heating of the ionosphere during STEVE have substantial impacts on ionospheric dynamics. The F-region plasma density decreases with the flow speed due to enhanced collisions between
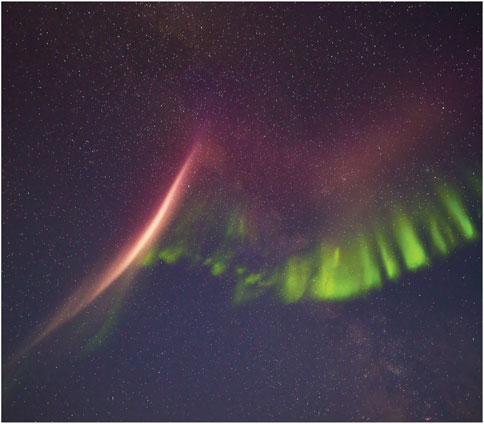
FIGURE 7. STEVE photograph taken at 2:19 UT on 2 September 2016 in Fort Frances, Canada. The picket fence is seen but only in a limited region of STEVE. The north is to the top. The exposure time is 2.5 s.
Steep density gradients also impact radio wave propagation. High-frequency (HF) radio-wave backscatter echoes have been shown to increase (Nishimura et al., 2020b) or disappear (Perry et al., 2022) in association with STEVE. The two different outcomes suggest the complex radio wave propagation at the density trough. Radio waves at higher frequencies such as GHz waves for the global navigation satellite system (GNSS) may also be affected by density irregularities that develop at steep trough density gradients. Simulations of the density irregularity formation and radio wave propagations are required to understand the impact of steep trough density gradients on radio communication.
STEVE could also impact thermosphere dynamics. A neutral wind shear has been observed to develop around STEVE (Liang et al., 2021b). Heating in SAPS has been shown to be the source of the traveling atmospheric disturbance (TAD) (Guo et al., 2018). The extreme heating in STEVE may drastically change the thermospheric pressure and wind pattern. Thermospheric simulations under the presence of extreme flow velocity and heating should be conducted to understand how the thermospheric dynamics change under such conditions.
7 Relation to SAR arcs and the subauroral proton aurora
In addition to STEVE, SAR arcs and the subauroral proton aurora are major optical emissions in the pre-midnight subauroral ionosphere. Traditionally, the three types of subauroral emissions are often studied separately, and their relations are not well known. Limited investigations have shown that STEVE can occur after the proton aurora (Nishimura et al., 2020b) and that a SAR arc can transition to STEVE (Martinis et al., 2022). Subauroral emissions are not exclusive to each other, but STEVE and a SAR arc can be adjacent to each other simultaneously (Liang et al., 2019; Chu et al., 2019; Martinis et al., 2021). The proton aurora and red arc that transitions to a SAR arc later have also been reported to co-exist during substorms (Nishimura et al., 2022b). However, STEVE was not detected in these events.
Similar to STEVE, SAR arcs and the proton aurora occur during storms and substorms, and they are related to particle injections to the inner magnetosphere and fast plasma flows in the subauroral ionosphere. Despite the similarities, the three types of emissions generally occur separately, and it is not understood how the system controls the occurrence of the three types of emissions under similar magnetosphere−ionosphere conditions. The transition between the two types of emissions indicates that driving conditions for the two types of emissions can switch from one to the other during a substorm, e.g., the SAPS flow speed increases and becomes narrower during the transition from the proton aurora or a SAR arc to STEVE. The simultaneous existence of STEVE and a SAR arc suggests that an intense SAID and weaker SAPS flow channels are located adjacent to each other. Observations of the time evolution of flow and particle structures are required to address what magnetosphere−ionosphere conditions change during the emission transition.
8 Conclusion
This paper reviewed the key properties of STEVE and the picket fence and discussed major open questions that need to be addressed to advance the understanding of these phenomena. Although the understanding of STEVE and the picket fence has rapidly progressed over the past few years, a number of important issues have not been addressed. STEVE should be placed in the context of the subauroral magnetosphere−ionosphere−thermosphere coupled system. The system-level behavior needs to be understood in order to address questions about STEVE occurrence conditions and substorm development, particularly the behavior of the electron injection during STEVE and the relation to SAR arcs and the proton aurora. Ionosphere−thermosphere modelings that consider extreme velocity and heating should be conducted to answer what chemical and dynamical processes occur and how much the STEVE luminosity can be explained. The modeling of instabilities is also required to understand how fine-scale structures of STEVE and the picket fence form. High-resolution observations are required to resolve fine-scale structures of STEVE and the picket fence, and such observations are important to understand the underlying processes in the ionosphere and thermosphere.
Data availability statement
Publicly available datasets were analyzed in this study. These data can be found as follows: photographs by AD and LK are posted at https://www.facebook.com/AlanDyerAmazingSky and https://watcheroftheskies.ca. THEMIS and TREx data are available at themis.ssl.berkeley.edu and http://data.phys.ucalgary.ca/. Data processing used SPEDAS-V3.1 [Angelopoulos et al., 2019].
Author contributions
YN conducted the study and wrote the whole manuscript. He also created Figures 3 and 5. AD provided the photographs for Figures 1 and 4. LK provided the photographs for Figures 2, 6, and 7. VA provided THEMIS satellite data. ED provided THEMIS and TREx ground-based observation data.
Funding
This work was supported by the NASA grants 80NSSC18K0657, 80NSSC20K0604, 80NSSC20K0725, 80NSSC21K1321, 80NSSC22K0323, and 80NSSC22M0104; NSF grants AGS-1907698 and AGS-2100975; and AFOSR grant FA9559-16-1-0364. THEMIS is supported by NASA NAS5-02099 and the Canada Foundation for Innovation.
Acknowledgments
The authors thank ISSI/ISSI-BJ for supporting the “Multi-Scale Magnetosphere-Ionosphere-Thermosphere Interaction” team and the STEVE workshop supported by the NSF for useful discussions with the participants.
Conflict of interest
The authors declare that the research was conducted in the absence of any commercial or financial relationships that could be construed as a potential conflict of interest.
Publisher’s note
All claims expressed in this article are solely those of the authors and do not necessarily represent those of their affiliated organizations, or those of the publisher, the editors, and the reviewers. Any product that may be evaluated in this article, or claim that may be made by its manufacturer, is not guaranteed or endorsed by the publisher.
References
Anderson, J., and Anderson, J. (2021). A pas de Deux with aurora and steve. J. R. Astronomical Soc. Can. 115 (4), 152.
Angelopoulos, V., Cruse, P., Nishimura, Y., Drozdov, A., HatzigeorgiuN., , King, D. A., et al. (2019). The space Physics environment data analysis system (SPEDAS). Space Sci. Rev. 215, 9. doi:10.1007/s11214-018-0576-4
Archer, W. E., St.- Maurice, J.-P., Gallardo-Lacourt, B., Perry, G. W., Cully, C. M., Donovan, E., et al. (2019). The vertical distribution of the optical emissions of a Steve and Picket Fence event. Geophys. Res. Lett. 46, 10719–10725. doi:10.1029/2019gl084473
Archer, W. E., Gallardo-Lacourt, B., Perry, G. W., St.-Maurice, J.-P., Buchert, S. C., and Donovan, E. F. (2019). Steve: The optical signature of intense subauroral ion drifts. Geophys. Res. Lett. 46, 6279–6286. doi:10.1029/2019gl082687
Bailey, M., Byrne, C., Nezic, R., Asher, D., and Finnegan, J. (2018). Historical observations of STEVE. Observatory 138, 227–245.
Bennett, C. L., and Bourassa, N. (2021). Improved analysis of STEVE photographs. J. Geophys. Res. Space Phys. 126, e2020JA027843. doi:10.1029/2020ja027843
Chu, X., Malaspina, D., Gallardo-Lacourt, B., Liang, J., Andersson, L., Ma, Q., et al. (2019). Identifying STEVE's magnetospheric driver using conjugate observations in the magnetosphere and on the ground. Geophys. Res. Lett. 46, 12665–12674. doi:10.1029/2019gl082789
Gallardo-Lacourt, B., Nishimura, Y., Donovan, E., Gillies, D. M., Perry, G. W., Archer, W. E., et al. (2018). A statistical analysis of STEVE. J. Geophys. Res. Space Phys. 123, 9893–9905. doi:10.1029/2018ja025368
Gallardo-Lacourt, B., Frey, H. U., and Martinis, C. (2021). Proton aurora and optical emissions in the subauroral region. Space Sci. Rev. 217 (1), 10. doi:10.1007/s11214-020-00776-6
Gillies, D. M., Donovan, E., Hampton, D., Liang, J., Connors, M., Nishimura, Y., et al. (2019). First observations from the TREx Spectrograph: The optical spectrum of STEVE and the Picket Fence phenomena. Geophys. Res. Lett. 46, 7207–7213. doi:10.1029/2019gl083272
Gillies, D. M., Liang, J., Donovan, E., and Spanswick, E. (2020). The apparent motion of STEVE and the Picket Fence phenomena. Geophys. Res. Lett. 47, e2020GL088980. doi:10.1029/2020gl088980
Guo, J.-P., Deng, Y., Zhang, D.-H., Lu, Y., Sheng, C., and Zhang, S.-R. (2018). The effect of subauroral polarization streams on ionosphere and thermosphere during the 2015 St. Patrick's Day storm: Global ionosphere-thermosphere model simulations. J. Geophys. Res. Space Phys. 123, 2241–2256. doi:10.1002/2017ja024781
Harding, B. J., Mende, S. B., Triplett, C. C., and Wu, Y.-J. J. (2020). A mechanism for the STEVE continuum emission. Geophys. Res. Lett. 47, e2020GL087102. doi:10.1029/2020gl087102
He, F., Zhang, X.-X., and Chen, B. (2014). Solar cycle, seasonal, and diurnal variations of subauroral ion drifts: Statistical results. J. Geophys. Res. Space Phys. 119, 5076–5086. doi:10.1002/2014ja019807
Hunnekuhl, M., and MacDonald, E. (2020). Early ground-based work by auroral pioneer Carl Størmer on the high-altitude detached subauroral arcs now known as “STEVE”. Space weather. 18, e2019SW002384. doi:10.1029/2019sw002384
Liang, J., Donovan, E., Connors, M., Gillies, D., St-Maurice, J. P., Jackel, B., et al. (2019). Optical spectra and emission altitudes of double-layer STEVE: A case study. Geophys. Res. Lett. 46, 13630–13639. doi:10.1029/2019gl085639
Liang, J., St-Maurice, J. P., and Donovan, E. (2021). A time-dependent two-dimensional model simulation of lower ionospheric variations under intense SAID. J. Geophys. Res. Space Phys. 126, e2021JA029756. doi:10.1029/2021ja029756
Liang, J., Zou, Y., Nishimura, Y., Donovan, E., Spanswick, E., and Conde, M. (2021). Neutral wind dynamics preceding the STEVE occurrence and their possible preconditioning role in STEVE formation. J. Geophys. Res. Space Phys. 126, e2020JA028505. doi:10.1029/2020ja028505
Lyons, L., Gallardo-Lacourt, B., and Nishimura, Y. (2021). “Auroral structures: Revealing the importance of meso-scale M-I coupling,” in Multi-scale magnetosphere-ionosphere-thermosphere coupling chapter 2. Editors Y. Nishimura, Y. Deng, O. Verkhoglyadova, and S. Zhang (Elsevier), 65–101.
MacDonald, E. A., Donovan, E. F., Nishimura, Y., Case, N. A., Gillies, D. M., Gallardo-Lacourt, B., et al. (2018). New science in plain sight: Citizen scientists lead to the discovery of optical structure in the upper atmosphere. Sci. Adv. 4 (3), eaaq0030. doi:10.1126/sciadv.aaq0030
Martinis, C., Griffin, I., Gallardo-Lacourt, B., Wroten, J., Nishimura, Y., Baumgardner, J., et al. (2022). Rainbow of the night: First direct observation of a SAR arc evolving into STEVE. Geophys. Res. Lett. 49, e2022GL098511. doi:10.1029/2022gl098511
Martinis, C., Nishimura, Y., Wroten, J., Bhatt, A., Dyer, A., Baumgardner, J., et al. (2021). First simultaneous observation of STEVE and SAR arc combining data from citizen scientists, 630.0 nm all-sky images, and satellites. Geophys. Res. Lett. 48, e2020GL092169. doi:10.1029/2020gl092169
Mende, S. B., Harding, B. J., and Turner, C. (2019). Subauroral green STEVE arcs: Evidence for low-energy excitation. Geophys. Res. Lett. 46, 14256–14262. doi:10.1029/2019gl086145
Mishin, E., and Streltsov, A. (2022). On the kinetic theory of subauroral arcs. J. Geophys. Res. Space Phys. 127, e2022JA030667. doi:10.1029/2022JA030667
Mishin, E., and Streltsov, A. (2019). STEVE and the picket fence: Evidence of feedback-unstable magnetosphere-ionosphere interaction. Geophys. Res. Lett. 46, 14247–14255. doi:10.1029/2019gl085446
Nishimura, Y., Bruus, E., Karvinen, E., Martinis, C. R., Dyer, A., Kangas, L., et al. (2022). Interaction between proton aurora and stable auroral red arcs unveiled by citizen scientist photographs. J. Geophys. Res. Space Phys. 127, e2022JA030570. doi:10.1029/2022ja030570
Nishimura, Y., Donovan, E. F., Angelopoulos, V., and Nishitani, N. (2020). Dynamics of auroral precipitation boundaries associated with STEVE and SAID. J. Geophys. Res. Space Phys. 125, e2020JA028067. doi:10.1029/2020ja028067
Nishimura, Y., Gallardo-Lacourt, B., Zou, Y., Mishin, E., Knudsen, D. J., Donovan, E. F., et al. (2019). Magnetospheric signatures of STEVE: Implications for the magnetospheric energy source and interhemispheric conjugacy. Geophys. Res. Lett. 46, 5637–5644. doi:10.1029/2019gl082460
Nishimura, Y., Hussein, A., Erickson, P. J., Gallardo-Lacourt, B., and Angelopoulos, V. (2022). Statistical study of magnetospheric conditions for SAPS and SAID. Geophys. Res. Lett. 49, e2022GL098469. doi:10.1029/2022gl098469
Nishimura, Y., Yang, J., Weygand, J. M., Wang, W., Kosar, B., Donovan, E. F., et al. (2020). Magnetospheric conditions for STEVE and SAID: Particle injection, substorm surge, and field-aligned currents. J. Geophys. Res. Space Phys. 125, e2020JA027782. doi:10.1029/2020ja027782
Parnikov, S. G., Ievenko, I. B., and Koltovskoi, I. I. (2022). Subauroral luminosity STEVE over yakutia during a substorm: Analysis of the event of March 1, 2017. Geomagnetism Aeronomy 62, 434–443. doi:10.1134/s0016793222030136
Perry, G., Gallardo-Lacourt, B., Archer, W., and Shepherd, S. G. (2022). SuperDARN observations of STEVE. Boulder, CO: URSI National Radio Science Meeting. doi:10.13140/RG.2.2.30940.05762
Rathod, C., Srinivasan, B., and Scales, W. (2021). Modeling the dominance of the gradient drift or Kelvin–Helmholtz instability in sheared ionospheric E × B flows. Phys. Plasmas 28, 052903. doi:10.1063/5.0047807
Russell, C. T., and McPherron, R. L. (1973). Semiannual variation of geomagnetic activity. J. Geophys. Res. 78 (1), 92–108. doi:10.1029/ja078i001p00092
Schunk, R. W., Raitt, W. J., and Banks, P. M. (1975). Effect of electric fields on the daytime high-latitude E and F regions. J. Geophys. Res. 80 (22), 3121–3130. doi:10.1029/ja080i022p03121
Semeter, J., Hunnekuhl, M., MacDonald, E., Hirsch, M., Zeller, N., Chernenkoff, A., et al. (2020). The mysterious green streaks below STEVE. AGU Adv. 1, e2020AV000183. doi:10.1029/2020av000183
Størmer, C. (1935). Remarkable aurora-forms from southern Norway. I, Feeble homogeneous arcs of great altitude. Geofys. Publiskasjoner 11 (5).
Tanskanen, E. I., Pulkkinen, T. I., Viljanen, A., Mursula, K., Partamies, N., and Slavin, J. A. (2011). From space weather toward space climate time scales: Substorm analysis from 1993 to 2008. J. Geophys. Res. 116, A00I34. doi:10.1029/2010JA015788
Yadav, S., Shiokawa, K., Otsuka, Y., Connors, M., and St Maurice, J.-P. (2021). Multi-wavelength imaging observations of STEVE at Athabasca, Canada. J. Geophys. Res. Space Phys. 126, e2020JA028622. doi:10.1029/2020ja028622
Keywords: Strong Thermal Emission Velocity Enhancement (STEVE), picket fence, stable auroral red (SAR) arc, proton aurora, subauroral polarization streams (SAPS) and subauroral ion drifts (SAID), storms and substorms, magnetosphere−ionosphere−thermosphere coupling, THEMIS, TREx
Citation: Nishimura Y, Dyer A, Kangas L, Donovan E and Angelopoulos V (2023) Unsolved problems in Strong Thermal Emission Velocity Enhancement (STEVE) and the picket fence. Front. Astron. Space Sci. 10:1087974. doi: 10.3389/fspas.2023.1087974
Received: 02 November 2022; Accepted: 04 January 2023;
Published: 18 January 2023.
Edited by:
Michael G. Henderson, Los Alamos National Laboratory (DOE), United StatesReviewed by:
Vincent N. Génot, UMR5277 Institut de recherche en astrophysique et planétologie (IRAP), FranceKazuo Shiokawa, Nagoya University, Japan
Katie Herlingshaw, The University Centre in Svalbard, Norway
Copyright © 2023 Nishimura, Dyer, Kangas, Donovan and Angelopoulos. This is an open-access article distributed under the terms of the Creative Commons Attribution License (CC BY). The use, distribution or reproduction in other forums is permitted, provided the original author(s) and the copyright owner(s) are credited and that the original publication in this journal is cited, in accordance with accepted academic practice. No use, distribution or reproduction is permitted which does not comply with these terms.
*Correspondence: Yukitoshi Nishimura, dG9zaGkxNkBidS5lZHU=
 Yukitoshi Nishimura
 Alan Dyer2
 Lauri Kangas
 Eric Donovan
 Vassilis Angelopoulos