- 1Lockheed Martin, Solar and Astrophysics Laboratory (LMSAL), Advanced Technology Center (ATC), Palo Alto, CA, United States
- 2Armagh Observatory and Planetarium, Armagh, United Kingdom
We compare the size distributions of self-organized criticality (SOC) systems in the solar photosphere and the transition region, using magnetogram data from Helioseismic and Magnetic Imager (HMI) and Interface Region Imaging Spectrograph (IRIS) data. For each dataset we fit a combination of a Gaussian and a power law size distribution function, which yields information on four different physical processes: (i) Gaussian random noise in IRIS data; (ii) spicular events in the plages of the transition region (described by power law size distribution in IRIS data); (iii) salt-and-pepper small-scale magnetic structures (described by the random noise in HMI magnetograms); and (iv) magnetic reconnection processes in flares and nanoflares (described by power law size distributions in HMI data). We find a high correlation (CCC = 0.90) between IRIS and HMI data. Datasets with magnetic flux balance are generally found to match the SOC-predicted power law slope αF = 1.80 (for mean fluxes F), but exceptions occur due to arbitrary choices of the HMI field-of-view. The matching cases confirm the universality of SOC-inferred flux size distributions, and agree with the results of Parnell et al. (ApJ, 2009, 698, 75–82), αF = 1.85 ± 0.14.
1 Introduction
Self-Organized Criticality (SOC) is a critical state of a non-linear energy dissipation system that is slowly and continuously driven towards a critical value of a system-wide instability threshold, producing scale-free, fractal-diffusive, and intermittent avalanches with power law-like size distributions (Aschwanden, 2011). The original paradigm and characteristic behavior of SOC systems was studied from sandpile avalanches, based on the next-neighbor interactions in microscopic lattice grids (Bak et al., 1987; Bak et al., 1988; Bak 1996, Lu and Hamilton 1991), also called cellular automaton algorithms. However, alternative macroscopic models can mimic the same system behavior also, based on macroscopic power law scaling laws of correlated physical parameters. For instance, the hard X-ray flux radiated in a solar flare was found to scale with the (fractal) spatial volume of the flare. The exponentially growing instability that produces the flare predicts a well-defined power law size distribution function, which applies also to a host of other non-linear systems, such as earthquakes or stock market fluctuations, in contrast to linear systems, such as Gaussian noise. Thus, modeling of SOC systems helps us to discriminate between linear and non-linear systems. Knowledge of the correct size distributions yields us statistical predictions of the largest catastrophic events in SOC systems. Besides flaring and heating of the solar corona, we hope to obtain also new insights into nanoflaring in the atmosphere of the Quiet Sun, which we pursue here.
The atmospheric structure of the Sun consists of the photospheric layer on the solar surface, the chromosphere, the transition region, the corona, and solar wind regions, which all host different physical processes, characterized by the electron density, the electron temperature, and the magnetic field strength. In this study we sample very diverse temperature structures, from Te ≈ 5,800 K observed in photospheric magnetograms with the Helioseismic and Magnetic Imager (HMI), to Te ≈ 104–105 K, observed in Slitjaw images (SJI) of the 1,400 Å channel of IRIS, which are dominated by the Si IV 1,394 Å and 1,403 Å resonance line, and form in the transition region (Rathore and Carlsson, 2015; Rathore et al., 2015). Due to this huge temperature range, different physical processes are dominant in the various temperature regimes (Gallagher et al., 1998; Warren et al., 2016), and thus we do not know a priori whether the concept of self-organized criticality (SOC) systems (Aschwanden, 2011; Aschwanden, 2014; Aschwanden et al., 2016; McAteer et al., 2016; Warren et al., 2016) is applicable. More specifically, we want to understand the functional shapes of observed occurrence frequency (size) distributions, and whether they exhibit power law function (slopes) with universal validity in different temperature and wavelength regimes.
There is an ongoing debate on the functional form of size distributions in avalanching SOC processes, such as: a power law function, a log-normal distribution (Verbeeck et al., 2019), a Pareto distribution (Hosking and Wallis, 1987), a Lomax distribution (Lomax, 1954; Giles et al., 2011), or a Weibull distribution (Weibull, 1951), for instance. Since all these functional forms are close to a power law function on the right-hand side of the size distribution, which is also called the “fat-tail”, various linear combinations of these functional forms have been found to fit the observed size distributions with comparable accuracy (Munoz-Jaramillo et al., 2015). In this study we use a combination of (Gaussian) incoherent random and (power law-like) coherent random structures. Gaussian statistics reflect the operation of a memoryless stationary (incoherent) random process; while avalanching (coherent) processes such as occurring in SOC systems are characterized by extended spatial and temporal correlations (i.e., the unfolding of an avalanche is influenced by the imprint of earlier avalanches on the system; see Jensen, 1998, chapter 2).
Here, the incoherent component describes the Gaussian noise (visible in IRIS data), as well as the salt-and-pepper structure (visible in HMI magnetograms). On the other side, the coherent noise of the power law component may be produced by the spicular dynamics (visible in IRIS data), or by magnetic reconnection dynamics of small-scale features and nanoflares (visible in HMI magnetograms). Gaussian noise distributions have been tested with Yohkoh soft X-ray data (Katsukawa and Tsuneta, 2001). Log-normal distributions, which are closest to our Gaussian-plus-power-law method used here, have been previously studied for Quiet-Sun FUV emission (Fontenla et al., 2007), solar flares (Verbeeck et al., 2019), the solar wind (Burlaga and Lazarus, 2000), accretion disks (Kunjaya et al., 2011), and are discussed also in Ceva and Luzuriaga (1998), Mitzenmacher (2004), and Scargle (2020).
A new aspect of this study is the invention of a single-image algorithm to derive “pixelized” size distributions
The content of this paper includes data analysis (Section 2), a discussion (Section 3), and conclusions (Section 4).
2 Data analysis
When we observe solar emission at near ultra-violet (NUV) and far ultra-violet (FUV) wavelengths, we may gather photons from spicules in plages in the transition region (at formation temperatures of Te ≈ 104–105). In order to study both coherent and incoherent processes, we have to deal with multiple size distribution functions, including incoherent random (Gaussian) noise, as well as coherent avalanche processes with power law-like distribution functions, also known as “fat-tail” distribution functions, which occur natually in self-organized criticality (SOC) systems.
2.1 Definitions of flux distributions
In the following we attempt to model event statistics with a combination of (i) a Gaussian distribution (originating from incoherent random processes), and (ii) a power law distribution, e.g., created by spicular activity in the transition region, (Figure 1). The Gaussian noise is defined in the standard way,
where F is the flux averaged over the duration of an event (measured here at a wavelength of 1,400 Å), N(F) is the histogram of observed structures, F0 is the mean value, σF is one standard deviation, and N0 is the normalized number of events.
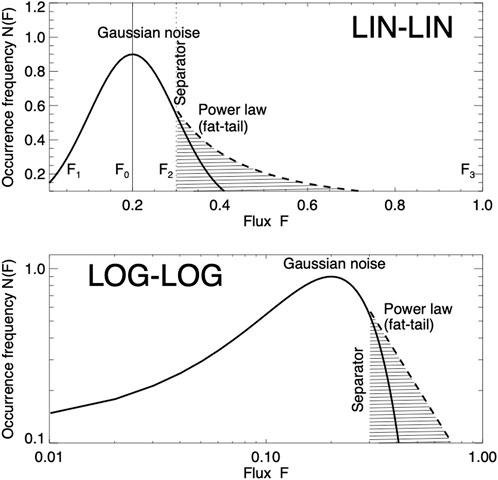
FIGURE 1. A schematic of the two size distributions is shown: a Gaussian function for the incoherent random statistics, and a power law function (also called fat-tail) for the statistics of coherent avalanche events, separated at a critical value F2. The upper panel shows a linear (LIN-LIN) representation, the lower panel a logarithmic (LOG-LOG) representation.
The second distribution we use in our analysis is a power law distribution function, which is defined in the simplest way by,
where αF is the power law slope of the relevant part of the distribution function.
The flux FIRIS of an IRIS pixel is defined by,
where f is the observed flux in [DN] (data number per second), Eλ is the energy of the photon, k is the factor that converts the DN to the number of photons, Ω is the pixel size in units of steradians, A [cm2] is the effective area of IRIS, and the unrelated background is subtracted (Vilangot Nhalil et al., 2020).
2.2 Pixelized method of size distribution
In this study we use a “pixelized” size distribution method that is more efficient and easier to calculate than standard size distributions. The standard method to sample size distributions N(F) of SOC avalanches is generally carried out by an algorithm that detects fluxes of an avalanche event above some given threshold F > Fthr, traces its spatial A(t) and temporal evolution F(t), and infers the size of an avalanche from the spatio-temporal evolution after saturation. Such avalanche detections have been accomplished for 12 IRIS datasets in the study of Vilangot Nhalil et al., 2020. Because the development of an automated feature recognition code is a complex and a time-consuming task, which needs extensive testing, we explore here a new method that is much simpler to apply and requires much less data to determine the underlying power law slope αF.
We can parameterize a pixelized IRIS image with a Cartesian grid, i.e.,
where the avalanche areas Ak are required to be non-overlapping, but area-filling. Areas without significant avalanche structures,
In our new method we decompose the flux
Adding the areas A and fluxes
which can be set equal to the value of
As a caveat, we have to be aware that the method determines size distribution from a single image. If the used 2-D image is not representative, additional 2-D images need to be included.
The new pixelation method is used in the calculations of the values
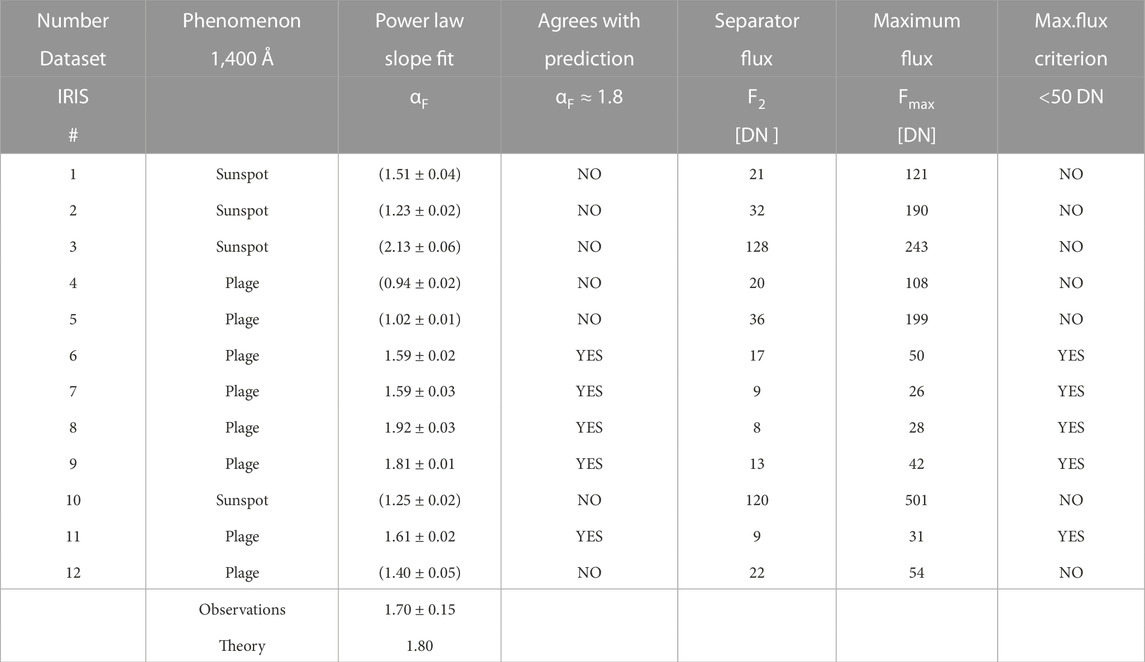
TABLE 1. Results of 12 datasets obtained with IRIS 1,400 Å: the power law slope αF of the flux distribution, the separator flux F2, and the maximum flux Fmax. Note that the power law slope αF agrees with the theoretical prediction of αF = 9/5 = 1.8 in 5 cases, whenever there is no sunspot and the maximum flux Fmax amounts to less than a critical value of Fmax ≲ 50 DN. The values αF in parenthesis are ignored in the calculation of the averages (second-last line).
2.3 Analysis of IRIS data
The 12 analyzed 1,400 Å SJI images F(x, y) of IRIS are shown in Figure 2, which are identical in time and FOV (field-of-view) with those of Vilangot Nhalil et al., 2020, and are also identical with those used in the study on fractal dimension measurements (Aschwanden and Vilangot Nhalil, 2022). Note that events #6 and #7; are almost identical, except for a time difference of 20 min, which can be used for stability tests.
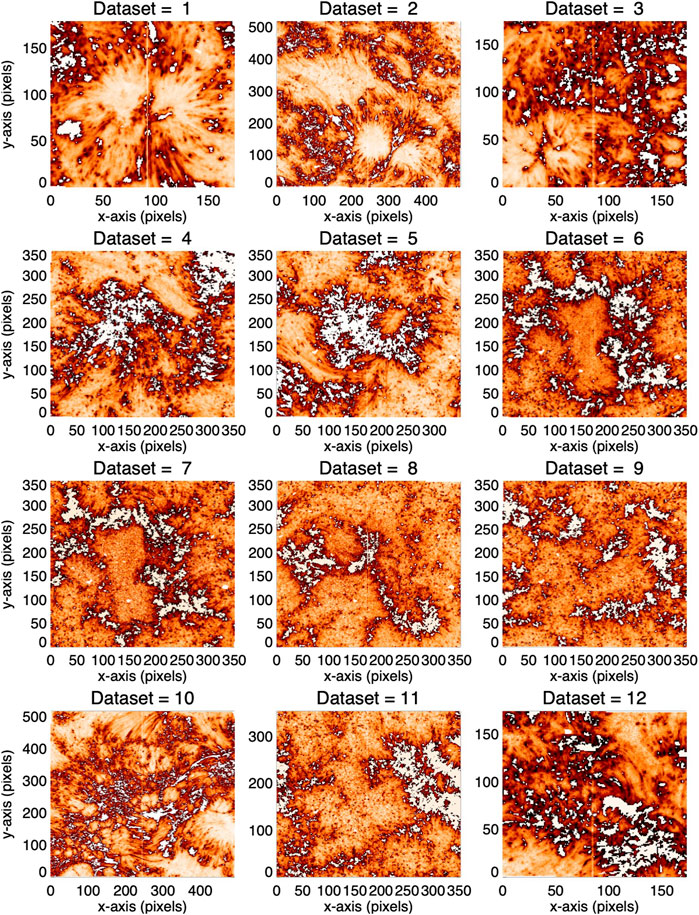
FIGURE 2. Intensity maps of 12 different active regions and Quiet-Sun regions, observed with IRIS SJI 1400 Å. Gaussian random noise is rendered in orange-to-red color, while spicules and network cells are masked out with white color.
The 12 IRIS maps shown in Figure 2 have the following color code: The Gaussian distribution with values F(x, y) < Fthr below a threshold of Fthr is rendered with orange-to-red colors, while the power law function with the fat-tail F(x, y) > Fthr is masked out with white color. In other words, all the orange-to-red regions in the IRIS maps visualize the locations of incoherent random noise while the white regions mark the location of SOC-driven coherent avalanches (probably produced by spicular dynamics in the transition region). An even crispier representation of the spicular component F(x, y) > Fthr, is displayed with a black-and-white rendering (Figure 3), where black depicts locations with power law distributions, and white demarcates locations with Gaussian distributions.
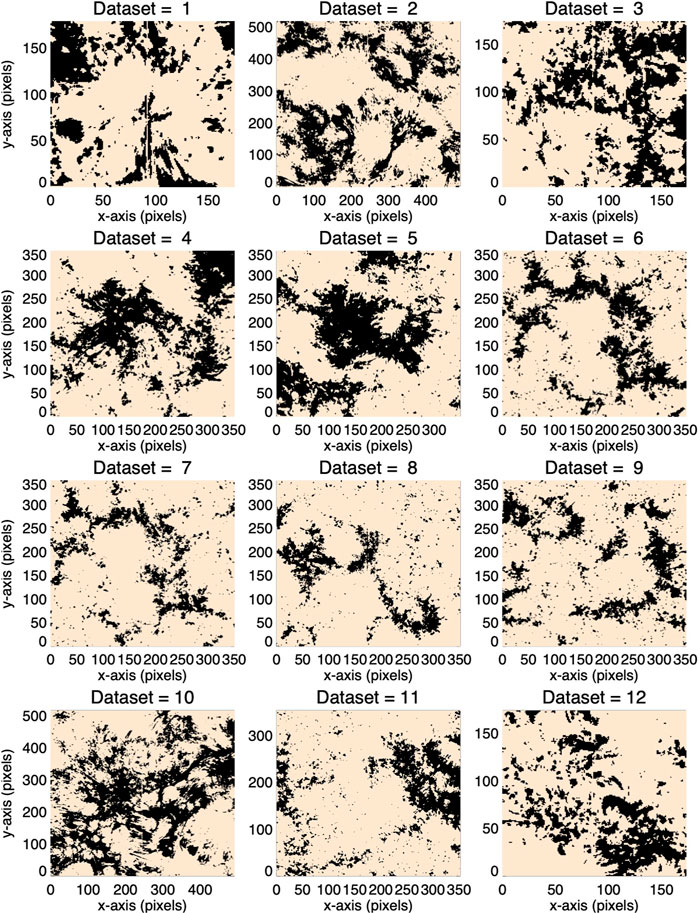
FIGURE 3. Intensity maps of 12 different active regions and Quiet-Sun regions, observed with IRIS SJI 1400 Å. Gaussian random noise is masked out (with peak fluxes F (x, y) < Fthr), while network cells and spicules are rendered in black.
The information content of an IRIS image can be described with a 2-D array of flux values F(x, y) at a given time t, or alternatively with a 1-D histogram N(F). Since we want to fit a two-component distribution function (i.e., with a Gaussian and a power law), we need to introduce a separator between the two distributions, which we derive from the full width at half maximum (see F2 in Figure 1). We fit then both distribution functions (Eqs 1, 2) separately, the Gaussian function in the range of [F1, F2], and the power law function in the range of [F2, F3], as depicted in Figure 1. The minimum flux (F1) and maximum flux (F3) are determined from the minimum and maximum flux value in the image. We are fitting the distribution functions with a standard Gaussian fit method, and with a standard linear regression fit for the logarithmic flux function. Note that the power law function N(S) appears to be a straight line in a logarithmic display only (Figure 1 bottom panel), i.e., log(N)-log(S), but not in a linear representation (Figure 1 top panel), i.e., lin(N)-lin(S), as used here.
The results of the fitting of the observed histograms are shown for all 12 datasets in Figure 4, where the Gaussian fit is rendered with a blue color, and the power law fit with a red color. We see that our two-component model for the distribution function produces accurate fits to the analyzed IRIS data (histograms in Figure 4) for seven datasets (# 4–9, 11), while it fails in 5 cases (# 1–3, 10, 12). On the other hand, 4 cases contain sunspots (# 1–3, 10) and coincide with the cases with power law fit failures.
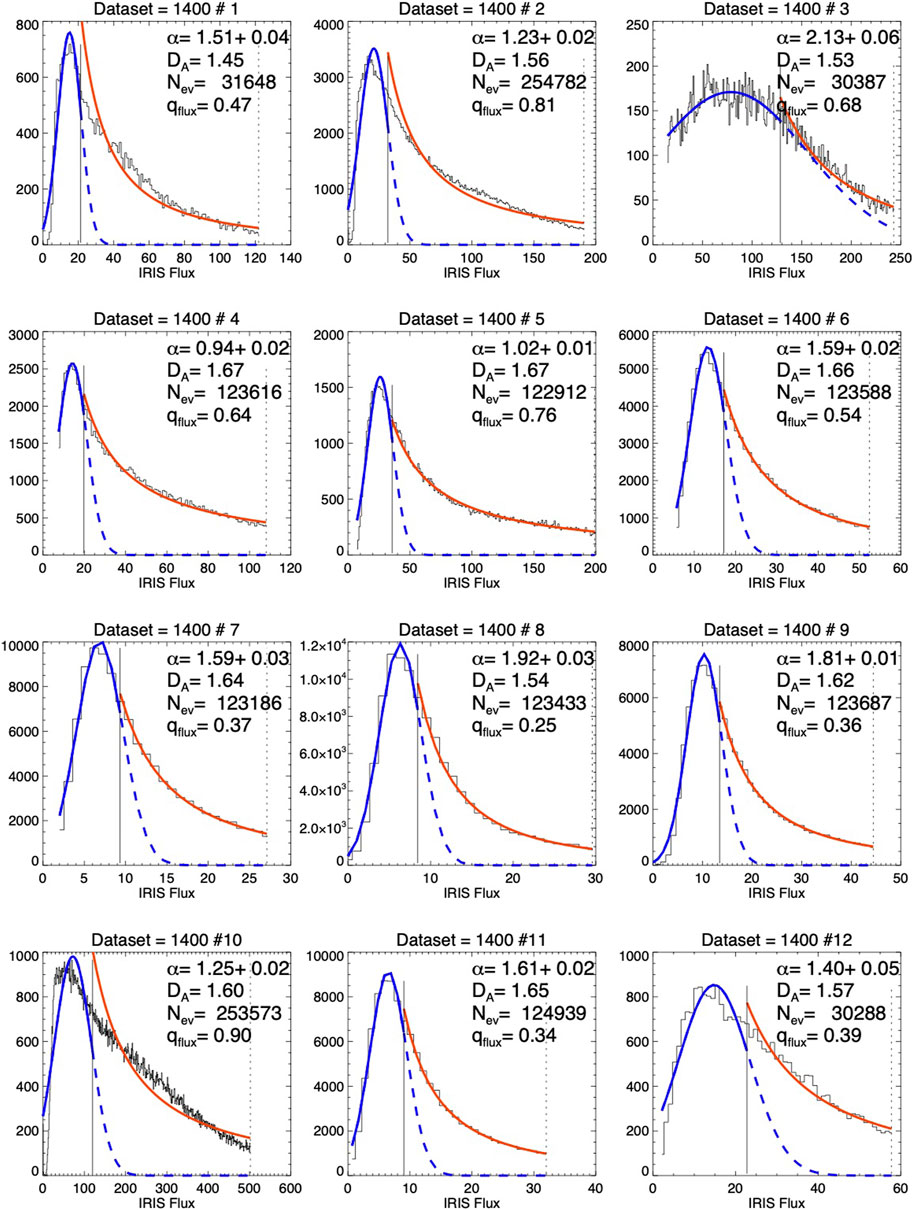
FIGURE 4. Flux histograms of 12 different regions in plages of transition regions, observed with IRIS SJI 1,400 Å. The flux distribution of granules is fitted with a Gaussian function (blue curve, F < F2), and extrapolated with dashed blue curves. The flux distribution of spicules is fitted with a power law distribution function (thick red curve. The separation of the two distributions at F2 is marked with a vertical thin line.
If we would assume that all fluxes are generated by incoherent random noise, we would not be able to fit the histogrammed data at all. Obviously, we would under-predict most of the fluxes substantially (blue dashed curves in Figure 4), which underscores that the “fat-tail” power law function, a hallmark of SOC processes, is highly relevant for fitting the observed IRIS 1400 Å data here.
In a next step we investigate the numerical values of the power law slopes αF of the flux distribution parameters F, which are listed in the third column of Table 1. At a first glance, it appears that these values vary wildly in a range of αF = 0.94 to 2.13. However, Vilangot Nhalil et al., 2020 classified the 12 analyzed datasets into 4 cases containing sunspots, and 8 cases containing plages in the transition region without sunspots. From this bimodal behavior it was concluded that the power law index of the energy distribution is larger in plages (αE > 2), compared with sunspot-dominated active regions (αE < 2), (Vilangot Nhalil et al., 2020). In our investigation here, the 4 cases with sunspots exhibit substantially flatter power law slopes αF (except #3), which indicates that sunspot-dominant distributions are indeed significantly different from those without sunspots (Table 1). Actually, we find an even better predictor of this bimodal behavior, by using the maximum flux Fmax (Column 6 in Table 1). We find that flux distributions
which includes the five datasets #6–9, 11. In contrast, the seven other datasets #1–5, 10, 12 have consistently higher maximum values, Fmax ≳ 50 DN. Instead of using the maximum values Fmax, we can also use the average fluxes and find the same bimodal behavior.
Even more significant is that this power law value is consistent with the theoretical prediction of the power law slopes (Aschwanden, 2012; Aschwanden, 2022a; Aschwanden et al., 2016),
Thus we conclude that flux distributions have a power law slope that agree with the theoretial prediction under special conditions, such as for small maximum fluxes. Moreover we find that magnetic flux distributions with sunspots and large magnetic flux imbalances produce flatter slopes and failed power law fits (Tables 1 and 2), see Section 2.4.
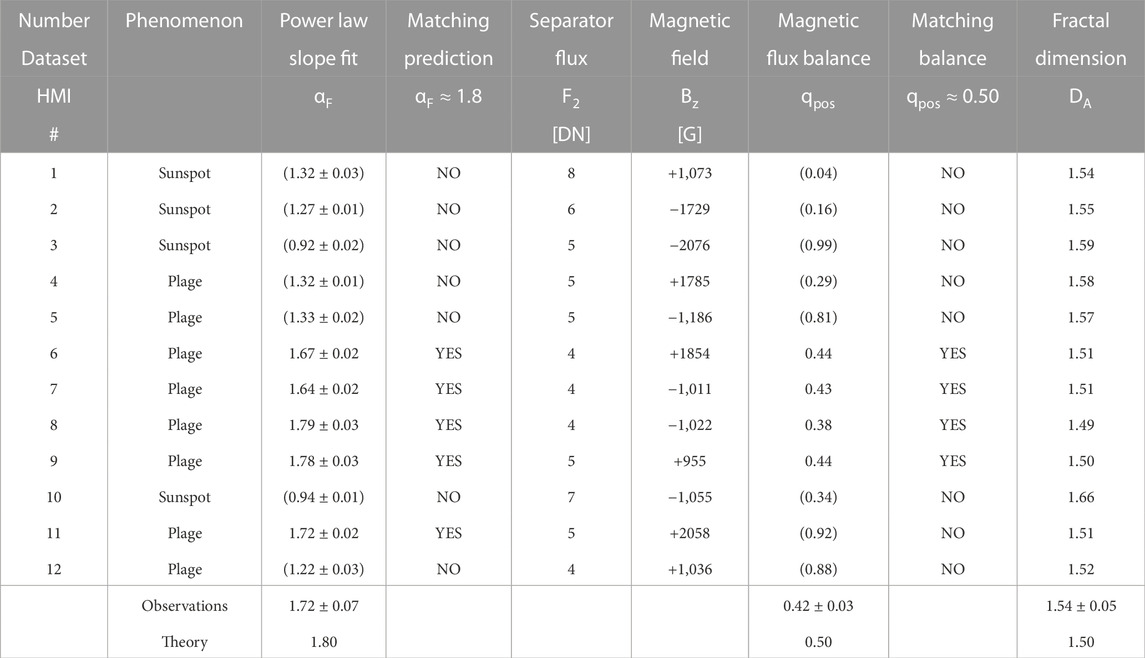
TABLE 2. Results of 12 datasets obtained with HMI/SDO, showing the power law slope αF of the flux distribution, the separator flux F2, the magnetic flux balance qpos, the magnetic field strength Bz, the magnetic flux balance qpos, and the fractal dimension DA. Note that the power law slope αF agrees with the theoretical prediction of αF = 9/5 ≈ 1.8 in 5 cases approximately, when there is no sunspot and the magnetic flux is balanced. The values of αF in parenthesis are ignored in the calculation of the averages.
2.4 HMI magnetogram analysis
In order to test the universality of the results we repeat the same analysis for 12 coincident HMI magnetograms onboard the Solar Dynamics Observatory (SDO), which have simultaneous times and identical spatial field-of-views. The 12 analyzed HMI images are shown in Figure 5, where black features indicate negative magnetic polarity, and white features indicate positive magnetic polarity. We see sunspots in at least four magnetograms (#1–3, 10), with two sunspots having a negative magnetic polarity (#1, 2), and two cases with positive magnetic polarity (#3, 10). All 12 magnetograms show mixed polarities, but some are heavily unbalanced (#1–5, 10–12).
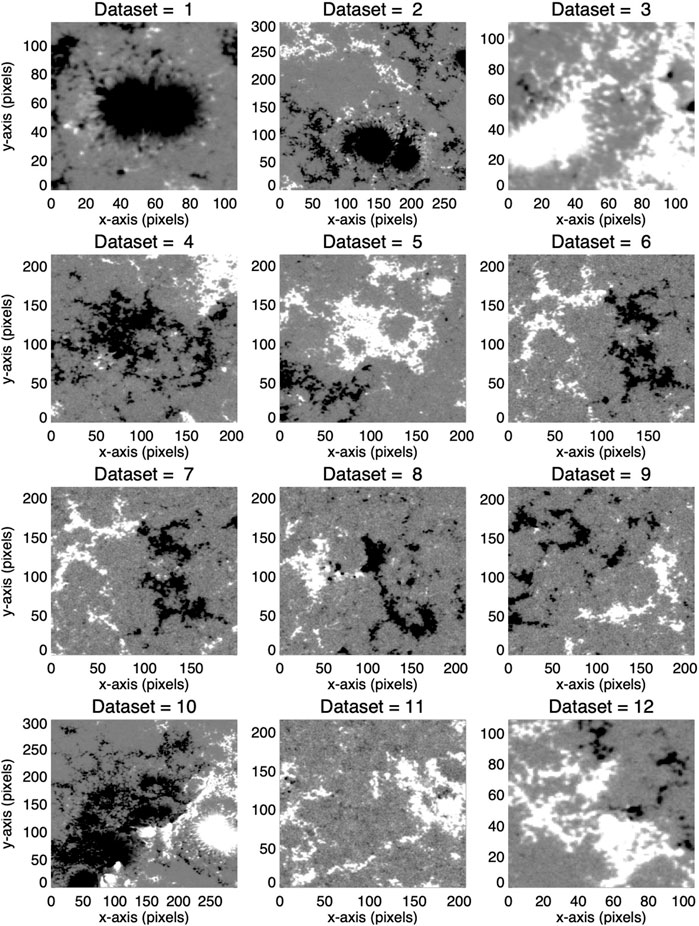
FIGURE 5. Magnetograms of 12 different active regions and plage regions, observed with HMI/SDO. The black color indicates negative magnetic polarity, and the white color represents positive magnetic polarity.
We quantify the magnetic flux balance with the ratio qpos,
If the magnetic flux (line-of-sight) component is well-balanced, we would expect a value of qpos = 0.5, assuming ∑pos = |∑neg|. Only 4 cases have approximately balanced fluxes (#6–9), namely, qpos = [0.44, 0.43, 0.38, 0.44], while the other 6 cases have large flux imbalances, from qpos = 0.04 to 0.99 (Table 2; Figure 6). The associated power law slopes of the four well-balanced cases are αF = [1.67, 1.64, 1.79, 1.78] = 1.72 ± 0.07, which closely coincide with the theoretical SOC-prediction of αF ≈ 1.80 (Aschwanden, 2012; Aschwanden, 2022a; Aschwanden et al., 2016).
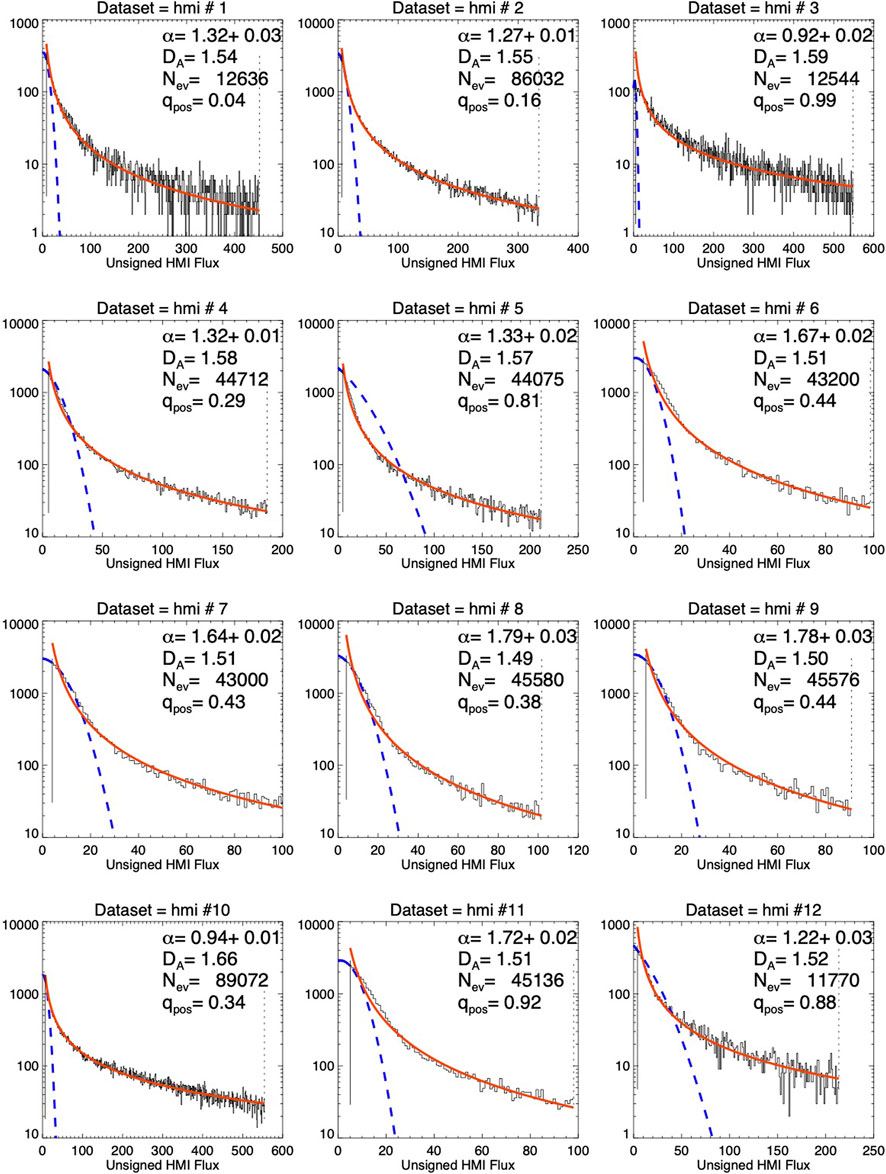
FIGURE 6. Histograms of different solar regions, observed in magnetograms with HMI/SDO. The size distribution of salt-and-pepper magnetic noise is fitted with a Gaussian function (blue curve), the extrapolation of the Gaussian (dashed blue curve), while the distribution of magnetic features are fitted with power law functions (red curves).
We analyze the HMI data in the same way as the IRIS data, by fitting Gaussian distributions (blue curves in Figure 6) and power law distribution functions (red curves in Figure 6), which clearly show a “fat-tail” feature that is far in excess of the Gaussian function (blue dashed curves in Figure 6). We compare the power law slopes αF obtained with the two completely different datasets from IRIS and HMI in Figure 7, using the “pixelation” method. The two datasets are found to be highly correlated (with CCC = 0.90, if we ignore the outlier #3). Nevertheless, the power law slopes αF shown in Figure 7 are concentrated in two regimes, one that is consistent with our theoretical SOC prediction of αF,IRIS = αF,HMI ≈ 1.80, while a second cluster is centered around αF,IRIS ≈ 1.0–1.5 and αF,HMI ≈ 1.0–1.5 (Figure 7). In essence, we find four datasets (# 6–9) that are consistent with the SOC prediction for events with well-balanced flux qpos ≈ 0.5, while a second group cannot reproduce the SOC model, but can be characterized with large unbalanced magnetic fluxes (# 1–5, 10–12). The flux imbalance, however, is not always decisive. Tests with variations of the FOV reveal that the arbitrary choice of the FOV (in HMI data) can be more important in deciding whether the calculated power law slope is universally consistent with SOC models, e.g., see event #11.
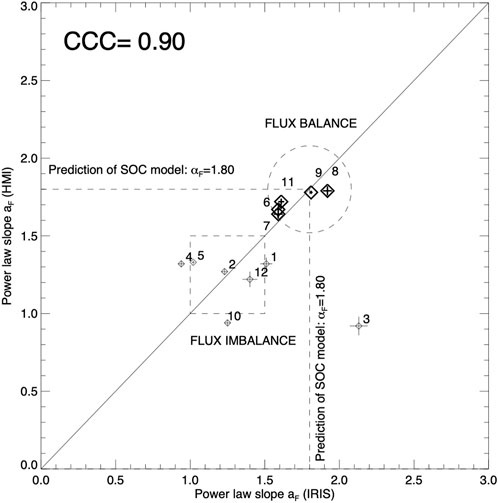
FIGURE 7. The power law slopes αF are calculated for 12 datasets for two independent instruments and wavelengths: from IRIS data (x-axis) and from HMI/SDO data (y-axis). Note that five datasets (#6–9, 11) coincide approximately with the theoretically expected value αF = 1.80 (marked with a circle). The other 7 cases (shown in rectangle) are subject to sunspots, relatively large peak fluxes, and large magnetic flux imbalances.
The physical interpretation of the HMI data is, of course, different for the IRIS data. In the previous analysis of IRIS data we interpreted the coherent statistics (in terms of SOC-controlled power law functions) due to spicular activity in the transition region. In contrast, using the HMI data, which provides the magnetic field line-of-sight component Bz, we can interpret the statistics of incoherent random distributions in terms of “salt-and-pepper” small-scale magnetic fields in the photosphere, and the coherent avalanche statistics in terms of SOC-controlled magnetic reconnection processes in nanoflares and larger flares (Table 3). Note that the two parameters αF,IRIS amd αF,HMI are observed independently from different spacecraft, as well as in markedly different wavelength bands, i.e., λ ≈ 1,400 Å for IRIS, and λ = 6,173 Å for HMI/SDO magnetograms, which measures the mean flux F from the line-of-sight magnetic field component Bz(x, y). Despite of the very different instruments and wavelengths, the power law slope αF of the mean flux appears to be universally valid and consistent with the theoretical SOC prediction for datasets with approximate magnetic flux balance (Figure 7). However we learned that the magnetic flux balance and the absence of sunspots represent additional requirements to warrant the universality of the SOC slopes. This yields a testable prediction: If the field-of-view of each HMI magnetogram is readjusted so that the enclosed magnetic flux becomes more balanced and no sunspot appears in the FOV, the power law slope is expected to approach the theoretical universal value of αF,IRIS ≈ αF,HMI ≈ 1.80.
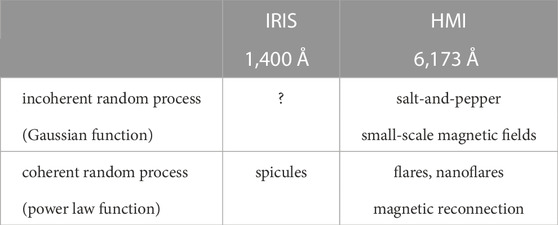
TABLE 3. Diagram of phenomena observed with different instruments (IRIS, HMI), different wavelengths (columns), for incoherent and coherent random processes (rows).
3 Discussion
In the following we discuss an incoherent random process (e.g., salt-and-pepper small-scale magnetic elements), and two coherent random processes (e.g., spicular dynamics, and magnetic reconnection), which relate to each other as shown in the diagram of Table 3.
3.1 Magnetic flux distribution
The most extensive statistical study on the size distribution of magnetic field features on the solar surface has been undertaken by Parnell et al. (2009). Combining magnetic field data from three instruments (SOT/Hinode, MDI/NFI, and MDI/FD on SOHO, a combined occurrence frequency size distribution was synthesized that extends over 5 decades, in the range of Φ = 2 × 10¹⁷–1023 Mx (Parnell et al., 2009),
where the magnetic flux Φ is obtained from integration of the magnetic field B(x, y) over a thresholded area A = ∫ dx dy,
If we equate the magnetic flux Φ with the mean flux F of an event in standard SOC models, we predict a power law slope of (Aschwanden, 2012; Aschwanden, 2022a; Aschwanden et al., 2016), using d = 3, DV = 5/2, and γ = 1,
which agree well with the result (Eq. 10) observed by Parnell et al. (2009). A lower value was found from cellular automaton simulations, N(Φ) ≈ Φ−1.5±0.05 (Fragos et al., 2004), where flux emergence is driven by a percolation rule, similar to the percolation model of Seiden and Wentzel (1996), or Balke et al. (1993). Mathematical models have been developed to model the percolation phenomenon, based on combinatorial and statistical concepts of connectedness that exhibit universality in form of powerlaw distributions.
3.2 Universality of SOC size distributions
Power law-like size distributions are the hallmark of self-organized criticality systems. Statistical studies in the past have collected SOC parameters such as length scales L, time scales T, peak flux rates P, mean fluxes F, fluences and energies E = F × T, mono-fractal and multi-fractal dimensions (Mandelbrot, 1977), in order to test whether the theoretically expected power law size distributions, or the power law slopes of waiting times, agree with the observed distributions (mostly observed in astrophysical systems). The universality of SOC models (Aschwanden, 2012; Aschwanden, 2022a; Aschwanden et al., 2016) is based on four scaling laws: the scale-free probability conjecture N(L) ∝ L−d, classical diffusion L ∝ Tβ/2, the flux-volume relationship F ∝ Vγ, and the Euclidean scaling law, P ∝ Lγd, where d = 3 is the Euclidean dimension, β ≈ 1 is the classical diffusion coefficient, γ ≈ 1 the flux-volume proportionality, while DA = 3/2 and DV = 5/2 are the mean fractal dimensions in 2-D and 3-D Euclidean space. The standard SOC model is expressed in terms of these universal constants: d = 3, γ = 1, β = 1. Consequently, the four basic scaling laws reduce to N(L) ∝ L−3, L ∝ T1/2, F ∝ L2.5, and P ∝ L3. Since we measure the mean flux F in this study, our main test of the universality of SOC models if formulated in terms of the flux-volume relationship F ∝ Vγ, leading to the power law slope αF,SOC = 1.80 (Eq. 12).
The SOC-inferred scaling laws hold for a large number of phenomena. This implies that our SOC formalism is universal in the sense that the statistical size distributions are identical for each phenomenon, displaying a universal power law slope of αF,SOC = 1.80. When we conclude that the power law slope αF is universal, the SOC model implies that the flux-volume proportionality (γ ≈ 1) as well as the mean fractal dimension (d = 3, DV ≈ 2.5) are universal too.
3.3 Phenomena with SOC
Once we establish the self-consistency of power law slopes between theoretical (SOC) and observed size distributions, the next question is what physical processes are at work. We envision four different types of phenomena (Table 3): (i) Gaussian random noise in IRIS data); (ii) spicular plage events in the transition region (described by the power law size distribution in IRIS data); (iii) salt-and-pepper small-scale magnetic structures (described by the random noise distributions in HMI magnetograms); and (iv) magnetic reconnection processes in flares and nanoflares (described by the power law size distribution in HMI data). However, there are deviations from these rules. We found that the power law distributions are modified in the presence of sunspots, when the magnetic flux is unbalanced, or when the FOV is arbitrarily chosen. Under ideal conditions, the SOC scaling laws are fulfilled universally, independent of the wavelength or plasma temperature. Magnetic field data (from HMI/SDO) or λ ≈ 1,400 Å (from IRIS) appear to produce emission in volumes that are proportional in the photosphere or transition zone, even when they are formed at quite different temperatures, i.e., Tphot ≈ 5,800 K in the photosphere and TTR ≈ 104–105 K in the transition region.
Another ingredient of the SOC model is the scale-free probability conjecture, i.e., N(L) ∝ L−d = L−3, which cannot be uniquely linked to a particular physical process. Parnell et al. (2009) conclude that a combination of emergence, coalescence, cancellation, and fragmentation may possibly produce power law size distributions of spatial scales L. Alternative models include the turbulence and the Weibull distributions (Parnell, 2002). Munoz-Jaramillo et al. (2015) study the best-fitting distribution functions for 11 different databases of sunspot areas, sunspot group areas, sunspot umbral areas, and magnetic fluxes. They find that a linear combination of Weibull and log-normal distributions fit the data best (Munoz-Jaramillo et al., 2015). Weibull and log-normal distributions combine two distribution functions, similar to our synthesis of a Gaussian-plus-power-law distribution.
A general physical scenario of a power law size distribution is the evolution of avalanches by exponential growth (Rosner and Vaiana, 1978), with subsequent saturation (logistic growth) after a random time interval, which produces an exact power law function (Aschwanden et al., 1998). Our approach to model the size distribution of solar phenomena with two different functions, employing a Gaussian noise and a power law tail, reflects the duality of incoherent and coherent random components, in both the data from IRIS and HMI (Table 3). In summary, incoherent random components include salt-and-pepper small-scale magnetic features, while coherent components include spicular avalanches, and magnetic reconnection avalanches from nanoflares to large flares.
3.4 Granular dynamics
The physical understanding of solar (or stellar) granulation has been advanced by numerical magneto-convection models and N-body dynamic simulations, which predict the evolution of small-scale (granules) into large-scale features (meso- or super-granulation), organized by surface flows that sweep up small-scale structures and form clusters of recurrent and stable granular features (Berrilli et al., 1998; Berrilli et al., 2005; Hathaway et al., 2000; Martinez-Sykora et al., 2008; Rieutord et al., 2008; Rieutord et al., 2010; Cheung and Isobe, 2014). An analytical model of convection-driven generation of ubiquitous coronal waves is considered in Aschwanden et al. (2018b). The fractal multi-scale dynamics has been found to be operational in the Quiet-Sun photosphere, in quiescent non-flaring states, as well as during flares (Uritsky et al., 2007; Uritsky et al., 2013; Uritsky and Davila, 2012). The fractal structure of the solar granulation is obviously a self-organizing pattern that is created by a combination of subphotospheric magneto-convection and surface flows, which are turbulence-type phenomena.
The interpretation of granulation as the cause of the Gaussian “noise” in IRIS data is controversial for two reasons: (i) The intensity measured by IRIS 1400 in non-magnetic areas has densities that originate from the middle chromosphere, rather than from the underlying photosphere. (ii) No convective signal propagates to these heights and densities, and thus the scale of granulation cannot be probed at these heights (Martinez-Sykora et al., 2015).
3.5 Spicular dynamics
One prominent feature in the transition region is the phenomenon of “moss”, which appears as a bright dynamic pattern with dark inclusions, on spatial scales of L ≈ 1–3 Mm, which has been interpreted as the upper transition region above active region plages, and below relatively hot loops (De Pontieu et al., 1999; De Pontieu et al., 2014). Our measurement of structures in the IRIS 1,400 Å channel is sensitive to a temperature range of Te ≈ 104–105 K, and thus is likely to include chromospheric and transition region phenomena such as: spicules II (De Pontieu et al., 2007), macro-spicules, dark mottles, dynamic fibrils, surges, miniature filament eruptions, etc. Theoretical models include the rebound shock model (Sterling and Hollweg, 1988), pressure-pulses in the high atmosphere (Singh et al., 2019), Alfvénic resonances (Sterling, 1998), magnetic reconnection models for type II spicules (De Pontieu et al., 2007), ion-neutral collisional damping (De Pontieu, 1999), leakage of global p-mode oscillations (De Pontieu et al., 2004), MHD kink waves (Zaqarashvili and Erdelyi, 2009), vortical flow models (Kitiashvili et al., 2013), and magneto-convective driving by shock waves (De Pontieu et al., 2007).
The fact that we obtain a power law size distribution (αF = 1.70 ± 0.15, Table 1), which is very similar to solar flares in general, αF,SOC = 1.80, implies the universality of the SOC framework. Furthermore we find power law-like size distributions for spicular events, rather than a Gaussian distribution, which tells us that spicule events need to be modeled in terms of SOC-driven avalanches, instead of Gaussian random distributions. As mentioned above, the difference between incoherent and coherent random processes is the following: Gaussian statistics reflect the operation of a memoryless stationary random process; while avalanche processes such as occurring in SOC systems are characterized by extended spatial and temporal correlations, i.e., the unfolding of an avalanche is influenced by the imprint of earlier avalanches on the system.
We propose that spicules around magnetic elements are responsible for the power law slope αF observed in those areas. This appears to be a plausible interpretation since these dynamical phenomena are very relevant in plage and network areas. For instance, event #11 shows a fully unbalanced magnetic configuration, which supports the idea that strong magnetic fields, fragmented in small-scale elements in plage and/or network seems to be the relevant characteristics, rather than flux balance over an arbitrary FOV.
3.6 Salt-and-pepper magnetic field
We interepret the random noise Gaussian distribution of magnetic fluxes in Quiet-Sun regions as small-scale magnetic field “pepper-and-salt” structures, also called magnetic carpet (Priest et al., 2002), where the black and white color in magnetograms (Figure 5) corresponds to negative and positive polarity. The fact that we obtain two distinctly different size distributions (Gaussian vs power law) indicates at least two different physical mechanisms, one being an incoherent random (Gaussian) process, the other one being a coherent (power law-like) avalanche process. The salt-and-pepper structure is generated apparently by an incoherent random process, rather than by a coherent avalanching process, according to our fits. This may constrain the origin of the solar magnetic field, being created by emergence, submergence, coalescence, cancellation, fragmentation, and/or small-scale dynamos, etc. Not all would be expected to yield Gaussian statistics (e.g., fragmentation processses often yield log-normal distributions; Verbeeck et al., 2019).
3.7 Magnetic reconnection
The re-arrangement of the stress-induced solar magnetic field requires ubiquitous and permanent (but intermittent) magnetic reconnection processes on all spatial and temporal scales. Our study finds power law size distributions, with a slope of αF = 1.72 ± 0.07 from HMI magnetograms, which is similar to flares in general (see Aschwanden et al., 2016 for a review of all wavelengths (e.g., gamma-rays, hard X-rays, soft X-rays, UV, EUV, FUV, etc.). This tells us that there is a strong correlation between the photospheric field (in HMI images) and the transition region (in IRIS images), as evident from the cross-correlation coefficient of CCC = 0.90 shown in Figure 7. The fractal multi-scale dynamics apparently operates in the quiet photosphere, in the quiescent non-flaring state, as well as during flares in active regions (Uritsky and Davila, 2012).
4 Conclusion
Solar and stellar flares, pulsar glitches, auroras, lunar craters, as well as earthquakes, landslides, wildfires, snow avalanches, and sandpile avalanches are all driven by self-organized criticality (SOC), which predicts power law-like occurrence frequency (size) distributions and waiting time distribution functions. What is new in our studies of SOC systems is that we are now able to calculate the slope αx of power law functions, which allows us to test SOC models by comparing the observed (and fitted) distribution functions with the theoretically predicted values. In this study we compare statistical distributions of SOC parameters from different wavelengths and different instruments (UV emission observed with IRIS and magnetograms with HMI). The results of our study are:
1. The histogrammed distribution of fluxes N(F) obtained from an IRIS 1,400 Å image, or from a HMI magnetogram, cannot be fitted solely by a Gaussian function, but requires a two-component function, such as a combination of a Gaussian and a power law function, a “fat-tail” extension above some threshold. We define a separator between the two functions above the full width at half maximum. We obtain power law slopes of αF = 1.70 ± 0.15 from the IRIS data, and αF = 1.72 ± 0.07 from the HMI data, which agree with the theoretical SOC prediction of αF = 1.80, and thus demonstrate universality across UV wavelengths and magnetograms. Moreover, it agrees with the five order of magnitude extending power law distribution sampled by Parnell et al. (2009), αF = 1.85 ± 0.14.
2. Tables 1, 2 show the following characterizations of the 12 selected datasets: 4 cases with sunspots, 5 cases that have a max flux
3. We designed an algorithm that produces “pixelized” size distributions from a single image (e.g., from a UV image or a magnetogram). In this method, the flux and area of each avalanche event is decomposed down to the pixel size level, which allows us to calculate the power law slope of the size flux distibution without requiring an automated feature recognition code. The method is computationally very fast and does not require any particular automated pattern recognition code.
4. We can characterize the analyzed size distributions in terms of four distinctly different physical interpretations: (i) the Gaussian random noise distribution in IRIS data; (ii) spicular plage events in the transition region (described by the power law size distribution in IRIS data); (iii) salt-and-pepper small-scale magnetic structures (described by the random noise distributions in HMI magnetograms); and (iv) magnetic reconnection processes in flares and nanoflares (described by the power law size distribution in HMI data).
Future work may include: (i) Testing of the SOC-predicted size distributions with power law slopes αF for all available (mean) fluxes F (in HXR, SXR, EUV, etc.); (ii) testing the selection of different FOV sizes in the absence or existence of sunspots, and magnetic flux balance; (iii) and cross-comparing the “pixelization” method with the standard method. Ultimately these methods should help us to converge the numerical values in SOC models.
Data availability statement
The raw data supporting the conclusions of this article will be made available by the authors, without undue reservation.
Author contributions
All authors listed have made a substantial, direct, and intellectual contribution to the work and approved it for publication.
Funding
IRIS mission support. This work was partially supported by NASA contract NNX11A099G “Self-organized criticality in solar physics”, NASA contract NNG04EA00C of the SDO/AIA instrument, and the IRIS contract NNG09FA40C to LMSAL. IRIS is a NASA small explorer mission developed and operated by LMSAL with mission operations executed at NASA Ames Research Center and major contributions to downlink communications funded by ESA and the Norwegian Space Centre.
Acknowledgments
The author is indebted to data contributions and data preparation. We acknowledge constructive and insightful comments of two reviewers and stimulating discussions (in alphabetical order), with Paul Charbonneau, Adam Kowalski, Karel Schrijver, and Vadim Uritsky.
Conflict of interest
The authors declare that the research was conducted in the absence of any commercial or financial relationships that could be construed as a potential conflict of interest.
Publisher’s note
All claims expressed in this article are solely those of the authors and do not necessarily represent those of their affiliated organizations, or those of the publisher, the editors and the reviewers. Any product that may be evaluated in this article, or claim that may be made by its manufacturer, is not guaranteed or endorsed by the publisher.
References
Aschwanden, M. J. (2014). A macroscopic description of self-organized systems and astrophysical applications. ApJ 782, 54. doi:10.1088/0004-637x/782/1/54
Aschwanden, M. J. (2012). A statistical fractal-diffusive avalanche model of a slowly-driven self-organized criticality system. A&AA2 539, A2. doi:10.1051/0004-6361/201118237
Aschwanden, M. J., Crosby, N., Dimitropoulou, M., Georgoulis, M. K., Hergarten, S., McAteer, J., et al. (2016). 25 Years of self-organized criticality: Solar and astrophysics. Space Sci. Rev. 198, 47–166. doi:10.1007/s11214-014-0054-6
Aschwanden, M. J., Dennis, B. R., and Benz, A. O. (1998). Logistic avalanche processes, elementary time structures, and frequency distributions in solar flares. ApJ 497, 972–993. doi:10.1086/305484
Aschwanden, M. J., Gosic, M., Hurlburt, N. E., and Scullion, E. (2018b). Convection-driven generation of ubiquitous coronal waves. ApJ 866 (13), 73. doi:10.3847/1538-4357/aae08b
Aschwanden, M. J. (2022b). Reconciling power-law slopes in solar flare and nanoflare size distributions. ApJL 934, L3. doi:10.3847/2041-8213/ac7b8d
Aschwanden, M. J. (2011). Self-organized criticality in astrophysics. The statistics of nonlinear processes in the universe. New York: Springer-Praxis, 416p. ISBN 978-3-642-15000-5.
Aschwanden, M. J. (2022a). The fractality and size distributions of astrophysical self-organized criticality systems. ApJ 934, 33. doi:10.3847/1538-4357/ac6bf2
Aschwanden, M. J., and Vilangot Nhalil, N. (2022). Interface region imaging spectrograph (IRIS) observations of the fractal dimension in the solar atmosphere. Front. Astronomy Space Sci. Manuscript ID 999329.
Bak, P., Tang, C., and Wiesenfeld, K. (1988). Self-organized criticality. Phys. Rev. A 38 (1), 364–374. doi:10.1103/physreva.38.364
Bak, P., Tang, C., and Wiesenfeld, K. (1987). Self-organized criticality: An explanation of the 1/fnoise. Phys. Rev. Lett. 59 (27), 381–384. doi:10.1103/physrevlett.59.381
Balke, A. C., Schrijver, C. J., Zwaan, C., and Tarbell, T. D. (1993). Percolation theory and the geometry of photospheric magnetic flux concentrations. Sol. Phys. 143, 215–227. doi:10.1007/bf00646483
Berrilli, F., Del Moro, D., Russo, S., Consolini, G., and Straus, T. (2005). Spatial clustering of photospheric structures. ApJ 632, 677–683. doi:10.1086/432708
Berrilli, F., Florio, A., and Ermolli, I. (1998). On the geometrical properties of the chromospheric network. Sol. Phys. 180, 29–45. doi:10.1023/a:1005023819431
Burlaga, L. F., and Lazarus, A. J. (2000). Lognormal distributions and spectra of solar wind plasma fluctuations: Wind 1995-1998. JGR 105, 2357–2364. doi:10.1029/1999ja900442
Ceva, H., and Luzuriaga, J. (1998). Correlations in the sand pile model: From the log-normal distribution to self-organized criticality. Phys. Lett. A 250, 275–280. doi:10.1016/s0375-9601(98)00848-2
Cheung, M. C. M., and Isobe, H. (2014). Flux emergence (theory). LRSP 11, 3. doi:10.12942/lrsp-2014-3
De Pontieu, B., Berger, T. E., Schrijver, C. J., and Title, A. M. (1999). Dynamics of transition region ’moss’ at high time resolution. Sol. Phys. 190, 419–435. doi:10.1023/a:1005220606223
De Pontieu, B., Erdelyi, R., and James, S. P. (2004). Solar chromospheric spicules from the leakage of photospheric oscillations and flows. Nature 430, 536–539. doi:10.1038/nature02749
De Pontieu, B., McIntosh, S., Hansteen, V. H., Carlsson, M., Schrijver, C. J., Tarbell, T. D., et al. (2007). A tale of two spicules: The impact of spicules on the magnetic chromosphere. PASJ 59, S655–S652. doi:10.1093/pasj/59.sp3.s655
De Pontieu, B. (1999). Numerical simulations of spicules driven by weakly-damped Alfvén waves I. WKB approach. A&A 347, 696.
De Pontieu, B., Title, A. M., Lemen, J. R., Kushner, G. D., Akin, D. J., Allard, B., et al. (2014). The Interface region imaging spectrograph (IRIS). Sol. Phys. 289, 2733.
Fontenla, J. M., Curdt, W., Avrett, E. H., and Harder, J. (2007). Log-normal intensity distribution of the quiet-Sun FUV continuum observed by SUMER. A&A 468, 695–699. doi:10.1051/0004-6361:20066854
Fragos, T., Rantsiou, E., and Vlahos, L. (2004). On the distribution of magnetic energy storage in solar active regions. A&A 420, 719–728. doi:10.1051/0004-6361:20034570
Gallagher, P. T., Phillips, K. J. H., Harra-Murnion, L. K., et al. (1998). Properties of the quiet Sun EUV network. A&A 335, 733.
Giles, D. E., Feng, H., and Godwin, R. T. (2011). On the bias of the maximum likelihood estimator for the two-parameter Lomax distribution. Econometrics Workshop Paper EWP1104, ISSN 1485.
Harrison, R. A., Harra, L. K., Brkovic, A., and Parnell, C. E. (2003). A Study of the unification of quiet-Sun transient-event phenomena. A&A 409, 755–764. doi:10.1051/0004-6361:20031072
Hathaway, D. H., Beck, J. G., Bogart, R. S., Bachmann, K., Khatri, G., Petitto, J., et al. (2000). photospheric Convect. Spectr. SoPh 193, 299–312. doi:10.1023/a:1005200809766
Hosking, J. R. M., and Wallis, J. R. (1987). Parameter and quantile estimation for the generalized Pareto distribution. Technometrics 29 (3), 339–349. doi:10.1080/00401706.1987.10488243
Hudson, H. S. (1991). Solar flares, microflares, nanoflares, and coronal heating. Sol. Phys. 133, 357–369. doi:10.1007/bf00149894
Jensen, H. J. (1998). Self-Organized Criticality: Emergent complex behaviour in physical and biological systems. Cambridge University Press.
Katsukawa, Y., and Tsuneta, S. (2001). Small fluctuation of coronal X-ray intensity and a signature of nanoflares. ApJ 557, 343–350. doi:10.1086/321636
Kitiashvili, I. N., Kosovichev, A. G., Lele, S. K., Mansour, N. N., and Wray, A. A. (2013). Ubiquitous solar eruptions driven by magnetized vortex tubes. ApJ 770, 37. doi:10.1088/0004-637x/770/1/37
Krucker, S., and Benz, A. O. (1998). Energy distribution of heating processes in the quiet solar corona. ApJ 501, L213–L216. doi:10.1086/311474
Kunjaya, C., Mahasena, P., Vierdayanti, K., and Herlie, S. (2011). Can self-organized critical accretion disks generate a log-normal emission variability in AGN? ApSS 336, 455–460. doi:10.1007/s10509-011-0790-y
Lomax, K. S. (1954). Business failures: Another example of the analysis of failure data. J. Am. Stat. Assoc. 49, 847–852. doi:10.1080/01621459.1954.10501239
Lu, E. T., and Hamilton, R. J. (1991). Avalanches and the distribution of solar flares. ApJ 380, L89. doi:10.1086/186180
Martinez-Sykora, J., Hansteen, V., and Carlsson, M. (2008). Twisted flux tube emergence from the convection zone to the corona. ApJ 679, 871–888. doi:10.1086/587028
Martinez-Sykora, J., Rouppe van der Voort, L., Carlsson, M., De Pontieu, B., Pereira, T. M. D., Boerner, P., et al. (2015). Internetwork chromospheric bright grains observed with IRIS and SST. ApJ 803, 44. doi:10.1088/0004-637x/803/1/44
McAteer, R. T. J., Aschwanden, M. J., Dimitropoulou, M., Georgoulis, M. K., Pruessner, G., Morales, L., et al. (2016). 25 Years of self-organized criticality: Numerical detection methods. SSRv 198, 217–266. doi:10.1007/s11214-015-0158-7
Mitzenmacher, M. (2004). A brief history of generative models for power law and lognormal distributions. Internet Math. 1 (2), 226–251. doi:10.1080/15427951.2004.10129088
Munoz-Jaramillo, A., Senkpeil, R. R., Windmueller, J. C., Amouzou, E. C., Longcope, D. W., Tlatov, A. G., et al. (2015). Small-scale and global dynamos and the area and flux distributions of active regions, sunspot groups, and sunspots: A multi-database study. ApJ 800, 48. doi:10.1088/0004-637x/800/1/48
Parnell, C. E., DeForest, C. E., Hagenaar, H. J., Johnston, B. A., Lamb, D. A., and Welsch, B. T. (2009). A power-law distribution of solar magnetic fields over more than five decades in flux. ApJ 698, 75–82. doi:10.1088/0004-637x/698/1/75
Parnell, C. E. (2002). Nature of the magnetic carpet - 1. Distribution of magnetic fluxes. MNRAS 335/2, 398.
Priest, E. R., Heyvaerts, J. F., and Title, A. M. (2002). A flux-tube tectonics model for solar coronal heating driven by the magnetic carpet. ApJ 576, 533–551. doi:10.1086/341539
Rathore, B., Carlsson, M., Leenaarts, J., and De Pontieu, B. (2015). The Formation of Iris diagnostics. VIII. Iris observations in the C II 133.5 nm multiplet. ApJ 811, 70. doi:10.1088/0004-637x/814/1/70
Rathore, B., Carlsson, M., Leenaarts, J., and Pontieu, B. D. (2015). The Formation of IRIS diagnostics. VI. The diagnostic potential of the C II lines at 133.5 nm in the solar atmosphere. ApJ 811, 81. doi:10.1088/0004-637x/811/2/81
Rieutord, M., Meunier, N., Roudier, T., Rondi, S., Beigbeder, F., and Pares, L. (2008). Solar super-granulation revealed by granule tracking. A&A 479, L17–L20. doi:10.1051/0004-6361:20079077
Rieutord, M., Roudier, T., Rincon, F., Malherbe, J. M., Meunier, N., Berger, T., et al. (2010). On the power spectrum of solar surface flows. A&A 512, A4. doi:10.1051/0004-6361/200913303
Rosner, R., and Vaiana, G. S. (1978). Cosmic flare transients: Constraints upon models for energy storage and release derived from the event frequency distribution. ApJ 222, 1104. doi:10.1086/156227
Scargle, J. D. (2020). Studies in astronomical time-series analysis. VII. An enquiry concerning nonlinearity, the rms-mean flux relation, and lognormal flux distributions. ApJ 895, 90. doi:10.3847/1538-4357/ab8d38
Seiden, P. E., and Wentzel, D. G. (1996). Solar active regions as a percolation phenomenon II. ApJ 460, 522. doi:10.1086/176989
Singh, B., Sharma, K., and Srivastava, A. K. (2019). On modelling the kinematics and evolutionary properties of pressure pulse-driven impulsive solar jets. Ann. Geophys. 37, 891–902. doi:10.5194/angeo-37-891-2019
Sterling, A. C. (1998). Alfvénic resonances on ultraviolet spicules. ApJ 508, 916–924. doi:10.1086/306433
Sterling, A. C., and Hollweg, J. V. (1988). The rebound shock model for solar spicules: Dynamics at long times. ApJ 327, 950. doi:10.1086/166252
Uritsky, V. M., and Davila, J. M. (2012). Multiscale dynamics of solar magnetic structures. ApJ 748, 60. doi:10.1088/0004-637x/748/1/60
Uritsky, V. M., Davila, J. M., Ofman, L., and Coyner, A. J. (2013). Stochastic coupling of solar photosphere and corona. ApJ 769, 62. doi:10.1088/0004-637x/769/1/62
Uritsky, V. M., Paczuski, M., Davila, J. M., and Jones, S. I. (2007). Coexistence of self-organized criticality and intermittent turbulence in the solar corona. Phys. Rev. Lett. 99 (2), 025001. doi:10.1103/physrevlett.99.025001
Verbeeck, C., Kraaikamp, E., Ryan, D. F., and Podladchikova, O. (2019). Solar flare distributions: Lognormal instead of power law? ApJ 884, 50. doi:10.3847/1538-4357/ab3425
Vilangot Nhalil, N. V., Nelson, C. J., Mathioudakis, M., Doyle, G. J., and Ramsay, G. (2020). Power-law energy distributions of small-scale impulsive events on the active Sun: Results from IRIS. MNRAS 499, 1385–1394. doi:10.1093/mnras/staa2897
Warren, H. P., Reep, J. W., Crump, N. A., and Simoes, P. J. A. (2016). Transition region and chromospheric signatures of impulsive heating events. I. Obs. ApJ 829, 35. doi:10.3847/0004-637x/829/1/35
Weibull, W. (1951). A statistical distribution function of wide applicability. J. Appl. Mech. 18 (3), 293–297. doi:10.1115/1.4010337
Keywords: methods, statistics, fractal dimension, sun, transition region, solar granulation, solar photosphere
Citation: Aschwanden MJ and Nhalil NV (2023) The universality of power law slopes in the solar photosphere and transition region observed with HMI and IRIS. Front. Astron. Space Sci. 10:1099346. doi: 10.3389/fspas.2023.1099346
Received: 15 November 2022; Accepted: 15 February 2023;
Published: 16 March 2023.
Edited by:
Adam Kowalski, University of Colorado Boulder, United StatesReviewed by:
Paul Charbonneau, Montreal University, CanadaGianna Cauzzi, National Solar Observatory, United States
Copyright © 2023 Aschwanden and Nhalil. This is an open-access article distributed under the terms of the Creative Commons Attribution License (CC BY). The use, distribution or reproduction in other forums is permitted, provided the original author(s) and the copyright owner(s) are credited and that the original publication in this journal is cited, in accordance with accepted academic practice. No use, distribution or reproduction is permitted which does not comply with these terms.
*Correspondence: Markus J. Aschwanden, YXNjaHdhbmRlbkBsbXNhbC5jb20=
 Markus J. Aschwanden
 Nived Vilangot Nhalil2