 Dmytro Kotov1*
 Phil G. Richards2
 Maryna Reznychenko1Oleksandr Bogomaz1,3
 Vladimír Truhlík4
 Susan Nossal5
 Edwin Mierkiewicz6Taras Zhivolup1Igor Domnin1
 Yoshizumi Miyoshi7Fuminori Tsuchiya8Atsushi Kumamoto8
 Yoshiya Kasahara9Masahiro Kitahara8Satoko Nakamura10Ayako Matsuoka11
 Iku Shinohara12Marc Hairston13
- 1Institute of Ionosphere, Kharkiv, Ukraine
- 2Department of Computer Science, University of Alabama in Huntsville, Huntsville, AL, United States
- 3State Institution National Antarctic Scientific Center of the Ministry of Education and Science of Ukraine, Kharkiv, Kyiv, Ukraine
- 4Institute of Atmospheric Physics of the Czech Academy of Sciences, Prague, Czechia
- 5Physics Department, University of Wisconsin-Madison, Madison, WI, United States
- 6Department of Physical Sciences, Embry-Riddle Aeronautical University, Daytona Beach, FL, United States
- 7Institute for Space-Earth Environmental Research, Nagoya University, Nagoya, Japan
- 8Planetary Plasma and Atmospheric Research Center, Graduate School of Science, Tohoku University, Sendai, Japan
- 9Graduate School of Natural Science and Technology, Kanazawa University, Kanazawa, Japan
- 10Institute for Space-Earth Environmental Research, Nagoya University, Nagoya, Japan
- 11Data Analysis Center for Geomagnetism and Space Magnetism, Graduate School of Science, Kyoto University, Kyoto, Japan
- 12Institute of Space and Astronautical Science, Japan Aerospace Exploration Agency, Sagamihara, Japan
- 13William B. Hanson Center for Space Sciences, The University of Texas at Dallas, Richardson, TX, United States
This study explores the impact of the exosphere hydrogen (H) density on the ionosphere-plasmasphere system using a model whose key inputs are constrained by ionosphere observations at both ends of the magnetic field line with an L-value of 1.75 in the American longitudinal sector during a period with low solar and magnetic activities. This study is the first to be validated by ground-based and satellite data in the plasmasphere and both hemispheres. The main finding is that the entire ionosphere-plasmasphere system is very sensitive to the neutral hydrogen density in the lower exosphere. It was found that an increase in the H density by a factor of 2.75 from the commonly accepted values was necessary to bring the simulated plasma density into satisfactory agreement with Arase satellite measurements in the plasmasphere and also with DMSP satellite measurements in the topside ionospheres of the northern and southern hemispheres. A factor of 2.75 increase in the H density increases the simulated plasma density in the afternoon plasmasphere up to ∼80% and in the nighttime topside ionosphere up to ∼100%. These results indicate prominently that using the commonly accepted empirical model of the H density causes unacceptable errors in the simulated plasma density of the near-Earth plasma shells. We alert the space science community of this problem.
1 Introduction
The plasmasphere is comprised of shells of cold plasma that are confined by the Earth’s magnetic field. The plasmasphere plays an important role in clearing the near-Earth space of dangerous high-energy particles of the Van Allen radiation belts through the generation of hiss waves in the plasmasphere (e.g., Kanekal and Miyoshi, 2021). Recent studies show that the hiss power directly depends on the cold plasma density (Malaspina et al., 2018). Also, the transport of plasma plumes consisting of low-energy plasmasphere particles to the magnetopause acts to reduce magnetic reconnection, thereby helping to decrease the storm intensity (Borovsky et al., 2013). Thus, appropriate simulation of the plasmasphere density is critical for success in creating global physical models capable of simulating complex coupled effects of solar-terrestrial interaction and space weather phenomena.
The plasmasphere must be investigated with its coupling to the ionospheres of both hemispheres, which are the sources (during the daytime) and sinks (during the nighttime) of the plasmasphere content. It is well-known that this content is mostly H+, originating in the H+O+ resonant charge exchange reaction at altitudes where the ionospheric O+ density becomes low enough to allow H+ to flow into the plasmasphere (Richards and Torr, 1985). This is the topside ionosphere region between about 500 and 1000 km altitude, which overlaps with the lower part of the hydrogen exosphere. Thus, the plasmasphere H+ density is inextricably linked to the H density in the lower exosphere.
Our motivation to explore the impact of the H density in the lower exosphere on the plasmasphere is all the more understandable given that the H density values are still a subject of intensive discussion. Several studies with a variety of techniques have found significantly different values of H density for similar conditions. Using the H density provided by the widely used NRLMSISE-00 model (Picone et al., 2002) as a reference, the H density multiplication factors estimates range from 1/3 (Waldrop and Paxton, 2013) to two (Nossal et al., 2012; Kotov et al., 2018; 2019; Wan et al., 2022), and even up to a three (Kotov et al., 2015; Kotov et al., 2016). The new NRLMSIS 2.0 atm model (Emmert et al., 2021) has H densities identical to those of NRLMSISE-00, so this study uses the NRLMSISE-00 model.
Previously, this H density uncertainty motivated a study with ‘Sami3 is A Model of the Ionosphere’ (SAMI3) physical plasma model to explore how different values of the H density influence processes in near-Earth space during and after extreme space weather events (Krall et al., 2018). Their model parameter studies of plasmasphere refilling rates at L = 4.0 and L = 5.2 essentially re-verified the dependence of the refilling rate on the topside H density that was determined by Richards and Torr (1985) both analytically and computationally. The parameter study of Krall et al. (2018) differs from the current study in that they did not validate their results with observations in either the plasmasphere or the ionosphere. When modeling the ionosphere-plasmasphere system with parameter studies, it is important to ensure that the results are consistent with observations, as uncertainties in the state of the ionosphere can affect the validity of the plasmasphere simulations and complicate conclusions on the net impact of the H density on the ionosphere-plasmasphere system.
The Field Line Interhemispheric Plasma (FLIP) physical model ensures the validity of the calculated plasma parameters by using certain key ionospheric observations as constraints. FLIP model comparisons with the plasmaspheric density data from the Arase satellite by Kotov et al. (2018) revealed that reproducing the Arase plasmasphere density in December 2017 required doubling the NRLMSISE-00 H density. However, that study only had ionosphere data in the Northern hemisphere available to constrain and validate the model.
This current study advances our knowledge by simulating the impact of the lower exosphere H density on the entire ionosphere-plasmasphere system from the Northern hemisphere through the plasmasphere to the conjugate ionosphere in the Southern hemisphere. These simulations accurately estimate the lower exosphere H density by finding the best fit to the Arase observations in the plasmasphere and the DMSP satellites’ topside observations in both hemispheres.
2 Methods and tools
2.1 The method and justification of the place and time for the study
The method involves finding the best fit for the ionosphere and plasmasphere data by systematically varying the NRLMSISE-00 H density in the FLIP model while it is constrained by key ionosphere data. The multiplier to the NRLMSISE-00 H density that gives the best model fit to the coincident observations in the plasmasphere and topside ionospheres of the Northern and Southern hemispheres produces an estimate of the actual neutral hydrogen density in the lower exosphere. The sensitivity of the ionosphere-plasmasphere system to the lower exosphere H density is explored by comparison of the best-fit results with the results obtained using the standard NRLMSISE-00 H density.
This study is for a flux tube with an L-value of ∼1.75 in the American longitudinal sector from 27 April to 1 May 2017. The solar activity was low with both the daily and averaged F10.7 index being 77–78 during all considered dates. This flux tube, region, and time for the study were chosen to satisfy the following criteria, 1) the flux tube should be located in the inner plasmasphere where it is not significantly affected by transverse plasma transport under quiet magnetic conditions, 2) quiet magnetic conditions so that the flux tube has not recently been depleted, 3) the tube should be large enough to adequately represent refilling of the ionosphere-plasmasphere system, 4) the availability of high-quality F2-layer peak height data from the nearby digisondes in both hemispheres, 5) the availability of coincident satellite data for altitudes and local times when the satellite plasma density data is expected to be sensitive to the H density in the lower exosphere.
In addition to satisfying the above criteria, the selected longitudinal sector is located to the west of South America and thus avoids possible contamination of the results from the South Atlantic magnetic anomaly.
There is an earlier extensive historical database obtained by independent optical techniques in the same region. The ground-based optical Pine Bluff Observatory (43.08°N, 89.67°W) and Kitt Peak Observatory (31.96°N, 111.60°W) were located close to the latitude and longitude corresponding to the starting point of our flux tube (see Figure 1).
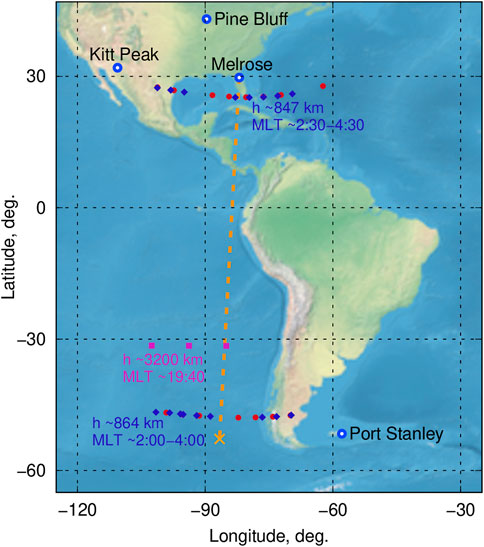
FIGURE 1. Projection of the plasma tube with L-value 1.75 for which the simulations were conducted (orange dashed line) and spatial and time location of satellites plasma data which are sensitive to neutral hydrogen density in the lower exosphere. Data were collected at L = 1.75 during 27 April—1 May 2017. Red circles and blue diamonds show DMSP F15 and F16 satellite data respectively. Pink squares denote Arase satellite data. Digisondes which data were used to constrain the FLIP model in the simulations are located at Melrose and Port Stanley. In Pine Bluff and Kitt Peak, the WHAM Balmer-α observatories were operated within the 23rd solar cycle.
2.2 FLIP model
The FLIP model is a one-dimensional physical model of the entire coupled ionosphere-plasmasphere system. The model calculates the electron and ion densities and temperatures along magnetic field lines from ∼100 km altitude in the Northern hemisphere through the plasmasphere to ∼100 km in the Southern hemisphere (Richards et al., 2010). The FLIP model magnetic field was recently updated to use the latest IGRF-13 model. The model uses 3-h Kp indices and F10.7 indices for the periods of simulations to specify neutral composition with the NRLMSISE-00 model. A description of the analysis techniques to be employed here is provided by Kotov et al. (2015). The FLIP capabilities employed for this study were 1) adjust the equivalent neutral wind velocity automatically (Richards, 1991) to reproduce the observed variation of the F2-layer peak height (hmF2) from the digisondes, 2) modify the plasmasphere heating to match the satellite temperature observations in the topside ionosphere, and 3) adjust the H density by multiplying the NRLMSISE-00 values to match all the plasma density measurements. Note that there are a number of possible heat sources in the plasmasphere that can affect the model temperatures and that are difficult to quantify. These sources include the ring current, plasma waves, and trapping of photoelectrons as they transit the plasmasphere. Since all the heat is ultimately lost to the ionosphere in both conjugate hemispheres as heat flux, the topside electron temperature constitutes an accurate proxy for the plasmasphere heating.
2.3 Digisondes
The diurnal variations of hmF2 for constraining the model are deduced from digisonde ionograms. In the Northern hemisphere, the data were obtained at Melrose (29.71°N, 278.00°E), which served as the coordinates for the starting point of the magnetic field line for the simulations. In the Southern hemisphere, the data were obtained at Port Stanley (51.60°S, 302.1°E), which is the closest digisonde to the conjugate point of Melrose (52.80°S, 273.37°E), see Figure 1. The ionogram traces were checked manually to provide the best accuracy of the hmF2 estimation before the inversion (Huang and Reinisch, 1996).
2.4 Arase satellite
The data from the Arase satellite Plasma Wave Experiment (PWE)/Onboard Frequency Analyzer (OFA) and High-Frequency Analyzer (HFA) instruments onboard allows the determination of the ambient plasma density along the satellite orbit from the frequency of the upper hybrid resonance emissions observed by OFA and HFA and the local cyclotron frequency measured by the magnetometer (Miyoshi et al., 2018a; Kasahara et al., 2018; Kumamoto et al., 2018; Matsuoka et al., 2018). The Arase electron density data were collected every other day in the local afternoon near 3,200-km altitude in the American sector close to the longitude of the simulated plasma tube (see Figure 1). At 3,200 km altitude, the electron density is almost equal to the H+ density since this altitude is significantly above the upper transition height for moderate solar activity conditions at mid- and low latitudes (e.g., Truhlik et al., 2004). This means that the Arase electron density is sensitive to the H density in the dayside lower exosphere.
2.5 DMSP satellites
Data from all four operating satellites of the Defense Meteorological Satellite Program (F15—F18) were used in this study. The satellites have near-circular orbits that cross the model L-shell at altitudes of ∼847 km in the Northern hemisphere and of ∼864 km in the Southern hemisphere.
Electron temperature data in the topside ionosphere from the electron probe of the DMSP satellites (Rich, 1994) were used to adjust the FLIP model plasmasphere heating rate to match the DMSP observed electron temperature. The DMSP topside ionosphere ion temperature data from retarding potential analyzer were used for validation of the simulated ion temperature.
The DMSP total ion density data in the topside ionosphere from the scintillation meter (Rich, 1994) were used to validate the FLIP model diurnal variations of the topside electron density. The ion density data that are collected by the F15 and F16 satellites every night between local midnight and sunrise (see Figure 1) are valuable because H+ is dominant near the DMSP orbits at night and they are supplied from the plasmasphere, making this DMSP data sensitive to the neutral H density in the dayside lower exosphere.
3 Results
The FLIP model’s ability to follow the observed hmF2 very closely by adjusting the neutral wind as it steps in time was used at both ends of the ionosphere-plasmasphere system (Figure 2).
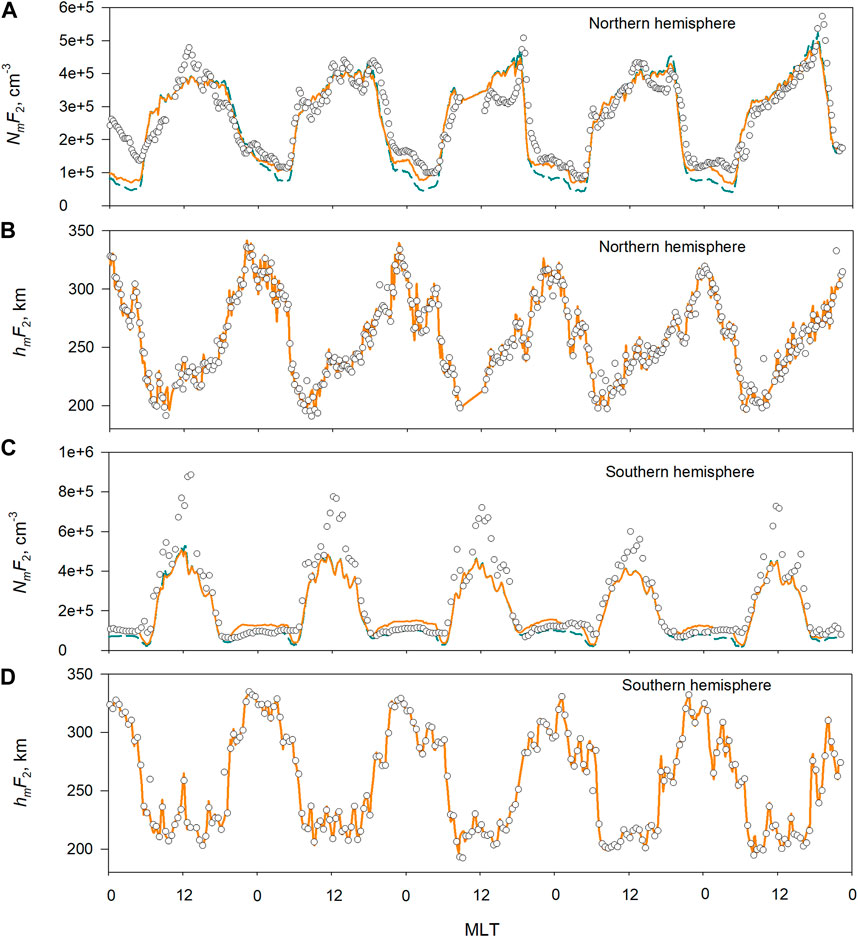
FIGURE 2. Diurnal variations of the F2-layer peak density NmF2(A,C) and height hmF2(B,D) at the ends of the L = 1.75 flux tube during 27 April—1 May 2017. The open circles show the digisonde data at Melrose (two top panels) and Port Stanley (two bottom panels). The solid orange line shows the FLIP model simulations using the NRLMSIS H density multiplied by a factor of 2.75, dashed dark blue line on the NmF2 panels show the simulations using the NRLMSIS H density. The model was constrained to follow the observed hmF2 variations in both hemispheres.
The first step was to run tests to find the model settings to provide near-optimal agreement between the simulated plasma parameters and observations along the entire flux tube. Specifically, the model should match, 1) the observed DMSP plasma densities in the topside ionosphere of both hemispheres and the high altitude Arase plasmasphere densities, and 2) the DMSP electron and ion temperatures in the topside ionosphere of both hemispheres. It is important to note that, because local heating and cooling are insignificant in the topside ionosphere, the topside electron temperature is directly related to the electron heat flux from the plasmasphere, which in turn is determined by the amount of heat deposited within the plasmasphere.
One complication in this process is that the model topside temperatures are not independent of the plasmasphere electron density because the plasmasphere heating by photoelectrons is proportional to the electron density. Thus, adjusting the H density to increase the plasmasphere density will increase heat flow to the topside ionosphere, which affects the topside temperature and density. An iterative process is necessary to ensure that the model parameters controlling the neutral H density and plasmasphere heat sources are consistent.
To control the heating of the plasmasphere, the model has two parameters, 1) the fraction of photoelectrons trapped in the plasmasphere and depositing all their heat there. This is only operative when the photoelectrons transit the plasmasphere, 2) the plasmasphere heating rate, which can be adjusted artificially to match the observed topside electron temperature both day and night. This parameter is meant to account for possible unknown heat sources, such as the ring current. It is most useful at night when there are no photoelectrons because both conjugate ionospheres are in darkness.
The best agreement with the observations was reached with the multiplier of 2.75 for the NRLMSISE-00 H density. Because the H density has a large scale height, a simple altitude-independent multiplier is adequate. Figure 3 shows that the model produces the observed topside Te variations in both hemispheres. Figure 3 also demonstrates that the calculated topside ion temperatures are in a good agreement with the observations. Figure 4 shows that matching the topside temperatures and using a multiplier of 2.75 for the NRLMSISE-00 H density produces a good match to all the satellite plasma density observations.
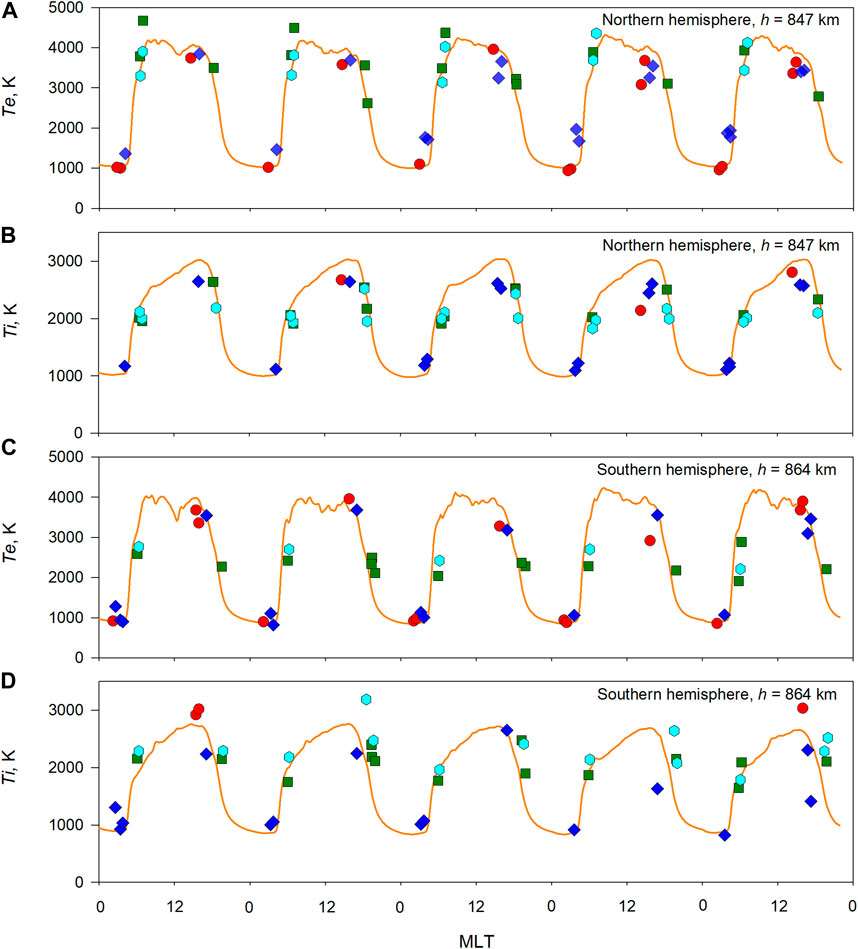
FIGURE 3. Diurnal variations of the topside ionosphere electron Te(A,C) and ion Ti(B,D) temperatures at both ends of the L = 1.75 plasma flux tube during 27 April—1 May 2017. The symbols show DMSP data: F15 (red circles), F16 (blue diamonds), F17 (dark green squares), and F18 (cyan hexagons). The solid orange line shows the FLIP model simulations using the NRLMSIS H density multiplied by a factor of 2.75.
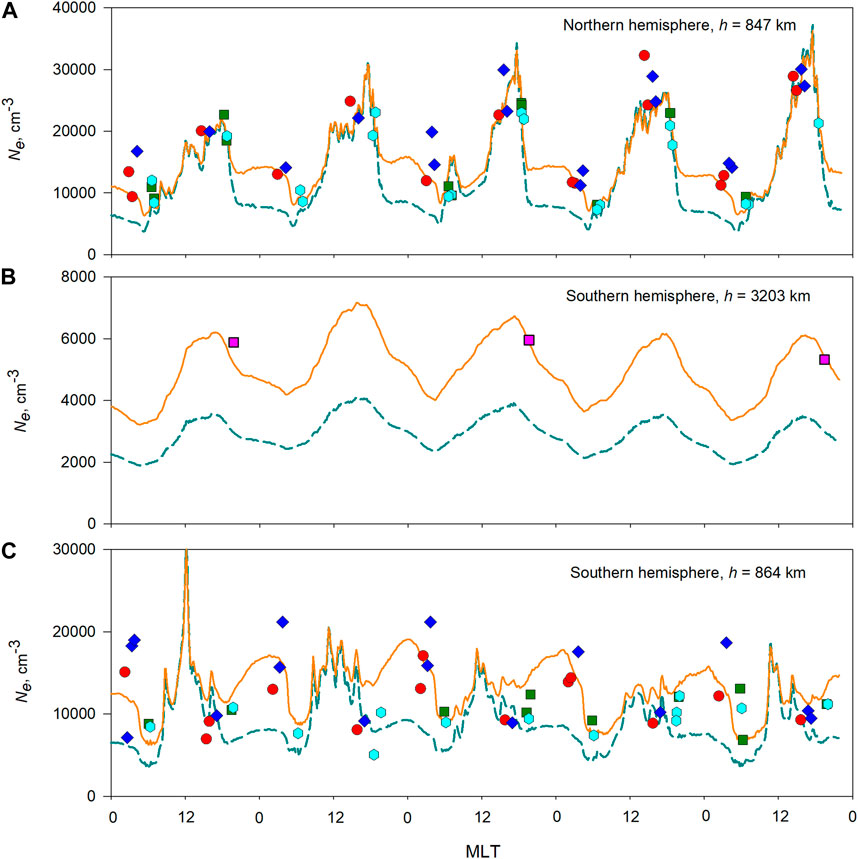
FIGURE 4. Diurnal variations of the plasma density in the topside ionosphere at northern (A) and southern (C) ends and in the high-altitude plasmaspheric part (B) of the L = 1.75 flux tube during 27 April—1 May 2017. The dashed dark blue line shows the simulation using the standard NRLMSIS H density while the solid orange line is for the NRLMSIS H density multiplied by a factor of 2.75. In the top and bottom panels, the symbols show DMSP data: F15 (red circles), F16 (blue diamonds), F17 (dark green squares), and F18 (cyan hexagons). Pink squares on the middle panel denote the Arase satellite data.
With regard to the F2-layer peak density NmF2, the model/data agreement is excellent in the Northern hemisphere (Figure 2) while the difference in the Southern hemisphere reaches ∼60% for some days near noon. A possible reason for the difference could be the separation between the Port Stanley digisonde and the Melrose conjugate point (see Figure 1) for which the simulation was made. However, a simulation made for the actual coordinates of Port Stanley has the same behavior. It is possible that the ∼60% underestimation of the midday NmF2 by the FLIP model in the Southern hemisphere indicates that the midday O to N2 density ratio is too low in the NRLMSISE-00 model. Another capability of the FLIP model was used to test this. It can reproduce the measured NmF2 by modifying the neutral temperature in the NRLMSISE-00 model to change the O to N2 density ratio self-consistently. This simulation (not shown) found that good model/data agreement was reached for NmF2 with midday neutral temperatures a moderate ∼60–70 K lower than that of the NRLMSISE-00 model. This NmF2 algorithm was not used for the results presented here because the NmF2 variation at the southern end of the flux tube may be different from Port Stanley and because these model/data differences have only a small effect on our key results in the plasmasphere and topside ionosphere. The topside ionosphere and plasmasphere densities deviate from the main results up to ∼10% and ∼5%, respectively.
To determine the sensitivity of the ionosphere-plasmasphere system to the H density, an additional simulation was made with the standard NRLMSISE-00 H density with the model adjusting the plasmasphere heating rate to maintain the model-data temperature agreement in the topside ionospheres. Figure 4 demonstrates that decreasing the H density by a factor of 2.75 reduces the simulated nighttime plasma density in the topside ionospheres of both hemispheres by up to ∼50% and the simulated afternoon plasmasphere density by up to ∼45%.
The decrease by a factor of 2.75 in the H density also causes up to a ∼35% decrease in the simulated NmF2 at night in both hemispheres (Figure 2). In the Northern hemisphere, this worsens the agreement with the observations. In the Southern hemisphere, the model/data agreement improves for some hours but worsens at other times.
4 Discussion
This study examines the impact of the neutral hydrogen density in the lower exosphere on the ionosphere-plasmasphere system as a whole. Let us consider how the current results compare with previous studies.
This study complements and expands on the Kotov et al. (2018) study, which employed similar analysis techniques in the European sector at L ∼2.1 from 2016 to 2018. Although there were only observational data for the Northern hemisphere in that study, a similar sensitivity to the H density was shown for the topside ionosphere in all the seasons and for the plasmasphere near the winter solstice. In addition to being in a different longitude sector, this current study is different in being during a transition from spring to summer.
The current results verify that the ionosphere-plasmasphere system’s sensitivity to the lower exosphere H density is strong. Increasing the H density from the standard NRLMSISE-00 model by a factor of 2.75 enhances the ionosphere-plasmasphere H+ fluxes by a factor of ∼2.0–2.5 (Figure 5), and that increases the plasma density in the afternoon plasmasphere by up to ∼80% and in the nighttime topside ionosphere up to ∼100%. These sensitivity estimates for the H+ fluxes and plasma densities are close to those found by Kotov et al. (2015), Kotov et al., 2016, and Kotov et al. (2018) that were obtained for different seasons in the European sector.
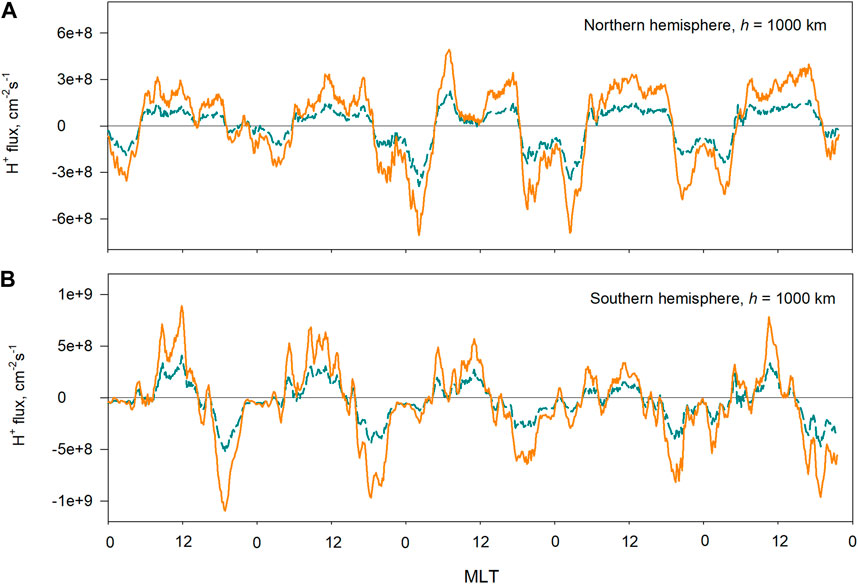
FIGURE 5. Diurnal variations of the ionosphere-plasmasphere H+ flux at 1000 km altitude at the northern (A) and southern (B) ends of the L = 1.75 flux tube during 27 April—1 May 2017. The dashed dark blue line shows the simulation with the standard NRLMSIS density while the solid orange line is for the NRLMSIS H density multiplied by a factor of 2.75. The plots are running average of the simulated fluxes over 45 min intervals.
It is difficult to compare our results with the results obtained by Krall et al. (2018) with the SAMI3 model. The reason is that the SAMI3 was not constrained by ionospheric observations (hmF2 and topside Te), and their simulation results were not compared with measurements of the plasma density in the plasmasphere and topside ionosphere. Also, Krall et al. averaged their results over all longitudes while we consider one flux tube. This may be one of the reasons for the much smaller sensitivity of the steady-state plasmasphere of Krall et al. to strong changes in the H density (see Figure 2 of their paper). One other reason for FLIP/SAMI3 differences could be that Krall et al. simulated for somewhat higher L-shells (L = 4.0 and L = 5.2). On the other hand, our observation-based simulations with the FLIP model for L = 4.0 (not shown) indicate just as high a sensitivity of the plasmasphere to the H density as for L = 1.75. At the same time, there is a reasonable agreement between the plasmasphere refilling rates seen from our simulation at L = 4.0 and those of Krall et al. (2018).
An examination of the variation of the O+/H+ transition height lends additional support for the 2.75 multiplication factor for the daytime NRLMSISE-00 H density. Figure 6 shows that the transition height is quite sensitive to the H density during the day but almost insensitive during the night. This nighttime feature is understandable because, when the solar activity is low, the downward nighttime H+ flux is responsible not only for the H+ density in the topside ionosphere but for the O+ density as well. Much of the O+ in the nighttime topside ionosphere is from the H+ that is supplied by the downward H+ flux. Thus, more H+ leads to more O+. As a result, the nighttime O+/H+ transition height shows only a small dependence on the H+ flux which changes significantly with the H density (Figure 5). Earlier results for the European sector showed similar behavior (Kotov et al., 2015).
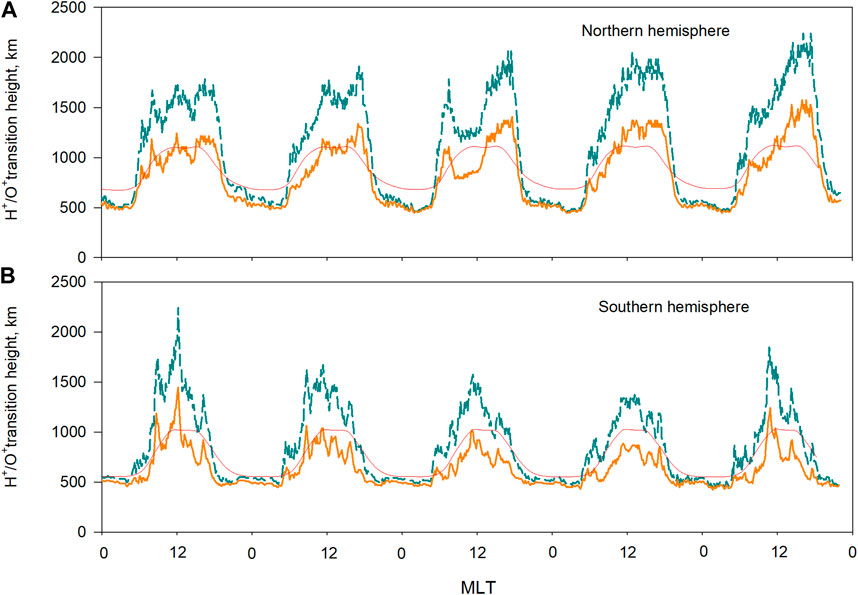
FIGURE 6. Diurnal variation of the H+/O+ transition height at the northern (A) and southern (B) ends of the L = 1.75 flux tube during 27 April—1 May 2017. The dashed dark blue line shows the simulation with the standard NRLMSIS density while the solid orange line is for the NRLMSIS H density multiplied by a factor of 2.75. The thin red solid line shows the variation calculated using empirical TBT-2015 model of ion composition of climatological International Reference Ionosphere model (IRI-2020 version).
During the day, the H+ flux is upward and removes H+ from the topside ionosphere. The H+ is produced from the O+ and the amount is directly proportional to the H density. On the contrary, the amount of O+ is determined mostly by ionization processes in the atmosphere followed by upward diffusion to the topside ionosphere. There is a small decrease in the O+ density with an increase in the H density through the O++H reaction. However, this effect is much smaller than the loss of H+ due to the upward flux. As a result, there is an increasing difference between the H+ and O+ densities with the increase in the daytime H density, which leads to the high sensitivity of the daytime O+/H+ transition height to the H density.
The FLIP model transition height behavior is supported by the empirical climatological TBT-15 model of topside ion composition. The TBT-15 model is included in the International Reference Ionosphere (IRI-2020) model (Truhlik et al., 2015; Bilitza et al., 2022). It was constructed from an extensive database of independent satellite observations. The TBT-15 model daytime O+/H transition height is closer to our simulations with the multiplier 2.75 to the NRLMSISE-00 H density.
The estimated 2.75 multiplier to the NRLMSISE-00 H density agrees reasonably with the multiplier of ∼2 implied by extensive optical observations of Balmer-α emission conducted during the 23rd solar cycle by the Wisconsin H-alpha Mapper (WHAM) Fabry-Perot located at the Pine Bluff Observatory (43.08°N, 89.67°W) in Wisconsin (Gallant et al., 2019) and Kitt Peak Observatory (31.96°N, 111.60°W) in Arizona (Nossal et al., 2012). The latitudes and longitudes of both observatories are close to the coordinates of the starting point of the flux tube we simulate (see Figure 1). Note that while our technique estimates the dayside H density in the lower exosphere, WHAM estimates the H density for the dusk and dawn periods in the same region. Thus, the techniques complement each other very well, and using both techniques jointly at the same region would certainly provide more opportunities for the lower exosphere H density investigation.
The multiplier 2.75 found here is also in excellent agreement with values obtained in numerous previous investigations performed for low/low-to-medium solar activity and magnetically quiet conditions in the European sector (Kotov et al., 2015; Kotov et al., 2016; Kotov et al., 2018; Kotov et al., 2019) and Asian sector (Panasenko et al., 2021). These previous studies show the multiplier to the NRLMSIS H density ranging from 2.0 to 3.0 for low/medium and extremely low solar activity, respectively. Recent work of Wan et al. (2022) employing GUVI Layman-α observations for the 2002–2007 period, which covers the same solar activity conditions, also shows a multiplier of ∼2.
Based on the accumulation of evidence, we recommend that ionosphere modelers increase the neutral H density from the NRLMSISE-00 model by a factor of 2 for low-to-medium solar activity and magnetically quiet conditions so that the simulated plasma densities in the ionosphere and plasmasphere can reproduce the plasma observations with acceptable accuracy.
5 Conclusion
The main conclusions from the results of this observation-based study of the entire ionosphere-plasmasphere system performed for the period with low solar and magnetic activities are the following.
1) The entire ionosphere-plasmasphere system is highly sensitive to the neutral hydrogen density in the lower exosphere. Increasing the H density by a factor of 2.75 from the standard NRLMSISE-00 values increases the simulated plasma density in the afternoon plasmasphere up to ∼80% and in the nighttime topside ionosphere up to ∼100%, bringing the simulated densities into agreement with the Arase and DMSP satellite observations. The last point indicates that using the NRLMSISE-00 H density causes unacceptable errors in the simulated plasma density of the near-Earth plasma shells. We alert the space science community of this problem.
2) The high sensitivity obtained for the American longitudinal sector for L = 1.75 agrees well with the high sensitivity seen in the simulations in the European sector at L = 2.1 (Kotov et al., 2015; Kotov et al., 2016; Kotov et al., 2018).
3) The estimated multiplier 2.75 to the NRLMSISE-00 H density is consistent with values obtained in the numerous previous investigations conducted for low-to-medium solar activity and magnetically quiet conditions with different techniques in the American sector (Nossal et al., 2012; Gallant et al., 2019), European sector (Kotov et al., 2015; Kotov et al., 2016; Kotov et al., 2018; Kotov et al., 2019), and Asian sector (Panasenko et al., 2021) and around the globe (Wan et al., 2022). These determinations that use independent techniques for different conditions bolster the need to reexamine the H density in the NRLMSISE-00 model at least for periods with low solar and magnetic activities.
Data availability statement
The raw data supporting the conclusion of this article will be made available by the authors, without undue reservation.
Author contributions
DK proposed concept of the study, participated in conducting simulations with FLIP model and interpretation of the results and wrote the first draft of the manuscript. PR consulted on the simulations by FLIP model, participated in the interpretation of the results, and contributed to writing the manuscript. MR and OB processed and analyzed satellite data. VT contributed to satellite data analyzes. SN and EM consulted on the features of optical data discussed in the manuscript. TZ and ID processed the digisondes data. YM, FT, AK, YK, MK, SN, AM, and IS were responsible to analysis of Arase satellite data. MH consulted on the DMSP satellites data. All authors contributed to the article and approved the submitted version.
Funding
DK and MR were supported by the National Academy of Sciences of Ukraine (project 0122U000187 “Investigation of variations in the ion composition of the topside ionosphere during the weak maximum of the 25th solar cycle”). OB was supported by the State Institution National Antarctic Scientific Center of the Ministry of Education and Science of Ukraine (project 0121U112420 “Investigation of machine learning applicability for detection of traveling ionospheric disturbances”). VT was supported, in part, by grant LTAUSA17100 of the Ministry of Education, Youth and Sports of the Czechia. SN is supported by National Science Foundation grant #AGS-2050072. EM is supported by National Science Foundation grant AGS-2050077. YM is supported by JSPS 20H01959.
Acknowledgments
DK, MR, OB, TZ, and ID are grateful to every Ukrainian soldier, volunteer, medic, personnel of emergency and municipal services, and to all the Ukrainians whose fearless resistances to genocidal war of Russia allow Ukrainian scientists to do their usual peaceful job. VT also fully supports this statement.
Conflict of interest
The authors declare that the research was conducted in the absence of any commercial or financial relationships that could be construed as a potential conflict of interest.
Publisher’s note
All claims expressed in this article are solely those of the authors and do not necessarily represent those of their affiliated organizations, or those of the publisher, the editors and the reviewers. Any product that may be evaluated in this article, or claim that may be made by its manufacturer, is not guaranteed or endorsed by the publisher.
References
Bilitza, D., Pezzopane, M., Truhlik, V., Altadill, D., Reinisch, B. W., and Pignalberi, A. (2022). The international reference ionosphere model: A review and description of an ionospheric benchmark. Rev. Geophys.60, e2022RG000792. doi:10.1029/2022RG000792
Borovsky, J. E., Denton, M. H., Denton, R. E., Jordanova, V. K., and Krall, J. (2013). Estimating the effects of ionospheric plasma on solar wind/magnetosphere coupling via mass loading of dayside reconnection: Ion-plasma-sheet oxygen, plasmaspheric drainage plumes, and the plasma cloak. J. Geophys. Res. Space Phys.118, 5695–5719. doi:10.1002/jgra.50527
Emmert, J. T., Drob, D. P., Picone, J. M., Siskind, D. E., Jones, M., Mlynczak, M. G., et al. (2021). Nrlmsis 2.0: A whole-atmosphere empirical model of temperature and neutral species densities. Earth Space Sci.8 (3), e2020EA001321. doi:10.1029/2020EA001321
Gallant, M. A., Mierkiewicz, E. J., Nossal, S. M., Qian, L., Burns, A. G., Zacharias, A. R., et al. (2019). Signatures of thermospheric-exospheric coupling of hydrogen in observed seasonal trends of H α intensity. J. Geophys. Res. Space Phys.124 (6), 4525–4538. doi:10.1029/2018JA026426
Huang, X., and Reinisch, B. W. (1996). Vertical electron density profiles from the digisonde network. Adv. Space Res.18 (6), 121–129. doi:10.1016/0273-1177(95)00912-4
Kanekal, S., and Miyoshi, Y. (2021). Dynamics of the terrestrial radiation belts: A review of recent results during the VarSITI (variability of the sun and its terrestrial impact) era, 2014–2018. Prog. Earth Planet. Sci.8, 35. doi:10.1186/s40645-021-00413-y
Kasahara, Y., Kasaba, Y., Kojima, H., Yagitani, S., Ishisaka, K., Kumamoto, A., et al. (2018). The plasma wave experiment (PWE) on board the Arase (ERG) satellite. Earth, Planets Space70 (1), 86. doi:10.1186/s40623-018-0842-4
Kotov, D. V., Richards, P. G., Bogomaz, O. V., Chernogor, L. F., Truhlík, V., Emelyanov, L. Y., et al. (2016). The importance of neutral hydrogen for the maintenance of the midlatitude winter nighttime ionosphere: Evidence from IS observations at Kharkiv, Ukraine, and field line interhemispheric plasma model simulations. J. Geophys. Res. Space Phys.121, 7013–7025. doi:10.1002/2016JA022442
Kotov, D. V., Richards, P. G., Truhlík, V., Bogomaz, O. V., Shulha, M. O., Maruyama, N., et al. (2018). Coincident observations by the Kharkiv IS radar and ionosonde, DMSP and Arase (ERG) satellites, and FLIP model simulations: Implications for the NRLMSISE-00 hydrogen density, plasmasphere, and ionosphere. Geophys. Res. Lett.45, 8062–8071. doi:10.1029/2018GL079206
Kotov, D. V., Richards, P. G., Truhlík, V., Maruyama, N., Fedrizzi, M., Shulha, M. O., et al. (2019). Weak magnetic storms can modulate ionosphere-plasmasphere interaction significantly: Mechanisms and manifestations at mid-latitudes. J. Geophys. Res. Space Phys.124, 9665–9675. doi:10.1029/2019JA027076
Kotov, D. V., Truhlík, V., Richards, P. G., Stankov, S., Bogomaz, O. V., Chernogor, L. F., et al. (2015). Night-time light ion transition height behaviour over the Kharkiv (50°N, 36°E) IS radar during the equinoxes of 2006–2010. J. Atmos. Sol. Terr. Phys.132, 1–12. doi:10.1016/j.jastp.2015.06.004
Krall, J., Glocer, A., Fok, M.-C., Nossal, S. M., and Huba, J. D. (2018). The unknown hydrogen exosphere: Space weather implications. Space weather.16, 205–215. doi:10.1002/2017SW001780
Kumamoto, A., Tsuchiya, F., Kasahara, Y., Kasaba, Y., Kojima, H., Yagitani, S., et al. (2018). High frequency analyzer (HFA) of plasma wave experiment (PWE) onboard the Arase spacecraft. Earth, Planets Space70 (1), 82. doi:10.1186/s40623-018-0854-0
Malaspina, D. M., Ripoll, J.-F., Chu, X., Hospodarsky, G., and Wygant, J. (2018). Variation in plasmaspheric hiss wave power with plasma density. Geophys. Res. Lett.45, 9417–9426. doi:10.1029/2018GL078564
Matsuoka, A., Teramoto, M., Nomura, R., Nose, M., Fujimoto, A., Tanaka, Y., et al. (2018). The ARASE (ERG) magnetic field investigation. Earth, Planets Space70 (1), 43. doi:10.1186/s40623-018-0800-1
Miyoshi, Y., Hori, T., Shoji, M., Teramoto, M., Chang, T-F., Segawa, T., et al. (2018b). The ERG science center. Earth, Planets, Space70, 96. doi:10.1186/s40623-018-0867-8
Miyoshi, Y., Shinohara, I., Takashima, T., Asamura, K., Higashio, N., Mitani, S., et al. (2018a). Geospace exploration project ERG. Earth, Planets Space70 (1), 101. doi:10.1186/s40623-018-0862-0
Nossal, S. M., Mierkiewicz, E. J., and Roesler, F. L. (2012). Observed and modeled solar cycle variation in geocoronal hydrogen using NRLMSISE-00 thermosphere conditions and the Bishop analytic exosphere model. J. Geophys. Res.117, A03311. doi:10.1029/2011JA017074
Panasenko, S. V., Kotov, D. V., Otsuka, Y., Yamamoto, M., Hashiguchi, H., Richards, P. G., et al. (2021). Coupled investigations of ionosphere variations over European and Japanese regions: Observations, comparative analysis, and validation of models and facilities. Prog. Earth Planet Sci.8, 45. doi:10.1186/s40645-021-00441-8
Picone, J. M., Hedin, A. E., Drob, D. P., and Aikin, A. C. (2002). NRLMSISE-00 empirical model of the atmosphere: Statistical comparisons and scientific issues. J. Geophys. Res.107 (A12), 15-21–15-16. doi:10.1029/2002JA009430
Rich, F. J. (1994). Users guide for the topside ionospheric plasma monitor (SSIES, SSIES-2, and SSIES-3) on spacecraft of the Defense Meteorological Satellite Program. volume 1: Technical description. (Technical report PL-TR-94-2187). Phillips Laboratory. Available at https://satdat.ngdc.noaa.gov/dmsp/docs/Rich%20-%201994%20-%20Users%20Guide%20SSIES-1%20SSIES-2%20SSIES-3%20-%20PL-TR-94-2187.pdf.
Richards, P. G. (1991). An improved algorithm for determining neutral winds from the height of the F2 peak electron density. J. Geophys. Res.96 (A10), 17839–17846. doi:10.1029/91JA01467
Richards, P. G., Bilitza, D., and Voglozin, D. (2010). Ion density calculator (idc): A new efficient model of ionospheric ion densities. Radio Sci.45, RS5007. doi:10.1029/2009RS004332
Richards, P. G., and Torr, D. G. (1985). Seasonal, diurnal, and solar cyclical variations of the limiting H+ flux in the Earth’s topside ionosphere. J. Geophys. Res.90 (A6), 5261–5268. doi:10.1029/JA090iA06p05261
Truhlik, V., Bilitza, D., and Třisková, L. (2015). Towards better description of solar activity variation in the International Reference Ionosphere topside ion composition model. Adv. Space Res.55 (8), 2099–2105. doi:10.1016/j.asr.2014.07.033
Truhlik, V., Triskova, L., and Smilauer, J. (2004). New advances in empirical modelling of ion composition in the outer ionosphere. Adv. Space Res.33 (6), 844–849. doi:10.1016/j.asr.2003.06.006
Waldrop, L., and Paxton, L. J. (2013). Lyman α airglow emission: Implications for atomic hydrogen geocorona variability with solar cycle. J. Geophys. Res. Space Phys.118, 5874–5890. doi:10.1002/jgra.50496
Keywords: plasmasphere, ionosphere, exosphere, hydrogen, interhemispheric coupling, multiinstrumental observations, observation-based simulation, NRLMSISE-00 hydrogen density
Citation: Kotov D, Richards PG, Reznychenko M, Bogomaz O, Truhlík V, Nossal S, Mierkiewicz E, Zhivolup T, Domnin I, Miyoshi Y, Tsuchiya F, Kumamoto A, Kasahara Y, Kitahara M, Nakamura S, Matsuoka A, Shinohara I and Hairston M (2023) Interhemispheric ionosphere-plasmasphere system shows a high sensitivity to the exospheric neutral hydrogen density: a caution of the global reference atmospheric model hydrogen density. Front. Astron. Space Sci. 10:1113706. doi: 10.3389/fspas.2023.1113706
Received: 01 December 2022; Accepted: 23 May 2023;
Published: 05 June 2023.
Edited by:
Huixin Liu, Kyushu University, JapanReviewed by:
Sai Gowtam Valluri, University of Alaska Fairbanks, United StatesStavros Dimitrakoudis, National and Kapodistrian University of Athens, Greece
Copyright © 2023 Kotov, Richards, Reznychenko, Bogomaz, Truhlík, Nossal, Mierkiewicz, Zhivolup, Domnin, Miyoshi, Tsuchiya, Kumamoto, Kasahara, Kitahara, Nakamura, Matsuoka, Shinohara and Hairston. This is an open-access article distributed under the terms of the Creative Commons Attribution License (CC BY). The use, distribution or reproduction in other forums is permitted, provided the original author(s) and the copyright owner(s) are credited and that the original publication in this journal is cited, in accordance with accepted academic practice. No use, distribution or reproduction is permitted which does not comply with these terms.
*Correspondence: Dmytro Kotov, ZG1pdHJ5a290b2ZmQGdtYWlsLmNvbQ==