 Shalini Ganguly1
 Yuan Li1*
 Valeria Olivares2
 Yuanyuan Su2
 Francoise Combes3Sampadaa Prakash1Stephen Hamer4Pierre Guillard5,6Trung Ha1
- 1Department of Physics, University of North Texas, Denton, TX, United States
- 2Department of Physics and Astronomy, University of Kentucky, Lexington, KY, United States
- 3LERMA, Observatoire de Paris, PSL Research University, CNRS, Sorbonne University, Paris, France
- 4Department of Physics, University of Bath, Bath, United Kingdom
- 5Sorbonne Université, CNRS, UMR7095, Institut d’Astrophysique de Paris, Paris, France
- 6Institut Universitaire de France, Ministére de l’Education Nationale, de l’Enseignement Supérieur et de la Recherche, Paris, France
The intracluster medium (ICM) in the centers of galaxy clusters is heavily influenced by the “feedback” from supermassive black holes (SMBHs). Feedback can drive turbulence in the ICM and turbulent dissipation can potentially be an important source of heating. Due to the limited spatial and spectral resolutions of X-ray telescopes, direct observations of turbulence in the hot ICM have been challenging. Recently, we developed a new method to measure turbulence in the ICM using multiphase filaments as tracers. These filaments are ubiquitous in cluster centers and can be observed at very high resolution using optical and radio telescopes. We study the kinematics of the filaments by measuring their velocity structure functions (VSFs) over a wide range of scales in the centers of
1 Introduction
Most relaxed clusters harbor cool cores. In the absence of an effective heating source, the high radiative cooling rate of the gas is expected to lead to a cooling flow of 100 s M⊙ yr −1 onto the Brightest Cluster galaxies (BCGs) (Fabian, 1994). Both observations and theoretical models suggest that such a classical cooling flow is suppressed by the feedback from the active galactic nuclei (AGNs) powered by supermassive black holes (SMBHs) at the centers of these systems. The jets and/or outflows from the SMBHs lead to the formation of shocks and bubbles (cavities) in the intracluster medium (ICM) that can be detected in X-ray and radio. These feedback processes can inject thermal and mechanical energies into the ICM, leading to a quasi-static hot atmosphere where cooling and heating are balanced on average (McNamara and Nulsen, 2007; Fabian, 2012, and references therein). Exactly how the energy from SMBHs becomes coupled to the ICM is not well-understood. The dissipation of jet-driven turbulence is one of the proposed heating mechanisms that have been discussed extensively in recent years.
Turbulent motion in the hot ICM has been probed using X-ray observations (e.g., Sanders et al., 2011; Sanders et al., 2020; Gatuzz et al., 2022a; Gatuzz et al., 2022b; de Vries et al., 2023). For example, surface brightness fluctuations observed by Chandra can be used to measure turbulence assuming that velocity fluctuations are proportional to density fluctuations (Zhuravleva et al., 2014). In addition, Hitomi has measured X-ray line widths in the central regions of the Perseus Cluster (Hitomi Collaboration, 2016). Although these X-ray studies have limited spatial and spectral resolutions, they consistently suggest that cluster cores are turbulent, and that the inferred level of heating from turbulent dissipation can balance radiative cooling in many systems (Zhuravleva et al., 2014; Zhuravleva et al., 2018).
On the other hand, numerical models of AGN feedback have generally found a low level of turbulence or turbulent dissipation. These include both plane-parallel models (Reynolds et al., 2015; Bambic et al., 2018) and more realistic setups (Weinberger et al., 2017; Prasad et al., 2018). Heating of the ICM is usually achieved via shock dissipation (Li et al., 2017), adiabatic processes (Yang and Reynolds, 2016), sound wave dissipation (Bambic and Reynolds, 2019), and/or mixing (Hillel and Soker, 2016). Interestingly, these simulations often produce a velocity dispersion consistent with the Hitomi results on similar spatial scales (tens of kpc scales) (e.g., Gaspari et al., 2018; Prasad et al., 2018).
Multiwavelength observations show that cool-core cluster centers are often multiphase. Cool ionized gas can be observed in the Hα using optical telescopes (McDonald et al., 2010; Hamer et al., 2016). Several theories have been proposed whereby the hot ICM becomes thermally unstable and condenses to form cool clouds aided by jet uplifting and turbulence (Li and Bryan, 2014; McNamara et al., 2016; Voit, 2018). The cool gas fuels AGN activities, which in turn provides feedback to the ICM. Observationally, cool filaments are often spatially associated with soft X-ray features and some of the cool filaments are found to be at the edge of the X-ray bubbles (Werner et al., 2014; Fabian et al., 2016). Some of the cool Hα filaments also have a molecular component. CO observations reveal large reservoirs of cold molecular gas with masses of
Cluster center multiphase filaments have been observed in great detail in recent years with optical telescopes equipped with Integral Field Units (IFUs), such as the Multi Unit Spectroscopic Explorer (MUSE), as well as radio telescopes such as the Atacama Large Millimeter/submillimeter Array (ALMA). These high-resolution observations reveal complex kinematics of the filaments on small scales, and generally a lack of ordered motion on large scales, suggesting that their motions may be turbulent (e.g., Tremblay et al., 2018). The velocity dispersion of the cool filaments on large scales is generally consistent with that of the hot ICM inferred from X-ray observations, suggesting that the kinematics of different phases of the ICM are coupled on large scales (Gendron-Marsolais et al., 2018).
Recently, Li et al. (2020b) have proposed a new method to study the kinematics of multiphase filaments in galaxy clusters. They compute the first-order velocity structure function (VSF) of the filaments in three nearby galaxy clusters: Perseus, Abell 2,597 and Virgo, and find their motion to be turbulent. The inferred driving scales are found to be roughly the sizes of the X-ray bubbles, suggesting that the turbulent motion is driven by SMBH feedback. Within the limited spatial scale that can be probed with Chandra X-ray observations, turbulence traced with cool filaments is consistent with the X-ray measurements (Zhuravleva et al., 2014; Hitomi Collaboration, 2016). However, the VSFs of all three systems show steeper slopes than the classical Kolmogorov expectation. The exact reason for this is unclear. Proposed theoretical explanations include magnetic fields, shocks, gravity waves, and plasma instabilities (Wang et al., 2021; Arzamasskiy et al., 2022; Hu et al., 2022; Mohapatra et al., 2022). It may also simply imply that we are mostly tracing the bulk motion of the jets and the jet-inflated bubbles, rather than the cascade of turbulence (Zhang et al., 2022). If we assume that cool filaments are still good kinematic tracers of the hot plasma on small scales, the steep VSFs suggest that the amount of turbulent kinetic energy on small scales is much less than previous estimations based on a Kolmogorov cascade. Hence the amount of turbulent heating may be much less as well.
In this paper, we analyze the kinematics of 9 cool-core clusters with multiphase filaments observed using the MUSE and 4 using the Atacama Large Millimeter/submillimeter Array (ALMA). The large sample size now allows us to achieve a deeper and more complete understanding of the motion of the ICM as well as the role of turbulent heating. The paper is structured as follows: we present the data acquisition and our method of calculating VSFs in Section 2. We analyze the VSFs in Section 3. In Section 4, we discuss the uncertainties and biases involved in our analysis, different drivers of turbulent motions in cluster centers, and turbulent heating rates in these systems. We conclude our work in Section 5.
2 Data processing
2.1 Data acquisition
We procure our data from the extensive survey of 15 cool-core clusters carried out by Olivares et al. (2019). Out of the 15 sources, 2 sources (M87 and Abell 2,597) have already been analyzed by Li Y. et al. (2020). In the remaining 13 sources, 9 have been observed with both MUSE and ALMA, while 4 have only ALMA data available. The detailed data description can be found in Olivares et al. (2019). We only comment on the key aspects of the data extraction process that are relevant to our analyses here.
MUSE is a second generation instrument for the Very Large Telescope (VLT). It is an optical image slicing IFU with a field-of-view of 1′× 1′. The MUSE data (ESO programme 094. A-0859A)) have a spatial sampling of 0.2″ and a spectral resolution of 1.5 Å. The Hα velocity maps used in our VSF analysis are obtained by fitting a single Gaussian profile to all emission lines using the PLATEFIT spectral-fitting routine (Tremonti et al., 2004). An additional Gaussian smoothing kernel was applied to some sources in Olivares et al. (2019). For consistency, we use the original unsmoothed data for all of our analysis. We have verified that our primary results are not sensitive to the smoothing, likely because all our sources are nearby and bright. For all sources, we only select emission-line flux measurements with signal-to-noise ratio (SNR)
The CO molecular gas data comprise of both new and archival ALMA observations of CO(1–0), CO(2–1) and/or CO(3–2) transitions. ALMA maps are made using the “masked moment” technique described by Dame (2011). The technique creates a three-dimensional mask that considers spatial and spectral coherence in position-velocity space by smoothing the clean data cube with a Gaussian kernel whose full width at half maximum (FWHM) is equal to the synthesized beam. The velocity maps are then created using this mask on the unsmoothed cube keeping only the regions where the CO lines are detected with a significance greater than 3σ. When multiple transitions are available, we only use CO(1–0) transition line in our analysis for consistency. The sampling size varies from source to source, but is typically comparable to that used by MUSE for the same target.
2.2 Data analysis
The theoretical study of steady-state incompressible turbulence is first presented in Kolmogorov (1941). Since then, extensive studies have been conducted to extend such theories to compressible (supersonic) turbulence (Boldyrev, 2002; Kritsuk et al., 2007; Federrath, 2013; Padoan et al., 2016). A VSF is a correlation function that measures the relation between velocities and physical scales. In a Kolmorogov cascade, a two-point VSF of order p defined by Sp(ℓ) ≡⟨|δv(ℓ)|p⟩ scales as Sp(ℓ) ∝ ℓp/3, where ℓ denotes the distance between the two points, and ⟨|δv(ℓ)|p⟩ is the mean of the absolute velocity difference to the power of p at this distance. We compute the first-order VSFs for our sources, similar to Li Y. et al. (2020). For every pair of pixels on the map, we record their spatial separation ℓ and velocity difference δv. We then calculate the average |δv| in bins of ℓ to obtain the VSF. For a classical Kolmogorov turbulent flow, S1(ℓ) ≡⟨|δv|⟩∝ ℓ1/3. For compressible (supersonic) turbulence, the power-law index is ∼1/2 (Boldyrev, 1998). The velocities used in our analysis are 1D line of sight (LOS) velocities obtained from the line shifts while the positions are projected positions in the 2D plane of the sky. We discuss projection effects in more detail in Section 4.1.
3 Results
In this section, we present our first-order VSF analysis of the Hα filaments, summarized in Figure 1. The leftmost panels in Figure 1 show the Chandra X-ray image of these sources, with the corresponding Hα filament flux contours (in red) overlaid to show their spatial correlation. To highlight substructures such as sloshing cold fronts or X-ray cavities in the ICM, we applied unsharp masks to the Chandra images. We smooth the original image using two different scales: the expected cavity size and the size of the cool core. We then subtract one smoothed image from the other, making the surface brightness edges more prominent. The middle panel shows the line-of-sight velocities of the Hα filaments. We also divide our maps into inner and outer regions somewhat based on the location of the X-ray bubbles to analyse the correlation between SMBH feedback and turbulence. When possible, we also choose a division such that the numbers of pixels of the inner and the outer regions are similar. The black dashed line in the left and middle panels denotes this boundary between the inner and outer regions. The boundary of the region can sometimes cause artificial features in the VSF that mimic energy injection (Mohapatra and Sharma, 2019; Ha et al., 2022). We have experimented with varying the boundary size by ∼±25% in each system. Our main conclusions are not sensitive to the exact choice of this boundary.
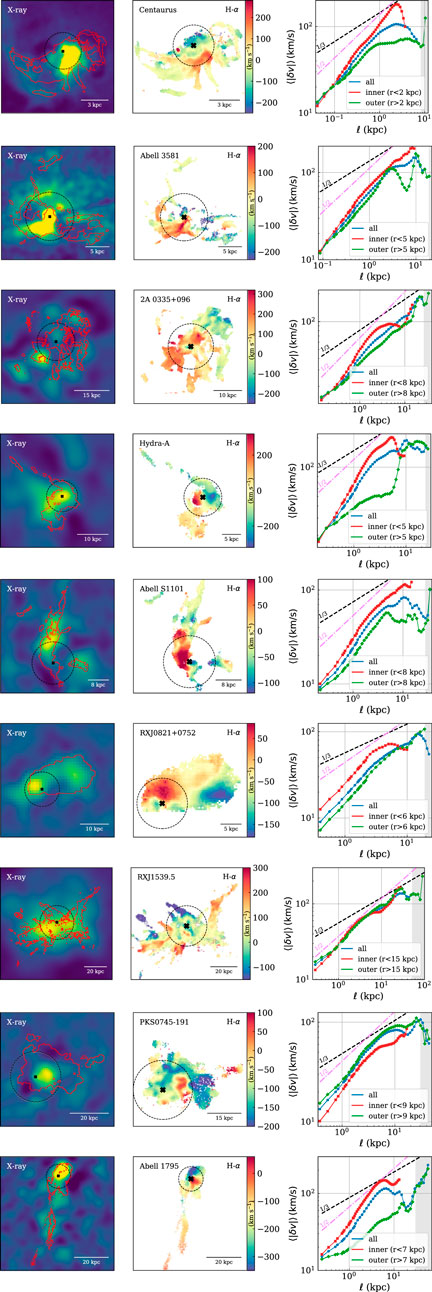
FIGURE 1. Left panel: Chandra X-ray unsharp images, with overlaid Hα flux contours shown in red. The black ‘x’ marks the center of the BCG where the SMBH is located. The black dashed line marks the boundary for inner and outer filaments. Middle panel: The LOS velocity maps of the Hα filaments observed by MUSE. The black ‘x’ and dashed line holds the same meaning as in the left panel. Right panel: The VSF for all filaments (blue), inner filaments (red) and outer filaments (green), with reference lines of slope 1/3 (Kolmogorov turbulence, shown as black dashed line) and slope 1/2 (supersonic turbulence, shown as pink dot-dashed line). The gray shaded area marks the zone with large uncertainties due to sampling limit, defined as bins with less than 20% of peak bin size. Each row shows a system in our sample, labelled in the middle panel. Here we show Centaurus, Abell 3,581 and 2A 0335 + 096. (A) Here we show Hydra-A, Abell S1101 and RXJ0821 + 0752. (B) Here we show RXJ1539.5, PKS0745-191 and Abell 1795.
The corresponding VSFs are shown in the rightmost panels. Most of the VSFs can be described with a single power law on small scales, consistent with the expectation of a turbulent flow. The larger scales show bumps and flattening, suggesting energy injection on these scales. In the following subsections, we categorize the systems based on the unique features revealed in their VSFs. The most common systems have VSFs steeper than Kolmogorov, and the level of turbulence is higher in the inner region, similar to what has been reported in Li Y. et al. (2020). We refer to these as the vanilla systems and discuss them in Section 3.1. Two systems (PKS0745-191 and RXJ1539.5) show the same or even higher level of turbulence in the outer regions, which we discuss in Section 3.2. In Section 3.3, we present the most interesting system Abell 1795, whose VSF shows a robust flattening at small scales, especially in the outer region.
3.1 The vanilla systems
Centaurus The VSF of Centaurus shows a steep slope on small scales, and a broad bump from
Abell 3,581 The VSF of Abell 3,581 has a steep slope on small scales and reveals multiple driving scales at
2A 0335 + 096 X-ray observations of 2A 0335 + 096 reveal multiple cavities (Sanders et al. (2009) report five clear X–ray cavities) as well as multiple X–ray bright blobs. The VSF for 2A 0335 + 096 has a prominent peak at
Hydra-A Hydra-A has strong AGN feedback with multiple generations of X-ray bubbles out to
Abell S1101 Abell S1101 is a system currently experiencing strong AGN feedback based on radio and X-ray observations. The observed radio lobes extend over
RXJ0821 + 0752 The VSF of the inner filaments in RXJ0821 + 0752 reveals a driving scale at
3.2 Systems without higher central turbulence
RXJ1539.5 RXJ1539.5 is the farthest of all the systems in the sample (Olivares et al., 2019). There is no reported detection of X-ray cavities in the literature. The VSF suggests multiple energy injections, at a few kpc,
PKS0745-191 The VSF of PKS0745-191 reveals energy injection at
On average, one would expect the effect of AGN feedback to be stronger closer to the cluster center where the SMBH is located. This has been shown in both analytical calculations and numerical simulations (Fabian et al., 2005a; Li et al., 2017). Most of the systems in our analysis and in Li Y. et al. (2020) do follow this expectation. RXJ1539.5 and PKS0745-191 suggest that AGN feedback can be highly variable, and a strong outburst can be followed by a period of low feedback activities. The rarity of systems like RXJ1539.5 and PKS0745-191 indicates that this phase is short-lived. We speculate that the SMBHs in these systems are preparing for the next major outburst and signs of this may be revealed with deeper observations in the future.
3.3 Kolmogorov slopes on small scales
Abell 1795 Abell 1795 hosts a very long Hα filament that extends over
The most remarkable feature in the VSFs of Abell 1795 is that they flatten on small scales. This flattening is especially prominent for the outer filaments. At ℓ > 1 kpc, the VSF of the inner filaments looks very similar to the other systems with a rather steep slope. The VSF for the outer filaments is much shallower, but is still slightly steeper than Kolmogorov. At ℓ < 1 kpc, the slope becomes very close to Kolmogorov.
The steep slopes of the VSFs found in Li Y. et al. (2020) have been a puzzle. Two of the systems have slopes even steeper than supersonic turbulence. This is seen in many of the systems in our sample as well (see Table 1 for summary). Simulations including magnetic fields do not produce such steep slopes either (Mohapatra et al., 2022). Recent kinetic plasma simulations also show power spectra steeper than Kolmogorov, but the slope is closer to supersonic turbulence within the dynamic range of the simulation (Arzamasskiy et al., 2022).
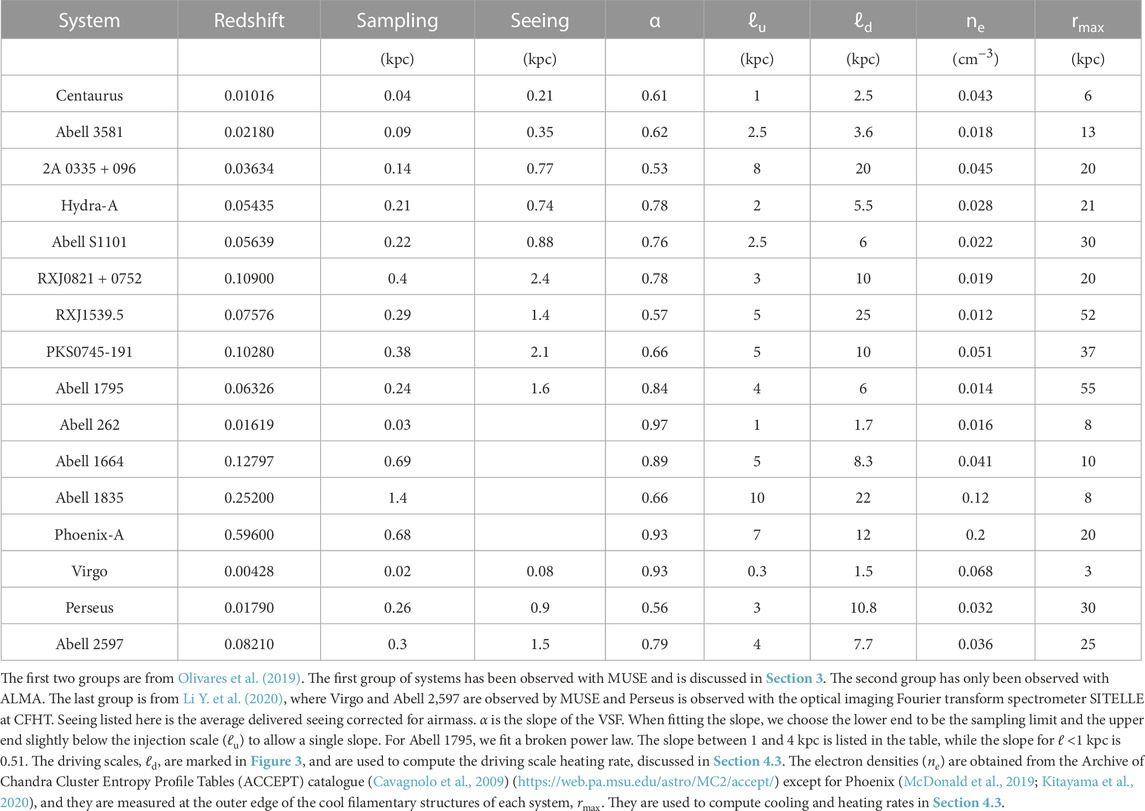
TABLE 1. Summary of the systems used in this study.
The most plausible explanation seems simply that SMBH feedback does not drive volume-filling turbulence efficiently (Zhang et al., 2022). SMBH feedback is highly time-variable, with different generations of bubbles produced over
The main issue with this explanation is that as long as viscosity is suppressed in the ICM (e.g., Zhuravleva et al., 2019), it is generally assumed that turbulence should develop. There are also other drivers of turbulence in the ICM, such as sloshing and Type Ia Supernovae (SNIa) (Li M. et al., 2020). Turbulence driven by these processes is expected to be more volume-filling, so we should still expect a VSF slope close to Kolmogorov on small scales, which is missing in Li Y. et al. (2020).
Abell 1795 demonstrates that the VSF does have a slope very close to the Kolmogorov expectation on very small scales. However, it requires that we can probe small physical scales in places far from the SMBH. Otherwise, the cascade signature can be completely buried under the driver’s behavior. We note that several other systems also exhibit a hint of flattening in their VSF, especially for the outer filaments. These include 2A 0335 + 096, Centaurus, RXJ 1539.5, and Abell S1101, as well as the outer filaments in Abell 2,597 which is noted in Li Y. et al. (2020). Abell 1795 happens to be a nearby system with one of the most spatially extended Hα filaments observed, and therefore, it shows the most convincing flattening in its outer VSF. We show the robustness of the flattening further in Section 4.
4 Discussion
4.1 Uncertainties and biases
We discuss the main sources of uncertainties and potential biases in this section, including seeing/smoothing, noise, projection effects, bulk motion, and sampling limit.
Ground-based optical observations can be affected by “seeing” due to Earth’s atmospheric turbulence. Sometimes, additional smoothing is applied to the observed data to suppress noise, which is usually chosen to have a similar FWHM as the seeing and can have a similar effect. Chen et al. (2022) show that a spatial smoothing function applied to MUSE observations of quasar nebulae can result in a steepening of the VSF at small scales, especially below the FWHM. Since we deal with much brighter sources in this work, the application of smoothing is not essential. We therefore analyze all original data without any additional smoothing applied. This means that our data has more noisy pixels than smoothed data, and noise can flatten VSF on small scales. To understand the effect of smoothing, we have repeated the same analysis for smoothed data. With smoothing, some VSFs show a hint of steepening on small scales, but the overall results are not sensitive to smoothing. The hint of flattening of the VSF in Abell S1101 disappears with smoothing, but for all the other systems discussed in Section 3.3, the flattening of the VSF on small scales is robust. Even though we avoid using additional smoothing, it is difficult to remove the smoothing due to atmospheric seeing. Since our VSFs do not show a steepening near the seeing FWHM, the smoothing effect of seeing in our analysis is likely very minor.
To study the effects of noise on our results, we conduct an experiment with the outer filaments of Abell 1795. We compute the VSF of the data selected with different SNR cut. As Figure 2 shows, the VSF on large scales remains roughly the same, but a stricter SNR cut results in a smaller amplitude on small scales, as one would expect. This also results in a slight change in the VSF slopes. We obtain slopes of 0.2, 0.2, and 0.27 for ℓ < 1 kpc, and 0.53, 0.57, and 0.67 for ℓ > 1 kpc for experiments with SNR cut at 7, 20, and 40, respectively. This experiment also shows that the flattening of the VSF on small scales is robust in Abell 1795.
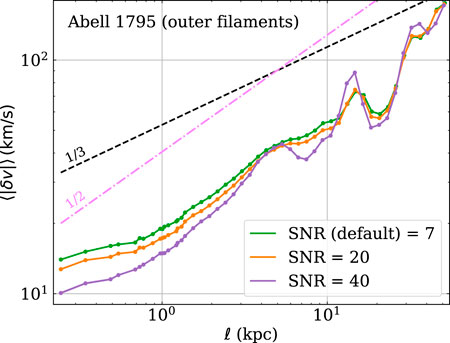
FIGURE 2. Comparison of outer filament VSF with different SNR cut applied to the unsmoothed Hα map of Abell 1795. The default (blue line) has an SNR cut of 7. The general trend of flattening of VSF at small scales is consistent for all cases, although a stricter SNR cut lowers the VSF amplitude at small scales, likely by removing more noise from the analysis. At larger scales, the VSF is not sensitive to the SNR cuts.
One of the most fundamental problems that is almost impossible to remove in our analysis is the projection effects. Along each LOS, we may be probing multiple gas clouds with different velocity components. This first projection effect (overlapping clouds along the LOS) can cause a steepening of the VSF (e.g., Xu, 2020), but is likely a rather minor effect in our study. The Hα filaments are far from volume-filling, and in the relatively rare cases where a single LOS probes multiple components, the fit is most sensitive to the brightest component. Since there is no reported correlation between the brightness of the filament and its velocity, this does not introduce noticeable bias.
We can also have clouds that are well-separated in 3D space with high velocity differences, but in the projected plane, they may appear close to each other. The second projection effect can flatten the VSF (e.g., Qian et al., 2015). As discussed in Li Y. et al. (2020), this is likely the dominant effect but is difficult to correct for without knowing the three-dimensional distribution of the filaments. We expect the true 3D VSF to be somewhat steeper than the 2D projected VSF we measure here, which does not change our main findings. We summarize the sources of potential biases and their effects in Table 2.
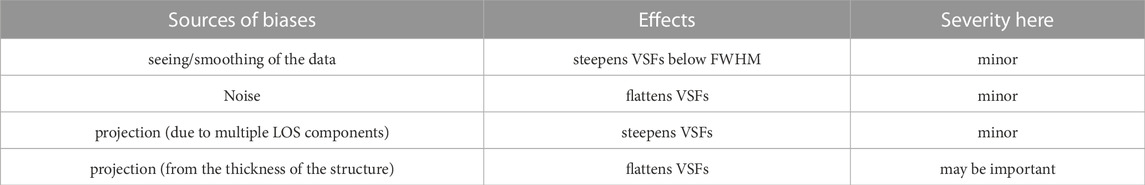
TABLE 2. Summary of observational biases and effects on the observed VSF. Note the steepening due to seeing is more severe for shallower VSFs. For steep VSFs like those in this analysis, the effect is a mild suppression of power on all scales with no obvious further steepening on small scales.
The existence of large-scale bulk motions can also contaminate our analysis. Rotation can add power to the VSF on large scales, which can effectively steepen the VSF (Li et al., 2022). In our sample, most systems do not show large-scale ordered motion except the central region of Hydra-A, which indeed shows a rather steep VSF. In group centrals and isolated elliptical galaxies, many Hα structures show a clear rotation pattern (Hamer et al., 2016; Olivares et al., 2022). We plan to systematically study the effects of bulk motion in an upcoming work on the kinematics of Hα filaments in the lower mass systems.
The sampling limit imposes uncertainties on the VSF at large scales. At large separations, the VSF is averaged over a small fraction of the entire volume. We have shaded (in grey) the range where the number of pairs drops below 20% of the peak in all our VSF plots to mark the regions with large sampling uncertainties. We avoid over interpreting data at these large scales.
4.2 Sources of turbulence in cluster centers
Many physical processes can drive turbulence in cluster centers, including AGN feedback, SNIa and structure formation. Processes related to structure formation, such as mergers, sloshing, and galaxy motions, tend to drive turbulence on scales at or larger than tens of kpc (e.g., Dolag et al., 2005; Vazza et al., 2009; ZuHone et al., 2013; Shi et al., 2018). Our results show that the kinematics of the filaments in cluster centers are mainly influenced by the activities of the SMBHs, in agreement with the findings in Li Y. et al. (2020).
The VSFs of several systems show additional energy injection close to the largest scales we can probe (tens of kpc), and the amplitude is typically around 100 km s−1. ZuHone et al. (2013) performed MHD simulations and found that sloshing motions in cool-core clusters generate turbulence with δv ∼ 50–200 km s−1 on
Numerical simulations in Li M. et al. (2020) show that SNIa can drive turbulence with velocities of
4.3 Turbulent heating
It is widely accepted that jet mode (radio mode) AGN feedback is crucial in suppressing classical cooling flows in galaxy clusters and maintaining the general quiescent state of massive galaxies in today’s Universe. However, how AGN feedback operates is far from fully understood. Exactly how the energy of the jets becomes coupled to the surrounding gas is a subject of debate.
The dissipation of SMBH-driven turbulence can potentially be an important heating mechanism. Zhuravleva et al. (2014) show that in Perseus and Virgo, radiative cooling can be perfectly balanced by the level of turbulent dissipation inferred from surface brightness fluctuation analyses. Li Y. et al. (2020) find that for Perseus, the level of turbulence traced with Hα agrees well with those inferred from surface brightness fluctuations and X-ray line-width measurements by Hitomi Collaboration (2016) near the driving scale. However, due to limited spatial resolution, X-ray observations cannot measure the power spectra or the corresponding VSFs of the hot ICM on small scales. If the cool filaments and the surrounding hot plasma remain well-coupled on small scales, then the VSF of the cool filaments reflects the VSF of the hot volume-filling plasma and can be used to infer the level of turbulent heating in these systems.
Figure 3 shows the VSFs of all the sources in our sample. The left panel includes all the systems with MUSE observations that are discussed in Section 3. We also include the three systems from Li Y. et al. (2020), shown in dashed lines. The right panel shows the corresponding VSFs of the molecular gas observed with ALMA. We also include 4 systems from Olivares et al. (2019) that have only ALMA data available. The X-ray and radio maps of these systems are shown in Figure 3 in Olivares et al. (2019). In most systems, the VSFs of the ionized gas and the molecular component show a reasonably good agreement. The ALMA VSF tends to have a higher amplitude because the detected molecular gas tends to be more centrally concentrated as ALMA is likely filtering out the diffuse, cold molecular gas. As is discussed in Section 3, the central filaments have a higher level of turbulence than the outer filaments in most systems. The biases and uncertainties in the ALMA VSF are similar to the Hα VSF. The smoothing due to the ALMA beam (of the order of 1”) is similar to the seeing effect on optical/Halpha images. We leave the detailed comparison between the kinematics of the ionized and molecular components for future work. We only use the ALMA data to supplement our analysis for systems that do not have MUSE data available.
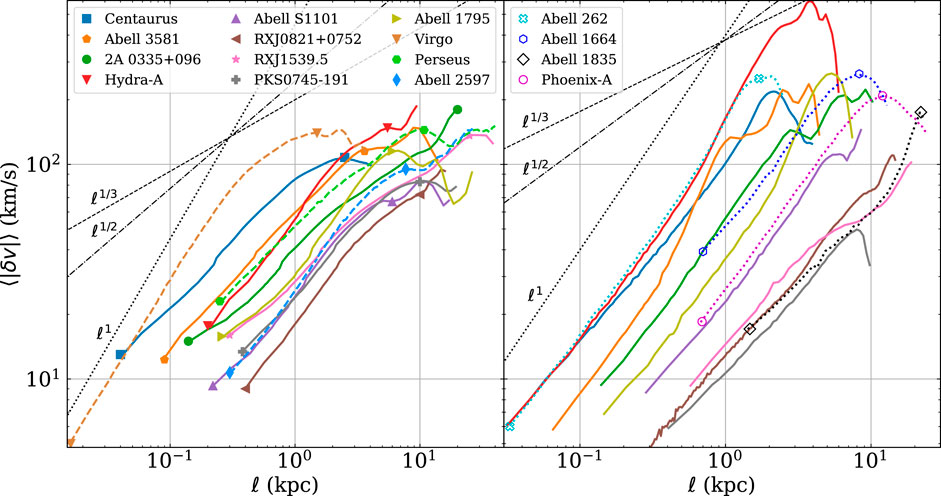
FIGURE 3. Left panel: The VSFs of the Hα filaments in the 9 systems analyzed here. Also included are the three systems from Li Y. et al. (2020) in dashed lines. There are two symbols on each curve, marking the sampling limit and the driving scale ld (see Table 1 for summary). These are the two scales where we compute turbulent heating rate (see Section 4.3 for details). Right panel: The VSFs of the molecular gas observed by ALMA. The 4 labeled systems do not have corresponding MUSE data, and we use the CO VSFs to estimate heating rates at the marked scales.
For Kolmogorov turbulence, the turbulent heating rate can be estimated as
We compute turbulent heating rate at two scales for each system, using vℓ,1D measured from the VSFs (Figure 3). The first one is computed at the driving scale. When multiple driving scales are present, we choose the smallest. This is usually close to the scale that current X-ray observations can probe. The second one is computed at the smallest scales (sampling limit). The VSFs of most systems show no signs of flattening even on the smallest scales, suggesting that we are still probing the behavior of the driver rather than the cascade, which will likely only show up on even smaller scales. Given the steep slopes of the VSFs, the true heating rates should be lower than our estimations at the current smallest scales. For these systems, we consider our computed heating rate to be an upper limit. Abell 1795 is the only system where the VSF convincingly transitions to a ∼Kolmogorov slope on small scales. This is the only system where we have likely obtained the true heating rate. Several other systems show a hint of flattening on small scales, but it needs to be confirmed by future higher resolution observations.
We compare the two heating rates and the cooling rate of the cool-cores in Figure 4. The cooling rates are computed as Qcool = neniΛ(T), where Λ(T) is the normalized cooling function. We use Λ(T) computed based on Schure et al. (2009) assuming 0.5 solar metallicity. Temperatures are measured at the same location as ne. Cool-core clusters tend to have a steep density gradient in the center. As our analysis shows, the level of turbulence also tends to be higher in the center. Thus in most systems, heating and cooling rates are both declining functions of radius. We use ne measured at the outer extend of the entire filamentary structure. This is because Hα filaments usually only cover the central region of the cool core. ne measured at the outer edge of the filaments better represents the average core density than if it is measured closer to the center of the cluster.
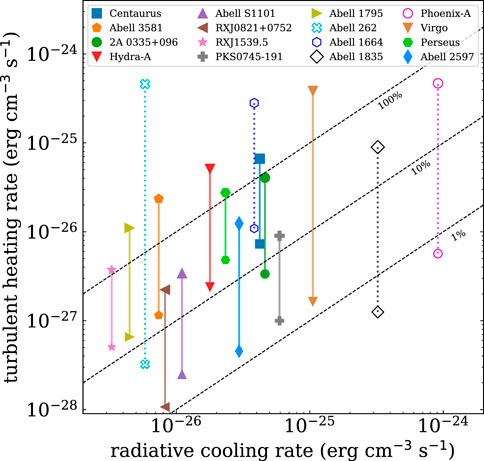
FIGURE 4. Turbulent heating rate Qturb and the corresponding radiative cooling rate Qcool for all 16 systems where the VSFs of the cool filaments have been measured. Nine of them are systems with MUSE observations discussed in Section 3. Four systems only have ALMA data available (open symbols). The last 3 are from Li Y. et al. (2020). Each system has two heating rates computed at the driving scale ld and the sampling limit, joined by a vertical dashed line (see §§4.3). The three reference lines show Qturb/Qcool =1 (black dashed), 10% (gray dashed), and 1% (light gray dashed). Turbulent heating measured at the driving scale can offset a significant fraction of the cooling loss. However, when we resolve turbulence on smaller scales, we find that the actually rate of turbulent heating is much lower due to the steep slopes of the VSFs.
Figure 4 shows that for most systems, the heating rate computed at the driving scale is on the same order of magnitude as the cooling rate, consistent with previous analyses using X-ray surface brightness fluctuations (Zhuravleva et al., 2014; Zhuravleva et al., 2018). Our computed heating and cooling rates both tend to be higher. This is because Zhuravleva et al. (2018) use volume-weighted gas density for regions typically larger than the spatial extension of the Hα filaments. Thus, our ne is likely higher than theirs. When the heating rate is computed at the smallest scales our MUSE/ALMA observations can probe, the values are typically an order of magnitude lower than those estimated at the driving scales and can only offset order of 10% of the radiative cooling loss. Note that for all systems except Abell 1795, we have likely only obtained an upper limit of the heating rate, as we are still only probing the steep VSF caused by the driver’s motion rather than the cascade.
Our results suggest that turbulent dissipation only contributes to a small fraction of the heating. This is in good agreement with what has been found in numerical simulations (e.g., Reynolds et al., 2015; Yang and Reynolds, 2016; Li et al., 2017; Bambic et al., 2018). Previous analyses based on X-ray observations have inferred a much higher level of turbulent dissipation (Zhuravleva et al., 2014; Zhuravleva et al., 2018). This is because current X-ray observations cannot measure the power spectrum on small scales. The previous estimations are effectively the heating rates computed at the driving scales in our study. There are still two possible scenarios allowing turbulent dissipation to be more important than the rates we compute at small scales. One is that some of the steepening in the VSF is due to partial dissipation of turbulence. Another possible scenario is that cool filaments are not well-coupled to the hot plasma on smaller scales. For example, some recent idealized numerical simulations have found that the VSF of the cold phase is slightly lower than that of the hot phase in a multiphase turbulent medium (Gronke et al., 2022; Mohapatra et al., 2022). Future X-ray telescopes with higher spatial resolutions can help us better understand the coupling between different phases in the ICM and measure the hot phase turbulence on smaller scales. Note that we refer to heating due to turbulent dissipation as “turbulent heating” for simplicity in this work, which does not include heating due to turbulent mixing.
5 Conclusion
In this work, we analyze the VSFs of the multiphase filaments in 9 cool-core clusters observed with MUSE and ALMA, as well as 4 observed with ALMA only from Olivares et al. (2019). For each system, we study the connection between features in the VSFs and potential drivers of ICM turbulent motion, such as SMBH activities, sloshing, and SNIa. We compute turbulent heating rates at large and small scales of the VSFs. Our findings are as follows.
(1) The VSFs suggest that the motions of the filaments are turbulent. There is a good correspondence between the inferred energy injection scales in the VSF and the sizes of SMBH-driven bubbles, suggesting that in the central tens of kpc, ICM turbulence is mainly driven by the activities of SMBHs. Several systems show possible additional energy injection from sloshing on large scales (tens of kpc), but we cannot distinguish between sloshing and older bubbles with our spatial sampling limit on these large scales.
(2) Most systems show higher level of turbulence in the center and the VSF of the outer filaments shows a lower amplitude, as one would expect. There are two exceptions. In RXJ1539.5, the VSF is almost the same for the entire filament structure. In PKS0745-191, the outer filaments show higher level of turbulence, likely due to a previous powerful AGN outburst suggested by the presence of a huge X-ray cavity. These systems likely represent a special evolutionary stage of the SMBH feedback cycle.
(3) All our systems have VSFs steeper than the classical Kolmogorov turbulence. Several systems show a flattening of the VSF on the smallest scales, especially for the outer filaments. The most noticeable case is Abell 1795, where the outer VSF convincingly flattens to a Kolmogorov slope. We interpret this as the beginning of the expected Kolmogorov cascade, while the VSFs on larger scales are mainly reflecting the motions of the drivers. This is because SMBH jets and bubbles are very intermittent drivers and cannot establish volume-filling Kolmogorov cascade from the driving scales.
(4) We compare turbulent heating and radiative cooling rates for a combined sample of 16 systems, with 13 from our study and 3 from Li Y. et al. (2020). The heating rates are computed at both large (the inferred driving scales) and small scales (the sampling limit) of the VSFs. The contribution of turbulent heating can be important when estimated using the driving scale VSFs, which is typically the scale current X-ray telescopes can probe. However, turbulent heating computed on small scales can only offset ≲ 10% of the radiative cooling loss. We find that heating due to turbulent dissipation is insignificant in cool-core cluster centers, consistent with previous numerical simulations.
Future studies should explore higher-resolution observations using MUSE Narrow Field Mode and/or ALMA, which can potentially probe the VSFs on even smaller spatial scales. Our last conclusion is based on the assumption that multiphase filaments are good kinematic tracers of the hot plasma. This has only been confirmed on large scales observationally. Future X-ray telescopes can help us understand the coupling between different phases on smaller scales. We also require more dedicated numerical studies to better understand the kinematics of the multiphase filaments in galaxy clusters.
Data availability statement
Publicly available datasets were analyzed in this study. This data can be found here: http://muse-vlt.eu/science/data-releases/.
Author contributions
SG prepared the figures and conducted the calculations. YL provided the original analysis script and led the development of the research and the writing of the manuscript. VO provided the original data used in this study, and FC, SH, and PG provided assistance. TH helped improve the uncertainty analysis. VO, YS, FC, SH, and TH helped improve the manuscript. SP helped verify the results.
Funding
YL acknowledges financial support from NSF grants AST-2107735 and AST-2219686, NASA grant 80NSSC22K0668, and Chandra X-ray Observatory grant TM3-24005X. VO and YS are supported by NSF grant 2107711, Chandra X-ray Observatory grant GO1-22126X, and NASA grant 80NSSC21K0714.
Acknowledgments
PG would like to thank the University Pierre and Marie Curie, the Institut Universitaire de France, the Centre National d’Etudes Spatiales (CNES), the Programme National de Cosmologie and galaxies (PNCG) and the Physique Chimie du Milieu Interstellaire (PCMI) programs of CNRS/INSU for their financial supports. The study is based on observations collected at the European Organisation for Astronomical Research in the Southern Hemisphere under ESO programme(s) 094. A-0859(A). This work is partly performed at the Aspen Center for Physics, which is supported by National Science Foundation grant PHY-1607611.
Conflict of interest
The authors declare that the research was conducted in the absence of any commercial or financial relationships that could be construed as a potential conflict of interest.
Publisher’s note
All claims expressed in this article are solely those of the authors and do not necessarily represent those of their affiliated organizations, or those of the publisher, the editors and the reviewers. Any product that may be evaluated in this article, or claim that may be made by its manufacturer, is not guaranteed or endorsed by the publisher.
References
Arzamasskiy, L., Kunz, M. W., Squire, J., Quataert, E., and Schekochihin, A. A. (2022). Kinetic turbulence in collisionless high-beta plasmas. arXiv e-prints, arXiv:2207.05189. https://arxiv.org/abs/2207.05189.
Bambic, C. J., Morsony, B. J., and Reynolds, C. S. (2018). ApJ 857, 84. doi:10.3847/1538-4357/aab558
Bambic, C. J., and Reynolds, C. S. (2019). Efficient production of sound waves by AGN jets in the intracluster medium. ApJ 886, 78. doi:10.3847/1538-4357/ab4daf
Boldyrev, S. (2002). Kolmogorov-Burgers model for star-forming turbulence. ApJ 569, 841–845. doi:10.1086/339403
Boldyrev, S. A. (1998). Burgers turbulence, intermittency, and nonuniversality. Phys. Plasmas 5, 1681–1687. doi:10.1063/1.872836
Canning, R. E. A., Sun, M., Sanders, J. S., Clarke, T. E., Fabian, A. C., Giacintucci, S., et al. (2013). A multiwavelength view of cooling versus AGN heating in the X-ray luminous cool-core of Abell 3581★. MNRAS 435, 1108–1125. doi:10.1093/mnras/stt1345
Cavagnolo, K. W., Donahue, M., Voit, G. M., and Sun, M. (2009). Intracluster medium Entropy profiles for a Chandra archival sample of galaxy clusters. ApJS 182, 12–32. doi:10.1088/0067-0049/182/1/12
Chen, M. C., Chen, H.-W., Rauch, M., Qu, Z., Johnson, S. D., Li, J. I., et al. (2022). Empirical constraints on the turbulence in QSO host nebulae from velocity structure function measurements. arXiv e-prints, arXiv:2209.04344. https://arxiv.org/abs/2209.04344.
Dame, T. M. (2011). Optimization of moment masking for CO spectral line surveys. arXiv e-prints, arXiv:1101.1499. https://arxiv.org/abs/1101.1499.
de Vries, M., Mantz, A. B., Allen, S. W., Morris, R. G., Zhuravleva, I., Canning, R. E. A., et al. (2023). Chandra measurements of gas homogeneity and turbulence at intermediate radii in the Perseus Cluster. MNRAS 518, 2954–2970. doi:10.1093/mnras/stac3285
Dolag, K., Vazza, F., Brunetti, G., and Tormen, G. (2005). Turbulent gas motions in galaxy cluster simulations: The role of smoothed particle hydrodynamics viscosity. MNRAS 364, 753–772. doi:10.1111/j.1365-2966.2005.09630.x
Edge, A. C. (2001). The detection of molecular gas in the central galaxies of cooling flow clusters. MNRAS 328, 762–782. doi:10.1046/j.1365-8711.2001.04802.x
Fabian, A. C. (1994). Cooling flows in clusters of galaxies. ARAA 32, 277–318. doi:10.1146/annurev.aa.32.090194.001425
Fabian, A. C. (2012). Observational evidence of active galactic nuclei feedback. ARAA 50, 455–489. doi:10.1146/annurev-astro-081811-125521
Fabian, A. C., Reynolds, C. S., Taylor, G. B., and Dunn, R. J. H. (2005a). On viscosity, conduction and sound waves in the intracluster medium. MNRAS 363, 891–896. doi:10.1111/j.1365-2966.2005.09484.x
Fabian, A. C., Sanders, J. S., Taylor, G. B., and Allen, S. W. (2005b). A deep Chandra observation of the Centaurus cluster: Bubbles, filaments and edges. MNRAS 360, L20–L24. doi:10.1111/j.1745-3933.2005.00037.x
Fabian, A. C., Walker, S. A., Russell, H. R., Pinto, C., Canning, R. E. A., Salome, P., et al. (2016). HSTimaging of the dusty filaments and nucleus swirl in NGC4696 at the centre of the Centaurus Cluster. MNRAS 461, 922–928. doi:10.1093/mnras/stw1350
Federrath, C. (2013). On the universality of supersonic turbulence. MNRAS 436, 1245–1257. doi:10.1093/mnras/stt1644
Gaspari, M., McDonald, M., Hamer, S. L., Brighenti, F., Temi, P., Gendron-Marsolais, M., et al. (2018). Shaken snow globes: Kinematic tracers of the multiphase condensation cascade in massive galaxies, groups, and clusters. ApJ 854, 167. doi:10.3847/1538-4357/aaaa1b
Gatuzz, E., Sanders, J. S., Canning, R., Dennerl, K., Fabian, A. C., Pinto, C., et al. (2022b). The velocity structure of the intracluster medium of the Centaurus cluster. MNRAS 513, 1932–1946. doi:10.1093/mnras/stac846
Gatuzz, E., Sanders, J. S., Dennerl, K., Pinto, C., Fabian, A. C., Tamura, T., et al. (2022a). Measuring sloshing, merging, and feedback velocities in the Virgo cluster. MNRAS 511, 4511–4527. doi:10.1093/mnras/stab2661
Gendron-Marsolais, M., Hlavacek-Larrondo, J., Martin, T. B., Drissen, L., McDonald, M., Fabian, A C, et al. (2018). Revealing the velocity structure of the filamentary nebula in NGC 1275 in its entirety. MNRAS 479, L28. doi:10.1093/mnrasl/sly084
Gronke, M., Oh, S. P., Ji, S., and Norman, C. (2022). Survival and mass growth of cold gas in a turbulent, multiphase medium. MNRAS 511, 859–876. doi:10.1093/mnras/stab3351
Ha, T., Li, Y., Kounkel, M., Xu, S., and Zheng, Y. (2022). Turbulence in milky way star-forming regions traced by young stars and gas. ApJ 934, 7. doi:10.3847/1538-4357/ac76bf
Hamer, S. L., Edge, A. C., Swinbank, A. M., Oonk, J. B. R., Mittal, R., McNamara, B. R., et al. (2014). Cold gas dynamics in hydra-A: Evidence for a rotating disc. MNRAS 437, 862–878. doi:10.1093/mnras/stt1949
Hamer, S. L., Edge, A. C., Swinbank, A. M., Oonk, J. B. R., Mittal, R., McNamara, B. R., et al. (2016). Optical emission line nebulae in galaxy cluster cores 1: The morphological, kinematic and spectral properties of the sample. MNRAS 460, 1758–1789. doi:10.1093/mnras/stw1054
Hitomi Collaboration (2016). The quiescent intracluster medium in the core of the Perseus cluster. Nature 535, 117–121. doi:10.1038/nature18627
Hillel, S., and Soker, N. (2016). Heating the intracluster medium by jet-inflated bubbles. MNRAS 455, 2139–2148. doi:10.1093/mnras/stv2483
Hu, H., Qiu, Y., Gendron-Marsolais, M.-L., Bogdanovic, T., Hlavacek-Larrondo, J., Ho, L. C., et al. (2022). Signature of supersonic turbulence in galaxy clusters revealed by AGN-driven hα filaments. arXiv e-prints, arXiv:2203.04977. https://arxiv.org/abs/2203.04977.
Johnstone, R. M., Fabian, A. C., Morris, R. G., and Taylor, G. B. (2005). The galaxy cluster Abell 3581 as seen by Chandra. MNRAS 356, 237–246. doi:10.1111/j.1365-2966.2004.08445.x
Kitayama, T., Ueda, S., Akahori, T., Komatsu, E., Kawabe, R., Kohno, R., et al. (2020). Deeply cooled core of the Phoenix galaxy cluster imaged by ALMA with the Sunyaev–Zel’dovich effect. Publ. Astron. Soc. Jpn. 72, 33. doi:10.1093/pasj/psaa009
Kokotanekov, G., Wise, M. W., de Vries, M., and Intema, H. T. (2018). Signatures of multiple episodes of AGN activity in the core of Abell 1795. A&A 618, A152. doi:10.1051/0004-6361/201833222
Kritsuk, A. G., Norman, M. L., Padoan, P., and Wagner, R. (2007). The statistics of supersonic isothermal turbulence. ApJ 665, 416–431. doi:10.1086/519443
Li, M., Li, Y., Bryan, G. L., Ostriker, E. C., and Quataert, E. (2020a). The impact of Type Ia Supernovae in quiescent galaxies. II. Energetics and turbulence. ApJ 898, 23. doi:10.3847/1538-4357/ab9c22
Li, Y., Gendron-Marsolais, M.-L., Zhuravleva, I., Xu, S., Simionescu, A., Tremblay, G. R., et al. (2020b). Direct detection of black hole-driven turbulence in the centers of galaxy clusters. ApJL 889, L1. doi:10.3847/2041-8213/ab65c7
Li, Y., Ruszkowski, M., and Bryan, G. L. (2017). AGN heating in simulated cool-core clusters. ApJ 847, 106. doi:10.3847/1538-4357/aa88c1
Markevitch, M., Vikhlinin, A., and Mazzotta, P. (2001). Nonhydrostatic gas in the core of the relaxed galaxy cluster A1795. ApJL 562, L153–L156. doi:10.1086/337973
Mazzotta, P., Edge, A. C., and Markevitch, M. (2003). AChandraStudy of the complex structure in the core of 2A 0335+096. ApJ 596, 190–203. doi:10.1086/377633
McDonald, M., McNamara, B. R., Voit, G. M., Bayliss, M., Benson, B. A., Brodwin, M., et al. (2019). Anatomy of a cooling flow: The feedback response to pure cooling in the core of the Phoenix cluster. ApJ 885, 63. doi:10.3847/1538-4357/ab464c
McDonald, M., and Veilleux, S. (2009). MMTF-Hα and HST -FUV imaging of the filamentary complex in Abell 1795. ApJL 703, L172–L177. doi:10.1088/0004-637X/703/2/L172
McDonald, M., Veilleux, S., Rupke, D. S. N., and Mushotzky, R. (2010). On he origin of the extended hα filaments in cooling flow clusters. ApJ 721, 1262–1283. doi:10.1088/0004-637X/721/2/1262
McNamara, B. R., and Nulsen, P. E. (2007). Heating hot atmospheres with active galactic nuclei. ARAA 45, 117–175. doi:10.1146/annurev.astro.45.051806.110625
McNamara, B. R., Russell, H. R., Nulsen, P. E. J., Hogan, M. T., Fabian, A. C., Pulido, F., et al. (2016). ApJ 830, 79. doi:10.3847/0004-637X/830/2/79
Mohapatra, R., Jetti, M., Sharma, P., and Federrath, C. (2022). Velocity structure functions in multiphase turbulence: Interpreting kinematics of hα filaments in cool-core clusters. MNRAS 510, 2327–2343. doi:10.1093/mnras/stab3429
Mohapatra, R., and Sharma, P. (2019). Turbulence in the intracluster medium: Simulations, observables, and thermodynamics. MNRAS 484, 4881–4896. doi:10.1093/mnras/stz328
Nulsen, P. E. J., McNamara, B. R., Wise, M. W., and David, L. P. (2005). The cluster-scale AGN outburst in Hydra A. Astrophys. J. 628, 629–636. doi:10.1086/430845
Olivares, V., Salome, P., Combes, F., Hamer, S., Guillard, P., Lehnert, M. D., et al. (2019). Ubiquitous cold and massive filaments in cool core clusters. A&A 631, A22. doi:10.1051/0004-6361/201935350
Olivares, V., Salomé, P., Hamer, S. L., Combes, F., Gaspari, M., Kolokythas, K., et al. (2022). Gas condensation in brightest group galaxies unveiled with MUSE. A&A 666, A94. doi:10.1051/0004-6361/202142475
Oonk, J. B. R., Jaffe, W., Bremer, M. N., and van Weeren, R. J. (2010). The distribution and condition of the warm molecular gas in Abell 2597 and Sersic 159-03. MNRAS 405, 898. doi:10.1111/j.1365-2966.2010.16535.x
Padoan, P., Pan, L., Haugbølle, T., and Nordlund, Å. (2016). Supernova driving. I. the origin of molecular cloud turbulence. ApJ 822, 11. doi:10.3847/0004-637X/822/1/11
Prasad, D., Sharma, P., and Babul, A. (2018). Cool-core clusters: The role of BCG, star formation, and AGN-driven turbulence. ApJ 863, 62. doi:10.3847/1538-4357/aacce8
Qian, L., Li, D., Offner, S., and Pan, Z. (2015). A new method for constraining molecular cloud thickness: A study of taurus, Perseus, and ophiuchus. ApJ 811, 71. doi:10.1088/0004-637X/811/1/71
Rafferty, D. A., McNamara, B. R., Nulsen, P. E. J., and Wise, M. W. (2006). The feedback-regulated growth of black holes and bulges through gas accretion and starbursts in cluster central dominant galaxies. Astrophysical J. 652, 216–231. doi:10.1086/507672
Reynolds, C. S., Balbus, S. A., and Schekochihin, A. A. (2015). Inefficient driving of bulk turbulence by active galactic nuclei in a hydrodynamic model of the intracluster medium. ApJ 815, 41. doi:10.1088/0004-637X/815/1/41
Russell, H. R., McNamara, B. R., Fabian, A. C., Nulsen, P. E. J., Edge, A. C., Combes, F., et al. (2016). ALMA observations of cold molecular gas filaments trailing rising radio bubbles in PKS 0745−191. MNRAS 458, 3134–3149. doi:10.1093/mnras/stw409
Russell, H. R., McNamara, B. R., Fabian, A. C., Nulsen, P. E. J., Edge, A. C., Combes, F., et al. (2019). Driving massive molecular gas flows in central cluster galaxies with AGN feedback. MNRAS 490, 3025–3045. doi:10.1093/mnras/stz2719
Salomé, P., and Combes, F. (2003). Cold molecular gas in cooling flow clusters of galaxies. A&A 412, 657–667. doi:10.1051/0004-6361:20031438
Sanders, J. S., Dennerl, K., Russell, H. R., Eckert, D., Pinto, C., Fabian, A. C., et al. (2020). Measuring bulk flows of the intracluster medium in the Perseus and Coma galaxy clusters using XMM-Newton. A&A 633, A42. doi:10.1051/0004-6361/201936468
Sanders, J. S., Fabian, A. C., Hlavacek-Larrondo, J., Russell, H. R., Taylor, G. B., Hofmann, F., et al. (2014). Feedback, scatter and structure in the core of the PKS 0745−191 galaxy cluster. MNRAS 444, 1497–1517. doi:10.1093/mnras/stu1543
Sanders, J. S., Fabian, A. C., and Smith, R. K. (2011). Constraints on turbulent velocity broadening for a sample of clusters, groups and elliptical galaxies using XMM–Newton. MNRAS 410, 1797. doi:10.1111/j.1365-2966.2010.17561.x
Sanders, J. S., and Fabian, A. C. (2002). Spatially resolved X-ray spectroscopy of the core of the Centaurus cluster. MNRAS 331, 273–283. doi:10.1046/j.1365-8711.2002.05211.x
Sanders, J. S., Fabian, A. C., and Taylor, G. B. (2009). Feedback through multiple outbursts in the cluster 2A 0335+096. MNRAS 396, 1449–1459. doi:10.1111/j.1365-2966.2009.14892.x
Sanders, J. S., Fabian, A. C., Taylor, G. B., Russell, H. R., Blundell, K. M., Canning, R. E. A., et al. (2016). A very deepChandraview of metals, sloshing and feedback in the Centaurus cluster of galaxies. MNRAS 457, 82–109. doi:10.1093/mnras/stv2972
Schure, K. M., Kosenko, D., Kaastra, J. S., Keppens, R., and Vink, J. (2009). A new radiative cooling curve based on an up-to-date plasma emission code. A&A 508, 751–757. doi:10.1051/0004-6361/200912495
Shi, X., Nagai, D., and Lau, E. T. (2018). Multiscale analysis of turbulence evolution in the density-stratified intracluster medium. MNRAS 481, 1075–1082. doi:10.1093/mnras/sty2340
Taylor, G. B., Fabian, A. C., and Allen, S. W. (2002). Magnetic fields in the Centaurus cluster. MNRAS 334, 769–776. doi:10.1046/j.1365-8711.2002.05555.x
Taylor, G. B., Perley, R. A., Inoue, M., Kato, T., Tabara, H., and Aizu, K. (1990). VLA observations of the radio galaxy Hydra A (3C 218). ApJ 360, 41. doi:10.1086/169094
Tremblay, G. R., Combes, F., Oonk, J. B. R., Russell, H. R., McDonald, M. A., Gaspari, M., et al. (2018). A galaxy-scale fountain of cold molecular gas pumped by a black hole. ApJ 865, 13. doi:10.3847/1538-4357/aad6dd
Tremonti, C. A., Heckman, T. M., Kauffmann, G., Brinchmann, J., Charlot, S., White, S. D. M., et al. (2004). The origin of the mass-metallicity relation: Insights from 53,000 star-forming galaxies in the sloan digital sky survey. ApJ 613, 898–913. doi:10.1086/423264
Vantyghem, A. N., McNamara, B. R., Russell, H. R., Edge, A. C., Nulsen, P. E. J., Combes, F., et al. (2019). An enormous molecular gas flow in the RX J0821+0752 galaxy cluster. Astrophysical J. 870, 57. doi:10.3847/1538-4357/aaf1b4
Vazza, F., Brunetti, G., Kritsuk, A., Wagner, R., Gheller, C., and Norman, M. (2009). Turbulent motions and shocks waves in galaxy clusters simulated with adaptive mesh refinement. A&A 504, 33–43. doi:10.1051/0004-6361/200912535
Voit, G. M. (2018). A role for turbulence in circumgalactic precipitation. ApJ 868, 102. doi:10.3847/1538-4357/aae8e2
Walker, S. A., Fabian, A. C., and Kosec, P. (2014). Exploring the origin of a large cavity in Abell 1795 using deep Chandra observations. Mon. Notices R. Astronomical Soc. 445, 3444–3452. doi:10.1093/mnras/stu1996
Wang, C., Ruszkowski, M., Pfrommer, C., Oh, S. P., and Yang, H. Y. K. (2021). Non-Kolmogorov turbulence in multiphase intracluster medium driven by cold gas precipitation and AGN jets. MNRAS 504, 898–909. doi:10.1093/mnras/stab966
Weinberger, R., Ehlert, K., Pfrommer, C., Pakmor, R., and Springel, V. (2017). Simulating the interaction of jets with the intracluster medium. MNRAS 470, 4530–4546. doi:10.1093/mnras/stx1409
Werner, N., de Plaa, J., Kaastra, J. S., Vink, J., Bleeker, J. A. M., Tamura, T., et al. (2006). XMM-Newton spectroscopy of the cluster of galaxies 2A 0335+096. A&A 449, 475–491. doi:10.1051/0004-6361:20053868
Werner, N., Oonk, J. B. R., Sun, M., Nulsen, P. E. J., Allen, S. W., Canning, R. E. A., et al. (2014). The origin of cold gas in giant elliptical galaxies and its role in fuelling radio-mode AGN feedback. MNRAS 439, 2291–2306. doi:10.1093/mnras/stu006
Werner, N., Sun, M., Bagchi, J., Allen, S. W., Taylor, G. B., Sirothia, S. K., et al. (2011). Violent interaction between the active galactic nucleus and the hot gas in the core of the galaxy cluster Sérsic 159−03. Mon. Notices R. Astronomical Soc. 415, 3369–3379. doi:10.1111/j.1365-2966.2011.18957.x
Wise, M. W., McNamara, B. R., Nulsen, P. E. J., Houck, J. C., and David, L. P. (2007). X-ray supercavities in the Hydra A cluster and the outburst history of the central galaxy’s active nucleus. Astrophysical J. 659, 1153–1158. doi:10.1086/512767
Xu, S. (2020). Projected velocity statistics of interstellar turbulence. MNRAS 492, 1044–1048. doi:10.1093/mnras/stz3092
Yang, H. Y. K., and Reynolds, C. S. (2016). How agn jets heat the intracluster medium—insights from hydrodynamic simulations. ApJ 829, 90. doi:10.3847/0004-637X/829/2/90
Zhang, C., Zhuravleva, I., Gendron-Marsolais, M.-L., Churazov, E., Schekochihin, A. A., and Forman, W. R. (2022). Bubble-driven gas uplift in galaxy clusters and its velocity features. arXiv e-prints, arXiv:2203.04259. https://arxiv.org/abs/2203.04259.
Zhuravleva, I., Allen, S. W., Mantz, A., and Werner, N. (2018). Gas perturbations in the cool cores of galaxy clusters: Effective equation of state, velocity power spectra, and turbulent heating. ApJ 865, 53. doi:10.3847/1538-4357/aadae3
Zhuravleva, I., Churazov, E., Schekochihin, A. A., Allen, S. W., Vikhlinin, A., Werner, N., et al. (2014). Turbulent heating in galaxy clusters brightest in X-rays. Nature 515, 85–87. doi:10.1038/nature13830
Zhuravleva, I., Churazov, E., Schekochihin, A. A., Allen, S. W., Vikhlinin, A., and Werner, N. (2019). Suppressed effective viscosity in the bulk intergalactic plasma. Nat. Astron. 3, 832–837. doi:10.1038/s41550-019-0794-z
Keywords: galaxy clusters, turbulence, intracluster medium, galaxy physics, active galactic nuclei, X-ray cavities
Citation: Ganguly S, Li Y, Olivares V, Su Y, Combes F, Prakash S, Hamer S, Guillard P and Ha T (2023) The nature of the motions of multiphase filaments in the centers of galaxy clusters. Front. Astron. Space Sci. 10:1138613. doi: 10.3389/fspas.2023.1138613
Received: 05 January 2023; Accepted: 23 March 2023;
Published: 03 May 2023.
Edited by:
Prateek Sharma, Indian Institute of Science (IISc), IndiaReviewed by:
Ryan Farber, Max Planck Institute for Astrophysics, GermanyRajsekhar Mohapatra, Princeton University, United States
Copyright © 2023 Ganguly, Li, Olivares, Su, Combes, Prakash, Hamer, Guillard and Ha. This is an open-access article distributed under the terms of the Creative Commons Attribution License (CC BY). The use, distribution or reproduction in other forums is permitted, provided the original author(s) and the copyright owner(s) are credited and that the original publication in this journal is cited, in accordance with accepted academic practice. No use, distribution or reproduction is permitted which does not comply with these terms.
*Correspondence: Yuan Li, eXVhbi5saUB1bnQuZWR1