 Jana Fahrion
 Claude Gilles Dussap
 Natalie Leys
- 1Microbiology Unit, Belgian Nuclear Research Center SCK CEN, Mol, Belgium
- 2Université Clermont Auvergne, CNRS, Clermont Auvergne INP, Institut Pascal, Clermont-Ferrand France, France
One important point in human space exploration is the reliable air, water and food production for the space crew, less dependent from cargo supply. Bioregenerative life support systems aim to overcome this challenge. The life support program MELiSSA of the European Space Agency uses the cyanobacterium Limnospira indica for air revitalization and food production. In the Space flight experiments ArtEMISS-B and -C, L. indica is tested on the International Space Station. In this study we elucidate which conditions are most favorable for cell propagation from inoculum to a full culture in space to enable a high final biomass concentration, with high pigment composition for an efficient bioprocess. We found that lower light intensities (36–75 µmol photons m-2 s-1) show higher maximum biomass densities and higher pigment contents than cultures grown above 100 µmol photons m-2 s-1. 36 μmol photons m-2 s-1 resulted in maximum biomass concentrations of 3.36 ± 0.15 g L-1 (23 °C), while cultures grown at 140 µmol photons m-2 s-1 only achieved concentrations of 0.82 ± 0.10 g L-1 (25°C) (−75.8%). Colder temperatures (21°C–25°C) showed a negative effect on the pigment content. At 36 µmol photons m-2 s-1, a temperature of 30°C gave a phycocyanin concentration of 0.122 ± 0.014 g g DW-1 and 23°C resulted in 0.030 ± 0.003 g g DW-1 (−75.4%). In conclusion, a low light intensity (36–80 µmol photons m-2 s-1) in combination with warm temperature (30°C–34°C) is optimal to obtain cultures with high pigment contents and high biomass concentrations in a batch culture.
1 Introduction
Edible cyanobacteria are promising organisms for life support systems in space. The MELiSSA loop, a life support system initiated by the European Space Agency (ESA) in 1988 (Lasseur et al., 2010) aims to recycle the wastes of space travelers (e.g., feces, urine and CO2) to produce new edible biomass, potable water and oxygen (O2) for space craft crews. The IVa compartment of MELiSSA aims at biological air revitalization and food production via a photobioreactor (PBR) containing photosynthetic, blue-green pigmented cyanobacterium L. indica PCC8005 (Poughon et al., 2020). Limnospira indica PCC8005 was formerly classified as part of the Arthrospira genus (Nowicka-Krawczyk et al., 2019). In a commercial context, L. indica is one of the strains sold under the name spirulina. Spirulina as a product has already been consumed by humans in equatorial Africa and Mexico for a long time (Ciferri, 1983; Barnett et al., 2005). Nowadays, the food industry sells spirulina as a supplement and so-called superfood because of its high protein and antioxidant content (Prasanna et al., 2010; Ma et al., 2019). The edible cyanobacterium Limnospira indica, likewise other species that are sold under the term Spirulina, contains protein of high quality, minerals, vitamins as well as pigments (Farag et al., 2015; Furmaniak et al., 2017). Benefits of the use of L. indica as a food source for space travelers include its high radiation resistance (up to 6,400 Gy, gamma-rays) (Badri et al., 2015; Yadav et al., 2019; Yadav et al., 2021) and its high content of bioactive compounds with health beneficial effects (e.g., anti-inflammatory effects) (Wu et al., 2016; Segers et al., 2022). An overview of the benefits of Spirulina for Space applications has recently been published (Fais et al., 2022a).
Before bioreactors for life support systems can be made operational in space, it is of utmost importance to understand the bioprocesses thoroughly, allowing predictive modelling and reliable processes and reactor control. Especially in the future, when the MEliSSA loop is used to supply the crew of a space craft, parameters to detect changes in culture health must be available to avert failure of the system. In the ArtEMISS B and -C precursor Space flight experiments, L. indica is cultivated in 4 parallel photobioreactors designed for microgravity conditions and controlled by light-limiting conditions, meaning that the light intensity is the parameter by which the production of oxygen and biomass is controlled. The start-up of the bioreactor in space includes a revival of the dormant inoculum (in dark and cold) and propagation in batch mode, in axenic conditions and under continuous illumination. The oxygen and biomass productivity in PBRs is strongly dependent on the geometry of the culturing flask, the light intensity and the efficient oxygen removal (Cornet and Dussap, 2009). Therefore, depending on the experimental set-up, varying biomass and oxygen productivities are reported in literature. For example, Farges et al. (2009) reported a biomass productivity of 0.077 g L-1 d-1 for 33 µmol photons m-2 s-1 in an 1.2 L bench scale membrane bioreactor; while Garcia-Gragera et al. (2021) obtained already a maximum biomass productivity of 0.58 g L-1 d-1 for 932 µmol photons m-2 s-1 and a maximum oxygen productivity of 1.19 mmol L-1 h-1 in the larger intensified 90 L cylindrical airlift bioreactor at the MELiSSA pilot plant in Barcelona. In the ArtEMISS project, mini-sized PBRs which are adapted to spaceflight conditions are used. These PBRs are flat cylindrical reactors, equipped with 1 side illumination by LEDs, and work with a small liquid volume (60 mL) and relatively low light flux (45–80 µmol photons m-2 s-1, 33 °C). Low light intensities are used to accommodate for more difficult gas liquid separation under microgravity in space and to prevent oxygen bubble formation in the liquid. Gas release from liquid is challenging under microgravity, as the buoyancy force is absent and it is fully depending on diffusion and technically forced convection over the membrane (Antar et al., 2006). Additionally, low light intensities promote slower growth and allow longer exposure to Space (e.g., cosmic radiation, microgravity) while demanding low amounts of feed resources. The CO2 feed as growth limiting factor is excluded in this ArtC pilot experiment as it is not extracted from the cabin air, but provided in abundance as dissolved bicarbonate in the liquid medium feed. The challenges of CO2 gas to liquid transfer from cabin air in microgravity in space, will be address in a next ISS flight experiment of the MELiSSA team, called BIORAT, using a different flight hardware design including a gas exchange module and also a biomass harvesting module (Lasseur, 2008).
In the ArtEMISS B space flight experiment (ArtB) on the ISS in 2017, 4 consecutive repeated-batch cultures (90% harvest) were grown inside the PBRs at 35 µmol photons m-2 s-1 for 4 weeks. This experiment was the first one to allow online recording and transmission of the oxygen and biomass production rate on board the International Space station (ISS). It could be shown that the developed predictive model for bioprocess and bioreactor control via light limitation was still applicable for cultures in Space (Poughon et al., 2020). A follow-up experiment operating the bioreactor with continuous feeding and different light intensities between 45 and 80 µmol photons m-2 s-1 to grow L. indica PCC8005 in turbidostatic modus is scheduled to fly to the ISS in 2023 (ArtC) (Lasseur and Mergeay, 2021). Therefore, in ArtC the scalability of the bioprocess in response to increasing light intensities will be assessed.
Not only the biomass and oxygen production are of high importance for the use of L. indica in life support systems, but also the biomass composition and the resulting nutritive value. Cyanobacteria have large protein pigment complexes, called phycobilisomes, that function as photon harvesting antenna on their membranes. To secure a stable nutritive value (e.g., protein, glycogen and pigment content), growth conditions like medium composition, light intensity, temperature and culture density need to be defined and monitored carefully.
It is known that temperature and light conditions have an impact on revival and oxygen and biomass production kinetics and biomass composition (Moore et al., 1995; Ravelonandro et al., 2008; Garcia-Gragera et al., 2021). Our study focusses on conditions relevant for PBR systems for space applications like moderate temperatures between 21°C and 34°C and low light intensities (i.e. 36, 45, 75 and 140 µmol photons m-2 s-1) which cause a light limiting growth and are usually used to secure stable and slow growth in space environments. Additionally, to a detailed growth analysis, we assessed the pigment and glycogen contents to get an overview of the nutritive value. The detailed understanding of the adaptions of the cultures and their mechanisms is important to secure a reliable photobioreactor and to find solutions for heating or light problems that might come up in future life support systems. Therefore, the goal of this study was to provide ground reference values for several important parameters of specifically selected strain P3 of L. indica PCC8005 to use as comparison in future MELiSSA experiments such as ArtEMISS C. We present data on the impact of different factors such as light flux intensity, in combination with low and high temperature, on the growth, photosynthetic activity and molecular composition of L. indica PCC8005 for application in space. The combination of low light and warm temperature are not common conditions used in Earth cultures or bioreactors but aimed for in space, and an in-depth growth analysis of this space relevant strain is essential to assess the validity of the currently available general data for this specific strain.
2 Materials and methods
2.1 Bacterial strain and culture conditions
In our laboratory collection we obtained multiple morphotypes of L. indica strain PCC8005 over the years of continuous cultivation in an incubator in continuous shaking and stable illumination (∼35 µmol photons m-2 s-1, 24/7) and temperature (∼30°C). The morphotypes differ in, for example, morphology, floating/sedimentation behavior, growth rate, and radiation resistance (Yadav et al., 2019). The culture that was used in the present study is called P3, and forms long (∼700 µm on average, up to 1.5 mm), thin (∼6 µm) and straight trichomes (Figure 1). This strain was chosen as a good candidate for the use in Space PBRs because its straight shape makes it well-adapted to low light and in addition, it does not easily clump or form biofilms on the gas PTFE membrane under the selected test conditions, and it is easy to keep in a well homogenized suspension by shaking or stirring, and easy to harvest by filtration or centrifugation as it does not float but sediments.
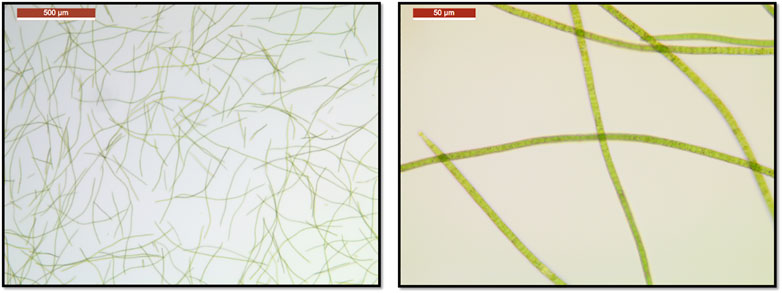
FIGURE 1. Light Microscopy pictures of Limnospira indica PCC8005 P3 at two different magnifications (left: ×50, right: 400X) showing long (in average ∼700 μm; up to 1.5 mm) and straight trichomes.
The cyanobacterium Limnospira indica strain PCC8005 subculture P3 was grown in Zarrouk’s medium as modified by Cogne et al. (2003) (pH = 9,5). Depending on the experiment, different temperatures (23°C ± 2°C, 25°C ± 2°C, 30°C ± 2°C, 32 ± 2 and 34°C ± 2°C) (Binder incubators) and several light flux intensities (36 ± 2, 45 ± 2, 75 ± 5 and 140 ± 10 µmol photons m-2 s-1) were used. The cultures were constantly (24h/day) illuminated with full PAR emitting light sources (LEDs and halogen lamps) in all experiments. The constant illumination, in contrast to the usage of a day/night cycle, was used because it allows continuous oxygen production, which is the final aim in the ArtC Space flight experiment and the final MELiSSA system tailored to the astronaut as oxygen consumers. The chosen cyanobacterial strain is also fully efficient in photosynthetic biomass production in continuous light, and does not need any darkness to do so. All cultures were grown in regular Erlenmeyer flasks (250 and 150 mL) equipped with a cotton plug and aluminum foil to avoid evaporation while allowing gas exchange by diffusion. In each experiment, 250 mL Erlenmeyer flasks filled with 150 mL medium (gas/liquid ratio of 0.66) or 150 mL Erlenmeyer flasks filled with 65 mL medium (gas/liquid ratio of 1.30) were used. The medium contains dissolved bicarbonate as carbon source, as will be the case in the ArtC flight experiment. In both cases, the cultures were inoculated with 5% v/v or 10% v/v (depending on the OD770nm of the parent culture) and 95% v/v and 90% v/v Zarrouk medium as modified by Cogne et al. (2003), respectively, to target a starting concentration of ca. OD770nm–0.100. The gas phase consists of ambient air. All cultures were shaken at 120 rpm using horizontal orbital Heidolph and Edmund Bühler GmbH shakers. Samples for molecular analysis (pigment and glycogen) were taken at different time points. At each time point, 2 mL of well mixed culture were transferred to a 2 mL Eppendorf tube and centrifuged at 10,000 g for 15 min (Eppendorf Centrifuge 5804 R) at room temperature (21°C ± 1°C). Afterwards, the cell-free supernatant was discarded and the tubes were centrifuged at 10,000 g for 5 min. The remaining supernatant was discarded and the pellets were flash-frozen in liquid nitrogen and stored at −80°C (PHCbi TwinGuard freezers) until further analysis.
2.2 Overview of the tested culture conditions
In order to find and describe the adaptions in behavior of L. indica PCC8005 P3 to different growth conditions, several experiments were conducted. In ArtEMiSS C the following growth conditions will be used: L. indica strain PCC8005 subculture P3 at 45–55-70–80 µmol photons m-2 s-1, 33°C ± 1°C, homogenous culture (800–1,000 rpm with magnetic stirrer in the bioreactor hardware), in Zarrouk’s medium (as modified by Cogne et al. (2003)). The conditions used in the present study imitate the nominal ArtEMISS B and C conditions and add some off-nominal conditions, like lower temperatures (23, 25, 30°C) and higher light intensity [140 µmol photons m-2 s-1 (µmol photons = µE)] as additional controls. All test were performed with normal Earth gravity, without irradiation, and ambient air as headspace, in the shaken Erlenmeyer set-up describe in Section 2.1.
2.3 Optical density and pH measurements
The cell concentration in the culture was monitored as optical density (OD), via absorbance spectrometry at different wavelengths. The values for optical density (OD) were obtained using a NANOCOLOR® UV/VIS II spectrophotometer (MACHEREY-NAGEL). The OD was measured by absorbance at 468 nm, 630 nm, 750 nm and 770 nm in 1 mL semi-micro cuvettes (greiner BIO-ONE). These wavelengths were adapted from the ArtEMISS B space flight conditions. The 468 nm wavelength is used to estimate the chlorophyll a content because chlorophyll pigments have an absorption peak at this wavelength (Guidi et al., 2017). The same accounts for phycocyanin/allophycocyanin at the wavelength 630 nm (Zhang and Chen, 1999). The two remaining wavelengths 750 nm and 770 nm are used to measure the amount of cells in the culture (Akimoto et al., 2012). In this study, the OD measurements at 468, 630, and 750 nm were measured daily as a quality control of the cultures (data not shown). The OD measurements at 770 nm were used to assess the biomass production (see section 2.4).
A KCl pH electrode (InLab®, Mettler Toledo) was used to determine the pH values of the culture medium. As we are working in high pH conditions, we verified the working range of the pH electrode by preparing several NaOH solutions of strictly defined pH values and were able to show that the electrode measures correctly up to a pH of 13.
2.4 Biomass concentration analysis
In order to estimate the biomass concentration in the cultures, the dry weight (g DW L-1) to OD 770 nm ratio was determined by putting 2 mL of cultures grown under different conditions (25°C–30°C, 36–75 µmol photons m-2 s-1) on pre-weighed membrane disc filters (water wettable PTFE, Pall Laboratory, pore size 45 μm, ⌀ 25 mm) using a vacuum pump. The filters were dried for a minimum of 48 h at 60°C and weighed again. The cultures were sampled and measured in triplicates (technical replicates). In total, 4 cultures were used per tested condition (biological replicates), therefore 12 samples were used to obtain one point in the dry weight curves that were used to determine the correlation factor between OD770nm values and DW biomass values. The OD770nm to dry weight ratio which was obtained during the experiments discussed in this study was found to be stable over different conditions:
Eq. 1 shows the OD770nm to dry weight ratio, where x is the OD770nm absorbance and y is the dry weight in g L-1. This ratio was used to calculate the biomass concentration (X, g L-1), the specific growth rate (µmax, d-1) and the average biomass productivity (Pav, g L-1 d-1). Exponential, linear and stationary phase were defined by regression using Excel 2016. The maximum growth rate µmax was obtained by using a logarithmic conversion and linear regression of the exponential phase (approximately the first 3–4 days of growth). The average biomass productivity Pav represents the slope of the linear regression of the linear growth phase, starting at the endpoint of the exponential phase and ending at the point of highest biomass concentration. Additionally, the time until the stationary phase is reached (Tstat, d) was determined using the peaks of the growth curves (accuracy ±0.5 days).
2.5 Quantum yield measurements
The photosynthetic capacity and efficiency of the cultures was determined by measuring the effective quantum yield (QY) of PSII. The QY of PSII is determined by pulse amplitude modulated (PAM) fluorimetry (Schreiber et al., 1995; Aguirre-von-Wobeser et al., 2000; Schuurmans et al., 2015). The QY (ΔF/Fm’) is defined as shown in Equation (2).
2.5.1 Pigment analysis
The phycobilisomes of L. indica contain the light harvesting pigments phycocyanin and allophycocyanin (Johnson et al., 1988) which transfer the energy further to the photosystems II and I (PSII and PSI) reaction centers. The PSII and PSI contain the pigment chlorophyll a (Chl a), which acts as the primary electron donor in the electron transport chain (Rakhimberdieva et al., 2001; Raven et al., 2005). Other chlorophyll pigments, such as chlorophyll b, c or d, are not abundant in L. indica (Averina et al., 2019; Milia et al., 2022). The protocol for pigment analysis used was slightly adapted from Badri et al. (2015) and allows to measure the concentrations of allophycocyanin, phycocyanin and chlorophyll with a spectrophotometer. Briefly, the frozen cell pellets of 2 ml of culture were suspended in 1 mL of 0.05 M Na2HPO4 at pH 7. Then, 5 cycles of freezing in liquid N2 and thawing at 37 °C in a water bath were performed to crack the cells. Then, 100 µL lysozyme (100 mg/ml) were added and the tubes were incubated for 30 min at 37°C. The tubes were centrifuged at 13,000 g for 10 min and the supernatant was measured with a NANOCOLOR® UV/VIS II spectrophotometer for absorbance at 615 nm and 652 nm, to determine the concentrations of antenna pigments in the extract. The extraction of chlorophyll was performed on the remaining pellet of the phycobilliprotein extraction. Firstly, the pellets were washed three times using 0.05 M Na2HPO4 at pH 7. Then, 1 mL of 100% methanol was used to extract the organic soluble pigment chlorophyll. Three cycles of ultra-sonication (30 kHz, 10 s, amplitude 30%, 1 pulse per second, Hielscher Ultrasound Technology, UP50H) were performed to fully extract and dissolve the chlorophyll pigments. Centrifugation at 4°C for 10 min at 13,000 g was performed, and the supernatant was measured at 665 nm using a NANOCOLOR® UV/VIS II spectrophotometer (MACHEREY-NAGEL) and semi-micro cuvettes (Greiner BIO-ONE) to determine the chlorophyll concentration in the extract. To calculate the pigment concentration in the original culture, i.e., pigment weight (mg) per mL, conversion Eqs. 3–5 as published in Bennett and Lawrence (1973) were used:
The results obtained from these equations were normalized using the biomass concentrations [g L-1] to obtain pigment concentrations in g g DW-1. Typically, phycocyanin and allophycocyanin constitute 15%–20% of the dry weight in Arthrospira when cultured in photobioreactors (Chaiklahan et al., 2012; Lee et al., 2016; Chaiklahan et al., 2022).
2.6 Glycogen analysis
The glycogen extraction protocol was adapted from Phélippé et al. (2019). In short, the thawed pellet of 2 ml of culture was suspended in 1 mL 100% methanol and incubated at 45°C for 45 min in a heating block (550 rpm). The suspension was then centrifuged at room temperature for 10 min at 12,000 g and the supernatant was discarded. The pellet containing the glycogen was resuspended in 200 µl of 30% KOH solution. Now the suspension was incubated at 90°C in a heating block for 30 min (550 rpm). The suspension was cooled down to room temperature and 600 µl pre-chilled (4°C) 100% ethanol was added to precipitate the glycogen. The samples were stored at −20°C for 1 h. Afterwards, the samples were centrifuged at room temperature for 5 min at 12,000 g and the supernatant was discarded. The pellet was washed 2 times with 600 µl pre-chilled (4°C) 100% ethanol. Then, the pellet was dried at 60°C in a heating block for 10 min to evaporate the ethanol (open lid). The dried pellet was resuspended in 100 µl 100 mM sodium acetate buffer + 5 mM calcium chloride at pH 4.5. 20 μl of amyloglucosidase enzyme solution (3300 U/ml) was added (Total Starch Assay, Megazyme) and the suspension was incubated at 60°C in a heating block (550 rpm) for 15 min (enzymatic hydrolysis of glycogen into glucose). Then, the samples were split into two aliquots of 50 μL and 800 µL hexokinase (GlucoseAssayReagent, G3293, Sigma-Aldrich) was added to one of the aliquots. This suspension was incubated at room temperature for 15 min. The sample blank consisted of the other 50 µL aliquot and 800 µL ddH2O and the reagent blank was made using 50 µL ddH2O and 800 µL hexokinase solution. A calibration curve was created using pure glycogen from algae (Megazyme) in MilliQ as a standard. The absorbance (A340) of the blanks and samples was measured with the NANOCOLOR® UV/VIS II spectrophotometer (MACHEREY-NAGEL) at λ = 340 nm using semi-micro cuvettes (greiner BIO-ONE). The glycogen content was determined using the standard curve. Based on literature, glycogen content varies extremely depending on the culturing conditions.
Phélippé et al. (2019) compared the data of several publications using Arthrospira platensis in PBRs in batch mode and found that the glycogen content lies between ∼5% and 65% g g DW-1 depending on the growth conditions.
2.7 Statistical analysis
In order to obtain the specific growth rate during exponential phase (µmax) and the corresponding 95% confidence intervals (CI), the values of biomass concentrations of the exponential phase were converted using the natural logarithm followed by linear regression of the experiment time versus ln [biomass concentration (g/L)] (Excel 2016 data analysis tool pack). Statistically significant differences were defined by comparing the mean µmax values of one condition with the CIs of all other conditions. The average biomass productivity during linear phase (Pav) and the corresponding 95% CIs were obtained by linear regression [biomass concentration (g/L) = Pav x + c] of the biomass concentration data of the linear phase.
The results of Xmax, max. pH, QY, max. pigment concentrations and %wt of Glycogen were evaluated using One-way ANOVA followed by multi-comparisons by Tukey test at a probability level of p < 0.05 using Graphpad Prism 9. The error bars on the figures correspond to standard deviations (SD), from the calculated mean values.
3 Results
3.1 Impact of light and temperature on the biomass production
Firstly, the impact of different temperatures (23°C, 25°C, 30°C, 32 °C and 34°C) and low light conditions (36, 45, 75 and 140 µmol photons m-2 s-1) on the biomass production, was tested. The maximum growth rate (µmax), average biomass productivity (Pav), maximum biomass concentration (Xmax) and the time of active proliferation (Tstat) were determined for each condition. The maximum biomass concentration (Xmax, g L-1) is defined as the highest biomass concentration in a growth curve and is therefore also the point before reaching stationary phase. The cultures grown at the highest light intensity of 140 µmol photons m-2 s-1 grew the fastest in the first days of culturing without light limitation, and thus showed the highest µmax values for this exponential growth phase. The light intensity and temperature both have a clear effect on the growth of the cultures. Suboptimal cold growth temperature (lower than 30°C) has mainly an impact at higher light intensity (75 or 140 µmol photons m-2 s-1) (Figure 2). At the contrary, colder temperature is beneficial under low light conditions, and allows a longer batch duration and a higher final biomass concentration (Tables 3 and 4).
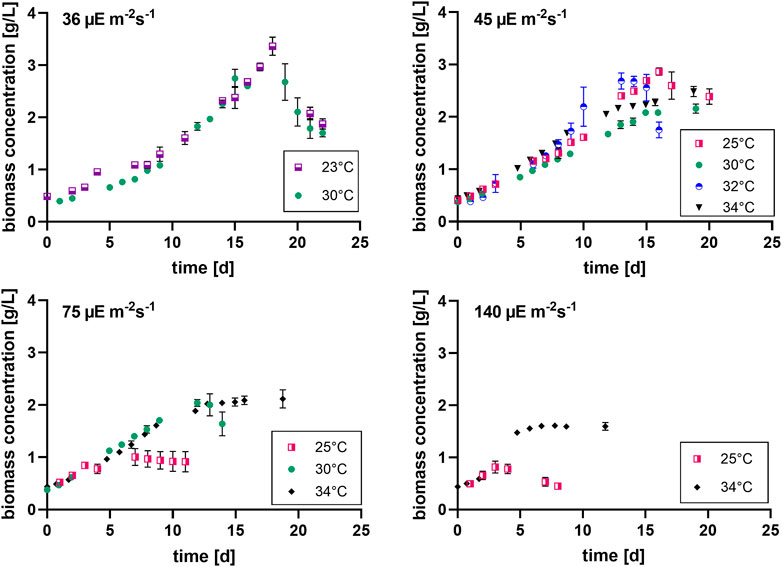
FIGURE 2. Biomass concentration curves at different light intensities (36, 45, 75 and 140 µmol photons m-2 s-1) [µE = µmol photons], with n = four to eight, all values are presented as mean ± SD (Tables 3 and 4).
It can be seen that the lower light intensities reached a higher maximum biomass before reaching the death phase. Additionally, the higher the light intensity, the faster the stationary phase is reached. Thus, the cultures with the highest growth rates during the exponential phase, have the lowest maximum biomass concentrations. For example, the cultures grown at 140 µmol photons m-2 s-1 and 25°C only grew for 3 days while the cultures grown at 45 µmol photons m-2 s-1 and 25°C grew for 16 days.
Pav showed only slight differences between the conditions. Nonetheless, for example, the two lowest light intensities in combination with 30°C–32 °C resulted in significantly higher average productivities during linear growth compared to most of the other conditions (Tables 1–4). It should be mentioned here that Pav could not be calculated for all conditions, as the linear growth phase only consisted of one or even zero time points at 75 and 140 µmol photons m-2 s-1 in combination with 25°C and 25°C and 34°C, respectively.
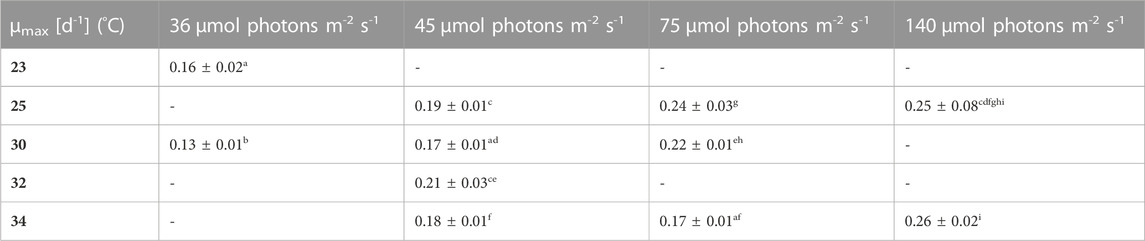
TABLE 1. Overview of the maximum specific growth rates (µmax) for biomass concentration X (DW) in the different growth conditions. The maximum growth rate reflects only the first 3–4 days of growth, where an exponential growth was shown by using a logarithmic scale and linear regression, the values are shown as mean ± CI(95%) of four to eight cultures. Different letters (a-l) indicate significant differences (p < 0,05).
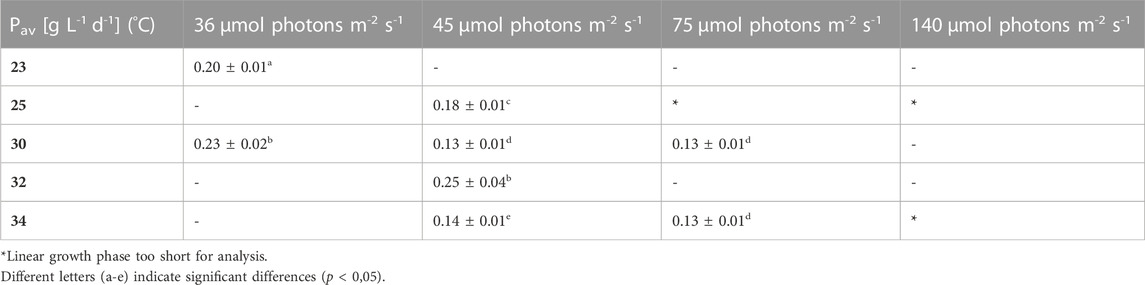
TABLE 2. Overview of the average biomass productivity in the different growth conditions. Pav is the slope of the linear regression in the linear growth phase, the values are shown as mean ± CI(95%) of four to eight cultures.
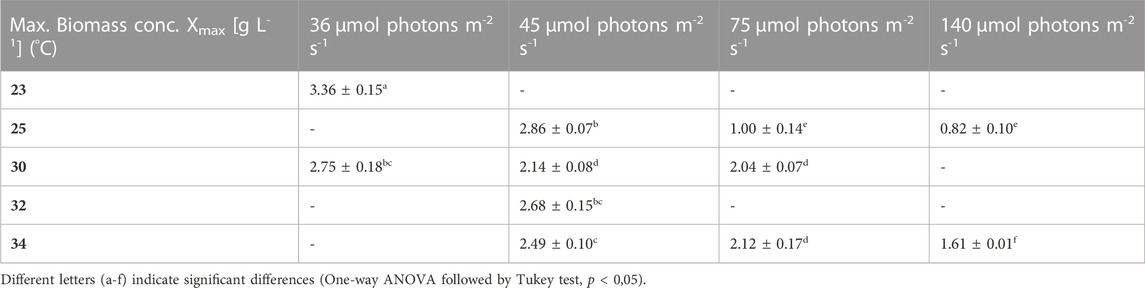
TABLE 3. Maximum biomass concentration (Xmax) obtained at the end of the batch under the different conditions. The values are shown as mean ± SD of four to eight cultures.
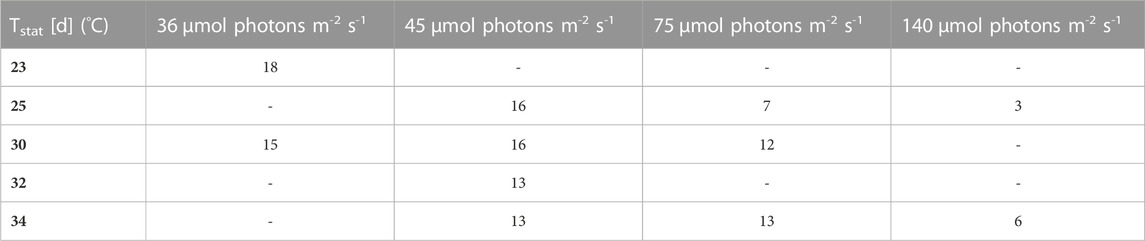
TABLE 4. Duration of active proliferation [time until stationary phase is reached Tstat (d)].
In summary, the higher the light intensity, the shorter the production phase (the lower the max. biomass concentration) and the faster the cultures reach stationary phase.
3.2 Impact of light and temperature on culture pH
The pH was shown to be a good and easy parameter to monitor biomass production for Limnospira indica PCC8005 when dissolved bicarbonate is used as the carbon source in batch modus. The pH of the overall culture medium goes up when biomass is produced, because bicarbonate is consumed from the medium and converted inside the cells, in the carboxyzomes, to CO2 and OH− ions, in the process of photosynthesis (Miller and Colman, 1980; Poughon et al., 2020). These OH− ions are released into the growth medium, causing the pH to rise. Figure 3 shows that the lower light intensities in combination with lower temperatures result in higher end pH values of the batch cultures, which matches the higher final biomass concentrations as reported in the previous section. The two lowest light intensities (36 and 45 µmol photons m-2 s-1) reach pH values above 11.5 in all tested temperature conditions (Table 5). Higher light intensities, especially in combination with cold temperature, restrain growth and pH increase. For example, 34°C in combination with 140 µmol photons m-2 s-1 reaches the stationary phase before reaching pH 11.5, the same light at 25°C even stopped before reaching pH values over 10.
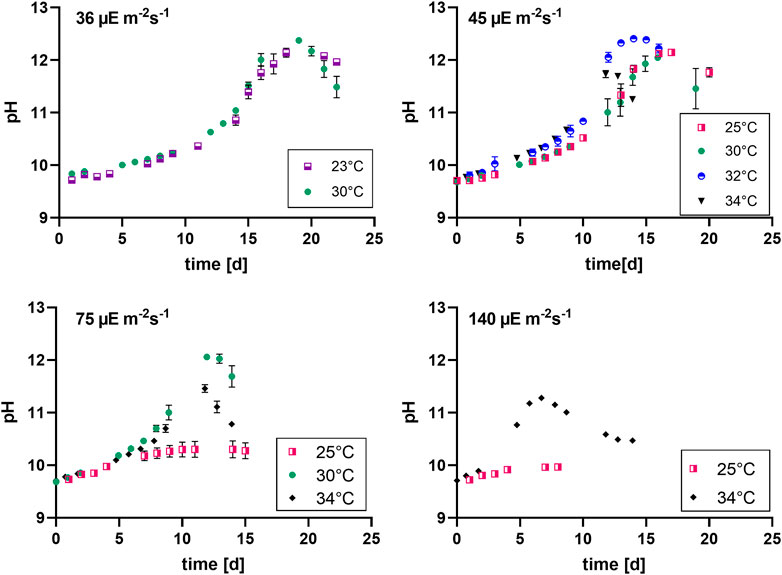
FIGURE 3. pH evolution at different light intensities (36, 45, 75 and 140 µmol photons m-2 s-1), n = four to eight, all values are presented as mean ± SD.
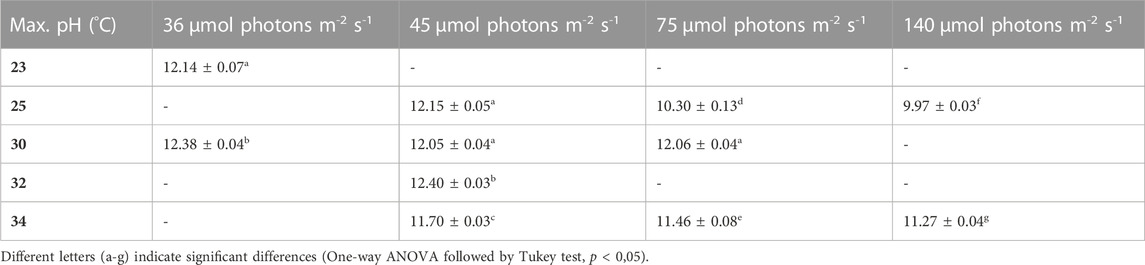
TABLE 5. Maximum pH values under different conditions, the values are shown as mean ± SD of four to eight cultures.
Table 5 shows the maximum pH values of the different cultures. Light intensity as well as temperature show a significant effect. The two lowest light conditions combined with 30°C and 32°C respectively, show the highest maximum pH, which is the same trend as we see for the average biomass productivity (Table 2).
3.3 Impact of low light on photosynthetic efficiency (QY) under different temperature regimes
The quantum yield was assessed in several growth conditions. All chosen time points were in the exponential and linear growth phase of the cultures to obtain reliable mean values (stationary phase not included).
Empirical observation revealed that the QY data is a good indicator of photosynthetic efficiency as it declines very rapidly when the cultures reach stationary phase, before any changes in OD or DW can be observed. For example, the cultures grown at 75 µmol photons m-2 s-1 and 30°C were on their biomass peak on day 12, but the QY value dropped already to 0.35 (previous data point was 0,45) on that day. The cultures grown at 45 µmol photons m-2 s-1 and 30°C showed the same effect on day 19 (biomass peak but QY dropped from 0.50 to 0.26). Table 6 shows that the QY of all tested conditions is in a range between 0,40 and 0,50. Nevertheless, significant differences were found for several conditions. For example, the QY in conditions of low light flux (36 µmol photons m-2 s-1) in combination with high temperature (34°C) was significantly lower than the QY for lower temperature (25°C, 45 µmol photons m-2 s-1) and for higher light (34°C, 75 µmol photons m-2 s-1) conditions.
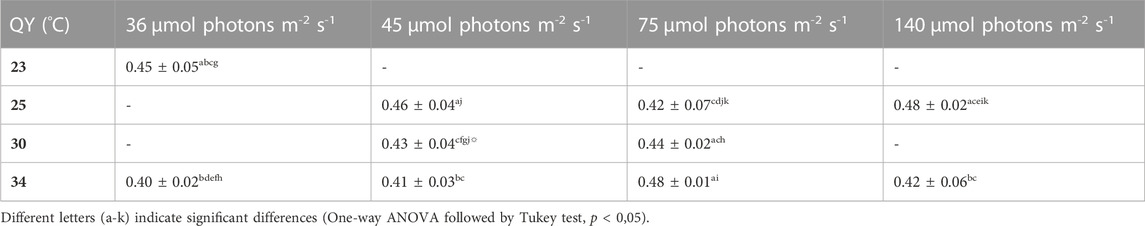
TABLE 6. QY of the cultures grown under different conditions, the values are shown as mean ± SD of four to eight cultures.
3.4 Impact of low light on pigment content, under different temperature regimes
During most growth experiments, samples for pigment extractions were taken. The extractions covered three different photosynthetic pigments, phycocyanin, allophycocyanin and chlorophyll. Figure 4 shows the phycocyanin content during the culturing time. The phycocyanin content per g DW drops drastically when the cultures reach the stationary phase. Tables 7–9 show the maximum pigment contents. In all three pigments, the impact of light and temperature shows a similar pattern. The lower light conditions (36 and 45 µmol photons m-2 s-1) in combination with higher temperatures (30°C–34°C) show the highest pigment contents. Under warm temperature (30°C–34°C), small variations in light intensities below 100 µmol photons m-2 s-1 (36, 45 and 75 µmol photons m-2 s-1) do not have a significant impact on the antenna pigment concentrations (0.130 ± 0.009 g phycocyanin per g DW for 45 µmol photons m-2 s-1 at 34°C, vs 0.129 ± 0.008 g phycocyanin per g DW for 75 µmol photons m-2 s-1 at 34°C), only a light intensity of 140 µmol photons m-2 s-1 (34°C) induced a significantly lower pigment concentration (0.051 ± 0.017 g phycocyanin per g DW). Lower temperatures also caused significantly lower antenna pigment (phycocyanin and allophycocyanin) and chlorophyll concentrations. For example, a temperature of 30°C in combination with 36 µmol photons m-2 s-1 gave a phycocyanin concentration of 0.122 ± 0.014 g g DW-1 and at 23°C, only 0.030 ± 0.003 g g DW-1 (−75,4%) could be achieved.
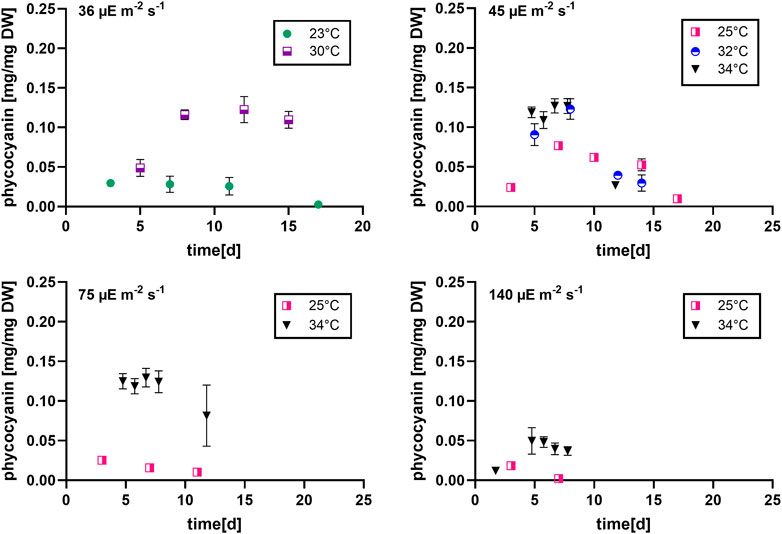
FIGURE 4. Phycocyanin content at different light intensities (36, 45, 75 and 140 µmol photons m-2 s-1) over the culturing time, n = four to eight, all values are presented as mean ± SD.
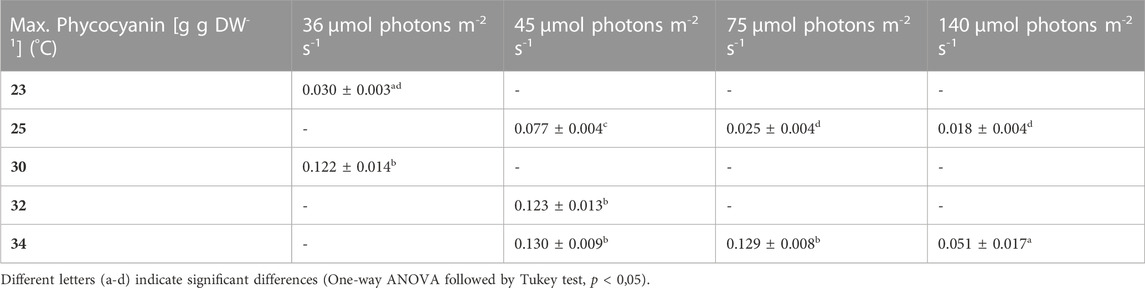
TABLE 7. Maximum phycocyanin content. The values are shown as mean ± SD of four to eight cultures.
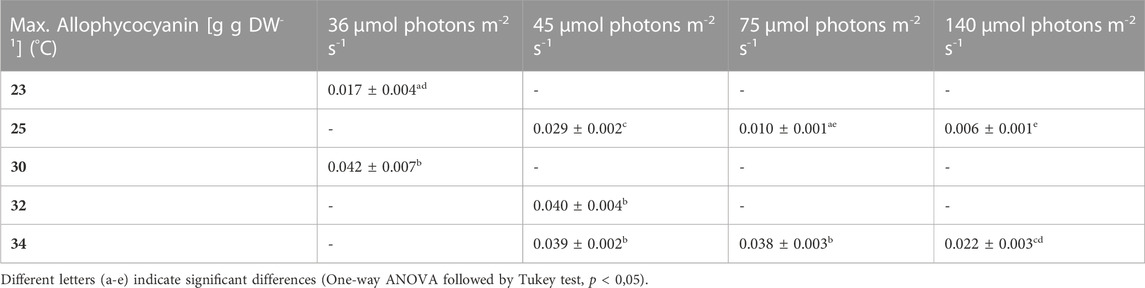
TABLE 8. Maximum allophycocyanin content, the values are shown as mean ± SD of four to eight cultures.

TABLE 9. Maximum chlorophyll content, the values are shown as mean ± SD of four to eight cultures.
3.5 Impact of low light on glycogen content under different temperature conditions
The total glycogen content was determined in different growth conditions. Figure 5 shows the corresponding results. The glycogen content was found to be below 40% for all conditions, nonetheless, significant differences were found between the different temperature conditions. Cultures grown under the two lower light intensities did not reach values above 10% (g g DW-1). The two highest light intensities of 75 and 140 µmol photons m-2 s-1 show a strong difference between the temperature conditions; i.e., suboptimal colder temperature (25°C) induced higher glycogen concentrations.
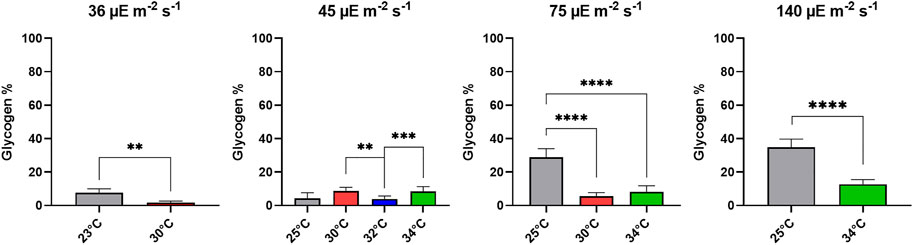
FIGURE 5. Glycogen content (wt%) of Limnospira indica cultures under different light intensities and temperatures, the values are shown as mean ± SD, statistics using one-way ANOVA followed by Tukey test, * = p < 0,05; ** = p < 0,01; *** = p < 0.001 and **** = p < 00,001.
4 Discussion
4.1 Biomass production
The average biomass productivity of the linear growth phase (Pav) of L. indica under different temperatures and light intensities showed a remarkable significant increase under two conditons (36 µmol photons m-2 s-1 with 30°C and 45 µmol photons m-2 s-1 with 32°C), while the maximum growth rate (µmax), culturing time (Tstat) and the max. biomass concentration (Xmax) showed very strong differences between most culture conditions. Therefore it can be argued that in the first few days of culturing (during exponential phase without light limitation), the cells are proliferating at different rates but reach more similar productivities after this first phase. The reason for this are the light limiting conditions which are becoming more similar over time due to an increased growth rate at the higher light fluxes and higher temperatures at the beginning, versus slower biomass accumulation under lower light fluxes, resulting in similar light conditions in both cases. For the high light fluxes, no Pav could be obtained because the linear phase was too short, thus, statements can only be made for the lower light fluxes between 35 and 75 µmol photons m-2 s-1.
The Limnospira indica PCC8005 P3 strain used in these experiments has adapted to a constant lower light environment at warm temperatur during the long cultivation time in our incubators in our laboratories. In our facilities, this strain is kept at 25–35 µmol photons m-2 s-1 and at 30°C. Thus, the strain is not acclimated to higher light conditions anymore and experiences photoinhibition when suddenly exposed to higher light conditions. Photoinhibition is a complex process occuring in all photosynthetic organisms under stressfull high light conditions. Photoinhibition occurs when the amount of absorbed photons produces more electrons than can be used in the Calvin cycle (Chojnacka and Noworyta, 2004). This causes an increase in reactive oxygen species (ROS) and therefore triggers several defence, detox and repair mechanisms in the cells, for example, the production of certain antioxidants. In case of strong photoinhibition, the amount of ROS inside the cell causes too much oxidative damage to the cell structures and leads to death of the photosynthetic organism (Scandalios, 2005; Erickson et al., 2015; Maltsev et al., 2021). It was also shown previously, that the H2O2 concentration increases inside cyanobacterial cells when different environmental stresses like high light fluxes or phosphorus depletion are applied (Asaeda et al., 2022). Muhetaer et al. (2020) suggest that the production of H2O2 by the photosytem is the main reason for the reduced growth under high light in the cyanobacterial species Pseudanabaena galeata and Microcystis aeruginosa. They additionally showed that a longer exposure to unpreferable light conditions increases the negative effect on the growth of the cultures. In our study, the higher light conditions reached much lower maximum biomass concentrations, which supports the assumption that high light is inhibiting the growth after a few days, most likely due to an accumulation of reactive oxygen species.
The optimal light conditions are different not only for different species but also for different strains. The original habitat of the cyanobacteria impacts their light and temperature optima and therefore the adaptation of different species and strains to low or high light differs strongly (Moore et al., 1995; Vonshak and Tomaselli, 2000). Bautista and Laroche (2021) suggest that the differing responses of strains to light stress could have a genotypic origin which controls the turnover rate of the protein D1, a component of PS II. They mention additionally, that cultures can adapt to higher light intensities when exposed to such conditions for a longer period. In our current follow-up studies, we investigate possibilities to adapt the strain to different light flux intensities.
It is therefore not suprising that the values of optimal light intensities and the corresponding biomass productivities and biomass concentrations are varying strongly in literature. Maltsev et al. (2021) found in their study that the optimal light intensity for the growth of various microalgae lies between 26 and 400 µmol photons m-2 s-1. Several studies found high biomass productivities under high light conditions, for example, a light intensity of 2,300 µmol photons m-2 s-1 (∼29°C) caused a very high biomass production of 0.67 g L-1 d-1 in a photobioreactor with Arthrospira platensis BP in a semi-continuous mode at an OD560nm of 0.6 in the studies of Chaiklahan et al. (2022). Further; Garcia-Gragera et al. (2021) reports a maximum biomass productivity of 0.58 g L-1 d-1 and a max. biomass concentration of 1.65 g L-1 for 932 µmol photons m-2 s-1 in experiments performed at the MELiSSA pilot plant; Deamici et al. (2022) used 120 µmol photons m-2 s-1 in a batch set-up using a photobioreactor, and found an average biomass productivity of 0.11 ± 0.01 g L-1 d-1, a max. biomass concentration of 1.52 ± 0.01 g L-1, and a µmax of 0.55 ± 0.01 d-1. In the ArtEMISS B space flight, at 35 µmol photons m-2 s-1 and 33 °C; Poughon et al. (2020) found a maximum biomass productivity of ∼0.12 g L-1 d-1, while Farges et al. (2009) reports a biomass productivity of 0.077 g L-1 d-1 for 33 µmol photons m-2 s-1 in an 1.2 L membrane bioreactor; Ravelonandro et al. (2008) performed experiments on a Spirulina platensis strain in modified Zarrouk medium and showed that very low intensities of green light at 1,200 lux (∼16 µmol photons m-2 s-1, ∼30°C) reached a productivity of 0.18 g L-1 d-1, a maximum growth rate of 0.624 d-1 and a maximum biomass concentration of 0.26 g L-1. In another study, different species of red algae were shown to have higher growth rates under low irradiances (65 vs 300 μmol photons m-2 s-1). Additionally, it could be shown that the temperature optima for some of the red algae species changed depending on the light intensity. The combination of low temperature with high light showed the slowest growth (Zucchi and Necchi, 2001), similar to our results on L. indica PCC8005. For multiple other photosynthetic organisms, like aquatic and land plants, it was already shown in the 1980s that lower temperatures increase the stress of photoinhibition caused by high light conditions (Powles, 1984).
Therefore it can be concluded that even though a lot of variability is found in the reported literature values, our results lie in the same range and the maximum biomass concentration (3.36 ± 0.15 g L-1 at 36 µmol photons m-2 s-1 and 23°C) is even higher than the reported values.
It is important to keep in mind that several factors influence the light conditions inside a culture. For example, a high biomass density in a culture causes shading effects which impact the light availability and therefore also the biomass production (Poughon et al., 2020; Garcia-Gragera et al., 2021; Chaiklahan et al., 2022), therefore not only the light intensity but also the availability of light plays an important role. Additionally, the wavelength composition of the light influences the performance of a cyanobacterial culture. Several studies have been performed on the use of different wavelengths (Ravelonandro et al., 2008; Bland and Angenent, 2016).
In our experiments, the temperature was shown to have a significant but smaller impact on the biomass production under low light conditions (<100 µmol photons m-2 s-1) but was shown to have a high impact on other parameters such as pigment production. Thus, the smaller influence of temperature on biomass productivity was also shown in other reported studies. De Oliveira et al. (1999) found that only small changes in growth kinetics (Spirulina maxima and Spirulina platensis) are detectable when the temperature is changed. Only temperatures that are outside of the optimal range showed a big impact in their study.
4.2 pH
It is remarkable that all except three conditions reached pH values above 11.5. The pH increases due to the bicarbonate uptake of L. indica and the resulting OH− release (Poughon et al., 2020). These high pH values shift the bicarbonate to carbonate species equilibrium and causes a HCO3− scarcity. The fact that many of the cultures continue their growth above pH 11 suggest that this strain is exceptionally well equipped for high pH values and low bicarbonate abundance. Many cyanobacteria have developed the ability to take up HCO3− due to the limited availability of CO2 in marine and fresh waters (Smith and Ferry, 2000). When a cyanobacterium is able to grow at pH values higher than 10, it uses active HCO3− transport inside the cell because at pH > 10, very limited and decreasing amounts of CO2 are present. Bicarbonate is less available above pH values of 10.3, because at this pH, the bicarbonate HCO3− concentration in the medium is lower than carbonate CO32- concentration, which become the more abundant species (Deamici et al., 2022). Thus, the high pH values which have been measured under low light conditions probably can be explained by an exceptionally efficient HCO3− uptake of the L. indica PCC8005 P3 strain.
Banares-Espana et al. (2006) have shown that different strains of the cyanobacterium M. aeruginosa have different pH compensation points, meaning they have different capacities to use HCO3− as a carbon source. These results support our hypothesis that the P3 strain might have developed a high HCO3− affinity and is therefore able to survive even above pH values of 11.5.
The higher light intensities do not show high pH values before the stationary phase. Therefore a carbon limitation is unlikely for these conditions. As explained in the previous section, photoinhibition causing lethal ROS doses is a likely explanation for the early death of the cultures. An additional possible explanation could be a nitrogen depletion due to limitation in the nitrogen assembly machinery (see discussion section glycogen).
The pH values were in line with the biomass productions and therefore this parameter can be used under varying conditions to monitor the growth status of the cultures. Additionally, the pH of the surrounding medium influences the biomass and pigment production of A. platensis (Gomont). Ismaiel et al. (2016) showed that the highest biomass for the Gomont strain could be obtained at pH 9.0. The highest chlorophyll and phycocyanin production were obtained at pH 8.5. Thus, the decreasing phycocyanin content at the end of the culturing time could be a pH induced effect (Figure 4).
4.3 Quantum yield
The QY of all tested cultures was between 0.40 and 0.50. Nevertheless, the statistical analysis revealed significant difference between several conditions. The highest QY values were obtained for cultures grown under higher light intensities (140 µmol photons m-2 s-1 with 25°C and 75 µmol photons m-2 s-1 with 34°C). This shows that the QY increases slightly under increasing light intensities. We could not find a direct correlation between the pigment content and the QY (see Table 6 vs; Tables 7–9). The combinations of (1) low temperature with low light, and (2) high temperature with high light seem to promote a high QY. According to Schuurmans et al. (2015) is it important to use the QY only as a qualitative value and it should not be compared in between species or even strains. Thus, the small differences between the QY values observed in this study should also be interpreted with caution. In summary, all cultures showed QY values between 0.40 and 0.50 and therefore it can be concluded that the photosynthetic performance was similar in the different conditions.
4.4 Pigments
A high pigment content (phycocyanin, allophycocyanin and chlorophyll) goes hand in hand with a high protein and antioxidant nutritive value of L. indica and accordingly it was one of our goals to find suitable conditions.
As mentioned, literature research revealed that phycocyanin and allophycocyanin constitute between 15% and 20% of the dry weight in Arthrospira when cultured in PBRs (Chaiklahan et al., 2012; Lee et al., 2016; Chaiklahan et al., 2022) which aligns with the values we obtained for the combinations of low light and high temperature (Table 7, 8). Several parameters have an influence on the pigment content. For example, not only the light intensity but also the wavelength composition has an impact on the phycocyanin production (Fekrat et al., 2022). The halogen lamps and LEDs which we used emit the full photosynthetic active irradiation in all experiments, thus, an impact of this parameter is unlikely in this study.
Other studies have shown that in several species of red algae, the pigment content changed significantly with the culturing temperature and for some species, the amount of phycobilliprotein increased when the light intensity was decreased (Zucchi and Necchi, 2001). Our results show a similar trend when 140 mol photons m-2 s-1 is compared to the lower light intensities. Deamici et al. (2022) obtained a chlorophyll content of 1.11 ± 0.15 mg g DW-1 (∼0.001 g g DW-1, in L. indica PCC8005) which is much lower than the values presented in this study. Garcia-Gragera et al. (2021) found a phycobilliprotein content between 0.037 and 0.125 g g DW-1 and a chlorophyll content between 0.007 and 0.018 g g DW-1 (also in L. indica PCC8005), which is very similar to our results (0.018 and 0.130 g g DW-1 for phycocyanin and 0.004—0.024 g g DW-1 for chlorophyll).
Karemore et al. (2020) confirmed that the temperature does not only play a role in the general biomass production but also impacts the pigment content in a semi-continuous PBR culture of A. platensis. A constant high temperature of 35°C caused a higher phycocyanin content in their study and the percentage of phycocyanin per dry weight decreased over the culturing time. In this study, cultures grown under higher temperatures were also shown to have an increased pigment content (phycocyanin, allophycocyanin and chlorophyll a) and therefore, these conditions are preferably used in regard to the nutritive value of L. indica. Temperature and light intensity both have a strong impact on the pigment contents and neither low temperature nor high light were shown to be favorable of this parameter in our experiments.
4.5 Glycogen
In L. indica PCC8005, 82% of the total carbohydrates were found to be glycogen (Bermudez and Paulina, 2022). Not only Limnospira but many cyanobacteria store glycogen as a carbon stock. The built-up of these stocks can be used as an electron sink (Damrow et al., 2016). Literature results revealed that high light intensity stress and nitrogen depletion play major roles in the metabolism of carbohydrates (Phélippé et al., 2019). For example, it was shown that cyanobacteria mutants which can not produce glycogen can not survive nitrogen starvation and also bleach faster at high light intensities (Carrieri et al., 2012; Hickman et al., 2013; Cano et al., 2018). In Synechocystis sp. PCC 6803, the glycogen metabolism was shown to be an important energy buffering system and glycogen accumulation is a direct result of high energy charges (Cano et al., 2018). The cyanobacteria Merismopedia tenuissima and Oscillatoria rubescens where shown to be more efficient at incorporating HCO3− into low molecular weight compounds under lower light conditions (20 vs > 90 µmol photons m-2 s-1) and M. tenuissima produced less polysaccharides and more proteins under low light conditions (Konopka and Schnur, 1980), which is a similar trend than what we observed. Sakamoto and Bryant (1997) found that lower temperatures can cause the same effects as nitrogen depletion, causing an increase in glycogen accumulation. Sakamoto and Bryant (1997) found that Synechococcus sp. PCC 7002 grown at 15°C under 50 and 250 µmol photons m-2 s-1 showed an increase in glycogen content when nitrate was used as the nitrogen source. Additionally, cultures grown at the same temperature but with urea as the sole nitrogen source, the glycogen accumulation could only be observed at the higher light intensity. Thus, it has been concluded that the cold growth conditions cause a nitrogen depletion effect. In a follow-up study (Sakamoto and Bryant, 1999), they found proof that the inactivation of nitrate/nitrite transporters is the main reason for limited growth under low temperatures. Additionally, Sakamoto and Bryant (1997) have shown that the high light, low temperature condition causes a decrease in phycobilliprotein, similar to the results obtained in the present study, and that this decrease in pigment content can be counteracted by using a different nitrogen source as urea.
The whole intracellular composition of L. indica changes depending on the growth conditions. For example, the light intensity has an impact on the ratio of extracellular polymeric substances (EPS) to intracellular glycogen. Phélippé et al. (2019) showed a decrease in the EPS/glycogen ratio from 3.1 at 100 µmol photons m-2 s-1 to 0.6 at 1,200 µmol photons m-2 s-1, due to the fact that at higher light intensity the glycogen content increases to a larger extend than the EPS in the cells. They additionally compared the data of several publications using A. platensis in PBRs in batch mode and found that the glycogen content is varying severely (∼5%–65% g g DW-1) depending on the growth conditions which were used. For example, high salinity, nitrogen depletion and high light intensity have a strong impact on the glycogen production and the light intensity was found to be the most crucial. Only the high light intensities at lower temp produced more then 10% glycogen in our study. In summary, the high light conditions cause a high electron abundance in the cell, but the anabolic protein production pathways cannot follow the high flux of electrons under low temperatures and therefore electons are used to reduce CO2 and stock the carbon in a reduced form as glycogen.
Deamici et al. (2022) found a carbohydrate content of 14.01 ± 1.84 g g DW-1 at 120 µmol photons m-2 s-1 which is similar to our glycogen value of 12.71 ± 2.58 at 140 µmol photons m-2 s-1 (34°C). Changes in glycogen content have an impact on the sedimentation behavior of the culture (Deschoenmaeker et al., 2017). Sedimentation (due to glycogen) and aggregation (due to EPS) are especially important for PBR operation in gravity environments like on Earth, as an increase in sedimentation velocity may cause mixing problems that result in not evenly distributed light and nutrients in the culture and problems with optical biomass measurements (Poughon et al., 2020; Fais et al., 2022b).
5 Conclusion
This study was one of the steps to determine the most optimal propagation conditions in a space bioreactor of the future life support system organism Limnospira indica and helps us to avert problems during upcoming space flight experiments. In order to complete the picture, we are currently investigating the impact of chronic low-dose irradiation and simulated microgravity on the L. indica cultures. The corresponding results will be presented in follow-up studies.
Figure 6 shows the peaks of the different parameters and how they overlap. Our main goals were a high pigment content, high QY, high maximum biomass concentration and low glycogen content. The graphical illustration shows that a higher temperature (30°C or above) in combination with low light (35—75 µmol photons m-2 s-1) is most optimal to reach these goals and propagate a healthy batch culture.
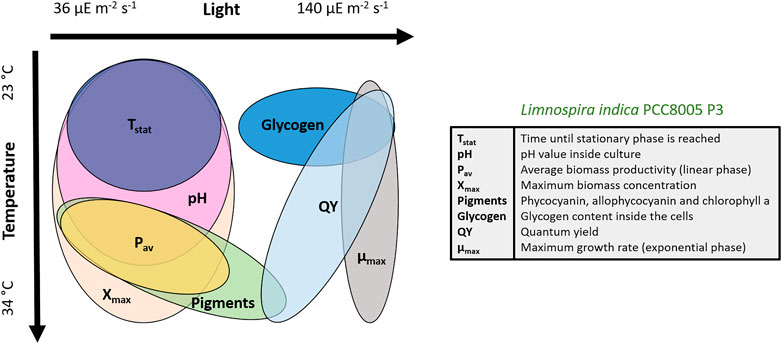
FIGURE 6. Qualitative overview of the impact of light and temperature on Limnospira indica PCC8005 P3. The maxima of each parameter are illustrated.
Data availability statement
The raw data supporting the conclusions of this article will be made available by the authors, without undue reservation.
Author contributions
JF and NL designed the experimental set-ups, JF performed the experiments in the laboratory and wrote the first draft, NL and CD contributed to reviewing and editing. All authors contributed to the article and approved the submitted version.
Funding
This work was funded via the SCK CEN PHD Grant of JF, which is part of the ArtEMISS project funded by Belspo and ESA via the PRODEX program. The ArtEMISS project is part of the MELiSSA program of ESA.
Acknowledgments
This study was sponsored via the ESA ARTEMISS prodex contract and is part of the MELiSSA program of ESA, in the context of a PhD program of SCKCEN. The authors would like to thank Gabriele Ellena and Ilse Coninx for their help in the laboratory.
Conflict of interest
The authors declare that the research was conducted in the absence of any commercial or financial relationships that could be construed as a potential conflict of interest.
Publisher’s note
All claims expressed in this article are solely those of the authors and do not necessarily represent those of their affiliated organizations, or those of the publisher, the editors and the reviewers. Any product that may be evaluated in this article, or claim that may be made by its manufacturer, is not guaranteed or endorsed by the publisher.
References
Aguirre-von-Wobeser, E., Figueroa, F. L., Cabello-Pasini, A., and Cabello-Pasini, A. (2000). Effect of UV radiation on photoinhibition of marine macrophytes in culture systems. J. Appl. Phycol. 12, 159–168. doi:10.1023/a:1008198404529
Akimoto, S., Yokono, M., Hamada, F., Teshigahara, A., Aikawa, S., and Kondo, A. (2012). Adaptation of light-harvesting systems of Arthrospira platensis to light conditions, probed by time-resolved fluorescence spectroscopy. Biochimica Biophysica Acta (BBA)-Bioenergetics 1817, 1483–1489. doi:10.1016/j.bbabio.2012.01.006
Allahverdiyeva, Y., Mustila, H., Ermakova, M., Bersanini, L., Richaud, P., Ajlani, G., et al. (2013). Flavodiiron proteins Flv1 and Flv3 enable cyanobacterial growth and photosynthesis under fluctuating light. Proc. Natl. Acad. Sci. 110, 4111–4116. doi:10.1073/pnas.1221194110
Antar, B., Reiss, D., and Lehman, D. (2006). “Gas-liquid separation strategies in microgravity environment,” in 45th AIAA Aerospace Sciences Meeting and Exhibit, Reno, Nevada, 08 January 2007 - 11 January 2007, 950.
Asaeda, T., Rahman, M., and Abeynayaka, H. D. L. (2022). Hydrogen peroxide can be a plausible biomarker in cyanobacterial bloom treatment. Sci. Rep. 12, 1–11. doi:10.1038/s41598-021-02978-6
Averina, S. G., Velichko, N. V., Pinevich, A. A., Senatskaya, E. V., and Pinevich, A. V. (2019). Non-a chlorophylls in cyanobacteria. Photosynthetica 57, 1109–1118. doi:10.32615/ps.2019.130
Badri, H., Monsieurs, P., Coninx, I., Wattiez, R., and Leys, N. (2015). Molecular investigation of the radiation resistance of edible cyanobacteriumArthrospirasp. PCC 8005. Microbiologyopen 4, 187–207. doi:10.1002/mbo3.229
Banares-Espana, E., López-Rodas, V., Salgado, C., Costas, E., and Flores-Moya, A. (2006). Inter-strain variability in the photosynthetic use of inorganic carbon, exemplified by the pH compensation point, in the cyanobacterium Microcystis aeruginosa. Aquat. Bot. 85, 159–162. doi:10.1016/j.aquabot.2006.03.009
Barnett, M., Bhadouria, P., and Bisen, P. (2005). Arthrospira platensis: Brief history and description. Curr. Pharm. Biotechnol. 6, 373–379. doi:10.2174/138920105774370607
Bautista, E. G., and Laroche, C. (2021). Arthrospira platensis as a feasible feedstock for bioethanol production. Appl. Sci. 11, 6756. doi:10.3390/app11156756
Bennett, A., and Lawrence, B. (1973). Complementary chromatic adaptation in a filamentous blue-green alga. J. Cell. Biol. 58, 419–435. doi:10.1083/jcb.58.2.419
Bermudez, C., and Paulina, S. (2022). The cyanobacterium Limnospira: Carbohydrates production, photosynthetic activity, and biomass harvesting.
Bland, E., and Angenent, L. T. (2016). Pigment-targeted light wavelength and intensity promotes efficient photoautotrophic growth of Cyanobacteria. Bioresour. Technol. 216, 579–586. doi:10.1016/j.biortech.2016.05.116
Cano, M., Holland, S. C., Artier, J., Burnap, R. L., Ghirardi, M., Morgan, J. A., et al. (2018). Glycogen synthesis and metabolite overflow contribute to energy balancing in cyanobacteria. Cell. Rep. 23, 667–672. doi:10.1016/j.celrep.2018.03.083
Carrieri, D., Paddock, T., Pin-Ching, M., Seibert, M., and Yu, J. (2012). Photo-catalytic conversion of carbon dioxide to organic acids by a recombinant cyanobacterium incapable of glycogen storage. Energy and Environ. Sci. 5, 9457–9461. doi:10.1039/c2ee23181f
Chaiklahan, R., Chirasuwan, N., and Bunnag, B. (2012). Stability of phycocyanin extracted from Spirulina sp.: Influence of temperature, pH and preservatives. Process Biochem. 47, 659–664. doi:10.1016/j.procbio.2012.01.010
Chaiklahan, R., Chirasuwan, N., Srinorasing, T., Attasat, S., Nopharatana, A., and Bunnag, B. (2022). Enhanced biomass and phycocyanin production of Arthrospira (Spirulina) platensis by a cultivation management strategy: Light intensity and cell concentration. Bioresour. Technol. 343, 126077. doi:10.1016/j.biortech.2021.126077
Chojnacka, K., and Noworyta, A. (2004). Evaluation of Spirulina sp. growth in photoautotrophic, heterotrophic and mixotrophic cultures. Enzyme Microb. Technol. 34, 461–465. doi:10.1016/j.enzmictec.2003.12.002
Ciferri, O. (1983). 'Spirulina, the edible microorganism. Microbiol. Rev. 47, 551–578. doi:10.1128/mr.47.4.551-578.1983
Cogne, G., Lehmann, B., Dussap, C. G., and Gros, J. B. (2003). 'Uptake of macrominerals and trace elements by the cyanobacterium spirulina platensis (Arthrospira platensis PCC 8005) under photoautotrophic conditions: Culture medium optimization. Biotechnol. Bioeng. 81, 588–593. doi:10.1002/bit.10504
Cornet, J. F., and Dussap, C. G. (2009). A simple and reliable formula for assessment of maximum volumetric productivities in photobioreactors. Biotechnol. Prog. 25, 424–435. Wiley InterScience. doi:10.1002/btpr.138
Damrow, R., Maldener, I., and Zilliges, Y. (2016). The multiple functions of common microbial carbon polymers, glycogen and PHB, during stress responses in the non-diazotrophic cyanobacterium Synechocystis sp. PCC 6803. Front. Microbiol. 7, 966. doi:10.3389/fmicb.2016.00966
De Oliveira, M. A. C. L., Monteiro, M. P. C., Robbs, P. G., and Leite, S. G. F. (1999). 'Growth and chemical composition of Spirulina maxima and Spirulina platensis biomass at different temperatures. Aquac. Int. 7, 261–275. doi:10.1023/a:1009233230706
Deamici, K. M., Greque de Morais, M., Oliveira dos Santos, L., Gros, F., Vieira Costa, J. A., and Laroche, C. (2022). Magnetic field action on Limnospira indica PCC8005 cultures: Enhancement of biomass yield and protein content. Appl. Sci. 12, 1533. doi:10.3390/app12031533
Deschoenmaeker, F., Bayon-Vicente, G., Sachdeva, N., Depraetere, O., Cabrera Pino, J. C., Leroy, B., et al. (2017). Impact of different nitrogen sources on the growth of Arthrospira sp. PCC 8005 under batch and continuous cultivation - a biochemical, transcriptomic and proteomic profile. Bioresour. Technol. 237, 78–88. doi:10.1016/j.biortech.2017.03.145
Erickson, E., Wakao, S., and Niyogi, K. K. (2015). 'Light stress and photoprotection in Chlamydomonas reinhardtii. Plant J. 82, 449–465. doi:10.1111/tpj.12825
Fais, G., Manca, A., Bolognesi, F., Borselli, M., Concas, A., Busutti, M., et al. (2022a). Wide range applications of spirulina: From Earth to space missions. Mar. Drugs 20, 299. doi:10.3390/md20050299
Fais, G., Manca, A., Concas, A., Pantaleo, A., and Cao, G. (2022b). 'A novel process to grow edible microalgae on Mars by exploiting in situ-available resources: Experimental investigation. Acta Astronaut. 201, 454–463. doi:10.1016/j.actaastro.2022.09.058
Farag, M. R., Alagawany, M., Abd El-Hac, M. E., and Dhama, K. (2015). 'Nutritional and healthical aspects of spirulina (Arthrospira) for poultry, animals and human. Int. J. Pharmacol. 12, 36–51. doi:10.3923/ijp.2016.36.51
Farges, B., Laroche, C., Cornet, J.-F., and Dussap, C.-G. (2009). Spectral kinetic modeling and long-term behavior assessment of Arthrospira platensis growth in photobioreactor under red (620 nm) light illumination. Biotechnol. Prog. 25, 151–162. Wiley InterScience. doi:10.1002/btpr.95
Fekrat, F., Shahbazi, M., Amin Hejazi, M., and Nami, B. (2022). Optimization of light conditions by affecting the growth and production of C-Phycocyanin in Spirulina platensis microalgae. J. plant process Funct. 11, 79–94.
Furmaniak, M. A., Misztak, A. E., Franczuk, M. D., Wilmotte, A., Waleron, M., and Waleron, K. F. (2017). 'Edible cyanobacterial genus Arthrospira: Actual state of the art in cultivation methods, genetics, and application in medicine. Front. Microbiol. 8, 2541. doi:10.3389/fmicb.2017.02541
Gao, K., Yu, H., and Brown, M. T. (2007). 'Solar PAR and UV radiation affects the physiology and morphology of the cyanobacterium Anabaena sp. PCC 7120. J. Photochem. Photobiol. B Biol. 89, 117–124. doi:10.1016/j.jphotobiol.2007.09.006
Garcia-Gragera, D., Peiro, E., Arnau, C., Cornet, J-F., Dussap, C-G., and Godia, F. (2021). Dynamics of long-term continuous culture of Limnospira indica in an air-lift photobioreactor. Microb. Biotechnol. 15, 931–948. doi:10.1111/1751-7915.13882
Guidi, L., Tattini, M., and Landi, M. (2017). “How does chloroplast protect chlorophyll against excessive light,” in Chlorophyll (London: Intech), 21.
Hickman, J. W., Kotovic, K. M., Miller, C., Paul, W., Kaiser, B., Jurista, T., et al. (2013). 'Glycogen synthesis is a required component of the nitrogen stress response in Synechococcus elongatus PCC 7942. Algal Res. 2, 98–106. doi:10.1016/j.algal.2013.01.008
Ismaiel, M. M., El-Ayouty, Y. M., and Piercey-Normore, M. (2016). Role of pH on antioxidants production by Spirulina (Arthrospira) platensis. Braz. J. Microbiol. 47, 298–304. doi:10.1016/j.bjm.2016.01.003
Johnson, T. R., Haynes, J. I., Wealand, J. L., Yarbrough, L. R., and Hirschberg, R. (1988). Structure and regulation of genes encoding phycocyanin and allophycocyanin from Anabaena variabilis ATCC 29413. J. Bacteriol. 170, 1858–1865. doi:10.1128/jb.170.4.1858-1865.1988
Karemore, A., Yuan, Y., Porubsky, W., and Chance, R. (2020). Biomass and pigment production for Arthrospira platensis via semi-continuous cultivation in photobioreactors: Temperature effects. Biotechnol. Bioeng. 117, 3081–3093. doi:10.1002/bit.27480
Konopka, A., and Schnur, M. (1980). 'Effect of light intensity on macromolecular synthesis in cyanobacteria. Microb. Ecol. 6, 291–301. doi:10.1007/bf02010492
Lasseur, C., Brunet, J., de Weever, H., Dixon, M., Dussap, C. G., Gódia, F., et al. (2010). MELiSSA: The European project of closed life support system. Gravitational Space Biol. 23 (2), 3.
Lasseur, C. (2008). “Melissa: The European project of a closed life support system,” in 37th COSPAR Scientific Assembly, Montreal, Canada, 13-20 July 2008, 1706.
Lasseur, C., and Mergeay, M. (2021). Current and future ways to closed life support systems: Virtual MELiSSA conference. Ecol. Eng. Environ. Prot. 1, 75–85.
Lee, S-H., Lee, J. E., Kim, Y., and Lee, S. Y. (2016). The production of high purity phycocyanin by Spirulina platensis using light-emitting diodes based two-stage cultivation. Appl. Biochem. Biotechnol. 178, 382–395. doi:10.1007/s12010-015-1879-5
Ma, Z., Ahmed, F., Yuan, B., and Zhang, W. (2019). 'Fresh living Arthrospira as dietary supplements: Current status and challenges. Trends Food Sci. Technol. 88, 439–444. doi:10.1016/j.tifs.2019.04.010
Maltsev, Y., Maltseva, K., Kulikovskiy, M., and Maltseva, S. (2021). 'Influence of light conditions on microalgae growth and content of lipids, carotenoids, and fatty acid composition. Biology 10, 1060. doi:10.3390/biology10101060
Masojídek, J., Vonshak, A., and Torzillo, G. (2010). “'Chlorophyll fluorescence applications in microalgal mass cultures,” in Chlorophyll a fluorescence in aquatic sciences: Methods and applications (Berlin: Springer).
Milia, M., Corrias, F., Addis, P., Zitelli, G. C., Cicchi, B., Torzillo, G., et al. (2022). Influence of different light sources on the biochemical composition of Arthrospira spp. grown in model systems. Foods 11, 399. doi:10.3390/foods11030399
Miller, A. G., and Colman, B. (1980). Evidence for HCO3–transport by the blue-green alga (cyanobacterium) Coccochloris peniocystis'. Plant physiology. 65, 397–402.
Moore, L. R., Goericke, R., and Chisholm, S. W. (1995). Comparative physiology of Synechococcus and prochlorococcus: Influence of light and temperature on growth, pigments, fluorescence and absorptive properties. Mar. Ecol. Prog. Ser. 116, 259–275. doi:10.3354/meps116259
Muhetaer, G., Asaeda, T., Jayasanka, S. M., Baniya, M. B., Helayaye, D. L. A., Rashid, M. H., et al. (2020). Effects of light intensity and exposure period on the growth and stress responses of two cyanobacteria species: Pseudanabaena galeata and Microcystis aeruginosa. Water 12, 407. doi:10.3390/w12020407
Nowicka-Krawczyk, P., Muhlsteinova, R., and Hauer, T. (2019). Detailed characterization of the Arthrospira type species separating commercially grown taxa into the new genus Limnospira (Cyanobacteria). Sci. Rep. 9, 694. doi:10.1038/s41598-018-36831-0
Phélippé, M., Gonçalves, O., Thouand, G., Cogne, G., and Laroche, C. (2019). Characterization of the polysaccharides chemical diversity of the cyanobacteria Arthrospira platensis. Algal Res. 38, 101426. doi:10.1016/j.algal.2019.101426
Poughon, L., Laroche, C., Creuly, C., Dussap, C. G., Paille, C., Lasseur, C., et al. (2020). Limnospira indica PCC8005 growth in photobioreactor: Model and simulation of the ISS and ground experiments. Life Sci. Space Res. (Amst) 25, 53–65. doi:10.1016/j.lssr.2020.03.002
Powles, S. B. (1984). 'Photoinhibition of photosynthesis induced by visible light. Annu. Rev. plant physiology 35, 15–44. doi:10.1146/annurev.pp.35.060184.000311
Prasanna, R., Sood, A., Jaiswal, P., Nayak, S., Gupta, V., Chaudhary, V., et al. (2010). Rediscovering cyanobacteria as valuable sources of bioactive compounds (Review). Appl. Biochem. Microbiol. 46, 119–134. doi:10.1134/s0003683810020018
Rakhimberdieva, M. G., Boichenko, V. A., Karapetyan, N. V., and Stadnichuk, I. N. (2001). Interaction of phycobilisomes with photosystem II dimers and photosystem I monomers and trimers in the cyanobacterium Spirulina platensis. Biochemistry 40, 15780–15788. doi:10.1021/bi010009t
Ravelonandro, P. H., Ratianarivo, D. H., Joannis-Cassan, C., Isambert, A., and Raherimandimby, M. (2008). 'Influence of light quality and intensity in the cultivation of Spirulina platensis from Toliara (Madagascar) in a closed system. J. Chem. Technol. Biotechnol. 83, 842–848. doi:10.1002/jctb.1878
Raven, P. H., Evert, R. F., and Eichhorn, S. E. (2005). Photosynthesis, light, and life. Biol. plants 7, 119.
Sakamoto, T., and Bryant, D. A. (1997). Growth at low temperature causes nitrogen limitation in the cyanobacterium Synechococcus sp. PCC 7002. Archives Microbiol. 169, 10–19. doi:10.1007/s002030050535
Sakamoto, T., and Bryant, D. A. (1999). Nitrate transport and not photoinhibition limits growth of the freshwater cyanobacterium Synechococcus species PCC 6301 at low temperature. Plant physiol. 119, 785–794. doi:10.1104/pp.119.2.785
Scandalios, J. G. (2005). 'Oxidative stress: Molecular perception and transduction of signals triggering antioxidant gene defenses. Braz. J. Med. Biol. Res. 38, 995–1014. doi:10.1590/s0100-879x2005000700003
Schreiber, U., Endo, T., Mi, H., and Asada, K. (1995). 'Quenching analysis of chlorophyll fluorescence by the saturation pulse method: Particular aspects relating to the study of eukaryotic algae and cyanobacteria. Plant Cell. Physiology 36, 873–882. doi:10.1093/oxfordjournals.pcp.a078833
Schuurmans, R. M., van Alphen, P., Schuurmans, J. M., Matthijs, H. C. P., and Hellingwerf, K. J. (2015). 'Comparison of the photosynthetic yield of cyanobacteria and green algae: Different methods give different answers. PLoS One 10, e0139061. doi:10.1371/journal.pone.0139061
Segers, C., Mysara, M., Coolkens, A., Baatout, S., Leys, N., Lebeer, S., et al. (2022). 'Limnospira indica PCC 8005 or lacticaseibacillus rhamnosus GG dietary supplementation modulate the gut microbiome in mice. Appl. Microbiol. 2, 636–650. doi:10.3390/applmicrobiol2030049
Smith, K. S., and Ferry, J. G. (2000). Prokaryotic carbonic anhydrases. FEMS Microbiol. Rev. 24, 335–366. doi:10.1111/j.1574-6976.2000.tb00546.x
Vonshak, A., and Tomaselli, L. (2000). “'Arthrospira (spirulina): Systematics and ecophysioIogy,” in The ecology of cyanobacteria (Berlin: Springer).
Wu, Q., Liu, L., Miron, A., Klímová, B., Wan, D., and Kuča, K. (2016). 'The antioxidant, immunomodulatory, and anti-inflammatory activities of spirulina: An overview. Archives Toxicol. 90, 1817–1840. doi:10.1007/s00204-016-1744-5
Yadav, A., Maertens, L., Meese, T., Van Nieuwerburgh, F., Mysara, M., Leys, N., et al. (2021). Genetic responses of metabolically active Limnospira indica strain PCC 8005 exposed to γ-radiation during its lifecycle. Microorganisms 9, 1626. doi:10.3390/microorganisms9081626
Yadav, A., Monsieurs, P., Misztak, A., Waleron, K., Leys, N., Cuypers, A., et al. (2019). 'Helical and linear morphotypes of Arthrospira sp. PCC 8005 display genomic differences and respond differently to 60Co gamma irradiation. Eur. J. Phycol. 55, 129–146. doi:10.1080/09670262.2019.1675763
Zhang, Y-M., and Chen, F. (1999). 'A simple method for efficient separation and purification of c-phycocyanin and allophycocyanin from Spirulina platensis. Biotechnol. Tech. 13, 601–603. doi:10.1023/a:1008914405302
Keywords: space exploration, bioregenerative life support systems, microalgae, batch cultures, air revitalization, cyanobacteria, space microbiology
Citation: Fahrion J, Dussap CG and Leys N (2023) Assessment of batch culture conditions for cyanobacterial propagation for a bioreactor in space. Front. Astron. Space Sci. 10:1178332. doi: 10.3389/fspas.2023.1178332
Received: 02 March 2023; Accepted: 17 April 2023;
Published: 27 April 2023.
Edited by:
Cyprien Verseux, University of Bremen, GermanyReviewed by:
Alessandro Concas, University of Cagliari, ItalyGisela Detrell, University of Stuttgart, Germany
Copyright © 2023 Fahrion, Dussap and Leys. This is an open-access article distributed under the terms of the Creative Commons Attribution License (CC BY). The use, distribution or reproduction in other forums is permitted, provided the original author(s) and the copyright owner(s) are credited and that the original publication in this journal is cited, in accordance with accepted academic practice. No use, distribution or reproduction is permitted which does not comply with these terms.
*Correspondence: Natalie Leys, bmF0YWxpZS5sZXlzQHNja2Nlbi5iZQ==