 Xin Cao
 Jasper S. Halekas2
 Stein Haaland
 Suranga Ruhunusiri
 Karl-Heinz Glassmeier
- 1Laboratory for Atmospheric and Space Physics (LASP), University of Colorado, Boulder, CO, United States
- 2Department of Physics and Astronomy, University of Iowa, Iowa City, IA, United States
- 3Birkeland Centre for Space Science, University of Bergen, Bergen, Norway
- 4Institut für Geophysik und Extraterrestrische Physik, Technische Universität Braunschweig, Braunschweig, Germany
In order to quantitatively investigate the mechanism of how magnetospheric convection is driven in the region of magnetotail lobes on a global scale, we analyzed data from the ARTEMIS spacecraft in the deep tail and data from the Cluster spacecraft in the near and mid-tail regions. Our previous work revealed that, in the lobes near the Moon’s orbit, the convection can be estimated by using ARTEMIS measurements of lunar ions’ velocity. Based on that, in this paper, we applied machine learning models to these measurements to determine which upstream solar wind parameters significantly drive the lobe convection in magnetotail regions, to help us understand the mechanism that controls the dynamics of the tail lobes. The results demonstrate that the correlations between the predicted and measured convection velocities for the machine learning models (>0.75) are superior to those of the multiple linear regression model (∼0.23–0.43) in the testing dataset. The systematic analysis shows that the IMF and magnetospheric activity play an important role in influencing plasma convection in the global magnetotail lobes.
1 Introduction
Characterizing the plasma convection in Earth’s tail regions is important to help us understand global magnetospheric dynamics. Haaland et al. (2008) and Haaland et al. (2009) used Cluster data (Escoubet et al., 1997) to show that the plasma convection at ∼10 RE downtail has opposite lateral patterns in the southern and northern lobes. For instance, the convection shows a pattern such that the north-south convection moves towards the current sheet in the magnetotail. Ohma et al. (2019) revealed that the asymmetry of the convection flow could also be affected by magnetic reconnection in the tail, which relates to magnetospheric activity. Cao et al. (2020b) used the two Acceleration, Reconnection, Turbulence, and Electrodynamics of Moon’s Interaction with the Sun (ARTEMIS) lunar ion data (Angelopoulos, 2011) to show that the dawn-dusk component of plasma convection velocity near the Moon’s orbit (∼60 RE) has a high correlation with the corresponding component of the upstream Interplanetary Magnetic Field (IMF). The magnetosphere of the Earth responds to the solar wind flow and IMF, through the Dungey Cycle driven by dayside magnetic reconnection (Dungey, 1961). Based on previous studies, themagnetospheric plasma in both lobes tends to move toward the central plasma sheet; Kissinger et al. (2011) showed that variations in solar wind conditions can also control magnetospheric convection. The magnitude of the convection velocity is influenced by the upstream solar wind conditions, e.g., solar wind dynamic pressure, the IMF and its clock angle, and the magnetospheric activity, as measured using the Dst (disturbance storm time) index.
The Moon has a tenuous exosphere, which is mainly composed of neutrals sourced from the surface of the Moon via various processes, e.g., solar wind sputtering, and thermal and chemical release (Stern, 1999; Sarantos et al., 2012a; Cook et al., 2013; Vorburger, et al., 2014), and micrometeorite impact (Hartle and Killen, 2006; Halekas et al., 2011; Halekas et al., 2012; Horányi et al., 2015). Some of the neutral particles can be eventually transformed to same-mass heavy ions through photoionization, charge exchange, and electron impact ionization (McGrath et al., 1986; Sarantos et al., 2012b; Huebner and Mukherjee, 2015; Zhou et al., 2013). The motion of lunar ions in the magnetotail lobes reflects their interaction with the exosphere, the lunar surface, and the ambient environment of the tail lobes.
Compared to other regions such as the solar wind or the magnetosheath where the ambient plasma density is much higher than that of the lunar ions (Halekas et al., 2011), the lunar ion density in the terrestrial magnetotail lobes is comparable to or even larger than that of the ambient lobe plasma, and the background flow is commonly sub-Alfvénic (Halekas et al., 2018). Therefore, the magnetospheric tail lobes are a unique environment in which to study the dynamics of the lunar ions. In this scenario, Cao et al. (2020a) analyzed ARTEMIS measurements to find that lunar ions are predominantly accelerated by magnetic tension and pressure forces. As a consequence of this process, the lunar ions are eventually coupled to the ambient plasma convection by the mass loading effect. Accordingly, the plasma convection in the deep magnetotail lobes can be estimated by measurement of lunar ion motion. This technique allows ARTEMIS to estimate the convection velocity by utilizing the heavy lunar ions (which have higher energy per charge for a given convection speed), despite the fact that it cannot directly detect the convection of ambient low-mass ions, given the large positive spacecraft potential in the tenuous lobe environment (Cao et al., 2020b).
In contrast, the convection velocity in the near-Earth tail regions can be directly measured by the Electron Drift Instrument (EDI) on the Cluster spacecraft. The EDI emits electron beams and detects their return to the spacecraft after one or more gyrations. By continuously tracking the emitted beam, the electron gyro center drift and thus the convection can be monitored (Paschmann et al., 1997). The EDI measurement of convection velocity is not affected by the low density of ambient plasma (Haaland et al., 2008), and the measurement technique has been extensively validated in the magnetotail lobes (Noda et al., 2003; Haaland et al., 2008; Haaland et al., 2009).
Over the past few years, machine learning techniques have been widely used in space physics and planetary science (Camporeale et al., 2018). For instance, Kerner et al. (2019) used a machine learning algorithm to detect novel geologic features in multispectral images of the Martian surface. Wagstaff et al. (2019) used machine learning methods to study thermal anomalies, compositional anomalies, and plumes of icy matter from Europa’s subsurface ocean. Nguyen et al. (2019) used machine learning techniques to automatically detect the terrestrial bow shock and magnetopause from in situ data, and Lazzús et al. (2017) used machine learning algorithms to forecast the Dst index. Kronberg et al. (2020) used machine learning techniques to study solar wind control of energetic particles and X-rays. There are many other works to apply the machine learning technique to the space physics research, e.g., Aminalragia-Giamini et al. (2023), Olshevsky et al. (2021), and Raptis et al. (2020).
In this paper, we used lunar ion data from the ARTEMIS spacecraft to infer lobe plasma convection velocity near the Moon in the deep magnetotail lobes (∼60 RE), EDI measurements from Cluster to determine the convection velocity in the near-Earth magnetotail between ∼10–15 RE, and solar wind and Dst index data from NASA’s OMNI data set. We analyzed the relationship between magnetotail convection and upstream solar wind conditions and the geomagnetic index. Based on the outputs of two ensemble learning methods: Random Forest and Gradient Boosting Decision Tree (GBDT) (Ke et al., 2017), the results confirm that the lobe plasma convection in the tail regions is controlled by upstream solar wind and magnetospheric activity.
2 Magnetotail observations and model methods
The two spacecraft of the ARTEMIS mission, P1 and P2, have been orbiting the Moon since mid-2011. We used measurements from two of the onboard instruments: Electrostatic Analyzer (ESA) (McFadden et al., 2008) and Flux Gate Magnetometer (FGM) (Auster et al., 2008). The ESA measures the ion distribution for energies between a few eV and 25 keV and the electron distribution for energies between a few eV and up to 30 keV (McFadden et al., 2008). The FGM measures the vector magnetic field at a cadence of ∼4 s minimum. The four Cluster spacecraft fly in formation in a high inclination 4 × 20 RE polar orbit, with apogee in the magnetotail between August—November. From Cluster, we use EDI measurements of the convection in the tail lobes (Paschmann et al., 1997). Since the measurement regions of the two missions extend from near-Earth to the Moon’s orbit in the magnetotail, the coordinate system used in this study is Geocentric Solar Magnetospheric (GSM), in which the +XGSM axis is defined to be oriented towards the Sun from the center of the Earth, the +ZGSM axis towards the direction such that XZ plane contains the geomagnetic dipole axis, and the +YGSM axis completes the right-handed system. The data used in this study contains over 240,000 Cluster data points in the near-Earth tail regions and over a few thousand ARTEMIS data points in the deep tail lobe regions near the Moon’s orbit. The near-Earth measurement by the Cluster spacecraft was limited to be within −8 RE < YGSM < +8 RE and +8 RE < ZGSM < +16 RE for the northern lobe and be within −8 RE < YGSM < +8 RE and −16 RE < ZGSM < −8 RE for the southern lobe (Haaland et al., 2008). The processed data resolution for inputs and outputs during the training process in the models is smoothed in 1 min scale. The measurements made in the deep tail lobes typically reveal a dominant positive or negative Bx component, which indicates the northern or southern lobes, respectively. As discussed in Cao et al. (2020b), since the mass loading effect couples the lunar ions to the ambient plasma convection, the motion of lunar ions serves as an approximate tracer of the convection patterns in the tail lobes. More details about this method can be found in Cao et al. (2020a) and Cao et al. (2020b).
The machine learning techniques we used in this study include random forest and GBDT, which are ensemble learning models (Friedman et al., 2001). The basic principle of this category of the model is to integrate a group of weak learners into a strong learner in order to obtain a better performance, where the weak learner represents a single decision tree in the models. In contrast to a weak learner that performs at least better than random guessing, a strong learner is a model doing the prediction work as well as possible compared to the test dataset. Both random forest and GBDT use a data structure called decision tree as the substructure of their models. The random forest and GBDT models usually construct a number of decision trees. Each tree in the random forest model receives a sub-dataset as the training dataset, which is sampled randomly with the replacement from the whole training dataset. This resampling method is termed the Bootstrap method in statistics (Friedman et al., 2001). The key difference between the two models is that the GBDT model focuses more on the trees with larger errors during each iteration of the training process, as Figure 1 shows. During the training process, all trees are independent in the Random Forest model. In contrast, during each epoch of the training process, the GBDT model updates the weights of the next tree every time after training the previous tree, in order to emphasize the weights that caused larger errors. Both the random forest and GBDT models have a good ability to reduce the overfitting problem in machine learning and have been widely used in prediction and/or regression in scientific problems.
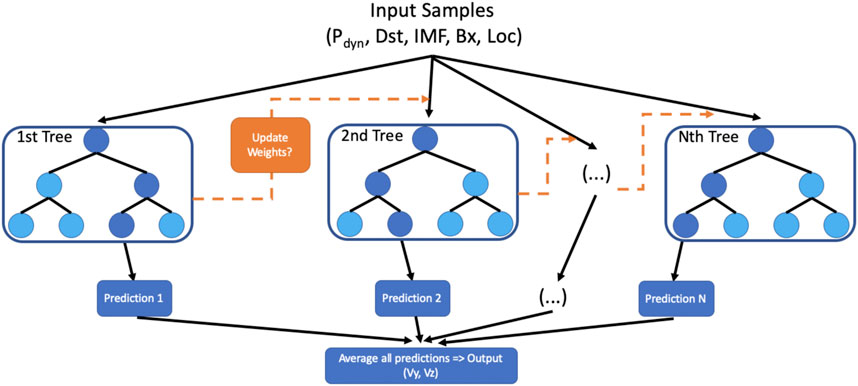
FIGURE 1. The illustration is shown for the architecture of the Random Forest and GBDT models with the input parameters and outputs. The difference between Random Forest and GBDT is whether the weights are updated between each tree, as the orange dashed arrows indicate. The model training is iteratively processed until the loss function is minimized.
The inputs of the models in this study can be obtained from the OMNI dataset, including the solar wind IMF vector, the solar wind dynamic pressure, the locally measured Bx, the Dst index, and the spacecraft locations in the magnetosphere. The Dst index describes the magnitude of the ring current, which can be used as an upstream monitor indirectly. The outputs/targets of the models are the lateral components of convectional velocity: Vy and Vz. The combined training data are randomly extracted from 80% of the dataset of each mission, and the other 20% of the dataset is used as the test dataset. During the training process, we also used 10-fold cross-validation (Friedman et al., 2001) to help further reduce the potential overfitting, and the optimal hyper-parameters (e.g., the number of trees, the maximum depth of trees, and the maximum number of features to split a leaf node) in the models are optimized by using the grid search strategy. The loss function in the models is Mean Squared Error (MSE). The machine learning training process is under the Python environment using the scikit-learn package. Because of the parallel computing ability, the random forest model was trained by using 8 threads simultaneously.
3 Results of random forest and GBDT models
The lateral component of magnetospheric convection in the lobes at different downtail distances has been shown to correlate with the upstream solar wind IMF direction (Haaland et al., 2008; 2009; Cao et al., 2020b). The observed magnetospheric asymmetries such as the dusk-dawn shift of the polar cap boundary and auroral zone flow speed asymmetry can affect the open field lines in the lobes, which may be controlled by the upstream dawn-dusk IMF (Cowley, 1981). Tenfjord et al. (2015), Tenfjord et al. (2018) used an MHD model to conclude that the driving mechanism might be due to the upstream lateral magnetic flux transferring to the nightside of the Earth’s magnetosphere, which then affects the plasma convection in the magnetotail lobes. Convection in the ZGSM direction is strongly influenced by dayside solar wind-magnetosphere coupling (Dungey, 1961). This dayside coupling is also reflected in magnetospheric disturbance indices like, e.g., the Dst index, so a correlation between lobe convection and the Dst index is often observed (Haaland et al., 2009), and a larger Dst implies lower activity and thus lower convection in the tail region.
Figure 2 illustrates the uncertainties of Vy and Vz convection values predicted by the random forest and GBDT models, trained using the data set we described in the second section. The left four panels (2a) show the predicted Vy values of the random forest and GBDT models respectively for the combined data set from the two missions, and for the ARTEMIS results alone. The blue and orange colors represent the 50% and 75% confidence intervals (CI), with the uncertainties having corresponding probabilities less than the upper boundary of the shaded regions (Ruhunusiri et al., 2018). The uncertainty indicates the statistics of the difference between the prediction and the measurement. In general, the uncertainty of positive Vy is smaller than that of negative Vy. The uncertainty of Vy within 50% CI is relatively small. However, the uncertainty of Vy within 75% CI reveals a somewhat larger asymmetry between positive and negative values, particularly when the velocity magnitude is larger than ∼15 km/s. This is probably because the proportion of the velocities with a large magnitude is much smaller than that of the velocities with a smaller magnitude, which represent the majority of the convection velocity values in the magnetotail lobes (Haaland et al., 2008). The relatively small proportion of larger velocity values in the data set could result in a larger bias, increasing the uncertainty of the corresponding range.
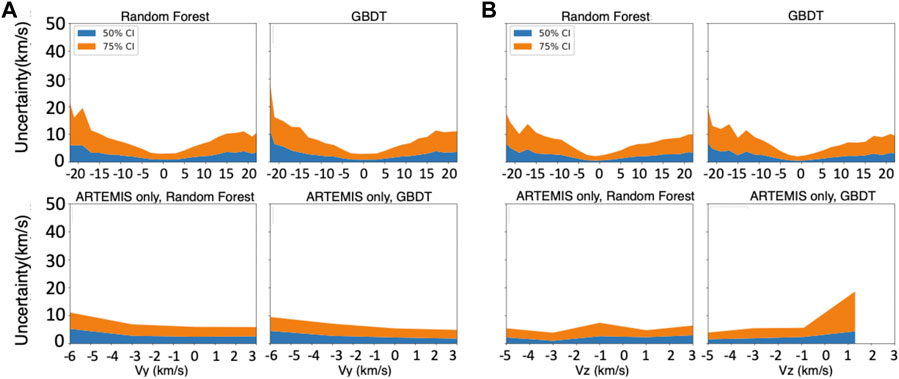
FIGURE 2. The 50% and 75% confidence intervals of the uncertainties are shown (see details in the text) for the random forest and GBDT models respectively for Vy and Vz components of magnetospheric convection and for the near-Earth and deep magnetotail lobes. The left four panels (A) show the Vy’s and the right four panels (B) show the Vz’s.
The predictions of Vy by the random forest model are better than those from the GBDT model. For the prediction of the models for the combined data set, the overall relative deviation of 50% CI’s uncertainty is around 0.25, and that of 75% CI’s uncertainty for the only ARTEMIS data could be up to 0.7–1.0. The result showed that the predictions of these two models are much better than that of a traditional multiple linear regression model (see details in the next section). The right four panels (2b) show predicted Vz values for the random forest and GBDT models. As the figure shows, compared to the Vy prediction, the overall prediction of Vz by the GBDT model for the combined data set is slightly better than that of the random forest model. However, the GBDT model’s prediction for the ARTEMIS measurement appears a larger uncertainty for the positive Vz. Besides, the predictions of Vy and Vz from both models for the combined data set are better than those for the ARTEMIS data alone, likely due to higher uncertainty in the measurement of magnetotail convection using the ARTEMIS lunar ion data.
To identify which input parameters are more influential in controlling the plasma convection in the magnetotail, we show the feature importance of each input parameter for the convection velocity prediction, as depicted in Figure 3. In this study, the feature importance is defined to be the score decrease of the model when randomly shuffling the values of each single feature, which indicates how much the model is dependent on that feature. We calculated 10 random shuffles for each parameter and calculated their average, in order to reduce the potential bias resulting from a single random shuffle. The results of random forest and GBDT models both reveal that the upstream IMF By has the highest feature importance for the Vy component, which indicates that it plays the biggest role of the chosen input parameters in driving the lobe convection in the magnetotail, consistent with the previous observations Ohma et al. (2019), Case et al. (2018), and Case et al. (2020). Next, the feature importance of the local magnetic field and the Dst index are also relatively significant, which is probably linked to the fact that physical processes in the near-Earth magnetosphere, as indicated by the geomagnetic activity, have a pronounced effect on physical processes in the downstream region, due to the global disturbance of the magnetic flux transport through the magnetospheric Dungey cycle. In contrast, the geometric locations and local magnetic field in the magnetotail lobes hold the highest feature importance for the Vz component of the convection. The Vz dynamics may be more strongly affected by the different magnetic field structures between the near-Earth and far-tail regions. The locally measured Bx also plays an important role in controlling the Vz component, since its sign differs between the two lobes, with the northward-southward convection generally towards the central current sheet (Haaland et al., 2008; Cao et al., 2020b). The feature importance of the Dst index and IMFz could also be comparably important since the geomagnetic activity and the IMFz can influence the convection velocity Vz’s pattern (Haaland et al., 2008; Haaland et al., 2009; Ohma et al., 2019).
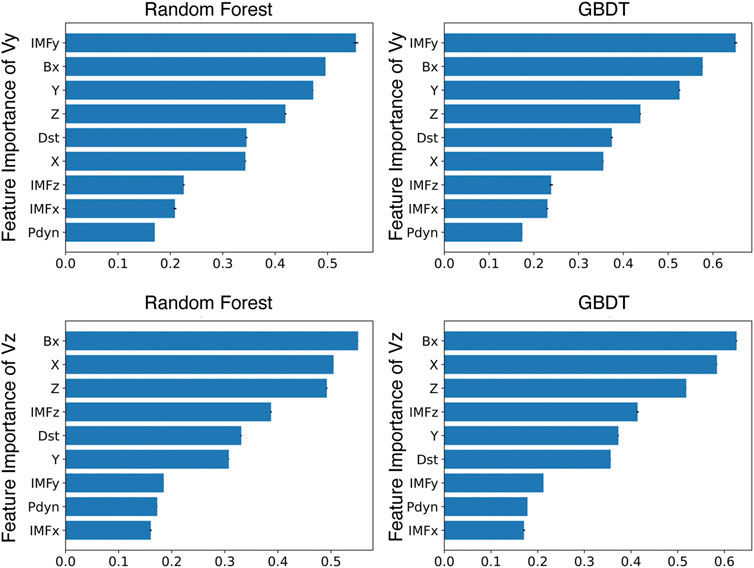
FIGURE 3. The feature importance of the velocity prediction for the random forest and GBDT models. The upper panels are for the Vy component of magnetotail convection and the lower panels are for Vz, for the random forest and GBDT models. The error bar in black represents the standard deviation of each parameter’s feature importance. The measurement locations of the spacecraft are represented by the three-dimensional coordinates X, Y, and Z. The IMFx, IMFy, and IMFz represent the different components of the interplanetary magnetic field. The Dst index and Bx represent one of the geomagnetic indices and the X component of the local magnetic field in the tail lobes. The Pdyn represents the dynamic pressure of the upstream solar wind.
It is noteworthy that the interpretability of machine learning models is still insufficient compared to physics-based models, even if many efforts have been made to improve it during the past decade. Although we discussed the feature importance above, we should note that it is still empirically based because the machine learning models we applied are not physics driven. However, the feature importance provides a useful view to help us understand which input parameters are potentially essential to impact the lobe convection, especially if we use it to decide the input of a physics-based model. The combination with physics-based models is beyond the scope of this study and would be further investigated in future work.
4 Correlation analysis
As described in the previous sections, the magnetospheric convection in the tail lobes is largely driven by the upstream solar wind conditions and magnetospheric activity. In this section, we split the two lobes and statistically investigate the correlation between solar wind conditions and magnetospheric activity, and the plasma convection of the lobes at different down-tail distances. The correlation calculation is made by restricting the data between the 10% and 90% percentiles, in order to reduce biases from outliers.
We calculated the correlation coefficients between each of the upstream parameters, the geometric locations of the measurement made in the magnetosphere, and the lateral velocity components of the magnetospheric convection in the northern lobe measured by Cluster and ARTEMIS. The correlation between the convection Vy and the IMF By has the largest value (∼0.5) in the northern lobe. Correspondingly, they have the largest anti-correlation in the southern lobe. This is consistent with previous observations that showed that the dawn-dusk convection in the tail lobes is strongly controlled by the IMF By (Haaland et al., 2008; Case et al., 2018; Case et al., 2020; Ohma et al., 2019; Cao et al., 2020b). The correlations between the northern and southern lobes (not shown here) are similar but not exactly symmetric, which is probably due to two reasons: 1) the magnetic tilt of the Earth results in the structural asymmetry of the two lobes relative to the incident solar wind; 2) the measurement locations in the magnetosphere are not equally distributed among different lobes. The IMF By that affects the geometry of the upstream interaction with the solar wind can influence the asymmetry of the convection in the magnetosphere (Tenfjord et al., 2015).
Compared to the Vy component, the convectional Vz has a relatively significant correlation coefficient with the geometric location (∼0.3) compared to others, which is consistent with our observation of the models. As discussed in the previous section, this might be due to the influence of different magnetic field structures among different tail regions. The IMF Bz and the Dst index have comparable correlations with Vz in the two lobes, which is probably linked to the upstream reconnection-related interaction driving the magnetospheric convection, e.g., Dungey Cycle. In addition, the lateral convection of the lobes is not significantly correlated with the upstream solar wind dynamic pressure, which is consistent with previous studies (Haaland et al., 2008; Haaland et al., 2009). On the global scale, the north-south component of plasma convection in the lobes (Vz) has different driving characteristics from that of Vy. For instance, the response of Vy and Vz to the Dst index appears different between the two tail lobes. The correlation of the geometric locations of the magnetosphere with Vz has also a relatively higher value (>0.3) compared to that with Vy (<0.08), which might be because the northward-southward convection is affected by the variation of magnetic field structure from the near-Earth to the deep tail regions.
Finally, we calculated the correction between the predicted and test velocities for the two machine learning models and the multiple linear regression model. The corresponding correlation for predicted and test Vy components of random forest is 0.76, and that of GBDT is 0.75, compared to a much smaller value of 0.23 from multiple linear regression. The corresponding correlation for predicted and test Vz components of random forest is 0.78, and that of GBDT is 0.77, compared to a value of 0.43 from multiple linear regression. The comparison of the correlation coefficients between these different models confirms that the machine learning models significantly outperform the multiple linear regression.
5 Summary
In conclusion, we investigated the potential driving mechanism of the plasma convection in the magnetospheric lobes with respect to upstream solar wind conditions and geomagnetic activity, by utilizing two types of machine learning models: random forest and GBDT. We used data from the ARTEMIS and Cluster missions, and the OMNI dataset. This study indicated that the machine learning technique could be a useful tool to predict the response of the magnetospheric convection in the tail lobes to the upstream conditions, and revealed the feature importance of each potential driving parameter, with results that appear consistent with previous studies of the convection of the tail lobes (Haaland et al., 2008; Haaland et al., 2009; Ohma et al., 2019; Cao et al., 2020b). The ARTEMIS-Cluster-OMNI data-driven models demonstrate that the convection throughout the near-Earth and far-tail regions is largely controlled by the upstream solar wind parameters and as reflected also in magnetospheric activity indices. The IMF By values have significant correlations with the corresponding component of the convection in the tail lobes, as predicted. The geometric locations in the magnetosphere affect the Vz component more significantly than the Vy component. In addition, the Vz value in the tail lobes has a comparable response to the IMF Bz and the Dst index, which may indicate that the upstream solar wind driving mechanism consistently influences the geomagnetic environment in the near-Earth magnetosphere and the downstream tail regions. This is probably associated with the global plasma dynamics, e.g., Dungey Cycle. How the dynamics of other magnetospheric regions (e.g., plasma sheet or current sheet) respond to the upstream solar wind should be addressed in future studies, as it may help build a more complete picture of the solar wind–terrestrial magnetosphere coupling processes. The method of using machine learning techniques to study the magnetospheric convection could potentially be applied to the global magnetospheres of other planets such as those of Mercury, Saturn, and Jupiter.
Data availability statement
Publicly available datasets were analyzed in this study. This data can be found here: All ARTEMIS data are publicly available at NASA’s CDAWeb (https://cdaweb.sci.gsfc.nasa.gov) and the ARTEMIS site (http://artemis.ssl.berkeley.edu). The related information on the Cluster mission can be found at https://sci.esa.int/web/cluster/-/52770-csds. The OMNI data can be obtained from the GSFC/SPDF OMNIWeb interface at https://omniweb.gsfc.nasa.gov.
Author contributions
XC lead the project of this paper and to write this paper. All authors contributed to the article and approved the submitted version.
Funding
The Solar System Exploration Research Virtual Institute, Lunar Data Analysis Program grant 80NSSC20K0311, and NASA contract NAS5-02099. K-HG is financially supported by the German Ministerium für Wirtschaft und Energie and the Deutsches Zentrum für Luft-und Raumfahrt under contract 50 OC 1403.
Acknowledgments
We acknowledge support from the Solar System Exploration Research Virtual Institute, Lunar Data Analysis Program grant 80NSSC20K0311, and NASA contract NAS5-02099. All ARTEMIS data are publicly available at NASA’s CDAWeb (https://cdaweb.sci.gsfc.nasa.gov) and the ARTEMIS site (http://artemis.ssl.berkeley.edu). The related information on the Cluster mission can be found at https://sci.esa.int/web/cluster/-/52770-csds. We acknowledge James P McFadden for Electrostatic Analyzer data. We acknowledge the OMNI data which were obtained from the GSFC/SPDF OMNIWeb interface at https://omniweb.gsfc.nasa.gov.
Conflict of interest
The authors declare that the research was conducted in the absence of any commercial or financial relationships that could be construed as a potential conflict of interest.
Publisher’s note
All claims expressed in this article are solely those of the authors and do not necessarily represent those of their affiliated organizations, or those of the publisher, the editors and the reviewers. Any product that may be evaluated in this article, or claim that may be made by its manufacturer, is not guaranteed or endorsed by the publisher.
References
Aminalragia-Giamini, S., Katsavrias, C., Papadimitriou, C., Daglis, I. A., Nasi, A., Brunet, A., et al. (2023). The EMERALD model for the estimation of the radial diffusion coefficients in the outer belt. Space weather. 21 (1), 2022SW003283. doi:10.1029/2022sw003283
Angelopoulos, V. (2011). The ARTEMIS mission. Space Sci. Rev. 1 (165), 3–25. doi:10.1007/s11214-010-9687-2
Auster, H. U., Glassmeier, K. H., Magnes, W., Aydogar, O., Baumjohann, W., Constantinescu, D., et al. (2008). The THEMIS fluxgate magnetometer. Space Sci. Rev. 141 (1-4), 235–264. doi:10.1007/s11214-008-9365-9
Camporeale, E., Wing, S., and Johnson, J. (2018). Machine learning techniques for space weather. Candice Janco.
Cao, X., Halekas, J., Poppe, A., Chu, F., and Glassmeier, K. H. (2020a). The acceleration of lunar ions by magnetic forces in the terrestrial magnetotail lobes. J. Geophys. Res. Space Phys. 125 (6), 2020JA027829. doi:10.1029/2020ja027829
Cao, X., Halekas, J. S., Chu, F., Kistler, M., Poppe, A. R., and Glassmeier, K. H. (2020b). Plasma convection in the terrestrial magnetotail lobes measured near the Moon's orbit. Geophys. Res. Lett. 47 (20), 2020GL090217. doi:10.1029/2020gl090217
Case, N. A., Grocott, A., Fear, R. C., Haaland, S., and Lane, J. H. (2020). Convection in the magnetosphere-ionosphere system: A multimission survey of its response to IMF B y reversals. J. Geophys. Res. Space Phys. 125 (10), 2019JA027541.
Case, N. A., Grocott, A., Haaland, S., Martin, C. J., and Nagai, T. (2018). Response of earth's neutral sheet to reversals in the IMFB<i>y</i>Component. J. Geophys. Res. Space Phys. 123 (10), 8206–8218. doi:10.1029/2018ja025712
Cook, J. C., Stern, S. A., Feldman, P. D., Gladstone, G. R., Retherford, K. D., and Tsang, C. C. (2013). New upper limits on numerous atmospheric species in the native lunar atmosphere. Icarus 225 (1), 681–687. doi:10.1016/j.icarus.2013.04.010
Cowley, S. W. H. (1981). Magnetospheric asymmetries associated with the Y-component of the IMF. Planet. Space Sci. 29 (1), 79–96. doi:10.1016/0032-0633(81)90141-0
Dungey, J. W. (1961). Interplanetary magnetic field and the auroral zones. Phys. Rev. Lett. 6 (2), 47–48. doi:10.1103/physrevlett.6.47
Escoubet, C. P., Schmidt, R., and Goldstein, M. L. (1997). Cluster-science and mission overview. Clust. Phoenix Missions 1997, 11–32. doi:10.1007/978-94-011-5666-0_1
Friedman, J., Hastie, T., and Tibshirani, R. (2001). The elements of statistical learning. New York: Springer series in statistics.
Haaland, S., Lybekk, B., Svenes, K., Pedersen, A., Förster, M., Vaith, H., et al. (2009). Plasma transport in the magnetotail lobes. Ann. Geophys. Atmos. hydrospheres space Sci. 27 (9), 3577–3590. doi:10.5194/angeo-27-3577-2009
Haaland, S., Paschmann, G., Förster, M., Quinn, J., Torbert, R., Vaith, H., et al. (2008). Plasma convection in the magnetotail lobes: statistical results from cluster EDI measurements. Ann. Geophys., 26, 2371–2382. doi:10.5194/angeo-26-2371-2008
Halekas, J. S., Delory, G. T., Farrell, W. M., Angelopoulos, V., McFadden, J. P., Bonnell, J. W., et al. (2011). First remote measurements of lunar surface charging from ARTEMIS: evidence for nonmonotonic sheath potentials above the dayside surface. J. Geophys. Res. Space Phys. 116 (7), 16542. doi:10.1029/2011ja016542
Halekas, J. S., Poppe, A. R., Delory, G. T., Sarantos, M., Farrell, W. M., Angelopoulos, V., et al. (2012). Lunar pickup ions observed by ARTEMIS: spatial and temporal distribution and constraints on species and source locations. J. Geophys. Res. Planets 117 (6), 4107. doi:10.1029/2012je004107
Halekas, J. S., Poppe, A. R., Harada, Y., Bonnell, J. W., Ergun, R. E., and McFadden, J. P. (2018). A tenuous lunar ionosphere in the geomagnetic tail. Geophys. Res. Lett. 45 (18), 9450–9459. doi:10.1029/2018gl079936
Hartle, R. E., and Killen, R. (2006). Measuring pickup ions to characterize the surfaces and exospheres of planetary bodies: applications to the Moon. Geophys. Res. Lett. 33 (5), 05201. doi:10.1029/2005gl024520
Horányi, M., Szalay, J. R., Kempf, S., Schmidt, J., Grün, E., Srama, R., et al. (2015). A permanent, asymmetric dust cloud around the Moon. Nature 522 (7556), 324–326. doi:10.1038/nature14479
Huebner, W. F., and Mukherjee, J. (2015). Photoionization and photodissociation rates in solar and blackbody radiation fields. Planet. Space Sci. 106, 11–45. doi:10.1016/j.pss.2014.11.022
Ke, G., Meng, Q., Finley, T., Wang, T., Chen, W., Ma, W., et al. (2017). Lightgbm: A highly efficient gradient boosting decision tree. Adv. Neural Inf. Process. Syst., 30.
Kerner, H. R., Wellington, D. F., Wagstaff, K. L., Bell, J. F., Kwan, C., and Amor, H. B. (2019). “Novelty detection for multispectral images with application to planetary exploration,” in Proceedings of the aaai conference on artificial intelligence Vol. 33 (01), 9484–9491.
Kissinger, J., McPherron, R. L., Hsu, T. S., and Angelopoulos, V. (2011). Steady magnetospheric convection and stream interfaces: relationship over a solar cycle. J. Geophys. Res. Space Phys. 116 (5). doi:10.1029/2010ja015763
Kronberg, E. A., Gastaldello, F., Haaland, S., Smirnov, A., Berrendorf, M., Ghizzardi, S., et al. (2020). Prediction and understanding of soft-proton contamination in xmm-Newton: A machine learning approach. Astrophysical J. 903 (2), 89. doi:10.3847/1538-4357/abbb8f
Lazzús, J. A., Vega, P., Rojas, P., and Salfate, I. (2017). Forecasting the Dst index using a swarm-optimized neural network. Space Weather 15 (8), 1068–1089.
McFadden, J. P., Carlson, C. W., Larson, D., Ludlam, M., Abiad, R., Elliott, B., et al. (2008). The THEMIS ESA plasma instrument and in-flight calibration. Space Sci. Rev. 141 (1-4), 277–302. doi:10.1007/s11214-008-9440-2
McGrath, M. A., Johnson, R. E., and Lanzerotti, L. J. (1986). Sputtering of sodium on the planet Mercury. Nature 323 (6090), 694–696. doi:10.1038/323694a0
Nguyen, G., Aunai, N., Michotte de Welle, B., Jeandet, A., and Fontaine, D. (2019). Automatic detection of the Earth Bow Shock and Magnetopause from in-situ data with machine learning.
Noda, H., Baumjohann, W., Nakamura, R., Torkar, K., Paschmann, G., Vaith, H., et al. (2003). Tail lobe convection observed by Cluster/EDI. J. Geophys. Res. Space Phys. 108 (A7).
Ohma, A., Østgaard, N., Reistad, J. P., Tenfjord, P., Laundal, K. M., Moretto Jørgensen, T., et al. (2019). Observations of asymmetric lobe convection for weak and strong tail activity. J. Geophys. Res. Space Phys. 124 (12), 9999–10017. doi:10.1029/2019ja026773
Olshevsky, V., Khotyaintsev, Y. V., Lalti, A., Divin, A., Delzanno, G. L., Anderzén, S., et al. (2021). Automated classification of plasma regions using 3D particle energy distributions. J. Geophys. Res. Space Phys. 126 (10), 2021JA029620. doi:10.1029/2021ja029620
Paschmann, G., Melzner, F., Frenzel, R., Vaith, H., Parigger, P., Pagel, U., et al. (1997). The electron drift instrument for Cluster. Space Sci. Rev. 79 (1-2), 233–269. doi:10.1023/a:1004917512774
Raptis, S., Aminalragia-Giamini, S., Karlsson, T., and Lindberg, M. (2020). Classification of magnetosheath jets using neural networks and High Resolution OMNI (HRO) Data. Front. Astronomy Space Sci. 7, 24. doi:10.3389/fspas.2020.00024
Ruhunusiri, S., Halekas, J. S., Espley, J. R., Eparvier, F., Brain, D., Mazelle, C., et al. (2018). An artificial neural network for inferring solar wind proxies at Mars. Geophys. Res. Lett. 45 (20), 10–855. doi:10.1029/2018gl079282
Sarantos, M., Hartle, R. E., Killen, R. M., Saito, Y., Slavin, J. A., and Glocer, A. (2012b). Flux estimates of ions from the lunar exosphere. Geophys. Res. Lett. 39, 13. doi:10.1029/2012gl052001
Sarantos, M., Killen, R. M., Glenar, D. A., Benna, M., and Stubbs, T. J. (2012a). Metallic species, oxygen and silicon in the lunar exosphere: upper limits and prospects for LADEE measurements. J. Geophys. Res. Space Phys. 117, 3. doi:10.1029/2011ja017044
Stern, S. A. (1999). The lunar atmosphere: history, status, current problems, and context. Rev. Geophys. 37 (4), 453–491. doi:10.1029/1999rg900005
Tenfjord, P., Østgaard, N., Haaland, S., Snekvik, K., Laundal, K. M., Reistad, J. P., et al. (2018). How the IMF By induces a local By component during northward IMF Bz and characteristic timescales. J. Geophys. Res. Space Phys. 123 (5), 3333–3348.
Tenfjord, P., Østgaard, N., Snekvik, K., Laundal, K. M., Reistad, J. P., Haaland, S., et al. (2015). How the IMF B induces a B component in the closed magnetosphere and how it leads to asymmetric currents and convection patterns in the two hemispheres. J. Geophys. Res. Space Phys. 120 (11), 9368–9384. doi:10.1002/2015ja021579
Vorburger, A., Wurz, P., Barabash, S., Wieser, M., Futaana, Y., Holmström, M., et al. (2014). First direct observation of sputtered lunar oxygen. J. Geophys. Res. Space Phys. 119 (2), 709–722. doi:10.1002/2013ja019207
Wagstaff, K. L., Doran, G., Davies, A., Anwar, S., Chakraborty, S., Cameron, M., et al. (2019). “Enabling onboard detection of events of scientific interest for the Europa clipper spacecraft,” in Proceedings of the 25th acm sigkdd international conference on knowledge discovery & data mining, 2191–2201.
Keywords: convection, magnetosphere, solar wind, tail lobes, ARTEMIS, machine learning
Citation: Cao X, Halekas JS, Haaland S, Ruhunusiri S and Glassmeier K-H (2023) Using machine learning to characterize solar wind driving of convection in the terrestrial magnetotail lobes. Front. Astron. Space Sci. 10:1180410. doi: 10.3389/fspas.2023.1180410
Received: 06 March 2023; Accepted: 02 June 2023;
Published: 14 August 2023.
Edited by:
Fadil Inceoglu, National Atmospheric and Oceanographic Administration (NOAA), United StatesReviewed by:
Sai Gowtam Valluri, University of Alaska Fairbanks, United StatesSavvas Raptis, Johns Hopkins University, United States
Copyright © 2023 Cao, Halekas, Haaland, Ruhunusiri and Glassmeier. This is an open-access article distributed under the terms of the Creative Commons Attribution License (CC BY). The use, distribution or reproduction in other forums is permitted, provided the original author(s) and the copyright owner(s) are credited and that the original publication in this journal is cited, in accordance with accepted academic practice. No use, distribution or reproduction is permitted which does not comply with these terms.
*Correspondence: Xin Cao, eGluLmNhb0BsYXNwLmNvbG9yYWRvLmVkdQ==