 Fei He
 Xiao-Xin Zhang3*
 Zhaojin Rong
- 1Key Laboratory of Earth and Planetary Physics, Institute of Geology and Geophysics, Chinese Academy of Sciences, Beijing, China
- 2College of Earth and Planetary Sciences, University of Chinese Academy of Sciences, Beijing, China
- 3Key Laboratory of Space Weather, National Center for Space Weather, China Meteorological Administration, Beijing, China
In this study, we explore the evolution of long-duration transpolar arcs observed during an exceptionally quiet period by the Fengyun-3D and Defense Meteorological Satellite Program satellites on 17 January 2019. Leveraging the extensive field of view of WAI, we captured the complete structure and evolution of the TPA over a very quiet period exceeding 7 h, with AE<30 nT. The TPA initially manifested at the poleward boundary of the auroral oval in the dawn sector, gradually migrating towards the dusk as the y-component of the interplanetary magnetic field (IMF BY) transitioned from negative to positive. Throughout this phase, the TPA underwent a distortion, transforming from a straight line to an “l-shape”. Following a reversal in interplanetary magnetic field BY to negative, the TPA retraced its path towards dawn and ultimately dissipated when the IMF turned southward. Of particular interest is the observation that when the TPA approached the noon-midnight line, small-scale spiral structures became apparent within the TPA. This suggests the presence of intricate small-scale magnetic field topologies or plasma instabilities/shears in the source region. These observations highlight the likelihood of complex field and particle dynamics in the high-latitude reconnection region and the twisted tail plasma sheet.
1 Introduction
The transpolar arcs (TPAs) are extensive auroral features that stretch across the entire polar cap region, extending poleward from the primary auroral oval (Frank et al., 1986; Milan et al., 2005; Kullen, 2012; Zhang et al., 2020; Hosokawa et al., 2020). Typically observed during periods of northward interplanetary magnetic field (IMF) and under geomagnetically quiet conditions (Zhu et al., 1997; Milan et al., 2005; Hosokawa et al., 2020), TPAs exhibit distinct characteristics. A TPA typically initiates at the dawn or duskside poleward boundary of the primary auroral oval, subsequently migrating poleward towards dusk or dawn, depending on the polarity of the y-component of the IMF (BY) (e.g., Kullen et al., 2002; Cumnock, 2005; Fear and Milan, 2012). TPAs can manifest as single arcs resembling a theta aurora (Frank et al., 1986) or as multiple arcs spanning the entire polar cap region (Xing et al., 2018; Zhang et al., 2020). These phenomena may occur in a single hemisphere or both hemispheres. Recent statistical analyses have revealed that less than half of multiple arc events occur simultaneously in both hemispheres, with clear differences in IMF conditions between conjugated and non-conjugated events (Thor et al., 2023). This discrepancy may be attributed to an IMF BX-induced interhemispheric asymmetry in magnetospheric field line topology (Thor et al., 2023). It is worth noting that some studies have shown no significant difference in IMF BX values between conjugate and non-conjugate events (Kullen et al., 2023).
The mechanisms underlying the formation of TPAs have been extensively explored in past decades (Zhu et al., 1997; Kullen, 2012; Hosokawa et al., 2020). Observations linking TPAs to IMF control have led to models associating TPAs with the topological structure of the tail plasma sheet. Simulations have demonstrated that the twisting of the tail plasma sheet intensifies during northward IMF, and changes in the sign of IMF BY result in the movement of TPAs dawnward or duskward (Kullen, 2000; Tsyganenko and Fairfield, 2004). A specific type of TPA extending from the nightside auroral oval to the dayside has been linked to tail connections during northward IMF (Milan et al., 2005). For multiple TPAs, Zhang et al. (2016) proposed that the Kelvin-Helmholtz instability and/or the interchange instability could be potential mechanisms. More recently, Zhang et al. (2020) presented evidence from both observations and simulations indicating that multiple TPAs can be generated by precipitating energetic magnetospheric electrons within field-aligned current (FAC) sheets. These FAC sheets arise from multiple flow shear sheets in both the magnetospheric boundary and the plasma sheet.
While the understanding of transpolar aurora arcs (TPAs) has made significant progress, several aspects remain unclear, such as the generation mechanism, detailed classification, and the dawn-dusk motion and deformation of TPAs (Hosokawa et al., 2020). The multiscale evolution of TPAs, encompassing the global shape and small-scale structures within the arc, still requires further investigation. Achieving this requires aurora imagers with a large field of view and high spatial resolution. The Wide-field Auroral Imager (WAI) (Zhang et al., 2019) aboard the Chinese Fengyun-3D (FY-3D) satellite in low-Earth orbit (830 km altitude) possesses the capability to capture high-resolution global images of TPAs. In this study, we present the evolution of a Sun-aligned TPA during a very quiet period characterized by northward IMF. Combining these observations with available conjugated in-situ measurements, we delve into the possible generation and evolution mechanisms of the TPA in the discussion and conclusion section.
2 Solar wind and geomagnetic conditions
Figure 1 illustrates the solar wind and geomagnetic conditions on 17 January 2019. The solar wind and IMF parameters from the OMNIweb (depicted by black curves in Figures 1A–E) indicate that the geocentric distance of the subpolar bow shock, calculated using the model by Chao et al. (2002), remained less than 15 RE throughout the day. Given the significance of IMF in the generation and evolution of TPAs, we utilized magnetic field measurements from the Magnetospheric Multiscale (MMS) mission magnetometers (Russell et al., 2016) to better characterize the IMF upstream of the bow shock. On 17 January 2019, the geocentric distances of MMS were consistently larger than 17.5 RE and situated near the Sun-Earth line throughout the day, well beyond the bow shock. This positioning enables MMS to precisely monitor IMF conditions encountering the bow shock.
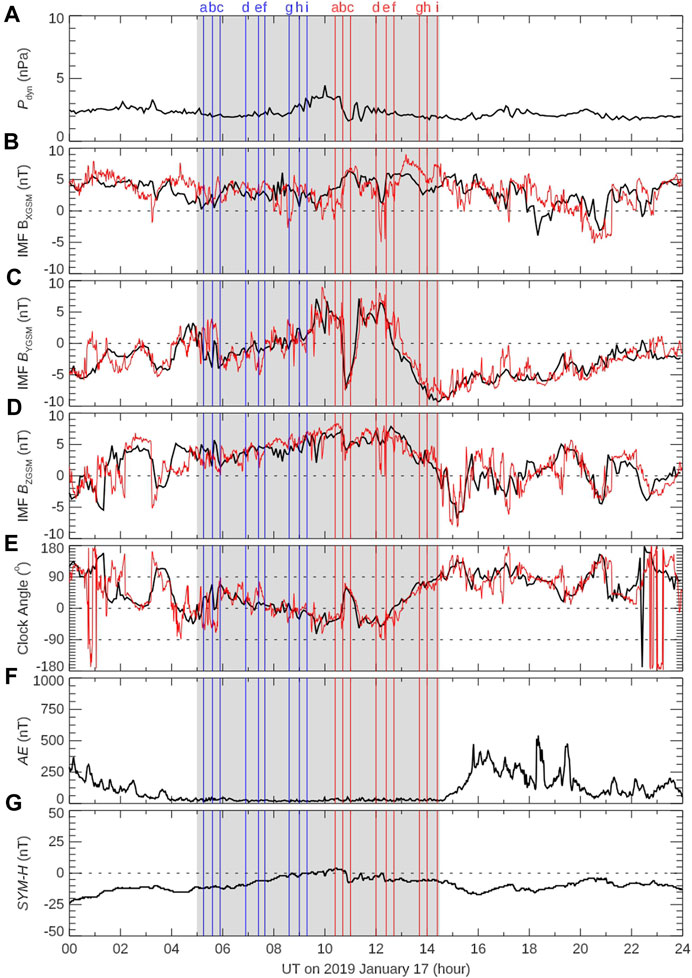
FIGURE 1. Solar wind and geomagnetic conditions on 17 January 2019. (A) Solar wind dynamic pressure, in nPa. (B) The x components of IMF in GSM, BXGSM. (C) The y components of IMF in GSM, BYGSM. (D) The z components of IMF in GSM, BZGSM. (E) Clock angles of the IMF. The black curves in (B–E) are for 1-min averaged OMNI data with red for 1-min averaged MMS-1 data. (F) AE indices. (G) SYM-H indices. The gray region indicates the period with TPA observations. The six blue vertical lines six red vertical lines with labels at the top (corresponding to the labels in Figure 2; Figure 3, respectively) marks the universal time (UT) for the times when the TPAs are imaged.
The magnetic field components in the Geocentric Solar Magnetospheric (GSM) coordinate system were averaged to 1-min resolution and are depicted as red curves in Figures 1B–D. It is evident that the solar wind dynamic pressure remained quite stable throughout the day, with a relatively small magnitude of IMF that was northward-dominated before 14:00 UT. Under such quasi-quiet solar wind conditions, geomagnetic activity was also very quiet, especially between 05:00 and 14:00 UT, with the averaged AE index at 26 nT and the averaged SYM-H index at −5 nT (Figures 1F, G). These values indicate the absence of substorm injections during this quiet period, coinciding with the observation of TPAs, as discussed in the next section. Generally, the IMF provided by the 1-min OMNI data (black) and measured by the 1-min MMS-1 data (red) align with each other. However, there are differences that could be attributed to the evolution of the solar wind during its propagation from the Lagrange point L1 to the bow shock nose. Consequently, we will exclusively utilize the IMF data from MMS-1 in the subsequent analysis.
3 Aurora observations
During the period marked in gray in Figure 1, both the Wide-field Auroral Imager (WAI) onboard the Fengyun-3D (FY-3D) satellite (Zhang et al., 2019) and the Special Sensor Ultraviolet Scanning Imager (SSUSI) (Paxton et al., 2002) onboard the Defense Meteorological Satellite Program (DMSP) satellite observed moving TPAs. WAI captures auroral images in the N2 Lyman–Birge–Hopfield (LBH) bands ranging from 140 nm to 180 nm. SSUSI is a spectrographic imager with various wavebands, including LBH bands. This study utilizes raw auroral images from both WAI and SSUSI, considering the very weak geomagnetic activity, resulting in a faint emission intensity in the main auroral oval. To ensure accurate TPA identification, the airglow background and other straylight were not eliminated, particularly for FY-3D WAI. This approach does not compromise the identification of TPAs. It is important to note that, due to the low Earth orbit and the large field of view for WAI, dusk sector disk images are faint due to the line-of-sight projection effect.
3.1 Auroral evolutions
Figure 2 and Figure 3 present auroral images in the northern hemisphere captured by FY-3D WAI and DMSP F17/F18 SSUSI from 05:30 UT to 14:11 UT, organized based on their observation time. The FY-3D satellite consistently traveled from the dayside to the nightside in the northern hemisphere. DMSP F17 and F18 traversed from duskside to dawnside in the northern hemisphere and from dawnside to duskside in the southern hemisphere.
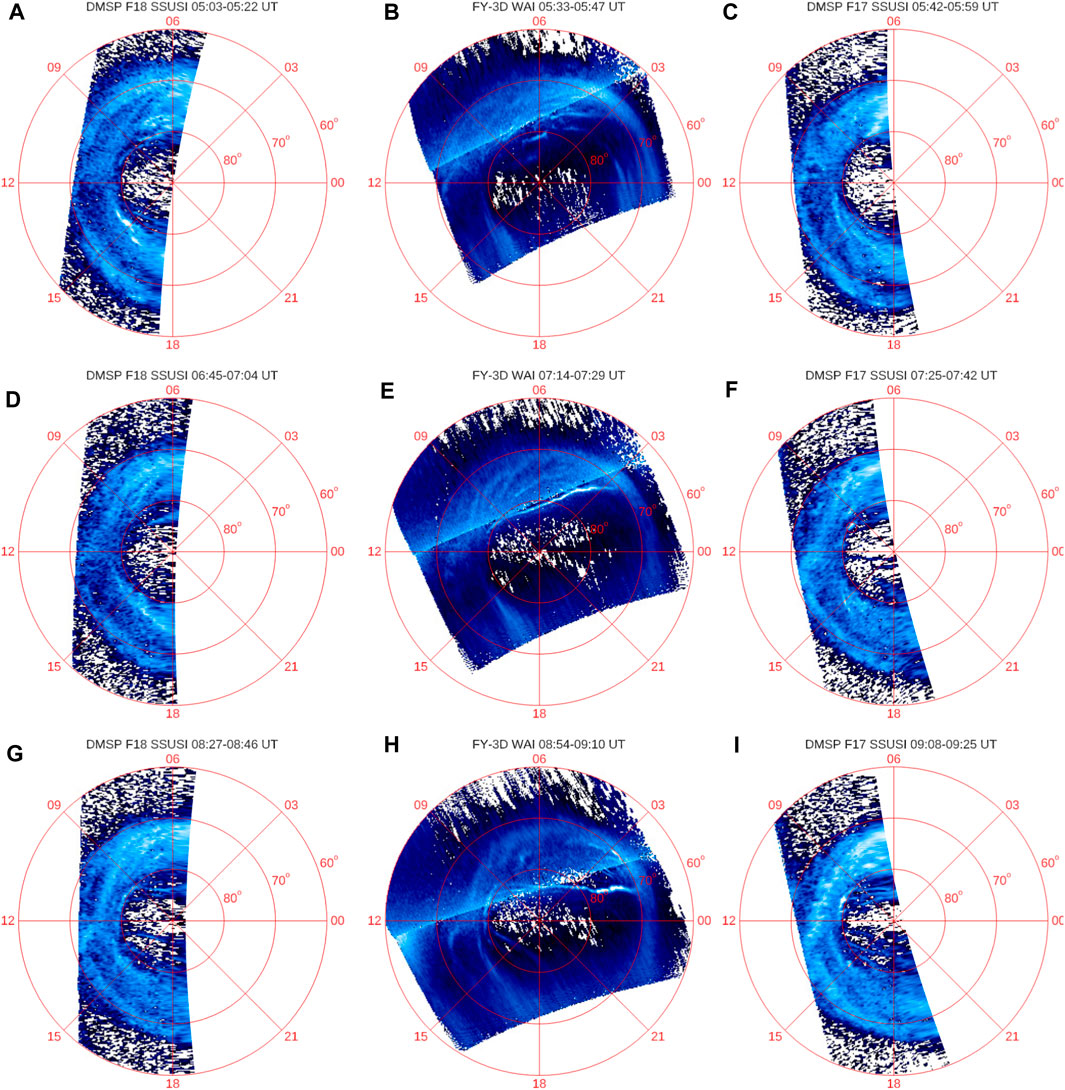
FIGURE 2. TPAs observed by FY-3D WAI and DMSP SSUSI in the northern hemisphere. All the images in panels (A–I) are projected onto a reference surface at an altitude of 110 km in the altitude-adjusted corrected geomagnetic (AACGM) coordinate system. The Sun is at the left and the midnight is at the right, and the dawn is at the top and dusk is at the bottom for each panel. The auroral images are all logarithmically scaled between 10 Rayleigh and 1,500 Rayleigh to highlight the TPAs.
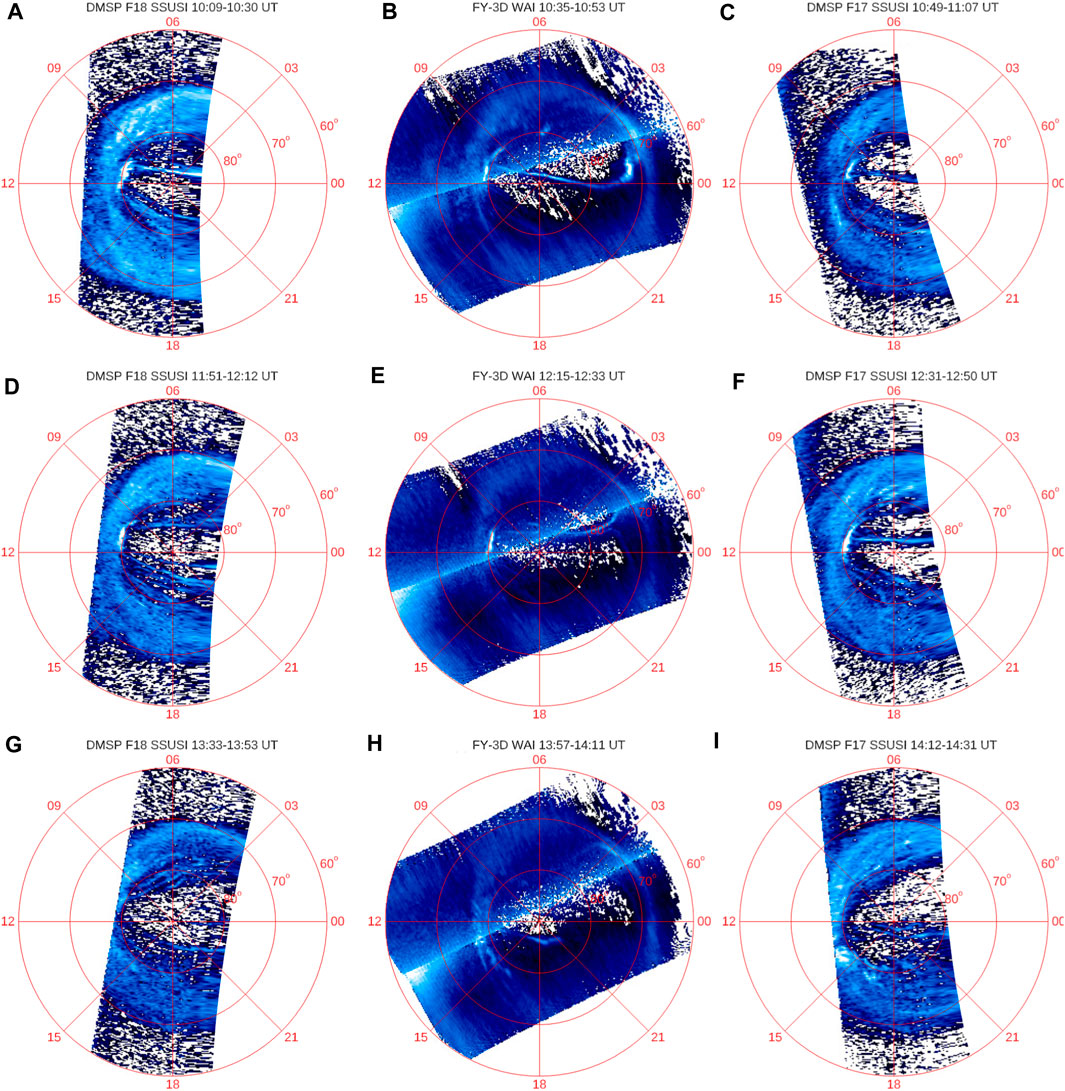
FIGURE 3. TPAs observed by FY-3D WAI and DMSP SSUSI in the northern hemisphere (A–I). The formats are the same as those in Figure 2.
During the period of steady northward IMF after 04:00 UT, IMF BY exhibited fluctuations from 05:00 to 06:00 UT. Small-scale auroral arcs were simultaneously observed in both the dawnside and duskside, as depicted in Figures 2A, B. Specifically, between 05:03 and 05:22 UT, DMSP F18 SSUSI captured a small arc in the duskside at an AACGM latitude greater than 80° (hereafter, denoted as MLAT), with no clear arcs visible in the dawnside (Figure 1A). Half an hour later, FY-3D WAI observed the opposite scenario in the same hemisphere with MLAT>80° (Figure 1B), where the duskside arc disappeared while an arc appeared in the dawnside. This dawnside polar cap arc will be the focus of this investigation.
After 06:00 UT, the dawnside polar cap arc significantly elongated and intensified, transforming into a TPA (Figures 2D–F). The FY-3D WAI captured the complete structure of the TPA between 07:14 and 07:29 UT (Figure 2E). The TPA extended from 2.64 h magnetic local time (MLT) to 10.8 h MLT and exhibited a tilt angle of approximately 20°, indicating that it was not strictly Sun-aligned. The dayside end of the TPA was observed around ∼07:20 UT. Approximately 10 min later, DMSP F17 SSUSI observed the dayside part of the TPA in the northern hemisphere (Figure 2F). At ∼07:35 UT, F17 SSUSI detected an auroral bright spot at ∼80° MLAT and ∼10 h MLT, as marked by the red circle in Figure 2F. A comparison between Figures 2E, F suggests that this auroral bright spot was generated between 07:20 and 07:35 UT. As shown in Figures 2, 3, this auroral bright spot persisted for at least 5 h in the northern hemisphere. According to Figure 1E, after 07:00 UT, the IMF direction shifted from pure northward to dawnward in half an hour and then reverted to pure northward before 08:00 UT.
From ∼07:00 UT to ∼12:50 UT, the TPA remained situated in the polar cap region, exhibiting dynamic changes in its position and overall shape. Between ∼06:00 UT and ∼10:30 UT, a discernible trend of shifting from negative to positive in IMF (Figures 1C, E) was observed. This change in IMF BY sign prompted the TPA to traverse over the polar cap toward dusk (Cumnock, 2005), as evident in Figures 2G–I and Figures 3A–C. Even during a rapid dawnward turning and recovery in IMF direction between 10:30 and 11:30 UT, the TPA continued oscillating around the noon-midnight line until 12:50 UT due to the fluctuation in IMF direction (Figures 3C–F). However, it never crossed the noon-midnight line, except for the nightside part. Throughout this period, the TPA exhibited a theta-aurora, indicative of a bifurcated topology of the tail plasma sheet (Obara et al., 1988). The TPA possibly dissipated after 13:00 UT (Figures 3G–I), giving way to other oval-aligned small-scale arcs.
Several intriguing phenomena were observed during the evolution of the TPA in Figure 2 and Figure 3, outlined below:
(1) Between 08:54 and 09:10 UT, small-scale spiral structures appeared within the TPA (Figure 2H, also magnified in Figure 4A), primarily in the nightside region. This observation is supported by simultaneous visible auroral images from the ground-based all-sky imager at Taloyoak (TALO) (Figure 4B). However, due to the low temporal resolution of the satellite auroral images, pinpointing when and where the spiral structures originated and evolved is challenging.
(2) Multi-branch structures were observed in the dayside part of the TPA but were not consistently present. FY-3D detected at least two branches between 06 and 11 h MLT from 08:54 to 09:10 UT (Figure 2H), and DMSP F17 observed three branches between 09:08 and 09:25 UT (Figure 2I).
(3) The TPA exhibited an “n-shape” between 08:54 and 09:10 UT (Figure 4A). The primary TPA was linked to the dayside auroral bright spot around 80° MLAT between 09 and 12 h MLT, and a weaker TPA extended from this auroral bright spot in the duskside above 80° MLAT between 12 and 18 h MLT.
(4) Between 10:35 and 10:53 UT, the global shape of the TPA transformed from a quasi-straight line to a curved line, resembling an “l-shape” (Figure 3B).
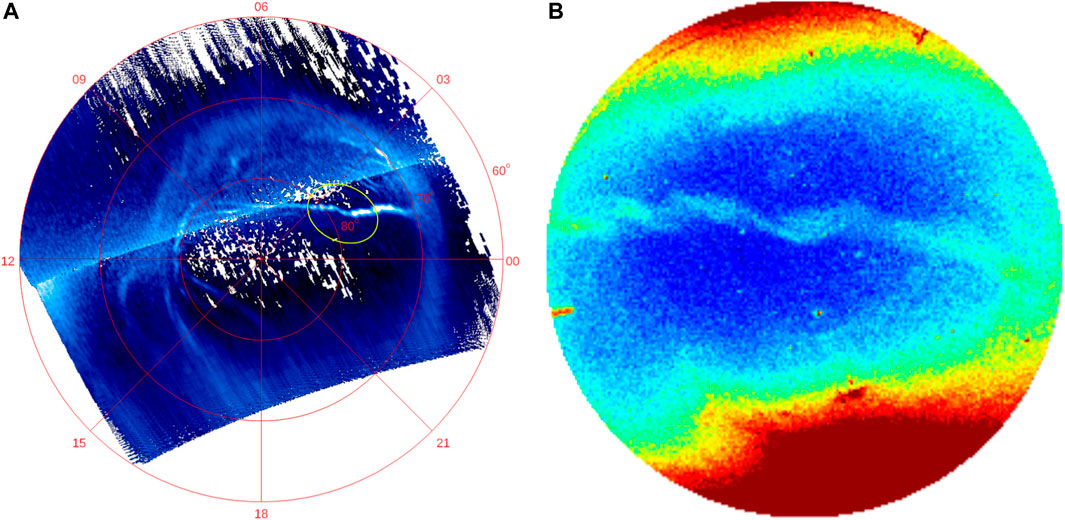
FIGURE 4. Small-scale spiral structure in the TPA observed by (A) FY-3D WAI between 08:54 and 09:10 UT and (B) TALO ASC image at 08:52:21 UT. The mapping of the boundary of the TALO auroral image is shown by the yellow ellipse in (A). The TALO auroral image has been rotated to basically align with the coordinate system in (A). The red colors are due to the moonlight.
3.2 Particle signatures
The study presents three closely conjugated observations of TPAs and particle precipitations by DMSP F18 and F16, as shown in Figure 5. In Figures 5A–C, DMSP F18 passed over the TPAs at 10:20 UT, 12:03 UT, and 13:42 UT, respectively. Figures 5D–F display spectra of precipitation ions and electrons, cross-track horizontal drift velocity, and vertical drift velocity measured by DMSP F16 in three time intervals. The precipitations were measured by the Special Sensor Precipitating Electron and Ion Spectrometer (SSJ/5; Hardy et al., 1984), and the drift velocities were measured by the ion drift meter (IDM; Greenspan et al., 1986) onboard F16.
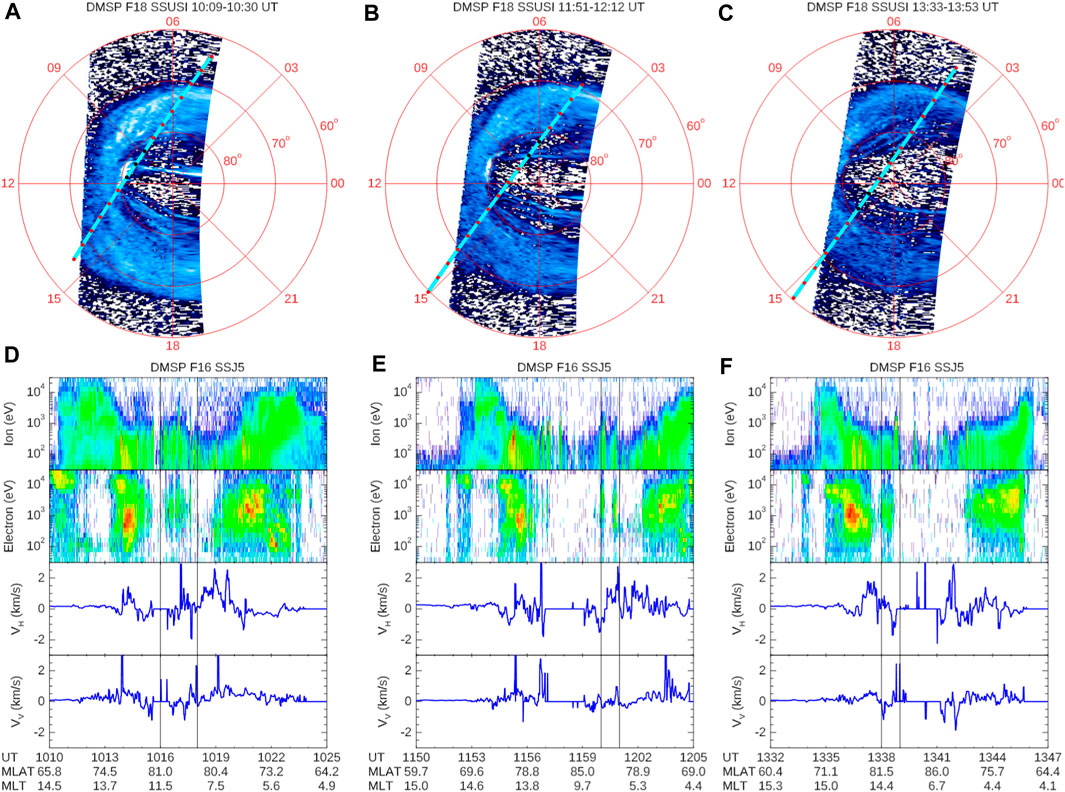
FIGURE 5. Auroral images and corresponding particle precipitations. (A–C) Auroral images observed by DMSP F18 in AACGM coordinate system. (D–F) Ion and electron precipitations, (VH, positive for westward/sunward), and vertical drift velocity (VV, positive for upward) measured by DMSP F16 from 10:10 to 10:25 UT, 11:50 to 12:05 UT, and 13:32 to 13:47 UT, with the trajectories overlaid in (A–C) respectively. The red or black dots on the trajectories are shown in 1-min intervals. The vertical black lines in (D–F) mark the times when DMSP F16 pass over the TPAs, also shown as black dots in (A–C).
The areas highlighted by two vertical black lines indicate the period when DMSP F16 passed over the TPAs observed by DMSP F18. The time differences to auroral observations are approximately 3 min. During these time periods, enhanced fluxes of electrons and ions with energies around 1 keV were observed. These high-energy ions might originate from the boundary plasma sheet (Newell et al., 1991). Strong plasma flow shears were observed around the TPAs in the last but second panels in Figure 5, with primarily westward/sunward flows, indicating that these plasmas are most probably on closed field lines. It is interesting to note that, above the TPAs, there were sometimes upward flows (bottom panel in Figure 5E) and sometimes downward flows (bottom panels in Figures 5D, F).
4 Discussions
In this study, we presented the evolution of a TPA observed by FY-3D WAI and DMSP F17/F18 SSUSI, both in the low-Earth orbits. The conjugated precipitation particle signatures were investigated with DMSP F16/F18 data.
The study provides insights into the formation mechanisms of large-scale TPAs, aligning with previous discussions on the topological structures of the tail plasma sheet or the magnetospheric boundary layer region (Kullen, 2012; Hosokawa et al., 2020). The TPA in this investigation was initially generated at the poleward boundary of the main auroral oval in the dawn sector under the condition of northward IMF with negative BY, which is consistent with previous research on the IMF dependences of TPAs (Kullen et al., 2002; Fear and Milan, 2012). As the IMF transitioned from dawnward to duskward, the TPA exhibited a corresponding motion from dawn to dusk. This observation supports the scenario that, initially, the tail plasma sheet was twisted toward the dawnside due to negative IMF BY. Subsequently, as the IMF BY rotated from negative to positive, the twisted plasma sheet also rotated, leading to the duskward movement of the TPA. The detailed analysis and observations contribute to the understanding of the dynamic interplay between the IMF conditions and the evolution of TPAs in the magnetosphere.
The study notes that although the IMF was generally rotating duskward, the exact direction exhibited oscillations. The clock angle of the IMF, as depicted in Figures 1C, E, quasi-periodically oscillated around 0° (pure northward) between 06:00 and 09:00 UT with a period of approximately 1 h. This oscillatory behavior contributed to the reciprocating motion of the TPA observed in Figure 2 and Figure 3. During this process, the low-latitude part of the twisted tail plasma sheet might have been warped, resulting in the nightside part of the TPA being warped with the convex pointing duskward around ∼10:30 UT (Figure 3B). Simultaneously, the high-latitude part of the twisted plasma sheet might have branched to generate multiple arcs in the dayside part of the TPA (Figures 3C–E). The complex structure of the tail plasma sheet observed in this scenario could be attributed to the oscillated variations in the IMF BY. The quasi-periodic oscillation of IMF BY may have led to the generation of plasma instabilities or flow shears in the low-latitude region of the twisted tail plasma sheet, resulting in the formation of spiral structures in the nightside part of the TPA. However, a more detailed understanding of these mechanisms would require further systematic numerical simulations in future research.
The study reveals that throughout the evolution of the TPA, an auroral bright spot persisted at the poleward boundary of the main auroral oval between 09 and 12 h MLT around 80° MLAT. This observation suggests the possibility of steady high-latitude lobe reconnection (e.g., Fuselier et al., 2000; Frey et al., 2003; Cai et al., 2021; Guo et al., 2021; Milan et al., 2022). However, it is important to note that this suggestion has recently been challenged by Xiong et al. (2024) that intermittent lobe reconnection under prolonged northward IMF could also generate continuous aurora cusp spot. In this specific region, the observations showed mainly high-energy electron precipitations and no ion precipitations, as indicated in Figure 6B. Proton auroral images (121.6 nm) observed by DMSP F18 also confirmed the absence of an auroral bright spot (although not presented in the figures). The electron energy spectrum above the auroral bright spot exhibited an inverted-V signature associated with upward field-aligned currents (FAC), as shown in the bottom panel of Figure 6B. The FAC density was calculated using the perturbation magnetic field measured by the special sensor magnetometer (SSM; Rich et al., 1985) onboard F18, following the method described in He et al. (2014). These collective observations strongly suggest the occurrence of long-duration steady lobe reconnection, leading to significant closure of the magnetosphere.
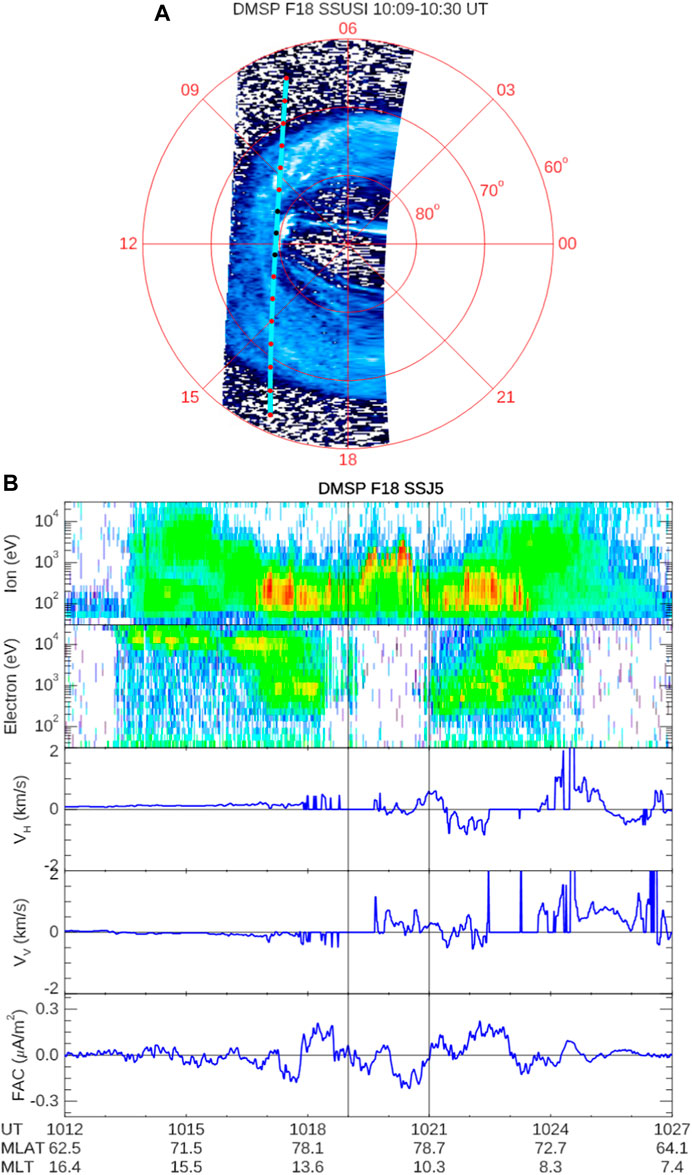
FIGURE 6. DMSP F18 Auroral images and corresponding particle precipitations. (A) Auroral images observed by DMSP F18 in AACGM coordinate system. (B) Ion and electron precipitations, horizontal drift velocity (VH, positive for westward/sunward), vertical drift velocity (VV, positive for upward), and density of FAC (negative for upward) measured by DMSP F18 from 10:12 to 10:27 UT, with the trajectory overlaid in (A). The red or black dots on the trajectories are shown in 1-min intervals. The vertical black lines in (B) mark the times when DMSP F18 pass over the TPAs, also shown as black dots in (A).
Regarding the hemispheric conjugation of the TPA, our observations in the southern hemisphere were not so clear. Unfortunately, only DMSP data were accessible for the southern hemisphere. As shown in Figure 7, since it was in summer in the southern hemisphere, the dayglow emissions were extremely intense compared with the weak auroral emissions, it is difficult to precisely identify the auroral arcs in the images. Even though, multiple auroral arcs can also been seen in DMSP F17 and F18 images. These multiple arcs in the dawnside might conjugate with those in the duskside in the northern hemisphere (Figure 3). However, it is difficult to determine whether there was a TPA conjugating with the main TPA in the northern hemisphere. Therefore, it is difficult to infer whether there was an opposite effect of IMF BY on TPA location and motion in the southern hemisphere.
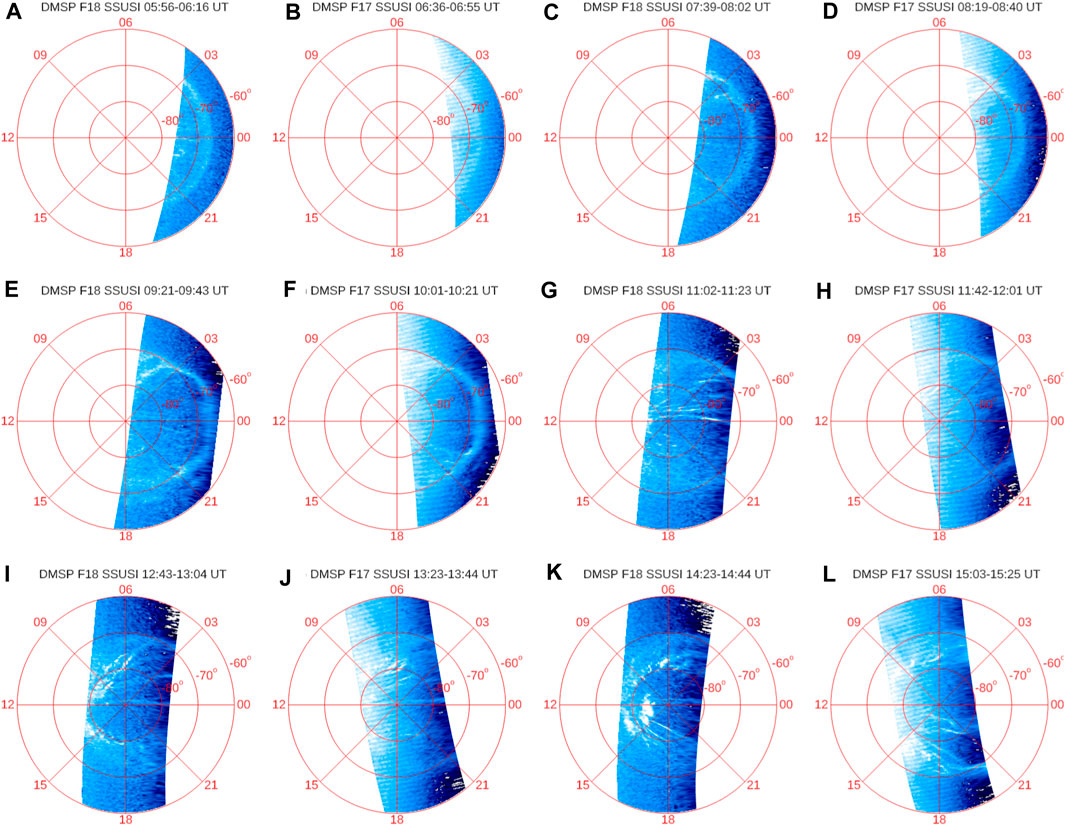
FIGURE 7. TPAs observed by DMSP F17/F18 SSUSI in the southern hemisphere (A–K). The formats are the same as those in Figure 2.
The study acknowledges challenges in assessing the hemispheric conjugation of the TPA in the southern hemisphere due to limited data availability. The southern hemisphere observations relied solely on DMSP data. Figure 7 indicates that, being summer in the southern hemisphere, dayglow emissions were exceptionally intense compared with the weak auroral emissions. This intensity makes it difficult to precisely identify auroral arcs in the images. Despite these challenges, the DMSP F17 and F18 images in the southern hemisphere show multiple auroral arcs, particularly in the dawnside. The suggestion is that these multiple arcs might conjugate with those in the duskside in the northern hemisphere (as depicted in Figure 3). However, determining whether there was a TPA conjugating with the main TPA in the northern hemisphere remains difficult due to the limitations in data resolution and clarity in the southern hemisphere. Consequently, inferring whether there was an opposite effect of IMF BY on TPA location and motion in the southern hemisphere is challenging.
5 Conclusion
In conclusion, the findings from the study on the evolution of the TPA during a quiet period with northward IMF are summarized as follows:
1. The TPA was observed continuously by both FY-3D and DMSP satellites during a very quiet period with northward IMF. The TPA initially appeared in the dawnside poleward boundary of the main auroral oval under negative IMF. As the IMF BY changed sign from negative to positive during a period of longer than 7 h, the TPA moved towards dusk and formed a theta aurora, suggesting a bifurcated topology of the tail plasma sheet.
2. Due to the quasi-periodic oscillation of IMF BY, the TPA exhibited reciprocating motion in the dawnside hemisphere. The TPA showed curvature in the nightside, possibly influenced by the oscillation of IMF BY. The quasi-periodic oscillations might have generated plasma instabilities or flow shears, resulting in spiral structures in the nightside part of the TPA.
3. An auroral bright spot existed persistently at the dayside poleward boundary of the main auroral oval. Conjugated observations of precipitation particles and FAC suggested the presence of steady/intermittent lobe reconnections, leading to significant closure of the magnetosphere.
These findings contribute to understanding the complex dynamics of TPAs, their response to IMF variations, and their connection to magnetospheric processes such as lobe reconnection. The study emphasizes the importance of considering both hemispheres and the dynamic nature of the IMF in interpreting TPA behavior.
Data availability statement
The original contributions presented in the study are included in the article/Supplementary Material, further inquiries can be directed to the corresponding authors.
Author contributions
FH: Conceptualization, Formal Analysis, Funding acquisition, Investigation, Methodology, Visualization, Writing–original draft, Writing–review and editing. X-XZ: Formal Analysis, Writing–review and editing. JL: Formal Analysis, Writing–review and editing. ZY: Writing–review and editing. ZR: Writing–review and editing. YW: Writing–review and editing.
Funding
The author(s) declare that financial support was received for the research, authorship, and/or publication of this article. This work was supported by the National Natural Science Foundation of China (42222408, 41931073), the Youth Innovation Promotion Association of the Chinese Academy of Sciences (Y2021027), and the Strategic Priority Program on Space Science, Chinese Academy of Sciences (XDA15350203).
Acknowledgments
We thank Y.-L. Zhang and L. Paxton at John Hopkins University Applied Physics Laboratory for providing the DMSP SSUSI data. We acknowledge S. Mende and E. Donovan for use of the ASI data, the CSA for logistical support in fielding and data retrieval from the GBO stations, and NSF for support of GIMNAST through grant AGS-1004736.
Conflict of interest
The authors declare that the research was conducted in the absence of any commercial or financial relationships that could be construed as a potential conflict of interest.
Publisher’s note
All claims expressed in this article are solely those of the authors and do not necessarily represent those of their affiliated organizations, or those of the publisher, the editors and the reviewers. Any product that may be evaluated in this article, or claim that may be made by its manufacturer, is not guaranteed or endorsed by the publisher.
References
Cai, L., Kullen, A., Zhang, Y., Karlsson, T., and Vaivads, A. (2021). DMSP observations of high-latitude dayside aurora (HiLDA). J. Geophys. Res. Space Phys. 126, e2020JA028808. doi:10.1029/2020JA028808
Chao, J. K., Wu, D. J., Lin, C.-H., Yang, Y. H., Wang, X. Y., Kessel, M., et al. (2002). “Models for the size and shape of the Earth’s magnetopause and bow shock,” in Space weather study using multipoint techniques, COSPAR colloq. Ser. Editor L.-H. Lyu (Oxford: Pergamon), 12, 127–134.
Cumnock, J. A. (2005). High-latitude aurora during steady northward interplanetary magnetic field and changing IMF B<i>y</i>. J. Geophys. Res. 110, A02304. doi:10.1029/2004JA010867
Fear, R. C., and Milan, S. E. (2012). The IMF dependence of the local time of transpolar arcs: implications for formation mechanism. J. Geophys. Res. 117, A03213. doi:10.1029/2011JA017209
Frank, L. A., Craven, J. D., Gurnett, D. A., Shawhan, S. D., Weimer, D. R., Burch, J. L., et al. (1986). The theta aurora. J. Geophys. Res. 91, 3177–3224. doi:10.1029/JA091iA03p03177
Frey, H. U., Phan, T., Fuselier, S., and Mende, S. (2003). Continuous magnetic reconnection at Earth’s magnetopause. Nature 426 (6966), 533–537. doi:10.1038/nature02084
Fuselier, S. A., Petrinec, S., and Trattner, K. (2000). Stability of the high-latitude reconnection site for steady northward IMF. Geophys. Res. Lett. 27 (4), 473–476. doi:10.1029/1999GL003706
Greenspan, M. E., Anderson, P. B., and Pelagatti, J. M. (1986). Characteristics of the thermal plasma monitor (SSIES) for the Defense meteorological satellite Program (DMSP) spacecraft S8 though S10 (tech. Rep. AFGL-TR-86-0227). MA: Air Force Geophysics Laboratory, Hanscom Air Force Base.
Guo, J., Lu, S., Lu, Q. M., Lin, Y., Wang, X. Y., Zhang, Q. H., et al. (2021). Three-dimensional global hybrid simulations of high latitude magnetopause reconnection and flux ropes during the northward IMF. Geophys. Res. Lett. 48 (21), e2021GL095003. doi:10.1029/2021gl095003
Hardy, D. A., Yeh, H. C., Schmitt, L. K., Schumaker, T. L., Gussenhoven, M. S., Huber, A., et al. (1984). Precipitating electron and ion detectors (SSJ/4) on the block 5D/Flights 6–10 DMSP satellites: calibration and data presentation (Tech. Rep. AFGL-TR-84-0317). MA: Air Force Geophysical Laboratory, Hanscom Air Force Base.
He, F., Zhang, X.-X., and Chen, B. (2014). Solar cycle, seasonal, and diurnal variations of subauroral ion drifts: statistical results. J. Geophys. Res. Space Phys. 119, 5076–5086. doi:10.1002/2014JA019807
Hosokawa, K., Kullen, A., Milan, S., Reidy, J., Zhou, Y., Frey, H. U., et al. (2020). Aurora in the polar cap: a review. Space Sci. Rev. 216, 15. doi:10.1007/s11214-020-0637-3
Kullen, A. (2000). The connection between transpolar arcs and magnetotail rotation. Geophys. Res. Lett. 27, 73–76. doi:10.1029/1999GL010675
Kullen, A. (2012). Transpolar arcs: summary and recent results, in Auroral phenomenology and magnetospheric processes: Earth and other planets, ed. by A. Keiling, E. Donovan, F. Bagenal, and T. Karlsson pp. 69–80. AGU, Washington DC. doi:10.1029/2011GM001183
Kullen, A., Brittnacher, M., Cumnock, J. A., and Blomberg, L. G. (2002). Solar wind dependence of the occurrence and motion of polar auroral arcs: a statistical study. J. Geophys. Res. 107, 1362. doi:10.1029/2002JA009245
Kullen, A., Thor, S., and Cai, L. (2023). The question of transpolar arc conjugacy: new results from comparing solar wind data and dipole tilt distribution of five different datasets. J. Geophys. Res. Space Phys. 128, e2022JA030987. doi:10.1029/2022JA030987
Milan, S. E., Bower, G. E., Carter, J. A., Paxton, L. J., Anderson, B. J., and Hairston, M. R. (2022). Lobe reconnection and cusp-aligned auroral arcs. J. Geophys. Res. Space Phys. 127, e2021JA030089. doi:10.1029/2021JA030089
Milan, S. E., Hubert, B., and Grocott, A. (2005). Formation and motion of a transpolar arc in response to dayside and nightside reconnection. J. Geophys. Res. 110, A01212. doi:10.1029/2004JA010835
Newell, P. T., Wing, S., Meng, C., and Sigillito, V. (1991). The auroral oval position, structure, and intensity of precipitation from 1984 onward: an automated on-line data base. J. Geophys. Res. 96 (A4), 5877–5882. doi:10.1029/90JA02450
Obara, T., Kitayama, M., Mukai, T., Kaya, N., Cogger, L., and Murphree, S. (1988). Simultaneous observations of Sunaligned polar cap arcs in both hemispheres by EXOS-C and Viking. Geophys. Res. Lett. 15 (7), 713–716. doi:10.1029/GL015i007p00713
Paxton, L. J., Morrison, D., Zhang, Y.-L., Kil, H., Wolven, B., Ogorzalek, B. S., et al. (2002). Validation of remote sensing products produced by the special sensor ultraviolet scanning imager (SSUSI): a far UV-imaging spectrograph on DMSPF-16. Proc. SPIE 4485, 338–348. doi:10.1117/12.454268
Rich, F. J., Hardy, D. A., and Gussenhoven, M. S. (1985). Enhanced ionosphere magnetosphere data from the DMSP satellites. Eos. Trans. AGU 66 (26), 513–514. doi:10.1029/EO066i026p00513
Russell, C. T., Anderson, B. J., Baumjohann, W., Bromund, K. R., Dearborn, D., Fischer, D., et al. (2016). The magnetospheric multiscale magnetometers. Space Sci. Rev. 199, 189–256. doi:10.1007/s11214-014-0057-3
Thor, S., Kullen, A., Cai, L., Katrougkalou, M. C., and Zhang, Y. (2023). Interhemispheric conjugacy of multiple transpolar arcs. Geophys. Res. Lett. 50, e2023GL103816. doi:10.1029/2023GL103816
Tsyganenko, N. A., and Fairfield, D. H. (2004). Global shape of the magnetotail current sheet as derived from Geotail and Polar data. J. Geophys. Res. 109, A03218. doi:10.1029/2003JA010062
Xing, Z., Zhang, Q., Han, D., Zhang, Y., Sato, N., Zhang, S., et al. (2018). Conjugate observations of the evolution of polar cap arcs in both hemispheres. J. Geophys. Res. Space Phys. 123, 1794–1805. doi:10.1002/2017JA024272
Xiong, Y.-T., Han, D.-S., Wang, Z.-W., Shi, R., and Feng, H.-T. (2024). Intermittent lobe reconnection under prolonged northward interplanetary magnetic field condition: insights from cusp spot event observations. Geophys. Res. Lett. 51, e2023GL106387. doi:10.1029/2023GL106387
Zhang, Q.-H., Zhang, Y.-L., Wang, C., Lockwood, M., Yang, H.-G., Tang, B.-B., et al. (2020). Multiple transpolar auroral arcs reveal insight about coupling processes in the Earth’s magnetotail. Proc. Natl. Acad. Sci. 117 (16), 16193–16198. doi:10.1073/pnas.2000614117
Zhang, X. X., Chen, B., He, F., Song, K. F., He, L. P., Liu, S. J., et al. (2019). Wide-field auroral imager onboard the Fengyun satellite. Light Sci. Appl. 8, 47. doi:10.1038/s41377-019-0157-7
Zhang, Y., Paxton, L. J., Zhang, Q.-H., and Xing, Z. (2016). Polar cap arcs: sun-aligned or cusp-aligned? J. Atmos. Sol.-Terr. Phys. 146, 123–128. doi:10.1016/j.jastp.2016.06.001
Keywords: Aurora, transpolar arc, reconnection, quiet period, tail plasma sheet, northward IMF
Citation: He F, Zhang X-X, Li J, Yao Z, Rong Z and Wei Y (2024) Evolution of a long-duration transpolar arc during very quiet period. Front. Astron. Space Sci. 11:1372099. doi: 10.3389/fspas.2024.1372099
Received: 17 January 2024; Accepted: 19 February 2024;
Published: 29 February 2024.
Edited by:
Chaoling Tang, Shandong University, ChinaReviewed by:
Desheng Han, Tongji University, ChinaJianjun Liu, Polar Research Institute of China, China
Copyright © 2024 He, Zhang, Li, Yao, Rong and Wei. This is an open-access article distributed under the terms of the Creative Commons Attribution License (CC BY). The use, distribution or reproduction in other forums is permitted, provided the original author(s) and the copyright owner(s) are credited and that the original publication in this journal is cited, in accordance with accepted academic practice. No use, distribution or reproduction is permitted which does not comply with these terms.
*Correspondence: Fei He, aGVmZWlAbWFpbC5pZ2djYXMuYWMuY24=; Xiao-Xin Zhang, eHh6aGFuZ0BjbWEuZ292LmNu