 Pia Martiny
 Robert Goggs
- College of Veterinary Medicine, Cornell University, Ithaca, NY, United States
Septic peritonitis (SP) is common in dogs and is associated with high mortality. Early recognition is essential to maximizing survival and may be aided by biomarker measurement. The present study aimed to evaluate the ability of biomarkers to discriminate septic peritonitis from non-septic ascites (NSA). Eighteen dogs with SP and 19 age-matched controls with NSA were enrolled. Contemporaneous blood and peritoneal effusion samples were obtained. Concentrations of cell-free DNA (cfDNA), cytokines, glucose, lactate, N-terminal pro-C-type natriuretic peptide (NT-proCNP), nucleosomes, and procalcitonin (PCT) were measured using commercial reagents and assays. Paired biomarker concentrations were compared with the Wilcoxon matched-pairs signed rank test, and biomarker concentrations between groups were compared with the Mann-Whitney U-test. P-values were adjusted for multiple comparisons using the Bonferroni correction. Receiver operating characteristic curves were generated to assess the ability of the above biomarkers to discriminate SP from NSA. Dogs with SP had significantly greater blood CCL2 concentrations than dogs with NSA (P = 0.032). Dogs with SP had significantly greater effusion CCL2, IL-6, IL-10, and lactate concentrations than dogs with NSA (P ≤ 0.0121). Blood-effusion concentration gradients of CCL2, glucose, IL-6, IL-10, and lactate were significantly different in dogs with SP compared to dogs with NSA (P ≤ 0.0165). Effusion lactate concentration had the highest AUROC value (0.866, 95% CI 0.751–0.980, P = 0.0001), although other biomarkers performed similarly. An effusion lactate concentration of 4.2 mmol/L was 72.2% (95% CI 46.5–90.3%) sensitive and 84.2% (95% CI 60.4–96.6%) specific for the diagnosis of SP.
Introduction
Septic peritonitis (SP) is inflammation of the peritoneal cavity caused by the presence of viable bacteria, and is a surgical emergency (1). The diagnosis of SP can be made by cytologic identification of intracellular bacteria in peritoneal fluid, by positive bacterial culture of peritoneal fluid, and through gross identification of gastrointestinal leakage at the time of laparotomy (2–4). Early diagnosis is crucial to enable timely and definitive treatment. Case fatality rates of 36–67% (2001–2018) are reported in dogs with SP (2–6). Diagnosis can be challenging when bacterial numbers are low, such as with gastric perforation (7, 8), when the volume of effusion is small and when prior diagnostic or therapeutic interventions reduce bacterial counts (1). In such patients, laboratory biomarkers specific to sepsis that can be rapidly measured might offer high diagnostic accuracy and be faster than bacterial culture techniques (9, 10).
Studies in human and veterinary medicine have evaluated the utility of blood biomarkers for sepsis diagnosis (11–15). In people, effusion cytokine concentrations have been evaluated for identification of SP following gastrointestinal surgery and in particular colorectal surgery (16, 17), and may enable early identification of anastomotic leakage. The utility of cytokines for diagnosis of SP (either pre-operatively or post-operatively) has not been assessed in dogs to date, however.
The diagnostic and prognostic potential of novel blood biomarkers including cfDNA, nucleosomes, PCT and inflammatory cytokines have recently been investigated in dogs with sepsis (18–21). Procalcitonin is the precursor of the hormone calcitonin. In people with sepsis, PCT concentrations increase within 24 h in response to an infectious stimulus and likely originate from monocytes, neutrophils and liver, kidney, spleen, and lung (22). Functionally, PCT may modulate cytokines (23), affect vascular tone (24), and amplify inflammation (25). Studies of people with cirrhosis suggest that serum PCT measurement might aid in the identification of SP (26), although measurement in the ascitic fluid was not discriminating (27). Concentrations of PCT are increased in dogs with sepsis (20) and may have prognostic value (21).
Cell-free DNA is released from a variety of cell types through the processes of apoptosis, necrosis and the release of neutrophil extracellular traps (NETs) (28–30). This cfDNA can be present alone or in combination with various nuclear, cytoplasmic or granule proteins such as neutrophil elastase, cathepsin G, or myeloperoxidase. Nucleosomes are structures comprised of cfDNA and nuclear histone proteins (31). Although nucleosomes and cfDNA share common structural elements, they are distinct entities (32), with variable potential for immune cell activation through pattern recognition receptors (PRRs) (33). Measuring both biomarkers may provide better insights into the disease process than either alone (32). Immune cell recognition of molecular patterns like histones, nucleosomes and cfDNA by PRRs leads to production of cytokines (34), which may also aid identification of SP.
Cytokines are a very large and diverse group of signaling proteins and inflammatory mediators that includes chemokines, interleukins, interferons and growth factors. Their biology is complex because many of these factors are pleiotropic and their effect can vary with context, concentration and location (35). Interleukin-6 drives the hepatic acute phase protein response, promotes monocyte and B-cell differentiation and activates T cells (36). The cytokine CCL2 (previously known as MCP-1) is a chemokine that is primarily responsible for inducing and regulating the migration and infiltration of macrophages to the sites of inflammation produced by either tissue injury or infection. In mouse peritonitis models, CCL2 is the most important mediator of monocyte migration into the abdomen (37). Although it is produced by various cell types including epithelia, the major source of CCL2 is actually other macrophages (38).
Blood to fluid gradients for lactate and glucose have been reported to have high sensitivity and specificity for SP diagnosis in dogs (39, 40). However, confidence in these findings has been reduced by additional data (40, 41) that demonstrate similar gradients in effusions associated with non-septic ascites (NSA) due to cancer, pancreatitis, uroperitoneum and bile leakage (40, 42, 43). Clinically, differentiation of dogs with SP from those with NSA can be challenging because these patients often present with similar histories and comparable clinical signs. In some situations, the peritoneal effusions generated by these two syndromes may also be difficult to distinguish because inflammation of the peritoneum can arise secondary to a variety of stimuli (44), including bacteria (45) and biochemical irritants such as pancreatic secretions (46), bile (47), or urine (48).
The present study aimed to determine which blood and effusion biomarkers, and which blood-effusion biomarker concentration gradients were most able to discriminate SP from NSA in dogs. It was hypothesized that dogs with SP have blood and effusion biomarker concentrations greater than those in dogs with NSA, with the exception of glucose for which the blood and effusion concentrations were hypothesized to be smaller in dogs with SP than with NSA. It was hypothesized that dogs with SP have smaller blood-effusion biomarker gradients than in dogs with NSA, again with the exception of glucose for which the gradient was hypothesized to be greater in dogs with SP than with NSA.
Materials and Methods
Sample Size
Calculations were performed with an online calculator (http://www.quantitativeskills.com/sisa/), using pilot data from 15 dogs (5 SP, 10 NSA), with alpha set at 0.05 and beta set at 0.2. In the pilot data the mean ± SD cfDNA concentration in the peritoneal effusion of dogs with SP was 24,380 ± 8,356 pg/mL. The maximum value in the dogs with NSA was 15,800 pg/mL. To detect an equivalent difference (24,380–15,800 = 8,580 pg/mL) between two new populations of dogs where the overall SD was 8,356 pg/mL would have required 16 dogs per group.
Animals
Dogs with evidence of systemic inflammatory response syndrome (SIRS) and a peritoneal effusion that were assessed in the emergency room and intensive care unit at the institution hospital between 08/16 and 03/18 were eligible for inclusion. The study was conducted with approval from the local Institutional Animal Care and Use Committee with informed client consent. Dogs were eligible for inclusion if they satisfied at least 2 of 4 SIRS criteria (49), and had peritoneal effusion identified using point-of-care ultrasonography performed according to established protocols (50, 51). The SIRS criteria used were temperature <100.6°F or >102.6°F; heart rate ≥120 beats per minute; respiratory rate ≥40 breaths per minute; white blood cell count >16,000 cells/μL or <6,000 cells/μL, or >3% band neutrophils. Dogs were categorized as having SP or NSA. The diagnosis of SP was based on positive bacterial culture or cytologic evidence of intracellular bacteria following evaluation of peritoneal effusion, or surgical confirmation of perforation of the gastrointestinal tract. The diagnosis of NSA was based on satisfaction of three criteria: (i) negative bacterial culture of peritoneal fluid, (ii) absence of cytologic evidence of bacteria, and (iii) establishment of an alternative final diagnosis (39). To minimize risks associated with blood or effusion sampling, dogs were excluded if they weighed <5 kg, had prothrombin time (PT) or activated partial thromboplastin time (aPTT) >150% upper reference interval value, or platelet count <30,000/μL.
Data Collection
The following data were recorded at the time of sample collection: signalment, previous medical history, physical examination findings, non-invasive blood pressure, peripheral oxygen saturation, modified Glasgow coma scale score (52), and ultrasound body cavity fluid scores. This information enabled calculation of the shortened Acute Patient Physiologic and Laboratory Evaluation (APPLEfast) score (53). At the time of peritoneal fluid detection, blood samples and peritoneal fluid samples were obtained within approximately 10 minutes of each other, while ensuring no therapies were administered within this time period in order not to interfere with biomarker gradient estimations. None of the patients received blood products, colloids or vasopressors prior to sample collection. Peritoneal effusion samples were collected by percutaneous paracentesis and the fluid decanted into evacuated tubes containing lithium heparin, K2-EDTA, 3.2% sodium citrate or no additives. Infusion of fluid into the peritoneal cavity to facilitate recovery of effusion (i.e., diagnostic peritoneal lavage) was not performed for any patient in this study. Blood samples were collected from intravenous catheters or by venipuncture directly into evacuated tubes containing lithium heparin, K2-EDTA, 3.2% sodium citrate or no additives. Blood gas and electrolyte (RapidPoint 405, Siemens Medical Solutions, Norwood, MA), lactate (Lactate Pro, Arkray, Edina, MN) and refractometric total protein measurements were performed on heparinized blood and effusion samples immediately after collection. Serum and EDTA anticoagulated blood were submitted for routine chemistry testing (Cobas, Roche, Indianapolis, IN), and complete blood counts (ADVIA 2120, Siemens, Washington, DC). The remaining blood and peritoneal fluid samples were centrifuged for 10 min at 1370 rcf. The supernatants were separated and stored at −80°C pending batch analysis. Samples were analyzed in two batches to minimize storage duration. The maximum storage time between sampling and analysis was 12 months (median 3.5, IQR 2.5–5.3). On the day of batch analysis, samples were thawed and held at 4°C.
Biomarker Assays
All biomarkers were measured in citrate-anticoagulated plasma and citrate-anticoagulated effusion samples. The present study used reagents and assays that have been previously validated (20, 54–62), or used by multiple independent groups for measurement of biomarker concentrations in dogs (18, 21, 63–68). Concentrations of cfDNA were measured using a benchtop fluorimeter (Qubit 3.0 Fluorometer) and relevant reagents (Quant-It HS dsDNA Kit), according to the manufacturers' instructions (Life Technologies, Waltham, MA). Samples were run in triplicate, and mean values used for statistical analysis, as previously reported (18, 68). Concentrations of plasma nucleosomes were analyzed using a commercial ELISA (Cell Death Detection ELISA Plus, Roche, Indianapolis, IN) scaled against pooled normal canine plasma because the assay lacks a reference standard (18, 68, 69). Plasma pooled from multiple normal dogs was analyzed in four wells on each plate and a reference value (assigned an arbitrary unit value of 1.0) was established as the mean of these four replicates. Nucleosome concentrations were expressed relative to the reference value (18, 68, 70). Concentrations of PCT were determined using a commercial kit (Biovendor, Asheville, NC), as previously described (20, 21). A previously validated kit (Biomedica Gruppe, Vienna, Austria), was used to measure NT-proCNP concentrations (57, 62). An antibody-coated microsphere-based multiplex cytokine immunoassay kit (CCYTOMAG-90K, EMD-Millipore, Billerica, MA), designed for the simultaneous quantification of multiple cytokines was used as previously described (64, 71). This assay was performed with overnight sample incubation at 4°C to maximize sensitivity. Analytes included were CCL2, CXCL8, IL-6, IL-10, and KC-Like. Cytokine concentrations were measured in duplicate and the mean values used for subsequent analyses. The observed concentration of each analyte for each sample was calculated using a standard curve generated from the standards and blank provided by the manufacturer [the median (min-max) r2 values for standard curves was 1.000 (0.996–1.000)]. Where values were recorded as below the measurable range of the assay the manufacturer's stated minimum detectable concentration was imputed as follows: 21.0 pg/mL (CCL2), 21.7 pg/mL (CXCL8), 20 mg/dL (glucose), 3.7 pg/mL (IL-6), 8.5 pg/mL (IL-10), and 5.3 pg/mL (KC-like).
Statistical Analyses
Prior to test selection, data were assessed for normality using the D'Agostino Pearson test and descriptive statistics calculated accordingly. The majority of variables were not normally distributed. In addition, cytokine concentrations were assumed to be non-parametric due to imputation of data for the lower limit of detection for some measurements. All data are therefore presented as median (interquartile range) and non-parametric hypothesis tests were used throughout. Case fatality rates were compared between the two groups using Fisher's exact test. Biomarker concentrations were compared between pairs of blood and effusion samples within the SP group and within the NSA group with the Wilcoxon matched-pairs signed rank test. Between dogs with SP and with NSA, biomarker concentrations in blood, in effusion and the blood-effusion gradients were compared using the Mann-Whitney U-test. Alpha was set at 0.05 for all hypothesis tests, with post-hoc Bonferroni corrections applied to adjust for multiple comparisons. Box and whisker plots were also generated to visualize comparisons.
The discriminating ability of biomarkers for the diagnosis of SP was evaluated by plotting receiver-operating characteristic (ROC) curves and through calculation of the area-under these curves (AUROC). Specifically, blood concentrations, effusion concentrations and the blood-effusion gradients of each biomarker were evaluated separately. Optimal cutoffs for sensitivity and specificity were identified by maximizing the Youden index = (Sensitivity+Specificity)-1 (72). Values for AUROC between models were compared per Hanley and McNeil (73, 74). Analyses were performed using commercial software (Prism 6.0, GraphPad, La Jolla, CA; SPSS Statistics 24, IBM, Armonk, NY).
Results
Study Population Characteristics
A total of 37 dogs were enrolled, 18 with SP and 19 with NSA. The SP group included mixed breed dogs (n = 4), Labrador retriever, beagle hound, and Siberian husky (all n = 2), and 1 each of the following: shih tzu, dachshund, American Eskimo, mastiff, bichon frise, golden retriever, rottweiler, and border collie. The NSA group included Labrador retriever (n = 4), border collie (n = 3), mixed breed (n = 3), and 1 each of the following: Australian shepherd, German short haired pointer, pit bull terrier, Bernese mountain dog, Havanese, foxhound, soft-coated wheaten terrier, golden retriever and Australian cattle dog. The SP group included 10 female spayed and 8 male castrated dogs, while the NSA group included 9 female spayed and 10 male castrated dogs. The median age in the SP group was 8 (4.8–10.3) years, and in the NSA group 9 (6–10) (P = 0.510). The median APPLEfast score in the SP group was 22 (IQR 20-29) and in the NSA group 21 (IQR 16-24) (P = 0.143). Median bodyweight in the SP group was 26 (13–35) kg and in the NSA group 32 (21–41) kg (P = 0.218) (Supplementary Table 1). Of the SP group, 8/18 cases were primary emergencies (10/18 were referred) and in the NSA group 3/19 cases were primary emergencies (16/19 were referred). Of the 18 SP dogs, 10 were euthanized perioperatively due to poor or worsening prognosis, 1 experienced cardiopulmonary arrest and died, and 7 were discharged alive (61.1% fatality). Of the 19 NSA dogs, 8 were euthanized due to poor or worsening prognosis and 11 were discharged alive. Of the 11 dogs discharged alive, however, 1 was discharged against medical advice and another to be euthanized at home (44.4% fatality with 1 censored case). There was no difference in case fatality rates between the two groups (P = 0.505). Causes of SP included intestinal perforation due to neoplasia (n = 3), foreign body (n = 2), gallbladder rupture with septic bile peritonitis (n = 3), dehiscence of a previous gastrointestinal surgical site (n = 2), liver abscess (n = 1), pancreatic abscess (n = 1), mesenteric lymph node abscess (n = 1), septic uroperitoneum from urinary bladder rupture (n = 1), and unknown source (n = 4). The four dogs with SP of unknown source were euthanized following cytologic diagnosis of septic peritoneal effusion but prior to further investigation of the origin of the SP. The diagnosis of SP was based on positive bacterial culture or cytologic evidence of intracellular bacteria following evaluation of peritoneal effusion (n = 15, 83%), or surgical confirmation of perforation of the gastrointestinal tract (n = 3, 17%) (2). Causes of NSA included sterile uroperitoneum (n = 4), bile peritonitis (n = 3), urethral obstruction (n = 2), recent laparotomy for gastrointestinal surgery (n = 2), pancreatitis (n = 2), gastric dilatation and volvulus (n = 1), neoplasia of hematopoietic origin (n = 1), acute renal failure (n = 1), intestinal foreign body (n = 1), intestinal adhesions (n = 1), and lymphoma (n = 1).
Biomarker Concentrations in Blood and Peritoneal Effusion
To determine if biomarker concentrations were different between peripheral blood and peritoneal effusion, pairwise comparisons between blood and effusion biomarker concentrations were performed. These results are summarized in Table 1. In dogs with SP, the concentrations of glucose, cfDNA, nucleosomes, PCT, CCL2, IL-6, IL-10, and KC-like were significantly different between blood and peritoneal effusion. For all biomarkers except glucose and PCT, the concentrations of these analytes were greater in the effusion compared to the blood of dogs with SP. In contrast, in dogs with NSA, only the concentrations of CCL2, IL-6 and KC-like were different in the effusion compared to blood; here also the effusion concentrations were greater than those in blood.
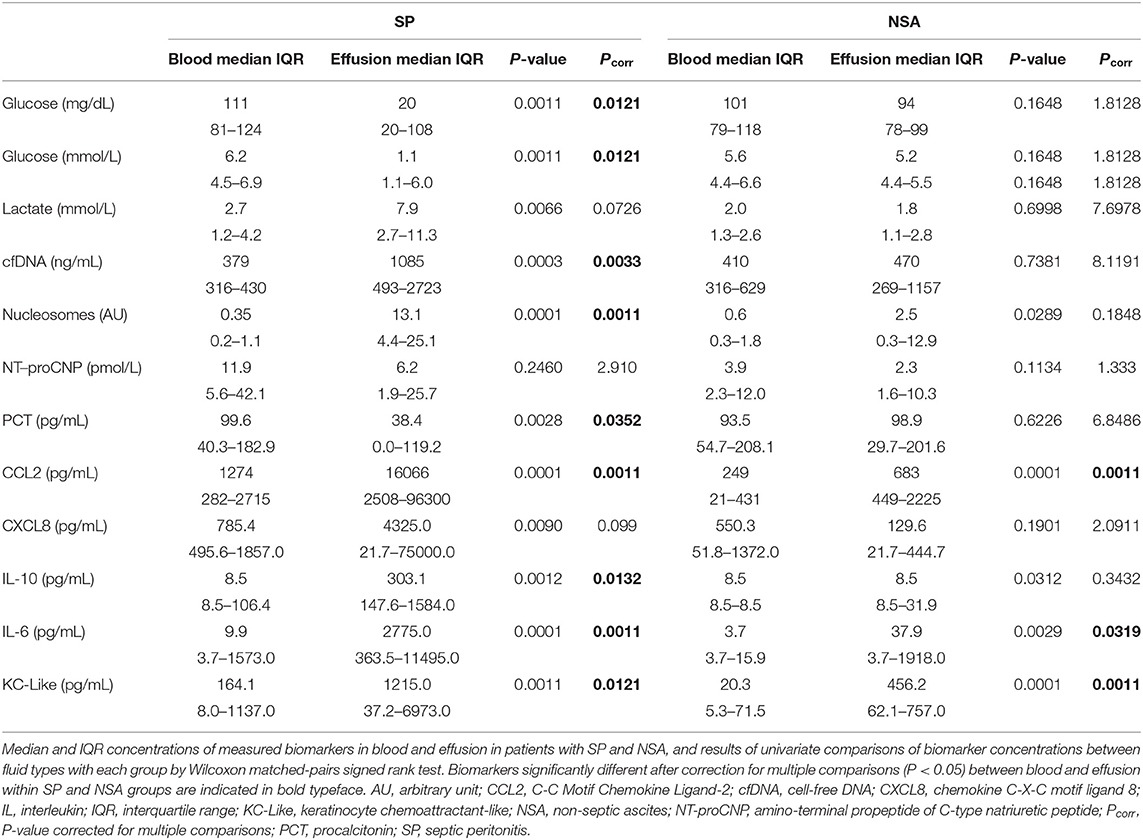
Table 1. Comparisons of blood biomarker concentration with effusion biomarker concentrations in dogs with septic peritonitis (SP) and in dogs with non-septic peritonitis (NSA).
Comparisons of Biomarker Concentrations in SP and NSA
To determine if blood biomarker concentrations could discriminate dogs with SP from those with NSA, the concentrations of each of the blood biomarkers were compared between the two groups of dogs. These data are summarized in Tables 2–4. After correction for multiple within group comparisons, only CCL2 was significantly different between dogs with SP and those with NSA. Specifically, blood CCL2 was higher in dogs with SP than with NSA (Figure 1). Similarly, to determine if effusion biomarker concentrations could discriminate SP from NSA, the concentration of the effusion biomarkers were compared between the two groups of dogs. Here, the effusion concentrations of lactate, CCL2, IL-6, and IL-10 were significantly greater in dogs with SP compared to those with NSA after correction for multiple comparisons (Figure 2). Finally, the blood-effusion concentration gradients were compared between dogs with SP and dogs with NSA. There were significantly smaller blood-effusion gradients of lactate, CCL2, IL-6, and IL-10 in dogs with SP compared to NSA (Figure 3). There was a significantly larger blood-effusion gradient of glucose in dogs with SP compared to dogs with NSA.
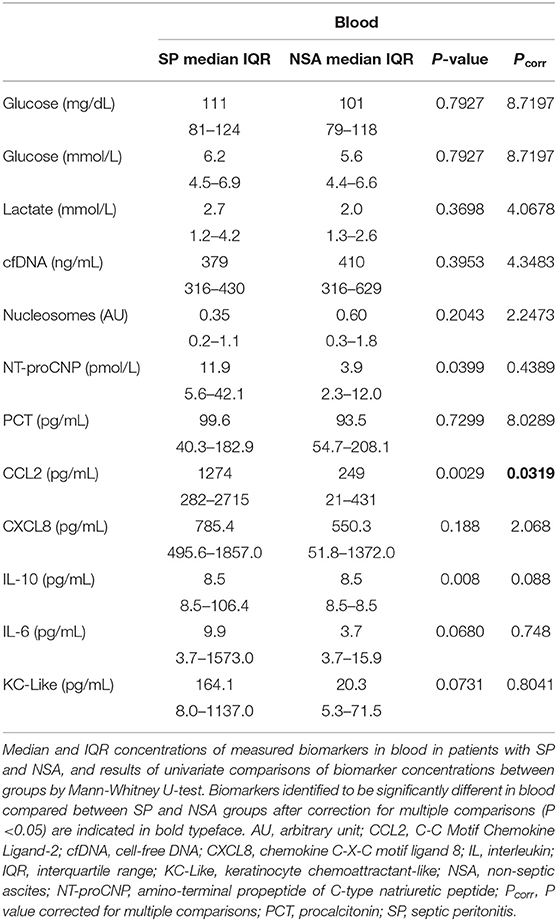
Table 2. Comparisons of blood biomarker concentrations in dogs with septic peritonitis (SP) and non-septic peritonitis (NSA).
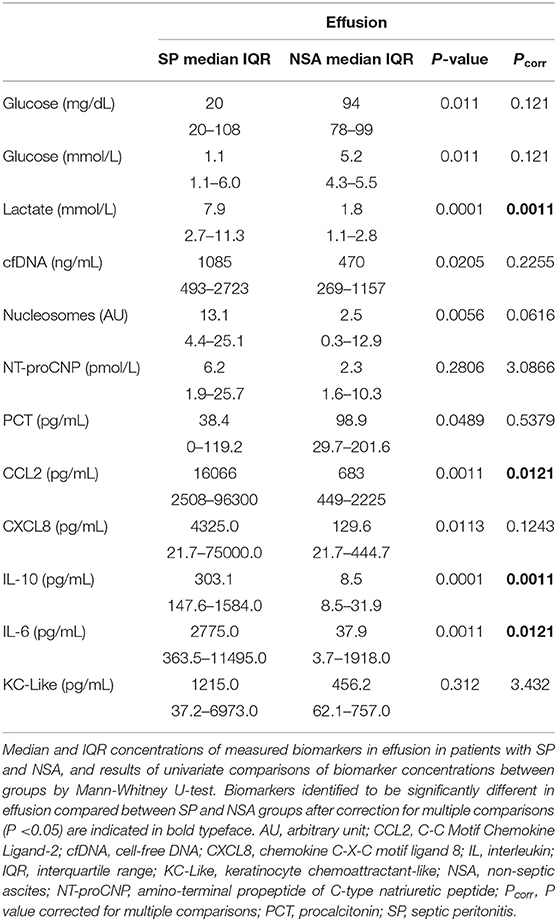
Table 3. Comparisons of effusion biomarker concentrations in dogs with septic peritonitis (SP) and non-septic peritonitis (NSA).
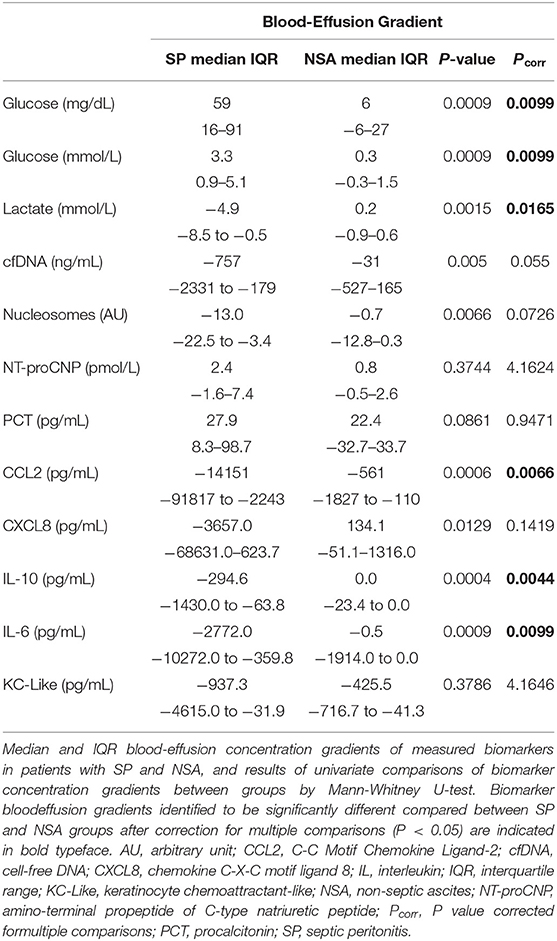
Table 4. Comparisons of blood-effusion biomarker concentration gradients in dogs with septic peritonitis (SP) and non-septic peritonitis (NSA).
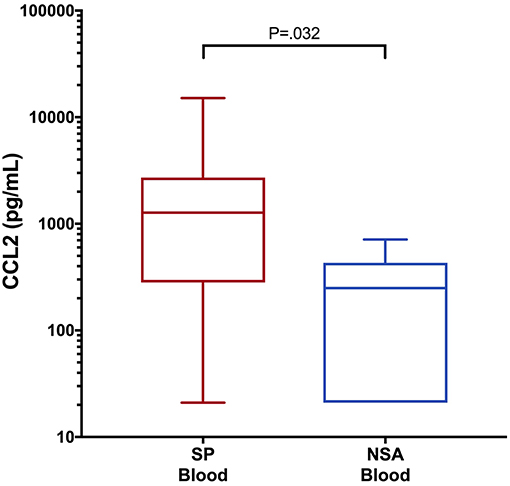
Figure 1. Box and whisker plot of blood CCL2 concentrations in dogs with SP and NSA. The central line within the box indicates the median, the box represents the interquartile range and the whiskers represent the minimum and maximum values. P <0.05 was after correction for multiple comparisons was considered significant. CCL2, C-C Motif Chemokine Ligand-2; IL, interleukin.
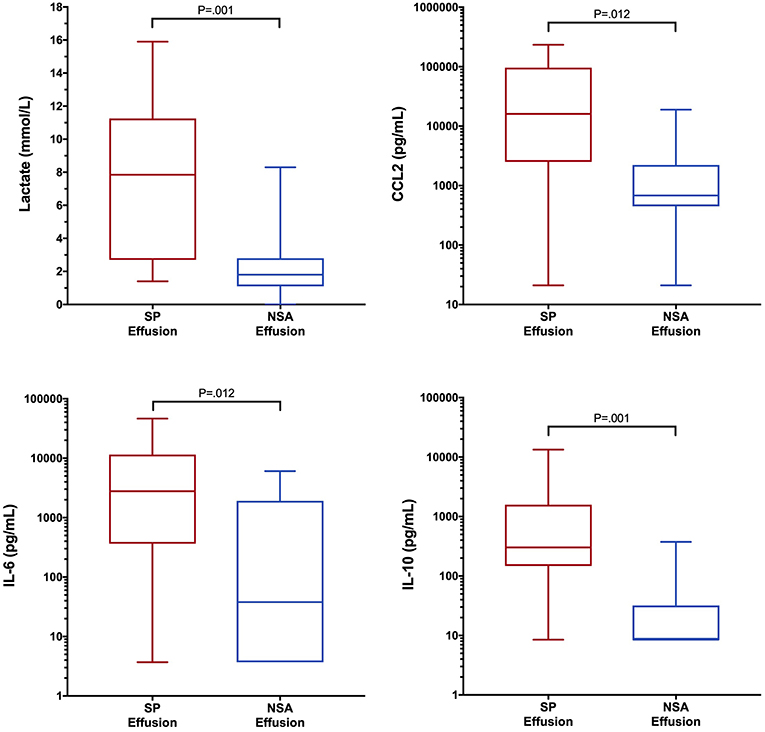
Figure 2. Box and whisker plot of effusion lactate, CCL2, IL-6 and IL-10 concentrations in dogs with SP and NSA. The central line within the box indicates the median, the box represents the interquartile range and the whiskers represent the minimum and maximum values. P <0.05 was after correction for multiple comparisons was considered significant. CCL2, C-C Motif Chemokine Ligand-2; IL, interleukin.
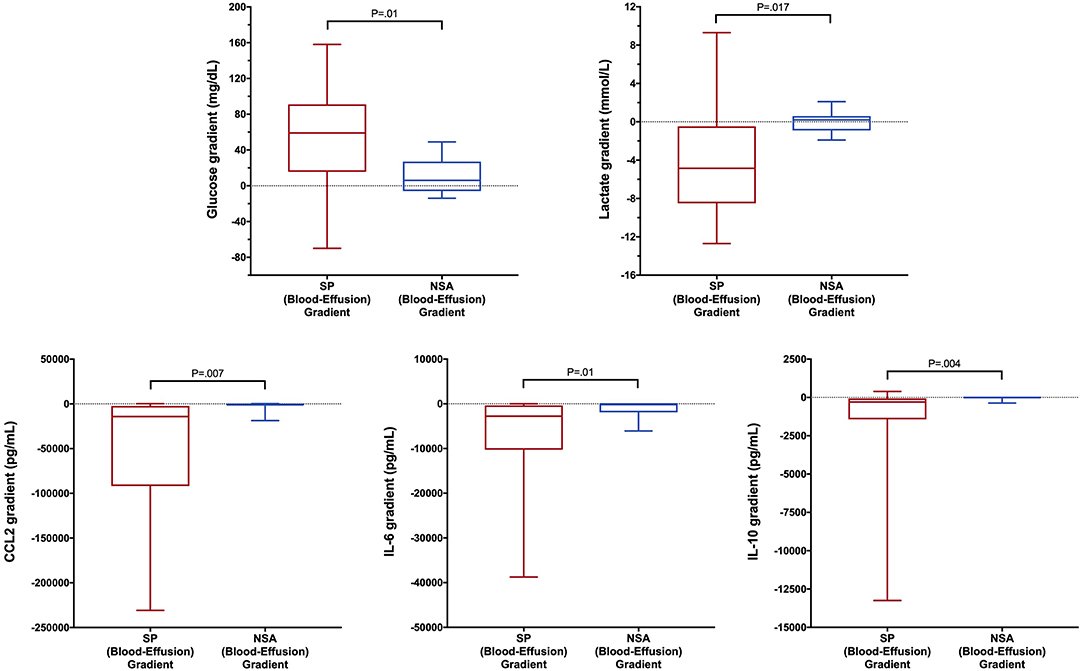
Figure 3. Box and whisker plot of blood-effusion gradients of glucose, lactate, CCL2, IL-6, and IL-10 concentrations in dogs with SP and NSA. The central line within the box indicates the median, the box represents the interquartile range and the whiskers represent the minimum and maximum values. P <0.05 was after correction for multiple comparisons was considered significant. CCL2, C-C Motif Chemokine Ligand-2; IL, interleukin.
Predicting Septic Peritonitis
The comparisons between blood and effusion biomarker concentrations described above were used to identify candidates for ROC curve generation. Specifically, ROC curves were generated for blood concentrations of CCL2, for effusion concentrations of lactate, CCL2, IL-6, and IL-10 and for blood-effusion gradients of lactate, glucose, CCL2, IL-6, and IL-10. The AUROC values with 95% confidence intervals (CI) and associated P-values are presented in Table 5. Based on these AUROC values, the most discriminant biomarker was the effusion lactate concentration (Figure 4), AUROC 0.866, 95% CI 0.751–0.980 (P = 0.0001). None of the AUROC values in Table 5 were significantly different from each other, however. Calculation of the Youden index identified that a cut-off for the effusion lactate concentration of 4.2 mmol/L was 72.2% sensitive (95% CI 46.5–90.3) and 84.2% specific (95% CI 60.4–96.6) for SP. The Youden index identified that a cut-off for the blood-effusion glucose gradient of <37 mg/dL (<2.06 mmol/L) was 89.5% sensitive (95% CI 66.9–98.7) and 66.7% specific (95% CI 41.0–86.7).
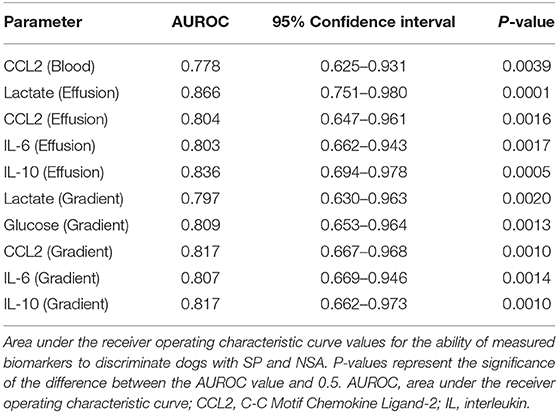
Table 5. Biomarker area under the receiver operating characteristic curve values for the discrimination of septic peritonitis from non-septic ascites in dogs.
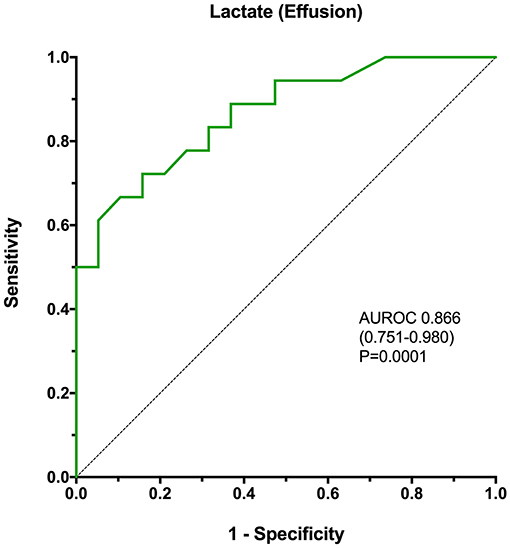
Figure 4. A receiver operating characteristic curve analysis of the ability of effusion lactate concentration to discriminate SP from NSA in dogs, with calculation of the area under the curve, associated confidence intervals and P-value. The P-value represents the significance of the comparison of the area under the curve with the line of identity (AUROC = 0.5). AUROC, area under the receiver operating characteristic curve.
Discussion
Differentiating SP from NSA can be challenging as many of these patients have similar presenting complaints, clinical examination abnormalities, and clinicopathological findings. Early diagnosis of SP might improve outcomes through expedited administration of antimicrobials and definitive surgical correction (75, 76). Definitively identifying NSA might prevent unnecessary antimicrobial drug administration and surgical exploration of dogs with NSA, reducing morbidity, client cost and patient risk. As such, finding a way to reliably, rapidly and non-invasively segregate these two populations would greatly aid clinicians. Previous studies have focused primarily on measurements of blood biomarker concentrations (12, 13, 18, 19, 57, 59), while only one study evaluated NT-proCNP measured in both blood and effusion for the diagnosis of SP (62). The present study aimed to address this unmet need by evaluating the ability of various biomarkers, measured both in blood and in effusion, to distinguish between SP and NSA.
In the present study, the marker that best differentiated SP from NSA was the effusion lactate concentration. This result is consistent with previous findings, although the discriminating ability in the present study was comparatively diminished (39, 40). In the study by Levin et al. involving 8 dogs with SP, a fluid lactate concentration above 2.5 mmol/L had a 100% sensitivity and 91% specificity for diagnosing SP (40). The study by Bonczynski et al. involving 7 dogs with SP did not indicate the diagnostic accuracy of the effusion lactate concentration alone; however, that study reported that a blood-effusion lactate gradient greater than −2mmol/L was 100% sensitive and 100% specific for the diagnosis of SP in dogs (39). We speculate that the differences between those findings and ours are due to the nature of the control population in the present study. We specifically selected dogs with NSA that clinically were very similar to those with SP. Specifically the two populations had comparable clinical histories, similar physical examination findings and illness severity scores. This likely resulted in a control population of dogs with inflammatory peritoneal effusions that were less easily differentiated from dogs with SP as compared to the control populations in earlier publications.
The lactate measured in the peritoneal effusion of dogs with SP may originate from bacterial metabolism, from the activity of infiltrating leukocytes or from diffusion from blood (40). The present study suggests it may be a combination of all these factors. If the lactate in septic effusions resulted from bacterial metabolism alone, then the lactate concentrations in non-septic effusions should be very low, or equal to blood concentrations due to diffusion. In the present study, effusion lactate concentrations were significantly greater in SP than in NSA, but some overlap existed (see Figure 2), indicating a source of lactate other than bacterial metabolism was likely present. Point of care lactate meters presently measure only L-lactate and cannot identify the D-lactate isoform predominantly produced by bacterial metabolism. Improved discrimination of the two patient populations evaluated here might be possible with measurement of both D- and L-lactate. We speculate that the infiltrating leukocytes may also have been generating lactate through altered cellular metabolism (77) in an environment with low oxygen tension (78).
The blood-effusion glucose gradient was significantly higher in the dogs with SP as compared to dogs with NSA, a finding that is consistent with a previous study (39). The alterations in glucose concentrations may reflect glucose consumption by bacterial and leukocyte metabolism. Dogs with SP had significantly greater effusion concentrations of CCL2, IL-6, and IL-10 compared to dogs with NSA. In addition, blood-effusion gradients of these cytokines were also significantly smaller in dogs with SP compared to those with NSA. These findings suggest effusion concentrations of CCL2, IL-6, and IL-10 may be more specific to bacterial infection rather than reflecting only the presence of an inflammatory process. Two of these cytokines are pro-inflammatory (IL-6 and CCL2), while IL-10 is anti-inflammatory. We speculate that the difference in the concentrations of this cytokine between SP and NSA patients may reflect greater levels of macrophage activity in the peritoneal cavities of dogs with SP compared to dogs with NSA. Future investigations might assess macrophage counts in SP and NSA patients to evaluate this hypothesis. Interleukin-10 is involved in down-regulating macrophage and helper T-cell function and is a key immunoregulator during infection that may mitigate tissue damage from excessive cytotoxicity. It has been demonstrated that IL-10 concentrations correlate with pathogen burden in some disease processes (79), which may in part explain its discriminating ability in the present study.
The only significant difference in blood biomarker concentrations was for CCL2, which was significantly greater in dogs with SP compared to NSA. In canine studies modeling sepsis through injection of lipopolysaccharide (LPS), treated dogs had greater blood IL-6, IL-10, TNF-α, and KC-like concentrations up to 4-h post-injection and greater CCL2 up to 24-h post-injection, when compared to placebo-treated dogs (34). Other studies have demonstrated that CCL2 may be prognostic in dogs with IMHA (71), lymphoma (80), and babesiosis (81).
In this study, the predominant sources of infection in dogs with SP were the gastrointestinal and biliary systems, findings that are consistent with previous reports (3, 82, 83). The predominant sources of effusion in dogs with NSA were the urinary tract and the biliary system. Both bile peritonitis and uroperitoneum can lead to sterile or septic abdominal effusions. The presence of sepsis in addition to the chemical peritonitis that results from these conditions might influence treatment decisions and could potentially affect prognosis. Although bile peritonitis and uroperitoneum can be identified using measurements of bilirubin or potassium, these biochemical tests do not distinguish septic from non-septic effusions, which suggests there is still a need for reliable biomarkers to distinguish SP from NSA. The case fatality rate (including euthanasia) in this population of dogs with SP was 61.1%, consistent with previous findings (2, 4). The case fatality rate for dogs with NSP was 44.4%. While both populations had comparable APPLEfast scores the overall case fatality rates are higher for both populations than would be expected based on the APPLEfast scores alone. There are several potential explanations for this. Some patients in the SP group may have been euthanized for a perceived poor prognosis, yet might have survived with intensive care. Some of the patients in the NSA group may have been euthanized due to current illness secondary to an underlying terminal disease (e.g., cancer). Likewise, while most patients in the study were referred to us it is possible that financial considerations played a role in euthanasia decisions. It is also possible that differences between our institution and the center where the APPLE score was developed may also explain part of this discrepancy.
Previous studies in mouse models and in people suggest that in SP, inflammatory biomarker concentrations and markers of NET formation are greater in the peritoneal effusion than in blood, while glucose concentrations are lower (16, 17, 84–86). In dogs with SP in the present study, multiple biomarker concentrations were significantly different between effusion and blood including glucose, cfDNA, nucleosomes, PCT, CCL2, IL-6, IL-10, and KC-like. In dogs with NSA, only IL-6 and KC-like concentrations were different between blood and effusion. While the innate immune responses to pathogen- and damage-associated molecular patterns may be qualitatively similar (33, 87, 88), the response incited by bacteria may be more intense than that incited by tissue damage alone. It could also suggest that adaptive immune responses and collaborative interactions between leukocytes reacting to the presence of bacteria leads to a distinct, or a greater inflammatory response than tissue damage alone. The high concentrations of cfDNA and nucleosomes in the peritoneal effusions of SP dogs is also very suggestive that NET release was occurring in the peritoneal cavities of these dogs, as has been previously reported (89). The increased blood PCT concentrations relative to those in effusion identified in the present study is consistent with previous findings of high PCT concentrations in dogs with sepsis (20, 21). Comparably, a study in people with cirrhosis also identified increased serum PCT concentrations in those patients with SP (26). Our findings are also consistent with a subsequent study, also in cirrhotic people, which demonstrated that blood-effusion PCT gradients were not diagnostic of SP (27).
The present study is not without limitations. The required sample size for this study was estimated based on pilot data on cfDNA concentrations only. This may have increased the risk of a type II error in our comparisons of other biomarkers between SP and NSA populations. Our study population included both primary emergency and secondary referral cases, and thus some dogs in the present study received treatment from other veterinarians prior to referral and study enrollment. These therapies included intravenous fluid therapy and antimicrobials that might have altered biomarker concentrations. Given the variable nature of type and timing of these prior therapies, it is difficult to account for these interventions in the analyses of the biomarker concentrations and it remains possible that prior therapy could both falsely increase and falsely decrease biomarker concentrations. It is not known how rapidly blood and effusion concentrations change or equilibrate in response to such therapies, making it is difficult to assess the effect of prior interventions on our results. The most discriminating biomarker was effusion lactate concentration, which may have been less affected by therapies administered before study enrollment and sample collection. While gastrointestinal perforation typically leads to SP, there may be a delay between the occurrence of perforation and the characteristic inflammatory response due to the leakage of bacteria and ingesta into the abdomen. In cases where perforation has only very recently occurred the utility of biomarkers of the inflammatory response for the diagnosis of SP might be reduced. The timing of any suspected gastrointestinal perforation should be considered when evaluating the results of biomarker analyses.
Most blood samples were obtained from the cephalic vein at the time of catheter placement, but some samples were drawn by direct venipuncture or from central venous catheters. It is possible that these differences in sampling location might have influenced biomarker concentrations, in particular lactate. The effects of the variability on biomarker concentrations was likely small, but could have been sufficient to alter the calculated gradients. Uniform, consistent cytologic evaluation of peritoneal fluid samples was not performed as part of the present study. Evaluation of peritoneal fluid samples was typically performed by ER personnel with various levels of training, which could have led to false negatives in some patients with NSA.
The SIRS criteria were used to screen patients for this study because they provide rapid, simple and objective identification of the potential presence of systemic inflammation. In people it is recognized that these criteria are neither sensitive or specific for sepsis (90, 91). They should only be applied to patients with compatible history, clinical signs, and physical examination findings that raise concern for sepsis or another disease process likely to cause a severe physiologic stress response. If the SIRS criteria are applied without this context specificity then they cease to be informative. In human medicine sepsis was recently redefined using a data driven approach to enhance the specificity of the clinical criteria used to identify the syndrome. These Sepsis-3 definitions incorporate a rapid organ failure assessment score (92), that has yet to be robustly examined in veterinary medicine. An equivalent redefinition of sepsis in veterinary medicine had not been undertaken and hence the SIRS criteria remain the best available strategy (93), and have been used in multiple studies of canine sepsis and of septic peritonitis specifically (6, 14, 94, 95). As such, they were considered to be a necessary component of the identification of the SP and NSA populations in the present study. Use of the SIRS criteria facilitated identification of a control population of dogs with similar physical examination parameters but NSA rather than SP, such as dogs with pancreatitis that can be difficult to distinguish clinically from SP.
The biomarker assays used here have been validated or widely used to measure concentrations in blood samples in dogs, but only one of these assays has been specifically validated for use on effusion samples (62). Other groups have used the same assays to measure concentrations of markers including glucose, lactate, and NT-proCNP in both effusion and blood samples (39, 40, 62). In addition, multiple studies in humans have measured cytokines in peritoneal fluid samples using comparable assays to those used here (16, 96–100). The effusion samples we analyzed were the supernatants of the peritoneal fluid, centrifuged and separated prior to storage and hence are ultrafiltrates of plasma modified by local effects such as glucose consumption or lactate addition. Validation of the assays used on abdominal fluid samples was not performed in this study and represents a significant limitation to our data. We cannot exclude the possibility that matrix effects or the presence of interfering substances could have affected our results in unpredictable ways. Our data should be considered preliminary until such comprehensive validation work is conducted.
In the present study, the NSA group included a mixture of underlying disease processes with diverse pathophysiology. It is possible that the results of the present study might be different if a single cause of SP such as intestinal perforation had been compared with a single cause of NSA such as pancreatitis. Likewise, the biomarkers evaluated here might perform differently if direct comparisons of septic uroperitoneum or bile peritonitis vs. sterile uroperitoneum or sterile bile peritonitis had been conducted. The present study measured blood and effusion biomarker concentrations at a single time point only and likely at different time points within the disease process for different patients. Our conclusions about the diagnostic utility of these biomarkers are based on these single time point observations only. Biomarker concentrations change over the time course of disease and had measurements had been performed at other times distinct conclusions about the utility of specific biomarkers might have been reached. The present study enrolled client-owned dogs with naturally occurring disease and hence it was not feasible to standardize the timing of sample collection or to collect serial peritoneal fluid samples from patients with septic peritonitis. Our findings are also generalizable to other real-world settings where samples would likely be collected at the time of presentation or when the peritoneal fluid was first identified.
In conclusion, the results of this study support the current practice of measurement of effusion lactate concentrations for the discrimination of SP from NSA. It should be recognized that no single biomarker is completely discriminating for SP and hence no single concentration cut-off offers 100% sensitivity and specificity. Measurement of multiple biomarkers in blood and effusion might provide a more accurate identification of SP. Several novel biomarkers including pro- and anti-inflammatory cytokines and markers of NET formation may also be of value in distinguishing SP from NSA, but confirmation of those findings in other populations is warranted before they can be recommended. Future studies evaluating biomarker concentrations in blood or fluid for the diagnosis of sepsis will need to carefully select the control populations in order to adequately test the discriminating ability of the biomarker in real-world clinically relevant scenarios.
Data Availability
The datasets generated for this study are available on request to the corresponding author.
Ethics Statement
All samples analyzed in this study were collected from dogs managed at the participating veterinary teaching hospital as part of studies approved by the local Institutional Animal Care and Use Committees (IACUC), and undertaken under written informed client consent (Cornell IACUC 2014-0053).
Author Contributions
PM assisted with study design, collected, and analyzed data and co-wrote the manuscript. RG designed the study, collected, and analyzed data and co-wrote the manuscript. Both authors contributed to, read and approved the final manuscript.
Funding
This work was funded, in part, by a resident research grant from the Cornell University College of Veterinary Medicine.
Conflict of Interest Statement
The authors declare that the research was conducted in the absence of any commercial or financial relationships that could be construed as a potential conflict of interest.
Supplementary Material
The Supplementary Material for this article can be found online at: https://www.frontiersin.org/articles/10.3389/fvets.2019.00208/full#supplementary-material
Supplementary Table 1. A summary of the demographics and physical examination characteristics of the two patient populations septic peritonitis (SP) and non-septic ascites (NSA).
Abbreviations
APPLE, acute patient physiologic and laboratory evaluation; aPTT, activated partial thromboplastin time; AU, arbitrary unit; AUROC, area under the ROC curve; CCL2, C-C Motif Chemokine Ligand-2; cfDNA, cell-free DNA; CI, confidence interval; CXCL8, chemokine C-X-C motif ligand 8; IL, interleukin; IQR, interquartile range; KC-Like, keratinocyte chemoattractant-like; MCP-1, monocyte chemoattractant protein-1; NET, neutrophil extracellular trap; NSA, non-septic ascites; NT-proCNP, amino-terminal propeptide of C-type natriuretic peptide; PCT, procalcitonin; PRR, pattern recognition receptor; PT, prothrombin time; rcf, relative centrifugal force; ROC, receiver-operating characteristic; SIRS, systemic inflammatory response syndrome; SP, septic peritonitis.
References
1. Ragetly GR, Bennett RA, Ragetly CA. Septic peritonitis: etiology, pathophysiology, and diagnosis. Compend Contin Educ Vet. (2011) 33:e1–6.
2. Dayer T, Howard J, Spreng D. Septic peritonitis from pyloric and non-pyloric gastrointestinal perforation: prognostic factors in 44 dogs and 11 cats. J Small Anim Pract. (2013) 54:625–9. doi: 10.1111/jsap.12151
3. Cortellini S, Seth M, Kellett-Gregory LM. Plasma lactate concentrations in septic peritonitis: a retrospective study of 83 dogs (2007–2012). J Vet Emerg Crit Care. (2015) 25:388–95. doi: 10.1111/vec.12234
4. Davis DJ, Demianiuk RM, Musser J, Podsiedlik M, Hauptman J. Influence of preoperative septic peritonitis and anastomotic technique on the dehiscence of enterectomy sites in dogs: a retrospective review of 210 anastomoses. Vet Surg. (2018) 47:125–9. doi: 10.1111/vsu.12704
5. Lanz OI, Ellison GW, Bellah JR, Weichman G, VanGilder J. Surgical treatment of septic peritonitis without abdominal drainage in 28 dogs. J Am Anim Hosp Assoc. (2001) 37:87–92. doi: 10.5326/15473317-37-1-87
6. Bentley AM, Mayhew PD, Culp WT, Otto CM. Alterations in the hemostatic profiles of dogs with naturally occurring septic peritonitis. J Vet Emerg Crit Care. (2013) 23:14–22. doi: 10.1111/vec.12013
7. Ben Oz J, Aroch I, Segev G. Increased ratio of peritoneal effusion-to-serum potassium concentration in a dog with gastric perforation. J Vet Emerg Crit Care. (2016) 26:793–7. doi: 10.1111/vec.12453
8. Fitzgerald E, Barfield D, Lee KC, Lamb CR. Clinical findings and results of diagnostic imaging in 82 dogs with gastrointestinal ulceration. J Small Anim Pract. (2017) 58:211–8. doi: 10.1111/jsap.12631
9. Pierrakos C, Vincent JL. Sepsis biomarkers: a review. Crit Care. (2010) 14:R15. doi: 10.1186/cc8872
10. Vincent JL, Beumier M. Diagnostic and prognostic markers in sepsis. Expert Rev Anti Infect Ther. (2013) 11:265–75. doi: 10.1586/eri.13.9
11. Jitpean S, Strom-Holst B, Emanuelson U, Hoglund OV, Pettersson A, Alneryd-Bull C, et al. Outcome of pyometra in female dogs and predictors of peritonitis and prolonged postoperative hospitalization in surgically treated cases. BMC Vet Res. (2014) 10:6. doi: 10.1186/1746-6148-10-6
12. Gebhardt C, Hirschberger J, Rau S, Arndt G, Krainer K, Schweigert FJ, et al. Use of C-reactive protein to predict outcome in dogs with systemic inflammatory response syndrome or sepsis. J Vet Emerg Crit Care. (2009) 19:450–8. doi: 10.1111/j.1476-4431.2009.00462.x
13. Karlsson I, Wernersson S, Ambrosen A, Kindahl H, Sodersten F, Wang L, et al. Increased concentrations of C-reactive protein but not high-mobility group box 1 in dogs with naturally occurring sepsis. Vet Immunol Immunopathol. (2013) 156:64–72. doi: 10.1016/j.vetimm.2013.09.011
14. Cortellini S, Pelligand L, Syme H, Chang YM, Adamantos S. Neutrophil gelatinase-associated lipocalin in dogs with sepsis undergoing emergency laparotomy: a prospective case-control study. J Vet Intern Med. (2015) 29:1595–602. doi: 10.1111/jvim.13638
15. Moreira VG, Prieto B, Rodriguez JS, Alvarez FV. Usefulness of cell-free plasma DNA, procalcitonin and C-reactive protein as markers of infection in febrile patients. Ann Clin Biochem. (2010) 47:253–8. doi: 10.1258/acb.2010.009173
16. Yamamoto T, Umegae S, Matsumoto K, Saniabadi AR. Peritoneal cytokines as early markers of peritonitis following surgery for colorectal carcinoma: a prospective study. Cytokine. (2011) 53:239–42. doi: 10.1016/j.cyto.2010.10.006
17. Wright EC, Connolly P, Vella M, Moug S. Peritoneal fluid biomarkers in the detection of colorectal anastomotic leaks: a systematic review. Int J Colorectal Dis. (2017) 32:935–45. doi: 10.1007/s00384-017-2799-3
18. Letendre J-A, Goggs R. Determining prognosis in canine sepsis by bedside measurement of cell-free DNA and nucleosomes. J Vet Emerg Crit Care. (2018) 28:503–11. doi: 10.1111/vec.12773
19. Goggs R, Letendre JA. Evaluation of the host cytokine response in dogs with sepsis and non-infectious systemic inflammatory response syndrome. J Vet Emerg Crit Care. (in press).
20. Goggs R, Milloway M, Troia R, Giunti M. Plasma procalcitonin concentrations are increased in dogs with sepsis. Vet Rec Open. (2018) 5:e000255. doi: 10.1136/vetreco-2017-000255
21. Troia R, Giunti M, Goggs R. Plasma procalcitonin concentrations predict organ dysfunction and outcome in dogs with sepsis. BMC Vet Res. (2018) 14:111. doi: 10.1186/s12917-018-1427-y
22. Reinhart K, Meisner M. Biomarkers in the critically ill patient: procalcitonin. Crit Care Clin. (2011) 27:253–63. doi: 10.1016/j.ccc.2011.01.002
23. Liappis AP, Gibbs KW, Nylen ES, Yoon B, Snider RH, Gao B, et al. Exogenous procalcitonin evokes a pro-inflammatory cytokine response. Inflamm Res. (2011) 60:203–7. doi: 10.1007/s00011-010-0255-8
24. Sexton PM, Christopoulos G, Christopoulos A, Nylen ES, Snider RH Jr, Becker KL. Procalcitonin has bioactivityat calcitonin receptor family complexes: potential mediator implications in sepsis. Crit Care Med. (2008) 36:1637–40. doi: 10.1097/CCM.0b013e318170a554
25. Hoffmann G, Totzke G, Seibel M, Smolny M, Wiedermann FJ, Schobersberger W. In vitro modulation of inducible nitric oxide synthase gene expression and nitric oxide synthesis by procalcitonin. Crit Care Med. (2001) 29:112–6. doi: 10.1097/00003246-200101000-00023
26. Viallon A, Zeni F, Pouzet V, Lambert C, Quenet S, Aubert G, et al. Serum and ascitic procalcitonin levels in cirrhotic patients with spontaneous bacterial peritonitis: diagnostic value and relationship to pro-inflammatory cytokines. Intensive Care Med. (2000) 26:1082–8. doi: 10.1007/s001340051321
27. Lesinska M, Hartleb M, Gutkowski K, Nowakowska-Dulawa E. Procalcitonin and macrophage inflammatory protein-1 beta (MIP-1beta) in serum and peritoneal fluid of patients with decompensated cirrhosis and spontaneous bacterial peritonitis. Adv Med Sci. (2014) 59:52–6. doi: 10.1016/j.advms.2013.07.006
28. Lichtenstein AV, Melkonyan HS, Tomei LD, Umansky SR. Circulating nucleic acids and apoptosis. Ann N Y Acad Sci. (2001) 945:239–49. doi: 10.1111/j.1749-6632.2001.tb03892.x
29. Hamaguchi S, Akeda Y, Yamamoto N, Seki M, Yamamoto K, Oishi K, et al. Origin of circulating free DNA in sepsis: analysis of the CLP mouse model. Med Inflamm. (2015) 2015:614518. doi: 10.1155/2015/614518
30. Margraf S, Logters T, Reipen J, Altrichter J, Scholz M, Windolf J. Neutrophil-derived circulating free DNA (cf-DNA/NETs): a potential prognostic marker for posttraumatic development of inflammatory second hit and sepsis. Shock. (2008) 30:352–8. doi: 10.1097/SHK.0b013e31816a6bb1
31. Holdenrieder S, Stieber P. Clinical use of circulating nucleosomes. Crit Rev Clin Lab Sci. (2009) 46:1–24. doi: 10.1080/10408360802485875
32. Marsman G, Zeerleder S, Luken BM. Extracellular histones, cell-free DNA, or nucleosomes: differences in immunostimulation. Cell Death Dis. (2016) 7:e2518. doi: 10.1038/cddis.2016.410
33. Pisetsky DS. The origin and properties of extracellular DNA: from PAMP to DAMP. Clin Immunol. (2012) 144:32–40. doi: 10.1016/j.clim.2012.04.006
34. Deitschel SJ, Kerl ME, Chang CH, DeClue AE. Age-associated changes to pathogen-associated molecular pattern-induced inflammatory mediator production in dogs. J Vet Emerg Crit Care. (2010) 20:494–502. doi: 10.1111/j.1476-4431.2010.00565.x
35. Chaudhry H, Zhou J, Zhong Y, Ali MM, McGuire F, Nagarkatti PS, et al. Role of cytokines as a double-edged sword in sepsis. In Vivo. (2013) 27:669–84.
36. Tanaka T, Narazaki M, Kishimoto T. IL-6 in inflammation, immunity, and disease. Cold Spring Harb Perspect Biol. (2014) 6:a016295. doi: 10.1101/cshperspect.a016295
37. Takahashi M, Galligan C, Tessarollo L, Yoshimura T. Monocyte chemoattractant protein-1 (MCP-1), not MCP-3, is the primary chemokine required for monocyte recruitment in mouse peritonitis induced with thioglycollate or zymosan A. J Immunol. (2009) 183:3463–71. doi: 10.4049/jimmunol.0802812
38. Deshmane SL, Kremlev S, Amini S, Sawaya BE. Monocyte chemoattractant protein-1 (MCP-1): an overview. J Interferon Cytokine Res. (2009) 29:313–26. doi: 10.1089/jir.2008.0027
39. Bonczynski JJ, Ludwig LL, Barton LJ, Loar A, Peterson ME. Comparison of peritoneal fluid and peripheral blood pH, bicarbonate, glucose, and lactate concentration as a diagnostic tool for septic peritonitis in dogs and cats. Vet Surg. (2003) 32:161–6. doi: 10.1053/jvet.2003.50005
40. Levin GM, Bonczynski JJ, Ludwig LL, Barton LJ, Loar AS. Lactate as a diagnostic test for septic peritoneal effusions in dogs and cats. J Am Anim Hosp Assoc. (2004) 40:364–71. doi: 10.5326/0400364
41. Mouat EE, Davis GJ, Drobatz KJ, Wallace KA. Evaluation of data from 35 dogs pertaining to dehiscence following intestinal resection and anastomosis. J Am Anim Hosp Assoc. (2014) 50:254–63. doi: 10.5326/JAAHA-MS-6111
42. Nestor DD, McCullough SM, Schaeffer DJ. Biochemical analysis of neoplastic versus nonneoplastic abdominal effusions in dogs. J Am Anim Hosp Assoc. (2004) 40:372–5. doi: 10.5326/0400372
43. Koenig A, Verlander LL. Usefulness of whole blood, plasma, peritoneal fluid, and peritoneal fluid supernatant glucose concentrations obtained by a veterinary point-of-care glucometer to identify septic peritonitis in dogs with peritoneal effusion. J Am Vet Med Assoc. (2015) 247:1027–32. doi: 10.2460/javma.247.9.1027
44. Johnson CC, Baldessarre J, Levison ME. Peritonitis: update on pathophysiology, clinical manifestations, and management. Clin Infect Dis. (1997) 24:1035–45. doi: 10.1086/513658
45. Laurin LP, Brissette MJ, Lepage S, Cailhier JF. Regulation of experimental peritonitis: a complex orchestration. Nephron Exp Nephrol. (2012) 120:e41–6. doi: 10.1159/000334169
46. Thompson LJ, Seshadri R, Raffe MR. Characteristics and outcomes in surgical management of severe acute pancreatitis: 37 dogs (2001-2007). J Vet Emerg Crit Care. (2009) 19:165–73. doi: 10.1111/j.1476-4431.2009.00401.x
47. Ludwig LL, McLoughlin MA, Graves TK, Crisp MS. Surgical treatment of bile peritonitis in 24 dogs and 2 cats: a retrospective study (1987-1994). Vet Surg. (1997) 26:90–8. doi: 10.1111/j.1532-950X.1997.tb01470.x
48. Stafford JR, Bartges JW. A clinical review of pathophysiology, diagnosis, and treatment of uroabdomen in the dog and cat. J Vet Emerg Crit Care. (2013) 23:216–29. doi: 10.1111/vec.12033
49. Hauptman JG, Walshaw R, Olivier NB. Evaluation of the sensitivity and specificity of diagnostic criteria for sepsis in dogs. Vet Surg. (1997) 26:393–7. doi: 10.1111/j.1532-950X.1997.tb01699.x
50. Boysen SR, Lisciandro GR. The use of ultrasound for dogs and cats in the emergency room: AFAST and TFAST. Vet Clin North Am Small Anim Pract. (2013) 43:773–97. doi: 10.1016/j.cvsm.2013.03.011
51. McMurray J, Boysen S, Chalhoub S. Focused assessment with sonography in nontraumatized dogs and cats in the emergency and critical care setting. J Vet Emerg Crit Care. (2016) 26:64–73. doi: 10.1111/vec.12376
52. Platt SR, Radaelli ST, McDonnell JJ. The prognostic value of the modified glasgow coma scale in head trauma in dogs. J Vet Intern Med. (2001) 15:581–4. doi: 10.1111/j.1939-1676.2001.tb01594.x
53. Hayes G, Mathews K, Doig G, Kruth S, Boston S, Nykamp S, et al. The acute patient physiologic and laboratory evaluation (APPLE) score: a severity of illness stratification system for hospitalized dogs. J Vet Intern Med. (2010) 24:1034–47. doi: 10.1111/j.1939-1676.2010.0552.x
54. Thorneloe C, Bedard C, Boysen S. Evaluation of a hand-held lactate analyzer in dogs. Can Vet J. (2007) 48:283–8.
55. Acierno MJ, Mitchell MA. Evaluation of four point-of-care meters for rapid determination of blood lactate concentrations in dogs. J Am Vet Med Assoc. (2007) 230:1315–8. doi: 10.2460/javma.230.9.1315
56. Tas O, De Rooster H, Baert E, Doom MH, Duchateau L. The accuracy of the lactate pro hand-held analyser to determine blood lactate in healthy dogs. J Small Anim Pract. (2008) 49:504–8. doi: 10.1111/j.1748-5827.2008.00668.x
57. DeClue AE, Osterbur K, Bigio A, Sharp CR. Evaluation of serum NT-pCNP as a diagnostic and prognostic biomarker for sepsis in dogs. J Vet Intern Med. (2011) 25:453–9. doi: 10.1111/j.1939-1676.2011.0713.x
58. Bachmann K, Kutter A, Jud Schefer RS, Sigrist N. Determination of reference intervals and comparison of venous blood gas parameters using a standard and nonstandard collection method in 51 dogs. Schweiz Arch Tierheilkd. (2018) 160:163–70. doi: 10.17236/sat00150
59. Karlsson I, Hagman R, Johannisson A, Wang L, Karlstam E, Wernersson S. Cytokines as immunological markers for systemic inflammation in dogs with pyometra. Reprod Domest Anim. (2012) 47 Suppl 6:337–41. doi: 10.1111/rda.12034
60. Letendre JA, Goggs R. Measurement of plasma cell-free DNA concentrations in dogs with sepsis, trauma, and neoplasia. J Vet Emerg Crit Care. (2017) 27:307–14. doi: 10.1111/vec.12592
61. Smith SA, Lawson CM, McMichael MA, Jung K, O'Brien M, Achiel R. Evaluation of assays for quantification of DNA in canine plasma as an indirect marker of NETosis. Vet Clin Pathol. (2017) 46:278–86. doi: 10.1111/vcp.12478
62. Guieu LV, Bersenas AM, Holowaychuk MK, Brisson BA, Weese JS. Serial Evaluation of abdominal fluid and serum amino-terminal pro-C-type natriuretic peptide in dogs with septic peritonitis. J Vet Intern Med. (2015) 29:1300–6. doi: 10.1111/jvim.13575
63. Yu DH, Nho DH, Song RH, Kim SH, Lee MJ, Nemzek JA, et al. High-mobility group box 1 as a surrogate prognostic marker in dogs with systemic inflammatory response syndrome. J Vet Emerg Crit Care. (2010) 20:298–302. doi: 10.1111/j.1476-4431.2010.00539.x
64. Goggs R, Letendre JA. High mobility group box-1 and Pro-inflammatory cytokines are increased in dogs after trauma but do not predict survival. Front Vet Sci. (2018) 5:179. doi: 10.3389/fvets.2018.00179
65. Floras AN, Holowaychuk MK, Bienzle D, Bersenas AM, Sharif S, Harvey T, et al. N-terminal pro-C-natriuretic peptide and cytokine kinetics in dogs with endotoxemia. J Vet Intern Med. (2014) 28:1447–53. doi: 10.1111/jvim.12409
66. Karlsson I, Hagman R, Johannisson A, Wang L, Sodersten F, Wernersson S. Multiplex cytokine analyses in dogswith pyometra suggest involvement of KC-like chemokine in canine bacterial sepsis. Vet Immunol Immunopathol. (2016) 170:41–6. doi: 10.1016/j.vetimm.2016.01.005
67. Jeffery U, Kimura K, Gray R, Lueth P, Bellaire B, LeVine D. Dogs cast NETs too: Canine neutrophil extracellular traps in health and immune-mediated hemolytic anemia. Vet Immunol Immunopathol. (2015) 168:262–8. doi: 10.1016/j.vetimm.2015.10.014
68. Letendre J-A, Goggs R. Concentrations of plasma nucleosomes but not Cell-free DNA are prognostic in dogs following trauma. Front Vet Sci. (2018) 5:180. doi: 10.3389/fvets.2018.00180
69. Lawson C, Smith SA, O'Brien M, McMichael M. Neutrophil extracellular traps in plasma from dogs with immune-mediated hemolytic anemia. J Vet Intern Med. (2018) 32:128–34. doi: 10.1111/jvim.14881
70. Bauquier JR, Forbes G, Nath L, Tudor E, Bailey SR. Plasma HMGB-1 and Nucleosome concentrations in horses with colic and healthy horses. J Vet Intern Med. (2016) 30:260–8. doi: 10.1111/jvim.13811
71. Kjelgaard-Hansen M, Goggs R, Wiinberg B, Chan DL. Use of serum concentrations of interleukin-18 and monocyte chemoattractant protein-1 as prognostic indicators in primary immune-mediated hemolytic anemia in dogs. J Vet Intern Med. (2011) 25:76–82. doi: 10.1111/j.1939-1676.2010.0642.x
73. Hanley JA, McNeil BJ. The meaning and use of the area under a receiver operating characteristic (ROC) curve. Radiology. (1982) 143:29–36. doi: 10.1148/radiology.143.1.7063747
74. Hanley JA, McNeil BJ. A method of comparing the areas under receiver operating characteristic curves derived from the same cases. Radiology. (1983) 148:839–43. doi: 10.1148/radiology.148.3.6878708
75. Kumar A, Roberts D, Wood KE, Light B, Parrillo JE, Sharma S, et al. Duration of hypotension before initiation of effective antimicrobial therapy is the critical determinant of survival in human septic shock. Crit Care Med. (2006) 34:1589–96. doi: 10.1097/01.CCM.0000217961.75225.E9
76. Uittenbogaard AJ, de Deckere ER, Sandel MH, Vis A, Houser CM, de Groot B. Impact of the diagnostic process on the accuracy of source identification and time to antibiotics in septic emergency department patients. Eur J Emerg Med. (2014) 21:212–9. doi: 10.1097/MEJ.0b013e3283619231
77. Haji-Michael PG, Ladriere L, Sener A, Vincent JL, Malaisse WJ. Leukocyte glycolysis and lactate output in animal sepsis and ex vivo human blood. Metabolism. (1999) 48:779–85. doi: 10.1016/S0026-0495(99)90179-8
78. Naldini A, Carraro F, Silvestri S, Bocci V. Hypoxia affects cytokine production and proliferative responses by human peripheral mononuclear cells. J Cell Physiol. (1997) 173:335–42.
79. Couper KN, Blount DG, Riley EM. IL-10: the master regulator of immunity to infection. J Immunol. (2008) 180:5771–7. doi: 10.4049/jimmunol.180.9.5771
80. Perry JA, Thamm DH, Eickhoff J, Avery AC, Dow SW. Increased monocyte chemotactic protein-1 concentration and monocyte count independently associate with a poor prognosis in dogs with lymphoma. Vet Comp Oncol. (2011) 9:55–64. doi: 10.1111/j.1476-5829.2010.00235.x
81. Goddard A, Leisewitz AL, Kjelgaard-Hansen M, Kristensen AT, Schoeman JP. Excessive pro-inflammatory serum cytokine concentrations in virulent canine babesiosis. PLoS ONE. (2016) 11:e0150113. doi: 10.1371/journal.pone.0150113
82. Dickinson AE, Summers JF, Wignal J, Boag AK, Keir I. Impact of appropriate empirical antimicrobial therapy on outcome of dogs with septic peritonitis. J Vet Emerg Crit Care. (2015) 25:152–9. doi: 10.1111/vec.12273
83. Barfield DM, Tivers MS, Holahan M, Welch K, House A, Adamantos SE. Retrospective evaluation of recurrent secondary septic peritonitis in dogs (2000-2011): 41 cases. J Vet Emerg Crit Care. (2016) 26:281–7. doi: 10.1111/vec.12413
84. Haecker FM, Fasler-Kan E, Manasse C, Fowler B, Hertel R, von Schweinitz D. Peritonitis in childhood: clinical relevance of cytokines in the peritoneal exudate. Eur J Pediatr Surg. (2006) 16:94–9. doi: 10.1055/s-2006-924049
85. Barth CR, Funchal GA, Luft C, de Oliveira JR, Porto BN, Donadio MV. Carrageenan-induced inflammation promotes ROS generation and neutrophil extracellular trap formation in a mouse model of peritonitis. Eur J Immunol. (2016) 46:964–70. doi: 10.1002/eji.201545520
86. Bilyy R, Fedorov V, Vovk V, Leppkes M, Dumych T, Chopyak V, et al. Neutrophil extracellular traps form a barrier between necrotic and viable areas in acute abdominal inflammation. Front Immunol. (2016) 7:424. doi: 10.3389/fimmu.2016.00424
87. Ito T. PAMPs and DAMPs as triggers for DIC. J Intensive Care. (2014) 2:67. doi: 10.1186/s40560-014-0065-0
88. Lewis DH, Chan DL, Pinheiro D, Armitage-Chan E, Garden OA. The immunopathology of sepsis: pathogen recognition, systemic inflammation, the compensatory anti-inflammatory response, and regulatory T cells. J Vet Intern Med. (2012) 26:457–82. doi: 10.1111/j.1939-1676.2012.00905.x
89. Li RHL, Johnson LR, Kohen C, Tablin F. A novel approach to identifying and quantifying neutrophil extracellular trap formation in septic dogs using immunofluorescence microscopy. BMC Vet Res. (2018) 14:210. doi: 10.1186/s12917-018-1523-z
90. Kaukonen KM, Bailey M, Pilcher D, Cooper DJ, Bellomo R. Systemic inflammatory response syndrome criteria in defining severe sepsis. N Engl J Med. (2015) 372:1629–38. doi: 10.1056/NEJMoa1415236
91. Churpek MM, Zadravecz FJ, Winslow C, Howell MD, Edelson DP. Incidence and prognostic value of the systemic inflammatory response syndrome and organ dysfunctions in ward patients. Am J Respir Crit Care Med. (2015) 192:958–64. doi: 10.1164/rccm.201502-0275OC
92. Singer M, Deutschman CS, Seymour CW, Shankar-Hari M, Annane D, Bauer M, et al. The third international consensus definitions for sepsis and septic shock (Sepsis-3). JAMA. (2016) 315:801–10. doi: 10.1001/jama.2016.0287
93. Sharp CR. Systemic inflammatory response syndrome, sepsis, and multiple organ dysfunction syndrome. In: Drobatz KJ, Hopper K, Rozanski E, Silverstein DC, editors. Textbook of Small Animal Emergency Medicine. Vol. 2. 1st ed. Hoboken, NJ: Wiley Blackwell (2019). p. 1030–7. doi: 10.1002/9781119028994.ch159
94. Staatz AJ, Monnet E, Seim HB III. Open peritoneal drainage versus primary closure for the treatment of septic peritonitis in dogs and cats: 42 cases (1993-1999). Vet Surg. (2002) 31:174–80. doi: 10.1053/jvet.2002.31043
95. Hodgson N, Llewellyn EA, Schaeffer DJ. Utility and prognostic significance of neutrophil-to-lymphocyte ratio in dogs with septic peritonitis. J Am Anim Hosp Assoc. (2018) 54:351–9. doi: 10.5326/JAAHA-MS-6808
96. van Berge Henegouwen MI, van der Poll T, van Deventer SJ, Gouma DJ. Peritoneal cytokine release after elective gastrointestinal surgery and postoperative complications. Am J Surg. (1998) 175:311–6. doi: 10.1016/S0002-9610(98)00010-5
97. Herwig R, Glodny B, Kuhle C, Schluter B, Brinkmann OA, Strasser H, et al. Early identification of peritonitis by peritoneal cytokine measurement. Dis Colon Rectum. (2002) 45:514–21. doi: 10.1007/s10350-004-6231-z
98. Bertram P, Junge K, Schachtrupp A, Gotze C, Kunz D, Schumpelick V. Peritoneal release of TNFalpha and IL-6 after elective colorectal surgery and anastomotic leakage. J Invest Surg. (2003) 16:65–9. doi: 10.1080/08941930390194398
99. Jansson K, Redler B, Truedsson L, Magnuson A, Matthiessen P, Andersson M, et al. Intraperitoneal cytokine response after major surgery: higher postoperative intraperitoneal versus systemic cytokine levels suggest the gastrointestinal tract as the major source of the postoperative inflammatory reaction. Am J Surg. (2004) 187:372–7. doi: 10.1016/j.amjsurg.2003.12.019
100. Salgado W Jr, de Queiroz Cunha F, dos Santos JS, Barbosa Nonino-Borges C, Kumar Sankarankutty A, de Castro ESO Jr, et al. Early identification of infectious complications in bariatric surgery by the determination of peritoneal and systemic cytokines. Obes Surg. (2009) 19:867–72. doi: 10.1007/s11695-009-9851-5
Keywords: sepsis, biomarker, effusion, gradient, lactate
Citation: Martiny P and Goggs R (2019) Biomarker Guided Diagnosis of Septic Peritonitis in Dogs. Front. Vet. Sci. 6:208. doi: 10.3389/fvets.2019.00208
Received: 20 February 2019; Accepted: 12 June 2019;
Published: 27 June 2019.
Edited by:
Katja-Nicole Adamik, University of Bern, SwitzerlandReviewed by:
Rene Doerfelt, Ludwig-Maximilians Universität München, GermanyIvayla Yozova, Massey University, New Zealand
Copyright © 2019 Martiny and Goggs. This is an open-access article distributed under the terms of the Creative Commons Attribution License (CC BY). The use, distribution or reproduction in other forums is permitted, provided the original author(s) and the copyright owner(s) are credited and that the original publication in this journal is cited, in accordance with accepted academic practice. No use, distribution or reproduction is permitted which does not comply with these terms.
*Correspondence: Robert Goggs, ci5nb2dnc0Bjb3JuZWxsLmVkdQ==