 Jianzhong Wang1,2,3
 Benjamin K. Schneider3
 Jiao Xue1,2Pan Sun1,2Jicheng Qiu1,2
 Jonathan P. Mochel3*
 Xingyuan Cao1,2,4*
- 1Department of Veterinary Pharmacology and Toxicology, College of Veterinary Medicine, China Agricultural University, Beijing, China
- 2Laboratory of Quality & Safety Risk Assessment for Animal Products on Chemical Hazards (Beijing), Ministry of Agriculture and Rural Affairs, Beijing, China
- 3Biomedical Sciences, SMART Pharmacology, College of Veterinary Medicine, Iowa State University, Ames, IA, United States
- 4Laboratory of Detection for Veterinary Drug Residues and Illegal Additives, Ministry of Agriculture and Rural Affairs, Beijing, China
Ceftiofur (CEF) sodium is a third-generation broad-spectrum cephalosporin commonly used in an extra-label manner in dogs for the treatment of respiratory and urinary system infections. To contribute to the literature supporting CEF use in companion animals, we have developed a compartmental, non-linear mixed-effects (NLME) model of CEF pharmacokinetics in dogs (PK). We then used the mathematical model to predict (via Monte Carlo simulation) the duration of time for which plasma concentrations of CEF and its pharmacologically active metabolites remained above minimum inhibitory concentrations (respiratory tract Escherichia coli spp.). Twelve healthy beagle dogs were administered either 2.2 mg/kg ceftiofur-sodium (CEF-Na) intravenously (I.V) or 2.2 mg/kg CEF-Na subcutaneously (S.C). Plasma samples were collected over a period of 72 h post-administration. To produce a measurement of total CEF, both CEF and CEF metabolites were derivatized into desfuroylceftiofur acetamide (DCA) before analysis by UPLC-MS/MS. No adverse effects were reported after I.V or S.C dosing. The NLME PK models were parameterized using the stochastic approximation expectation maximization algorithm as implemented in Monolix 2018R2. A two-compartment mamillary model with first-order elimination and first-order S.C absorption best described the available kinetic data. Final parameter estimates indicate that CEF has a low systemic clearance (0.25 L/h/kg) associated with a low global extraction ratio E = 0.02) and a moderate volume of distribution (2.97 L/kg) in dogs. The absolute bioavailability after S.C administration was high (93.7%). Gender was determined to be a significant covariate in explaining the variability of S.C absorption. Our simulations predicted that a dose of 2.2 mg/kg CEF-Na S.C would produce median plasma concentrations of CEF of at least 0.5 μg/mL (MIC50) for ~30 h.
Introduction
Ceftiofur sodium (CEF-Na) is a third-generation broad-spectrum cephalosporin (β-lactam antibiotic) which is effective against Gram-positive, Gram-negative, anaerobic, and β-lactamase producing bacteria (1). CEF has been developed and approved for treating bacterial lung diseases in cattle (2), swine (3), and in horses (4). The pharmacokinetics (PK) of CEF has previously been described in cattle (5–8), camels (9), goats (10), horses (11), sheep (12), swine (1), alpacas (13), and rabbits (14).
The metabolism of ceftiofur is similar in rats (15), cattle (15), swine (16), horses (17), and dogs (18) and is characterized by rapid cleavage of the thioester bond to the active metabolite desfuroylceftiofur (DFC) and furoic acid after parenteral administration. Free DFC (which contains an intact β-lactam ring) is the primary microbiologically active metabolite of ceftiofur (6). It is further metabolized to disulfides and also bound to macromolecules in plasma and tissues which are DFC-glutathione disulfide, DFC-cysteine disulfide, 3,3-DFC-disulfide (DFC-dimer), and DFC-protein (19).
The PK of subcutaneous (S.C) CEF crystalline-free acid S.C (20) as well as the PK of CEF-Na S.C (18) have been previously reported in dogs. However, no detailed description of CEF-Na disposition kinetics after intravenous (I.V) dosing is currently available in dogs, which prevents a rigorous assessment of absolute bioavailability in this species. And, despite common off-label use of CEF-Na in veterinary clinics for canine respiratory disease, no formulation is currently approved for use in dogs. In-depth knowledge of the time-course of systemic CEF-Na concentrations will aid in the development of effective CEF-Na formulations for the treatment of canine respiratory and urinary system infections.
The primary aim of this study was to develop a PK model of CEF disposition kinetics in healthy dogs after CEF-Na I.V and CEF-Na S.C dosing. To produce data for model building, we administered either 2.2 mg/kg CEF-Na I.V or 2.2 mg/kg CEF-Na S.C to 12 healthy beagle dogs on two separate occasions. Non-linear mixed-effects (NLME) modeling was used for data analysis, to allow for simultaneous modeling of the I.V and S.C route. Another advantage of NLME modeling lies in the concurrent estimation of between-subject variability, within-subject (i.e., inter-occasion) variability, and individual covariate effects on drug pharmacokinetics (21–23). After model building and validation, the resulting fit was then used to predict (via Monte Carlo simulations) the duration of time for which plasma concentrations of CEF and its pharmacologically active metabolites remained above minimum inhibitory concentrations (MIC50, MIC90) for respiratory tract Escherichia coli spp.—the most common respiratory and urinary tract pathogens in dogs. Bordetella bronchiseptica and E. coli spp. are two of the most commonly reported pathogens in the respiratory and urinary tract of dogs according to previously published studies (20). In addition, ceftiofur is frequently prescribed off-label for infections of the respiratory and urinary tracts in dogs (20).
Materials and Methods
Drug Supply and Animals
The commercially available CEF-Na (Sterile Powder, 1 g; Lot No 1708004.2) used in this study was supplied by Qilu Animal Health Products Co., Ltd (Shandong, China). The CEF-Na powder was solubilized for injection by reconstituting the powder in 20 mL of bacteriostatic water for injection to each 1 g vial. Six male and 6 female healthy beagle dogs were included in the study design. Animals ages ranged between 1.5 and 2.5 years old, while dogs weighed between 9 and 12 kg. Dogs were acclimated to the experimental facilities for a minimum of 2 weeks before the start of the study. Dogs were housed individually in solid-floored pens lined with hardwood chip bedding. The animals were individually identified through a combination of cage label, sex, and a permanent ear tattoo. They were fed with a commercial standard feed (Medium-25, Royal Canin, Shanghai, China) and had free access to fresh water. Suitability for inclusion by the study veterinarian was evaluated by physical examination combined with measurement of hematology, clinical chemistry, and coagulation time parameters. General health observations were performed at least daily. The study protocols and experimental design were reviewed and approved by the Animal Use and Care Administrative Advisory Committee of the China Agricultural University (Beijing, PR China).
Drug Administration and Sample Collection
Dogs were randomly assigned to one of two dosing groups and received either 2.2 mg/kg CEF-Na I.V (cephalic vein) or 2.2 mg/kg CEF-Na S.C (behind the shoulders)—using a block design on sex to ensure that 3 males and 3 females were assigned to each study group. Approximately 2 mL of blood were collected from preplaced cephalic vein catheters or by venipuncture collected directly into heparinized tubes at 0, 0.08 (I.V group only), 0.25, 0.5, 0.75, 1, 1.5, 2, 3, 4, 6, 8, 12, 24, 36, 48, and 72 h post drug administration. The samples were then centrifuged at 2,280 g for 10 min. Plasma samples were then stored at −20°C before further analysis.
Analytical Methods
Ceftiofur Standards (purity ≥99%, HPLC grade) was supplied from Sigma–Aldrich (St. Louis, MO, USA). All other reagents and materials were analytical grade and supplied from Beijing Chemical Reagent Co., (Beijing, China). Ceftiofur and desfuroylceftiofur metabolites in plasma samples and standards were derivatized to desfuroylceftiofur acetamide (DCA) before analysis by UPLC-MS/MS. This protocol is a modification of existing standard operating procedures for CEF quantification adapted to canine samples (6). In this assay, dithioerythritol is used to convert ceftiofur and all desfuroylceftiofur metabolites containing an intact β-lactam ring to desfuroylceftiofur. Desfuroylceftiofur was then stabilized by derivatization with iodoacetamide to DCA and total CEF equivalent concentration (measured as DCA) was then quantified by UPLC-MS/MS (18). Briefly, the method uses dithioerythritol to cleave any macromolecule bound to desfuroylceftiofur in the serum. The sample was derivatized with iodoacetamide to produce desfuroylceftiofur acetamide. After derivatization, further cleanup was carried out on an Oasis HLB (hydrophilic-lipophilic balance) cartridge (3 cc, 60 mg). The eluate was then collected and evaporated using nitrogen gas. Afterward, the residues were finally dissolved in an aqueous acetonitrile solution. The supernatants were collected and filtrated through a 0.22-μm microbore cellulose membrane and analyzed through UPLC-MS/MS. The UPLC-MS/MS was a Water Quattro Premier. Separation of the compound was accomplished with a Phenomenex column (Kinetex 50 × 2.1 mm i.d. particle size = 2.6 μm, C18, 100 Å). The lower limit of quantification (LLOQ) for the analysis was set at 100 ng/mL. The calibration curves were in good linearity (R2 > 0.998) and ranged from 100 to 5,000 ng/mL. The inter-day and intra-day coefficients of variation—using 200, 1,000, and 4,000 ng/mL standards—were all below 7.58%, while the mean recoveries ranged from 82.15 to 119.44%. All analyses complied with established guidelines on bioanalytical method validation (24).
NLME Model Building and Evaluation
No outliers were identified after initial data exploration in Monolix datxplore (2018R2, Lixoft, France), such that all data could be pooled together for model building. CEF plasma concentration time-courses from I.V and S.C dosing were analyzed simultaneously using the stochastic approximation expectation maximization algorithm as implemented in Monolix 2018R2 (Lixoft, France). Individual model parameters were obtained by using the full posterior of the conditional distribution. NLME models were written as described by Sheiner and Ludden (25, 26):
Where yij is the observed concentration of CEF equivalent collected from individual i (of N total individuals) at time tij, and j indexes the individual sample times from 1 to ni. F(ϕi,tij) is the predicted concentration of CEF at time tij dependent on ϕi, the vector of individual parameters (e.g., volume of distribution, clearance). G(ϕi,tij, β)·εij is the residual error function of F(ϕi,tij) where εij is an independent random variable distributed in a standard normal distribution i.e., εij ~ N(0, 1). Each individual parameter θi∈ϕi was modeled as a combination of the population mean μ (i.e., θpop) and log-normally distributed error ηi i.e., log(θ)~ N(log (μ) ~ηi).
Convergence of the SAEM algorithm was evaluated by inspection of the stability of the fixed- and random-effect parameters search as well as the precision of parameter estimates—defined via their relative standard error (RSE). Standard goodness-of-fit diagnostic plots, including individual predictions vs. observations, individual weighted residuals (IWRES), and predictions distribution were used to assess the performances of the candidate models. Normality of the random effects was assessed using the Shapiro–Wilk test as well as inspection of the full posterior distribution of random effects and residuals. Selection criteria between competing structural models included the Bayesian information criteria (BIC) and the precision of the model parameter estimates. The BIC was selected over the Akaike Information Criterion (AIC) as it tends to favor more parsimonious models (27).
Handling of Below Limit of Quantification (BLQ) Data
Data below the LLOQ were modeled by adding to the likelihood function a term describing the probability that the true observation lies between zero and the LLOQ. This LLOQ corrected likelihood function is equivalent to the M4 method as implemented in the most recent release of NONMEM (Version 7.4; ICON Development Solutions).
Random Effects Correlation Estimates
Visual inspection of the scatterplot of random effects as well as Pearson correlation tests were used to evaluate correlations between model parameters. P < 0.05 were considered as statistically significant. In agreement with previous literature (26, 28, 29), several samples of the posterior distribution obtained during the last iteration of the SAEM algorithm, rather than the empirical Bayes estimate (EBE), were used when producing the scatterplot to better assess correlation between model parameters.
Inclusion of Covariate Relationships
The effect of two continuous covariates (BW and age) and one categorical covariate (sex) were evaluated using the automated Pearson's correlation test and the ANOVA method as implemented in Monolix 2018R2. P < 0.05 was used as threshold for statistical significance i.e., for inclusion of a covariate effect in the final NLME model. Age and BW were normalized by their median value and log-transformed during the covariate search.
Monte Carlo Simulations
After model selection and fit, we used two sets of Monte Carlo simulations to answer two questions. First, we wanted to use our model to visualize the entire distribution of predicted CEF-Na concentration time-courses in dogs, after a dog is administered 2.2 mg/kg S.C. Plotting this prediction distribution against our observations gave us additional insight into the quality of our model predictive ability.
The time period for which CEF plasma concentrations remained effective was defined as the time period for which median CEF plasma concentrations remained above the MIC50 (0.5 μg/mL) and MIC90 (8 μg/mL) for respiratory tract or urinary tract Escherichia coli spp. This time period for which concentration remained above MIC50/90 was given the variable name τ50/90. MIC values were obtained from previously published canine studies (20). The R 3.4.4 package Simulx 3.3.0 (Monolix 2018R2) was used to simulate CEF plasma disposition kinetic profiles from final Monolix run files.
In the first set of simulations, we simulated a population of 500 females and 500 females and virtually administered CEF-Na at 2.2 mg/kg S.C. Furthermore, using simulation set 1, we were able to explore the probability that—for a S.C dose of 2.2 mg/kg, and a dosing interval of 24 h—the concentration of ceftiofur would remain above a set of predefined plasma concentrations for a given period of time, referred as the pharmacodynamic target (PDT) (%T > MIC = {40, 60, 80, 100}). This approach follows recommendations from the European Committee on Antimicrobial Susceptibility Testing (EUCAST) working group as outlined in Mouton et al. (30). Then, we used the PK data from this simulation to produce prediction distributions of CEF between 0 and 40 h.
In the second set of simulations, we simulated the median CEF PK of male and female dogs after S.C dosing with 1–5 mg/kg (in steps of 0.1 mg/kg) of CEF-Na. Using this second simulation set, we were able to calculate the median τ50 and median τ90 for both males and females as a function of CEF-Na dosage.
Results
Animals
No noticeable signs of discomfort were observed upon injection of CEF-Na and no complications resulted from CEF exposure.
Pharmacokinetic Model
A total of 198 plasma concentrations of CEF and metabolites (measured as DCA by UPLC-MS/MS) from both I.V and S.C dosing groups were pooled together and simultaneously modeled using NLME. Only 4.0 % (8/198) data were found to be below the LLOQ of the UPLC-MS/MS validated method. A two-compartment mammillary PK model with first-order elimination and first-order absorption for the S.C route, was found to best fit the pharmacokinetics of CEF equivalents in plasma based on standard goodness-of-fit diagnostic plots, precision of parameter estimates (RSE), as well as comparison of BIC between competing structural models (Figures 1–3) (31). A log-normal error model best captured the residual variability in the model (Supplemental Figure 1A). Individual effects were approximately log-normally distributed around their respective population mode (Supplemental Figure 1B). After inspection of the correlation matrix of the random effects (Supplemental Figure 1C), a correlation between CEF systemic clearance (Cl) and central volume of distribution (V1) was identified and subsequently included in the structure of the statistical model (corr(V1, Cl) ≅. 999, P ≤ 0.01). Results from the automated covariate search as implemented in Monolix 2018R2 identified sex as a significant covariate on CEF subcutaneous absorption rate (P ≤ 0.01). Gender was therefore included in the final model structure, using the following relationship:
Where sexi = f is equal to 1 if individual i is a female and 0 otherwise. kapop is the population subcutaneous absorption rate for male dogs and β is the effect of the categorical covariate (i.e., sex) on ka. Using final parameter estimates from the model, CEF absorption rate was estimated to be two times greater in male vs. female dogs.
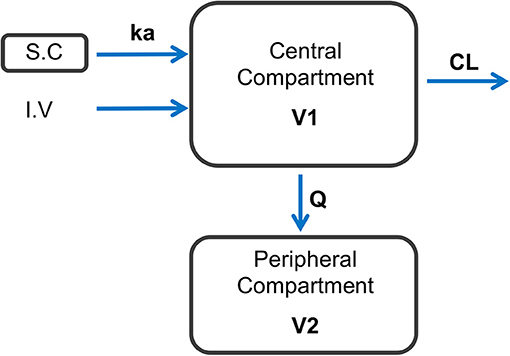
Figure 1. Schematic representation of the final model structure used to represent the dynamics of CEF following I.V and S.C dosing in healthy beagle dogs. A two-compartment pharmacokinetic model with first-order elimination and first-order absorption after S.C dosing with CEF best fitted the observed data. ka: 1-st order absorption rate following S.C dosing with CEF; CL, CEF systemic clearance; Q, inter-compartmental clearance; V1, central volume of distribution; V2, peripheral volume of distribution.
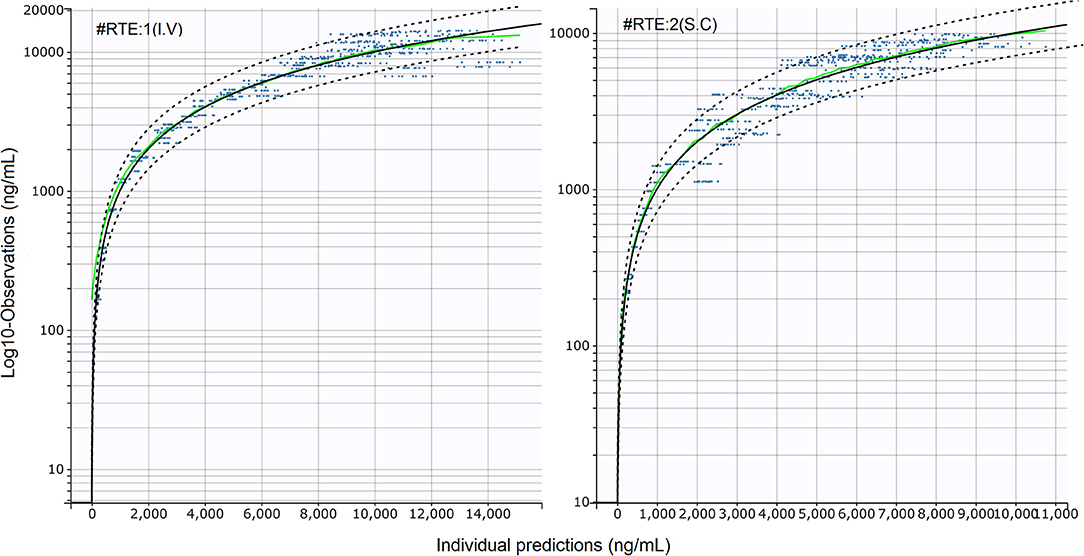
Figure 2. Standard goodness-of-fit (sGOF) diagnostics: individual predictions vs. observations (log scale). Left: I.V (#RTE: 1); Right: S.C (#RTE: 2). The robustness of fit and predictive performances of the final model were supported by the inspection of the sGOF plots. Blue dots: observations; green line, identity line; dotted black lines: 90% prediction interval; red dots: censored (i.e., below the quantification limit) data. As described by Nguyen et al. (31), observations were displayed on a log-scale to better evaluate the quality of fit.
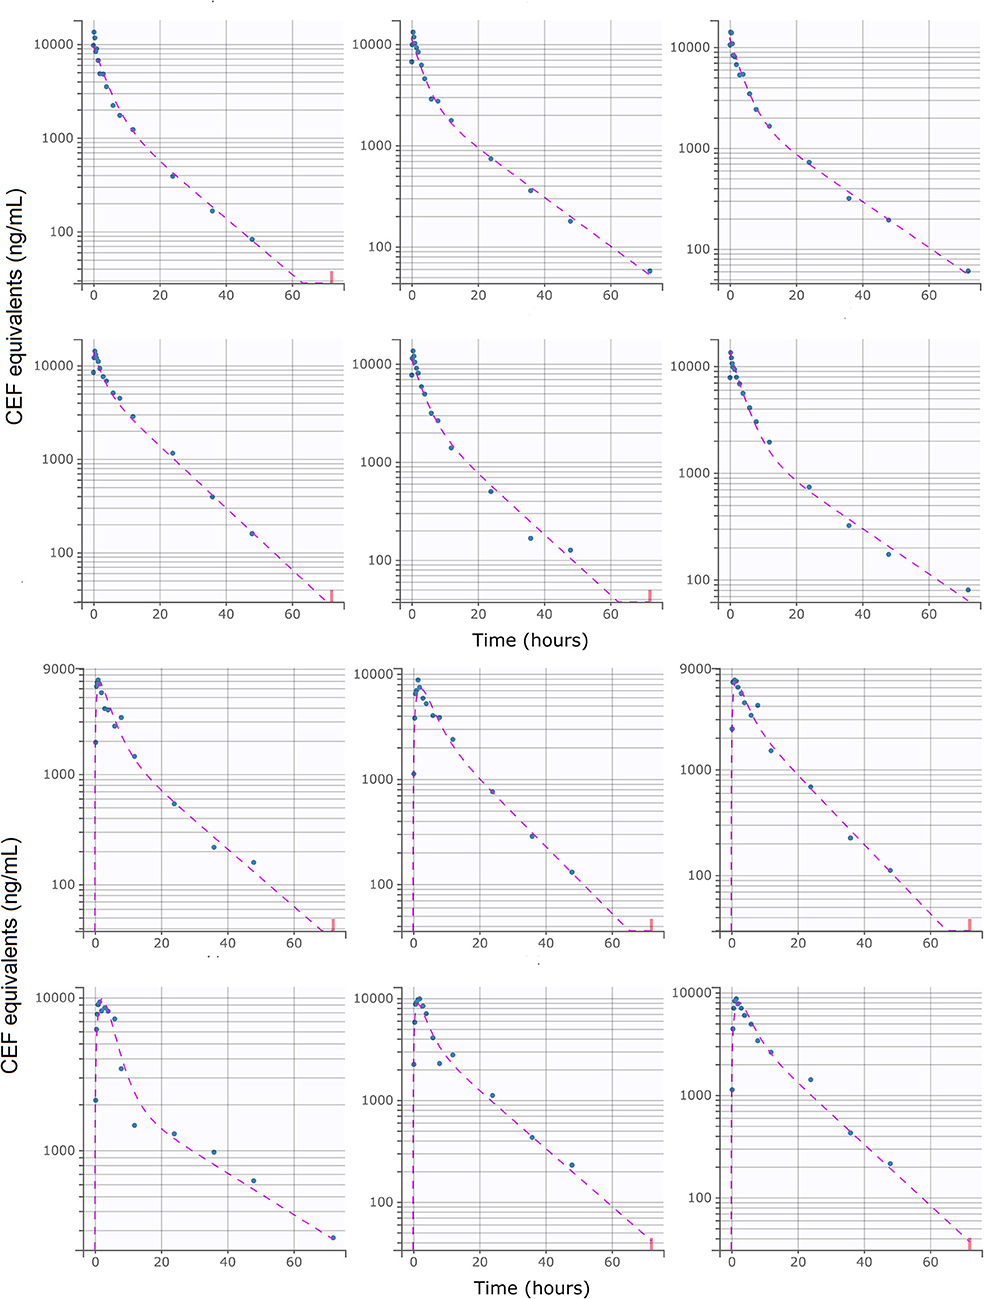
Figure 3. Individual predictions of CEF equivalent plasma concentrations in healthy beagle dogs from the final selected model. Upper: I.V (#RTE: 1, n = 6); Lower: S.C (#RTE: 2, n = 6). Scatter plot of observed (blue dot) and predicted (dashed purple line) individual concentration vs. time after dosing. The full model was able to describe the individual time-course of CEF equivalents for all administration schedules with excellent accuracy, as shown by the quality of the individual fits. Below LLOQ data are represented with red dots.
Parameters Estimates
Final parameter estimates and relevant RSEs are tabulated in Table 1. The precision of the final estimates was high (RSE ≤ 15%), reflecting an accurate and stable parameterization of the model. The total systemic clearance of CEF was estimated to be low 0.25 L/kg/h (32), with an estimated volume of distribution of 2.97 L/kg (1.69 and 1.28 L/kg for the volume of the central and the peripheral compartment, respectively).
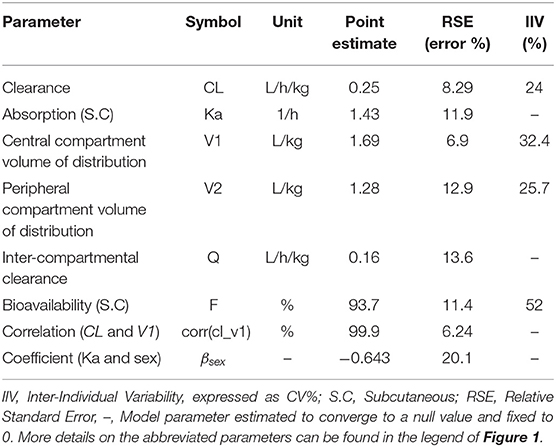
Table 1. Estimated model parameters and their associated inter-individual and inter-occasion variability for CEF pharmacokinetics in dogs.
Cardiac output, Q, was approximated using the formula, Q≅180 × BW−0.19 (32). The global extraction ratio of CEF (E = Cl/Q) was estimated to be low (E = 0.02). The absolute bioavailability of CEF was estimated as 93.7%.
Model Predictions
The prediction distribution of CEF equivalents over time after 2.2 mg/kg CEF-Na S.C administration suggests that CEF total concentrations (measured as DCA) would remain below the MIC90 concentration threshold (8 μg/mL) for most of the dosing interval, except for individuals in the upper percentiles of the simulated population (Figure 4). Also, because male dogs had a higher estimated CEF absorption rate than females, their peak exposure (i.e., Cmax) was predicted to be greater than in female dogs.
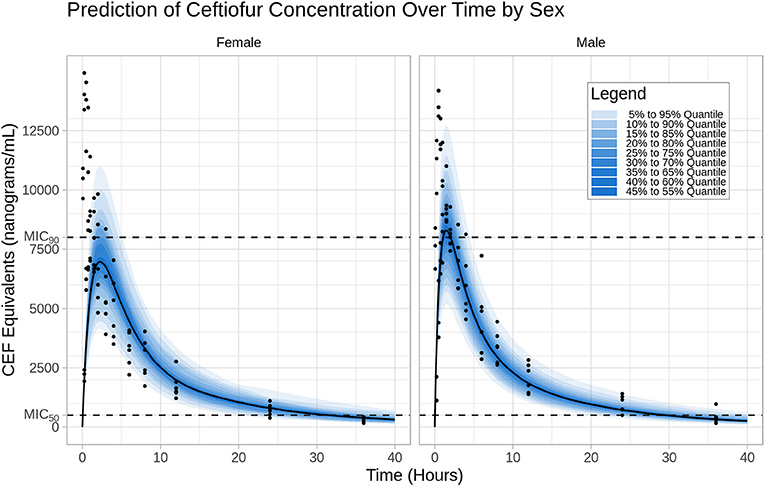
Figure 4. Prediction distribution of CEF pharmacokinetics. Left: I.V (#RTE: 1); Right: S.C (#RTE: 2). The theoretical distribution of CEF PK was produced by 500 Monte Carlo simulations from the final model. Briefly, the experiment was replicated virtually 500 times, allowing for each quantile (from 5 to 95 in steps of 5 i.e., {5,10,15,…,90,95}) to be estimated 500 times. The blue areas are ranges of quantiles and the blue points are observations for comparison.
Results from our model-based simulations suggest that after one dose of 2.5 mg/kg CEF-Na S.C, ceftiofur concentrations would remain above the MIC50 threshold (0.5 μg/mL) for almost 1.5 days in both male and female dogs (Figure 5A). We also found that ceftiofur peaks at a higher plasma concentration in males, but the probability that ceftiofur plasma concentrations remain above various target MICs for target dosing intervals is higher in females than it is in males. We found that even at relatively high target MICs (1.0 μg/mL), both female and male dogs remain above those targets for reasonable periods of time (~9.6 h, hence 40% of the dosing interval) with high probability (99% of simulated females, and 100% of simulated males). As the target time periods increases to 24 h (PDT = 100%), we see a steep decrease in probability of remaining over MICs above 0.5 μg/mL. More precisely, 30% of simulated females and 20% of simulated males remained above 1.0 μg/mL for at least 24 h (see Figure 5C and Table 2 for further details).
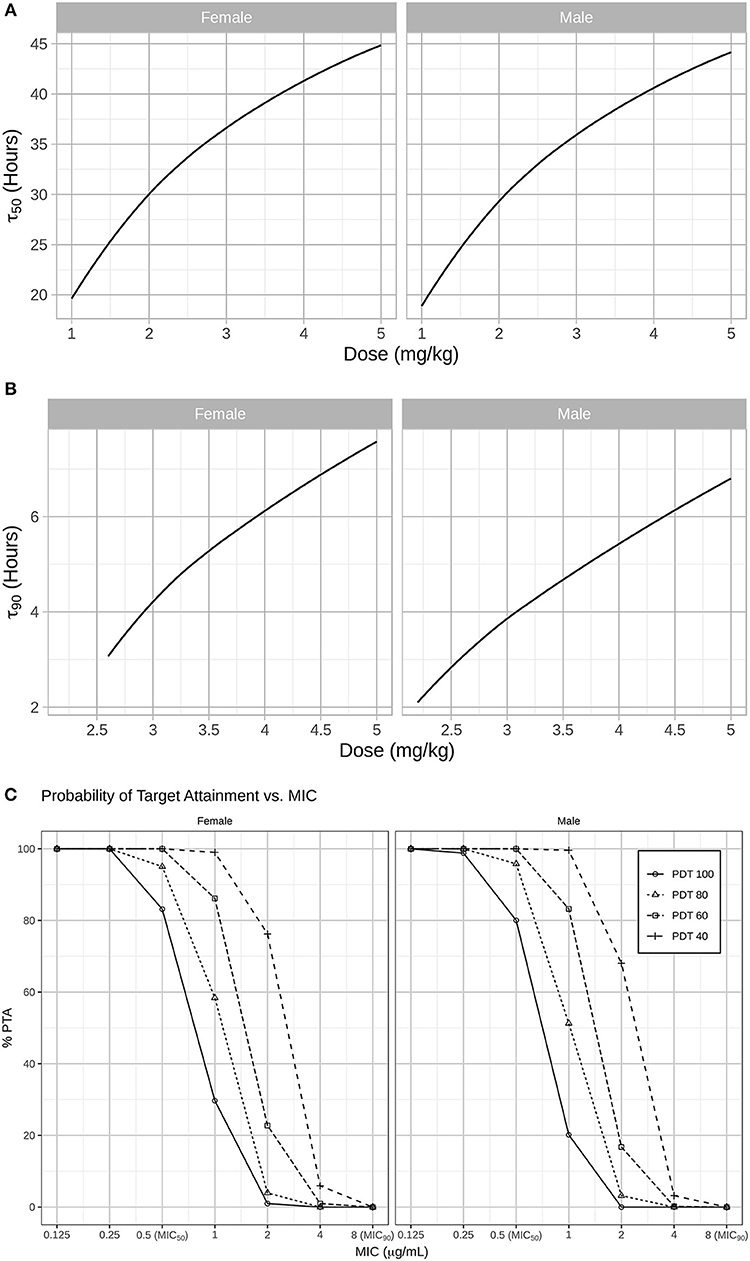
Figure 5. (A) In a second step, simulations were used to predict for how long CEF plasma concentrations remained above the MIC50 (0.5 μg/mL) and MIC90 (8 μg/mL) for Respiratory tract Escherichia coli spp. in both males and females dogs after administration CEF-Na at 2.2 mg/kg S.C. Specifically, the median PK of males and females after S.C dosing with 1 to 5 mg/kg of CEF-Na was simulated to derive the median τ50 (B; left panel: male; right panel: female) and median τ90 (C; left panel: male; right panel: female) as a function of CEF-Na dosage. (C) Probability of Target Attainment (PTA%) for various pharmacodynamic targets (40, 60, 80, 100) and a range of MIC values. As suggested in (B), at an MIC of 0.5 μg/mL (MIC50), nearly 100% of the target population is expected to reach the pharmacodynamic target. This percentage drops as the MIC increases.
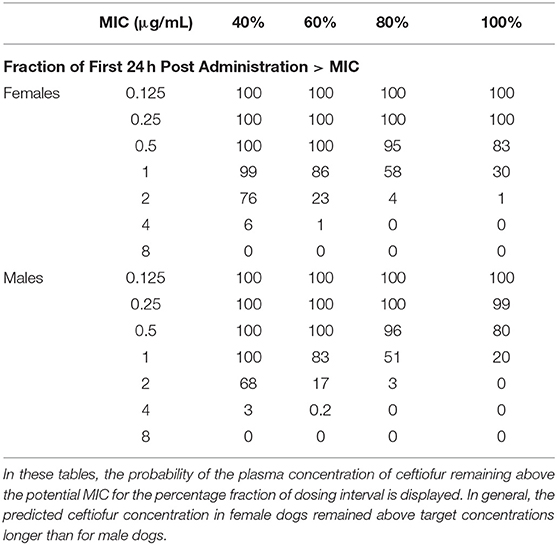
Table 2. Probability of Target Attainment (PTA%) for various pharmacodynamic targets following daily dosing with ceftiofur (2.2 mg/kg, S.C).
In contrast, our predictions of median τ90 as a function of dosage indicate that even when administered at unrealistically high doses of CEF-Na S.C (~5 mg/kg), CEF concentrations would remain above MIC90 levels for no more than 8 h (Figure 5B).
Discussion
Since 1991, Ceftiofur has been approved and extensively used by veterinarians in the treatment of bacterial infections in cattle, swine, and horses. This study constitutes the very first pharmacokinetic report of CEF-Na absolute bioavailability in dogs, allowing for the proper estimation of CEF systemic clearance and volume of distribution (as opposed to apparent clearance and distribution volume estimated with extravascular dosing of CEF-Na). Previously, the PK of ceftiofur in dogs has only been described in two studies. First, the PK of a single subcutaneous dose of ceftiofur crystalline-free acid has been described using non-compartmental analysis (20). Second, the PK of CEF-Na S.C has been reported using non-linear least squares regression (18). Results from our analysis suggest that the absolute bioavailability of CEF-Na S.C is higher in dogs than in cattle (61.12%) (6). We observed an apparent systemic clearance (CL/F) for dogs (0.12 L/h/kg) that is higher than previously reported in dogs (0.039 L/h/kg) (20) and lower than previously reported in cows (0.26 L/h/kg) (6). Lastly, we estimated a lower S.C absorption rate (1.43 1/h) than previous estimates of CEF-Na S.C absorption in dogs (2.26 1/h) (18).
In our analysis, CEF and desfuroylceftiofur metabolites (containing an intact β-lactam ring) in plasma samples were derivatized to DCA (18), and total CEF equivalent concentrations (measured as DCA) were quantified by UPLC-MS/MS. Free concentrations only accounts for about 10% of total CEF equivalents (6). However, protein binding of desfuroylceftiofur is known to be reversible, such as protein-bound desfuroylceftiofur acts as a reservoir for release of active therapeutic drug at the site of infection (33). Hence, measurement of DCA regardless of protein binding was used for simulation of what-if scenarios and dose optimization in our experiment.
NLME models are a versatile statistical tool for quantifying variability in drug disposition as a function of individual patient characteristics (i.e., covariates, such as age, sex, and bodyweight) (34–36). NLME modeling also enables decoupling of intra-individual variability, inter-individual variability, and residual error. This allows to individually consider the many factors that could affect drug exposure in any given individual. Pooling data from I.V and S.C dosing with CEF (totaling 198 concentrations), the disposition kinetics of CEF equivalents was best modeled using a two-compartmental mammillary model with first-order elimination and first-order absorption from the S.C injection site. Our final selected model precisely captured the individual PK of total CEF equivalents over time in both dosing groups. Results from the automated covariate analysis in Monolix 2018R2 further suggest that sex has a significant effect (βsex = −0.643 ± 20.1%) on CEF absorption rate following subcutaneous administration. This was also supported by the inspection of the distribution of the estimated individual absorption parameters (i.e., kai). Specifically, CEF absorption rate was estimated to be two times greater in male vs. female dogs, and our model-based simulations confirmed the potential need for dose adjustment based on sex in dogs. To the best of our knowledge, no previous studies had reported an effect of sex on ceftiofur PK in dogs or any other species.
Importantly, using final parameters estimates from the NLME model, we could simulate “what-if ” scenarios to evaluate various dosing schedules for CEF-Na S.C in dogs. The most important risk factor for emergence of resistance is repeated exposure of bacteria to suboptimal concentrations of antimicrobials related to the selection of inappropriate dosing schedules (36). As a cephalosporin antibiotic, CEF exhibits time-dependent bactericidal activity i.e., plasma concentrations of CEF must be maintained over relevant MIC levels for an extended period of time. As such, the amount of time that CEF concentrations remain above the MICXX (i.e., τxx) is the PK-PD best index for predicting drug efficacy (37).
According to previous research with cephalosporins, τxx should be at least 50% (and preferably ≥ 80%) of the dosage interval to achieve optimal bactericidal effect without inducing resistance (38). Using the EUCAST approach outlined by Mouton et al. (30), we predict that for MICs of ~1.0 μg/mL we achieve a pharmacodynamic target of 80% with relatively high probability (~ 60%) for once daily dosing at 2.2 mg/kg S.C. For smaller MICs (≤0.5 μg/mL), we achieve that target with high probability (>90%). Probability of target attainment drops off steeply for high MIC values. In our simulations, doubling the daily dose of ceftiofur (e.g., from 2.2 to 4.4 mg/kg) produces ~1.5 times greater time above MIC50 for E. coli spp.
In summary, our simulations suggest a wide spectrum of viable dosing regimens and dosages for CEF-Na subcutaneous in dogs. However, producing a definitive recommendation of dosing interval for CEF in dogs was not within the primary scope of this study. As such, further studies in client-owned animals with clinical disease are required to validate and build on our preliminary findings in healthy dogs.
Limitations
Our study had several limitations. First, this experiment was performed in healthy dogs and model-based predictions of CEF disposition kinetics may not extend to dogs with bacterial infection, impaired hepatic function, or impaired renal function. Second, we chose to refer to MIC values from previous studies rather than culturing clinical pathogens as a part of the sampling process. Third, we have no information about the free concentration fraction of CEF in plasma. Finally, and with respect to our experimental design, this study solely reports the disposition kinetics of CEF after a single dose of CEF-Na, with no information about systemic accumulation and steady-state pharmacokinetics of CEF in dogs.
Data Availability Statement
The datasets generated for this study are available on request to the corresponding author.
Ethics Statement
The animal study was reviewed and approved by Animal Use and Care Administrative Advisory Committee of the China Agricultural University.
Author Contributions
XC and JW were involved in the original design and execution of the study. PS, JX, JW, and JQ were responsible for the animal experiments. BS, JW, and JM performed the NLME data analysis and wrote the manuscript. All authors have read and approved the final version of the manuscript. All authors contributed to the preparation of the manuscript.
Funding
This work was supported by the National Science & Technology Pillar Program during the Thirteenth Five-Year Plan Period (2016YFD0501309-1) and the National Natural Science Foundation of China (No. 31672599).
Conflict of Interest
The authors declare that the research was conducted in the absence of any commercial or financial relationships that could be construed as a potential conflict of interest.
Acknowledgments
We would like to thank Shuyuan Li for her technical assistance with the analytical determination of CEF. JW acknowledges the China Scholarship Council (CSC) for his Ph.D. grant (201806350103).
Supplementary Material
The Supplementary Material for this article can be found online at: https://www.frontiersin.org/articles/10.3389/fvets.2019.00363/full#supplementary-material
Supplemental Figure 1. (A) Scatter plots of model residuals (Individual Weighted Residual, IWRES) vs. predicted CEF concentrations. Brown line: regression curve; red dots: censored (i.e., below the quantification limit) data. A suitable model should have the following features: (i) residuals (IWRES) should be centered around a mean value of 0 (i.e., the regression curve should mirror a horizontal line of y = 0), (ii) a homogeneous distribution about the mean. (B) Boxplot of the distribution of the random effects (ηi). Box: 1st quartile, median and 3rd quartile; Whiskers: ±1.5 interquartile range; Red crosses: statistical outliers. The normality of the random effects was further confirmed by the homogeneous distribution of the random effects (ηi) around a mean value of 0. (C) Correlation matrix of the random effects (i.e., the ηi). Most correlations were deemed insignificant (coefficient ≤ 0.3, P > 0.05), with the exception of the correlation between CEF clearance and volume of distribution (V1): corr_V1_Cl = 0.99 ± 0.05 (P < 0.05).
References
1. Brown SA, Arnold TS, Hamlow PJ, Speedy AK, Deleeuw NL, Hubbard VL, et al. Comparison of plasma pharmacokinetics and bioavailability of ceftiofur sodium and ceftiofur hydrochloride in pigs after a single intramuscular injection. J Vet Pharmacol Therap. (1999) 22:35–40.
2. FDA. Implantation Injectable Dosage Form; Animal Drugs Not Subject to Certification Ceftiofur Sterile Powder. FDA (1991).
3. FDA. Original New Animal Drug Application Ceftiofur Hydrochloride Sterile Suspension for Injection Swine and Cattle (Beef, Non-Lactating Dairy, and Lactating Dairy).
4. Hall TL, Tell LA, Wetzlich SE, McCormick JD, Fowler LW, Pusterla N. Pharmacokinetics of ceftiofur sodium and ceftiofur crystalline free acid in neonatal foals. J Vet Pharmacol Therap. (2011) 34:403–9. doi: 10.1111/j.1365-2885.2010.01252.x
5. Soback S, Bright S, Paape M. Disposition kinetics of ceftiofur in lactating cows. Acta Vet Scand. (1991) 87:93–5.
6. Wang J, Peng H, Kong J, Zhao T, Zhang S, Cao X. Pharmacokinetic profile of Ceftiofur Hydrochloride Injection in lactating Holstein dairy cows. J Vet Pharmacol Therap. (2018) 41:301–6. doi: 10.1111/jvp.12469
7. Brown SA, Chester ST, Robb EJ. Effects of age on the pharmacokinetics of single dose ceftiofur sodium administered intramuscularly or intravenously to cattle. J Vet Pharmacol Therap. (1996) 19:32–8. doi: 10.1111/j.1365-2885.1996.tb00005.x
8. Gorden PJ, Ydstie JA, Kleinhenz MD, Brick TA, Smith JS, Griffith RW, et al. Comparative plasma and interstitial fluid pharmacokinetics and tissue residues of ceftiofur crystalline-free acid in cattle with induced coliform mastitis. J Vet Pharmacol Therap. (2018) 41:848–60. doi: 10.1111/jvp.12688
9. Goudah A Pharmacokinetics of ceftiofur after single intravenous and intramuscular administration in camels (Camelus dromedarius). J Vet Pharmacol Therap. (2007) 30:371–4. doi: 10.1111/j.1365-2885.2007.00861.x
10. Courtin F, Craigmill AL, Wetzlich SE, Gustafson CR, Arndt TS. Pharmacokinetics of ceftiofur and metabolites after single intravenous and intramuscular administration and multiple intramuscular administrations of ceftiofur sodium to dairy goats. J Vet Pharmacol Therap. (1997) 20:368–73. doi: 10.1046/j.1365-2885.1997.00070.x
11. Collard WT, Cox SR, Lesman SP, Grover GS, Boucher JF, Hallberg JW, et al. Pharmacokinetics of ceftiofur crystalline-free acid sterile suspension in the equine. J Vet Pharmacol Therap. (2011) 34:476–81. doi: 10.1111/j.1365-2885.2011.01266.x
12. Craigmill AL, Brown SA, Wetzlich SE, Gustafson CR, Arndt TS. Pharmacokinetics of ceftiofur and metabolites after single intravenous and intramuscular administration and multiple intramuscular administrations of ceftiofur sodium to sheep. J Vet Pharmacol Therap. (1997) 20:139–44. doi: 10.1046/j.1365-2885.1997.00820.x
13. Dechant JE, Rowe JD, Byrne BA, Wetzlich SE, Kieu HT, Tell LA. Pharmacokinetics of ceftiofur crystalline free acid after single and multiple subcutaneous administrations in healthy alpacas (Vicugna pacos). J Vet Pharmacol Therap. (2013) 36:122–9. doi: 10.1111/j.1365-2885.2012.01395.x
14. Gardhouse S, Guzman DS, Cox S, Kass PH, Drazenovich TL, Byrne BA, et al. Pharmacokinetics and safety of ceftiofur crystalline free acid in New Zealand White rabbits (Oryctolagus cuniculus). Am J. Vet Res. (2017) 78:796–803. doi: 10.2460/ajvr.78.7.796
15. Jaglan PS, Kubicek MF, Arnold TS, Cox BL, Robins RH, Johnson DB, et al. Metabolism of ceftiofur. Nature of urinary and plasma metabolites in rats and cattle. J Agric Food Chem. (1989) 37:1112–8. doi: 10.1021/jf00088a066
16. Gilbertson TJ, Roof RD, Nappier JL, Zaya MJ, Robins RH, Stuart DJ, et al. Disposition of ceftiofur sodium in swine following intramuscular treatment. J Agric Food Chem. (1995) 43:229–34. doi: 10.1021/jf00049a041
17. Jaglan PS, Roof RD, Yein FS, Arnold TS, Brown SA, Gilbertson TJ. Concentration of ceftiofur metabolites in the plasma and lungs of horses following intramuscular treatment. J Vet Pharmacol Therap. (1994) 17:24–30. doi: 10.1111/j.1365-2885.1994.tb00517.x
18. Brown SA, Arnold TS, Hamlow PJ, Speedy AK, Deleeuw NL, Hubbard VL, et al. Plasma and urine disposition and dose proportionality of ceftiofur and metabolites in dogs after subcutaneous administration of ceftiofur sodium. J Vet Pharmacol Therap. (1995) 18:363–9. doi: 10.1111/j.1365-2885.1995.tb00605.x
19. Olson SC, Beconi-Barker MG, Smith EB, Martin RA, Vidmar TJ, Adams LD. In vitro metabolism of ceftiofur in bovine tissues. J Vet Pharmacol Therap. (1998) 21:112–20. doi: 10.1046/j.1365-2885.1998.00118.x
20. Hooper SE, Korte SW, Giguere S, Fales WH, Davis JL, Dixon LW. Pharmacokinetics of ceftiofur crystalline-free acid in clinically healthy dogs (Canis lupus familiaris). J Am Assoc Lab Anim Sci. (2016) 55:224–9. Available online at: https://www.ncbi.nlm.nih.gov/pmc/articles/PMC4783643/pdf/jaalas2016000224.pdf
21. Pillai GC, Mentre F, Steimer JL. Non-linear mixed effects modeling - from methodology and software development to driving implementation in drug development science. J Pharmacokinet Pharmacodyn. (2005) 32:161–83. doi: 10.1007/s10928-005-0062-y
22. Mochel JP, Danhof M. Chronobiology and pharmacologic modulation of the renin-angiotensin-aldosterone system in dogs: what have we learned? Rev Physiol Biochem Pharmacol. (2015) 169:43–69. doi: 10.1007/112_2015_27
23. Bon C, Toutain PL, Concordet D, Gehring R, Martin-Jimenez T, Smith J, et al. Mathematical modeling and simulation in animal health. Part III: Using nonlinear mixed-effects to characterize and quantify variability in drug pharmacokinetics. J Vet Pharmacol Therap. (2018) 41:171–83. doi: 10.1111/jvp.12473
24. FDA. Guidance for Industry: Bioanalytical Method Validation. Department of Health and Human Services, Food and Drug Administration, Center for Drug Evaluation and Research (CDER), Center of Veterinary Medicine (CVM) (2013).
25. Sheiner LB, Ludden TM. Population pharmacokinetics/dynamics. Annu Rev Pharmacol Toxicol. (1992) 32:185–209. doi: 10.1146/annurev.pharmtox.32.1.185
26. Pelligand L, Soubret A, King J, Elliott J, Mochel J. Modeling of large pharmacokinetic data using nonlinear mixed-effects: a paradigm shift in veterinary pharmacology. A case study with robenacoxib in cats. CPT Pharmacometr Syst Pharmacol. (2016) 5:625–35. doi: 10.1002/psp4.12141
27. Mould DR, Upton RN. Basic concepts in population modeling, simulation, and model-based drug development-part 2: introduction to pharmacokinetic modeling methods. CPT Pharmacometr Syst Pharmacol. (2013) 2:e38. doi: 10.1038/psp.2013.14
28. Lavielle M, Ribba B. Enhanced method for diagnosing pharmacometric models: random sampling from conditional distributions. Pharmaceut Res. (2016) 33:2979–88. doi: 10.1007/s11095-016-2020-3
29. Wang J, Schneider BK, Sun P, Gong X, Qiu J, Li J, et al. Nonlinear mixed-effects pharmacokinetic modeling of the novel COX-2 selective inhibitor vitacoxib in dogs. J Vet Pharmacol Therap. (2019) 42:530–40. doi: 10.1111/jvp.12802
30. Mouton JW, Brown DF, Apfalter P, Canton R, Giske CG, Ivanova M, et al. The role of pharmacokinetics/pharmacodynamics in setting clinical MIC breakpoints: the EUCAST approach. Clin Microbiol Infect. (2012) 18:E37–45. doi: 10.1111/j.1469-0691.2011.03752.x
31. Nguyen TH, Mouksassi MS, Holford N, Al-Huniti N, Freedman I, Hooker AC, et al. Model evaluation of continuous data pharmacometric models: metrics and graphics. CPT Pharmacometrics Syst Pharmacol. (2017) 6:87–109. doi: 10.1002/psp4.12161
32. Toutain PL, Bousquet-Melou A. Plasma clearance. J Vet Pharmacol Therap. (2004) 27:415–25. doi: 10.1111/j.1365-2885.2004.00605.x
33. Clarke CR, Brown SA, Streeter RN, Clarke JM, Hamlow PJ, Callahan JK, et al. Penetration of parenterally administered ceftiofur into sterile vs. Pasteurella haemolytica-infected tissue chambers in cattle. J Vet Pharmacol Therap. (1996) 19:376–81. doi: 10.1111/j.1365-2885.1996.tb00067.x
34. Fink M, Letellier I, Peyrou M, Mochel JP, Jung M, King JN, et al. Population pharmacokinetic analysis of blood concentrations of robenacoxib in dogs with osteoarthritis. Res Vet Sci. (2013) 95:580–7. doi: 10.1016/j.rvsc.2013.04.021
35. Riviere JE, Gabrielsson J, Fink M, Mochel J. Mathematical modeling and simulation in animal health. Part I: moving beyond pharmacokinetics. J Vet Pharmacol Therap. (2016) 39:213–23. doi: 10.1111/jvp.12278
36. Toutain PL, Bousquet-Melou A. How Antibiotic Dosage Regimens Based on PK-PD Concepts May Be an Important Contribution to the Resistance Problem. In: World Buiatrics Congress 2006. Nice (2019).
37. Nielsen EI, Cars O, Friberg LE. Pharmacokinetic/pharmacodynamic (PK/PD) indices of antibiotics predicted by a semimechanistic PKPD model: a step toward model-based dose optimization. Antimicrob Agents Chemother. (2011) 55:4619–30. doi: 10.1128/AAC.00182-11
Keywords: ceftiofur sodium, pharmacokinetics, NLME, monte carlo simulations, dogs
Citation: Wang J, Schneider BK, Xue J, Sun P, Qiu J, Mochel JP and Cao X (2019) Pharmacokinetic Modeling of Ceftiofur Sodium Using Non-linear Mixed-Effects in Healthy Beagle Dogs. Front. Vet. Sci. 6:363. doi: 10.3389/fvets.2019.00363
Received: 30 July 2019; Accepted: 02 October 2019;
Published: 17 October 2019.
Edited by:
Nora Mestorino, National University of La Plata, ArgentinaReviewed by:
Pascal Jean Jacques Sanders, National Agency for Sanitary Safety of Food, Environment and Labor (ANSES), FranceCengiz Gokbulut, Balikesir University, Turkey
Copyright © 2019 Wang, Schneider, Xue, Sun, Qiu, Mochel and Cao. This is an open-access article distributed under the terms of the Creative Commons Attribution License (CC BY). The use, distribution or reproduction in other forums is permitted, provided the original author(s) and the copyright owner(s) are credited and that the original publication in this journal is cited, in accordance with accepted academic practice. No use, distribution or reproduction is permitted which does not comply with these terms.
*Correspondence: Jonathan P. Mochel, am1vY2hlbEBpYXN0YXRlLmVkdQ==; Xingyuan Cao, Y3h5QGNhdS5lZHUuY24=