 Lorens Maake1,2
 William T. Harvey3
 Lia Rotherham1
 Pamela Opperman1,4
 Jacques Theron2
 Richard Reeve3
 Francois F. Maree1,2*
- 1Vaccine and Diagnostic Development Programme, Onderstepoort Veterinary Institute, Agricultural Research Council, Pretoria, South Africa
- 2Department of Biochemistry, Genetics and Microbiology, Faculty of Agricultural and Natural Sciences, University of Pretoria, Pretoria, South Africa
- 3Boyd Orr Centre for Population and Ecosystem Health, Institute of Biodiversity, Animal Health and Comparative Medicine, College of Medical, Veterinary and Life Sciences, University of Glasgow, Glasgow, United Kingdom
- 4Department of Animal Production Studies, Faculty of Veterinary Science, University of Pretoria, Pretoria, South Africa
Foot-and-mouth disease (FMD) continues to be a major burden for livestock owners in endemic countries and a continuous threat to FMD-free countries. The epidemiology and control of FMD in Africa is complicated by the presence of five clinically indistinguishable serotypes. Of these the Southern African Territories (SAT) type 3 has received limited attention, likely due to its restricted distribution and it being less frequently detected. We investigated the intratypic genetic variation of the complete P1 capsid-coding region of 22 SAT3 viruses and confirmed the geographical distribution of five of the six SAT3 topotypes. The antigenic cross-reactivity of 12 SAT3 viruses against reference antisera was assessed by performing virus neutralization assays and calculating the r1-values, which is a ratio of the heterologous neutralizing titer to the homologous neutralizing titer. Interestingly, cross-reactivity between the SAT3 reference antisera and many SAT3 viruses was notably high (r1-values >0.3). Moreover, some of the SAT3 viruses reacted more strongly to the reference sera compared to the homologous virus (r1-values >1). An increase in the avidity of the reference antisera to the heterologous viruses could explain some of the higher neutralization titers observed. Subsequently, we used the antigenic variability data and corresponding genetic and structural data to predict naturally occurring amino acid positions that correlate with antigenic changes. We identified four unique residues within the VP1, VP2, and VP3 proteins, associated with a change in cross-reactivity, with two sites that change simultaneously. The analysis of antigenic variation in the context of sequence differences is critical for both surveillance-informed selection of effective vaccines and the rational design of vaccine antigens tailored for specific geographic localities, using reverse genetics.
Highlights
- Phylogenetic relationships of the capsid-coding region of SAT3 viruses confirmed the geographical distribution of the southern African topotypes.
- Cross-reactivity between SAT3 reference antisera and SAT3 viruses is notably high.
- Avidity could explain some of the higher cross-reactivity observed.
- Unique amino acid residues may be associated with a change in cross-reactivity.
Introduction
Foot-and-mouth disease (FMD) continues to be a major burden for livestock owners in endemic countries (1). The occurrence of FMD negatively impacts on the livelihoods of local farmers due to its effects on productivity, food insecurity and losses of income, but also have damaging consequences on international trade in livestock and animal products. The disease is widely distributed in Africa, Asia, and South America where FMD is regarded as endemic. FMD outbreaks particularly affect vulnerable individuals, such as women and children since ~75% of livestock in Africa are raised under the communal smallholder, communal-grazing or pastoral systems that sustain livelihoods of these groups (2, 3). Controlling FMD at its source is therefore a shared interest between endemic and free countries (4). The epidemiology of FMD in sub-Saharan Africa is unique due to the presence of the South African Territories (SAT) serotypes that are almost exclusively endemic, and its continuous maintenance in wildlife (5–7). Therefore, FMD control in livestock is dependent, in part, on an understanding of pathogenesis, persistence, and transmission from African buffalo (Syncerus caffer) (7).
Clinically indistinguishable FMD viruses (FMDV) belonging to the SAT serotypes are maintained in buffalo, but differ from each other with respect to their geographic distribution, incidence, outer capsid-coding sequence and antigenicity. SAT2 is the most widely distributed in Africa and is also the serotype most often associated with outbreaks in cattle in southern Africa, followed by SAT1 and then SAT3 (8–10). However, viruses of the SAT1 serotype is most frequently isolated from buffalo (7, 11). Viruses belonging to the SAT3 serotype have the most restricted distribution and essentially occur in southern Africa and in the south-western region of Uganda (12, 13). The SAT3 serotype is also less frequently detected in African buffalo (12). In South Africa, in the Kruger National Park, a SAT3 outbreak occurred in 1958/59 where it involved wildebeest (Connochaetes taurinus), kudu (Tragelaphus strepsiceros) and sable antelope (Hippo tragus niger) (14) and was also detected in Mozambique. Other outbreaks were detected in cattle in Limpopo (Giyani) during 1979/80 (15), in Phalaborwa during 2002 affecting buffalo, in Thulamela during 2006 and in the Kruger National Park (Pafuri) during 2008 affecting impala (Aepyceros melampus) as well. The 1979/80 outbreak in Giyani lasted for 9 months and was the longest SAT3 outbreak reported to date (9). Neighboring southern African countries also experienced SAT3 outbreaks during similar times with the most recent outbreaks reported in livestock in Namibia in 2011, Zimbabwe in 1999 and 2013, Zambia in 2015 and 2017, and Mozambique in 2016–2017 (Records of the OIE).
Phylogenetic reconstruction of the partial VP1-coding nucleotide sequence from SAT3 viruses has revealed at least six (I–VI) distinct topotypes. Amongst them, topotypes I–IV occur in southern Africa, whereas topotypes V and VI are unique to Uganda (12, 13). The SAT3 viruses belonging to different topotypes differed by 20% or more in complete nucleotide sequence alignments of the VP1-coding region (12). Studies comparing genetic variation and serological cross-reactivity have shown that SAT1 and SAT2 viruses from different topotypes are generally antigenic poorly related (16, 17). However, similar studies have not yet been undertaken for SAT3 viruses.
Studies focusing exclusively on SAT3 viruses are lacking. Limited studies have been performed to determine the genetic diversity of SAT3 viruses, but these studies were primarily based on partial VP1 sequences. Here, we assessed the intratypic SAT3 genetic variation of the VP1, VP2, VP3, and VP4 capsid proteins and antigenic cross-reactivity within the southern African SAT3 viruses. The analysis of antigenic variation is critical to allow proper vaccine selection or the design of vaccine antigens tailored for specific geographic localities, using reverse genetics.
Materials and Methods
Cells and Viruses
Instituto Biologico Renal Suino-2 cells (IB-RS-2) and primary pig kidney (PPK) cells were maintained and propagated in Roswell Park Memorial Institute (RPMI) medium (Sigma-Aldrich) supplemented with 10% (vol/vol) fetal bovine serum (FBS; Delta Bioproducts) and a 1 μg/ml amphotericin B and 0.5 mg/ml gentamycin mixture (Gibco) (18).
Twelve SAT3 viruses, collected from buffalo or cattle during 1990–2010 in southern Africa, were sequenced and used for genetic and antigenic analysis and an additional ten SAT3 P1 sequences available in GenBank were included for the genetic analysis. The viruses form part of the virus databank of the Agricultural Research Council-Onderstepoort Veterinary Research Institute (ARC-OVR), Transboundary Animal Diseases (TAD) Biosafety Level 3 (BSL-3) laboratory (South Africa). The species, which the viruses were isolated from, the country of origin, and year of isolation are summarized in Table 1. The viral isolates were initially passaged on PPK cells, prior to propagation on IB-RS-2 cells and harvested when maximum cytopathic effect (CPE) was observed or after 48 h. All viruses were titrated to determine the tissue culture infectious dose at 50% (TCID50). Virus growth medium (VGM) was prepared with RPMI supplemented with 5% (vol/vol) FBS and 1% (vol/vol) antibiotics/antimycotic mixture (Gibco). The SAT3/KNP/10/90, SAT3/SAR/1/06 (topotype I), and SAT3/BOT/6/98 (topotype II) viruses were selected as reference material for the preparation of antisera.
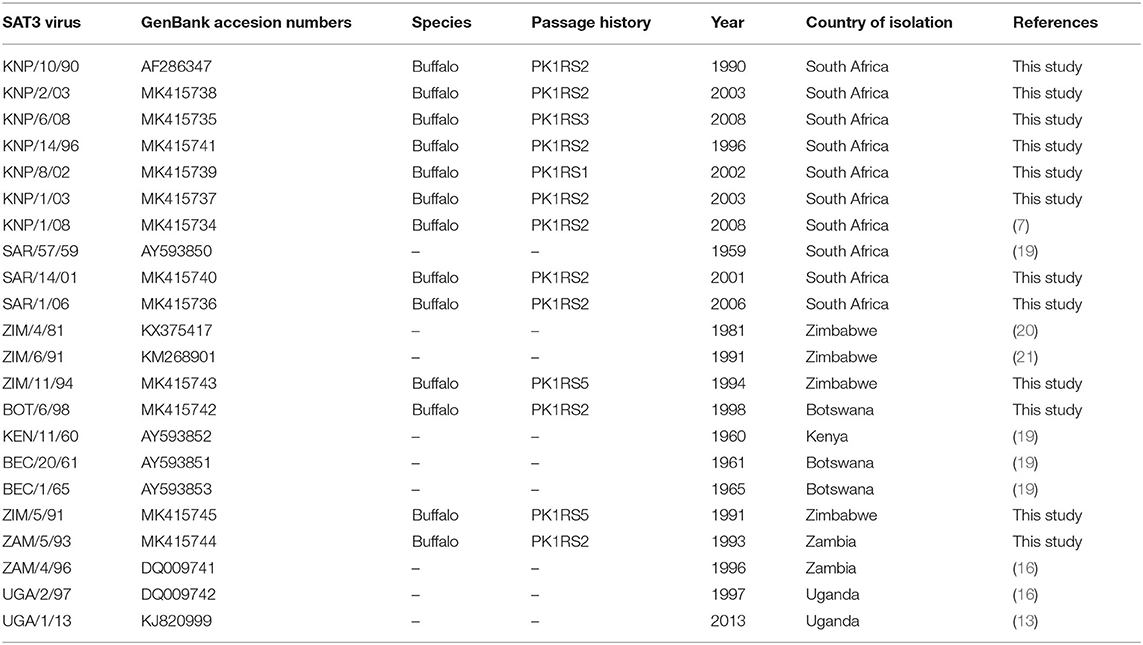
Table 1. List of SAT3 viruses used in the current study including species of isolation, passage history, year of isolation, and country of isolation.
Virus Titrations
The viral titers were determined in flat-bottomed microtiter plates (Nunc). Briefly, 0.5 log10 dilutions of the virus stocks were titrated into 96-well microtitre plates (Nunc), followed by addition of 3 × 10⁵ IB-RS-2 cells per well. Plates were incubated at 37°C with continuous CO2 influx. At 72 h post-inoculation the remaining intact cells were stained with 1% (wt/vol) methylene blue in 10% (vol/vol) formalin. The plaques were counted to calculate virus titers, which were expressed as tissue culture infectious dose 50% (TCID50) according to the method of Kärber (22).
RNA Extraction, cDNA Synthesis, PCR Amplification, and Sequencing
Viral RNA was extracted from infected cell culture supernatant using the QIAamp viral RNA mini extraction kit (Qiagen) and used as template for cDNA synthesis (23). First-strand cDNA synthesis was performed using the SuperScript® III First-Strand Synthesis System (Invitrogen) and the genome-specific oligonucleotide 2B (24) following the manufacturer's recommendations. The FMDV ca. 3.0 kb Leader/capsid-coding region was PCR amplified using the Expand High Fidelity PCR system (Roche) and flanking oligonucleotides NCR (5′-TAACAAGCGACACTCGGGATCT-3′) and WDA (5′-GAAGGGCCCAGGGTTGGACTC-3′) (25). Amplicons were purified from an agarose gel with the QIAquick® Gel Extraction Kit (Qiagen). Sequencing of the amplicons was performed using the ABI PRISM™ BigDye Terminator Cycle Sequencing Ready Reaction Kit v3.0 (Perkin Elmer Applied Biosystems) and resolved on an ABI PRISM 3100 Genetic Analyser (Applied Biosystems). The sequences were assembled using Sequencher 5.1 (GeneCodes). The GenBank accession numbers of the capsid-coding sequences are shown in Table 1. The nucleotide sequences were aligned using CLUSTAL_X (26) and phylogenetic trees were constructed using MEGA (27).
Preparation of Bovine Serum
Convalescent sera were obtained from cattle infected with the respective SAT3 reference viruses (SAT3/KNP/10/90, SAT3/SAR/1/06, and SAT3/BOT/6/98), 28 days post-infection (dpi). Groups of five cattle were inoculated intradermoligually with 1 ml of 104 TCID50 per ml of either of the reference viruses. Cattle were housed in the biosafety level 3 stables at the ARC-OVR, TAD. All procedures were approved by the ARC-OVR Animal Ethics Committee (Ethics approval number AEC18.11) according to national animal welfare standards and performed with the permission of the Department of Agriculture, Forestry, and Fisheries (Act 35 of 1984).
Sera collected from each infected cattle were inactivated at 56°C for 30 min. Inactivated sera from the five cattle for each group were pooled and the pooled sera were used in subsequent experiments.
Virus Neutralization Test
Antigenic cross-reactivity of FMDV against the convalescent animal sera was determined using the virus neutralization test (VNT) according to the World Organization for Animal Health (OIE) Manual of Diagnostic Tests and Vaccines for Terrestrial Animals (28). Briefly, the test serum was diluted 2-fold in VGM using 96-well microtitre (Nunc) plates, starting with a 1/8 dilution, and mixed with a virus suspension containing ~100 TCID50 per well. After 1 h of incubation at 37°C, 3 × 10⁵ IB-RS-2 cells were added to each well and incubated for a further 72 h at 37°C in a humid atmosphere containing 5% CO2. Cell-only controls were added to each plate and a virus titration control and positive serum control (cells, virus, and positive reference serum) were performed on each day. Plates were analyzed microscopically and colorimetrically for CPE and 50% end-point serum titers were calculated according to the method of Kärber (22). Virus neutralization titers were expressed as the log10 of the reciprocal serum dilution that protected the cells in 50% of the inoculated wells. All VNTs were performed at least three times. One-way antigenic relationships (r1-value) of the field virus isolates relative to the reference viruses were calculated, and expressed as the ratio between heterologous and homologous serum titer. The criteria of the OIE Manual (28) were applied for interpreting the antigenic relationships. Briefly, r1-values between 0 and 0.29 indicated significant antigenic variation from the reference viruses, and values of ≥0.30 demonstrated that the reference and field viruses are sufficiently antigenically similar.
Virus Purification
BHK-21 cell were seeded, based on cell counts performed using a haemocytometer and tryphan blue staining, into 8 × 750 cm2 plastic roller bottles (Corning) to obtain confluent monolayers. Confluent BHK-21 cell monolayers were infected at an multiplicity of infection (MOI) of 5–10 pfu/cell with SAT3/KNP/10/90, SAT3/BOT/6/98, SAT3/SAR/1/06, SAT3/KNP/14/96, or SAT3/SAR/14/01 in Glasgow's Minimal Essential Medium (GMEM) supplemented with 10% (vol/vol) tryptose phosphate broth (TPB), 3% (vol/vol) lactalbumin hydrolysate solution, 1% (vol/vol) FBS, 1% (vol/vol) antibiotic-antimycotic solution, and 25 mM HEPES buffer. Following incubation for 14–16 h at 37°C, the cells were lysed by addition of 10% (vol/vol) Nonidet P-40 and 0.5 M EDTA (pH > 7.4). The virus particles were recovered and concentrated from the lysed cell supernatants as described by Opperman et al. (29). The 146S virus particles were purified on a 10–50% (wt/vol) sucrose density gradient (SDG), prepared in TNE buffer (50 mM Tris [pH 7.5], 150 mM KCl, 10 mM EDTA), as described previously (30). Peak sucrose fractions corresponding to 146S virion particles were pooled and the amount of antigen was calculated (31).
Single Dilution Avidity ELISA (sd A-ELISA)
The protocol was adapted from Lavoria et al. (32). Briefly, Maxisorp ELISA plates were coated, in duplicate, overnight at 4°C with 200 ng of sucrose density gradient (SDG)-purified virus in 50 mM carbonate/bicarbonate buffer (pH 9.6). The plates were washed with phosphate-buffered saline (PBS) containing 0.05% (vol/vol) Tween-20 (PBS-0.05%T) and blocked at 37°C for 1.5 h with blocking buffer [PBS, 20% (vol/vol) FCS, 0.002% (wt/vol) thimerosal, and 0.1% (wt/vol) phenol red] and washed. The reference sera were diluted 1:40 in blocking buffer, added to the plates and incubated at 37°C for 1 h. The negative control sera consisted of a pool of five negative bovine sera. The plates were washed three times with PBS-0.05%T and then 4 M urea in PBS was added to one plate and PBS was added to the remaining plate. Following incubation at room temperature for 20 min, the plates were washed again before the FMDV-specific antibodies were detected with horseradish peroxidase-labeled anti-bovine conjugate (Sigma-Aldrich), diluted 1:20,000 in blocking buffer (29). The ELISA plates were developed using a substrate/chromogen solution, consisting of 4 mM 3,3′,5,5′-tetramethylbenzidine (Sigma-Aldrich) in substrate buffer (0.1 M citric acid monohydrate, 0.1 M tri-potassium citrate; pH 4.5) and 0.015% (vol/vol) of H2O2. The color reaction was stopped after 10 min with 1 M H2SO4 and the optical density (OD) was read at 450 nm using a Labsystems Multiscan Plus photometer. Mean OD values of samples and controls were corrected by subtracting mean blank OD values (cOD). The avidity index (AI) was calculated as described previously (32). Briefly, AI% = (cOD sample with urea/cOD sample without urea) × 100. AI were compared using one-way analysis of variance (ANOVA) and Benferroni's multiple comparison test (33) with a 95% confidence interval (CI) of difference; p-value < 0.5 indicated significance binding. The analysis was performed using GraphPad Prism v5.03 for Windows (GraphPad Software, Inc.).
Statistical Analysis of Gene Sequences and Virus Neutralization Titers
To identify genetic predictors of antigenic variation, amino acid substitutions between reference viruses and test viruses were tested using a model fitted to geometric (log2) VN titers, while accounting for phylogenetic relationships and non-antigenic variation in VN titers that can be attributed to day-to-day variability in tests performed on different dates. To prevent false support for substitutions that arise due to the evolutionary process, phylogenetic information was included in the model (17). A phylogenetic tree was reconstructed from aligned capsid nucleotide sequences using PhyML v3.0 (34). The general time reversible model with a proportion of invariant sites and a gamma distribution describing among-site rate variation (GTR + I + Γ4) was identified as the best model of nucleotide substitution using jModelTest v2.1.10 (35). Each combination of reference and test virus is separated by a unique combination of branches of the phylogeny. Phylogeny branches separating reference and test viruses were tested as correlating with antigenic change expressed in lower VN titers. In addition, phylogenetic terms associated with changes in immunogenicity were identified (branches). The optimal combination of amino acid position variables and phylogenetic variable was identified using a sparse hierarchical Bayesian model where each variable is associated with parameter estimate and in addition, a binary indicator variable that determines inclusion (1) or exclusion (0) in the model (36). The posterior mean of each indicator variable provides an estimate for the inclusion probability for each variable. Additionally, the model was used to estimate the proportion of all variables tested that should be included in an optimal model. Conditional effect sizes (coefficient estimated for a variable when present in the model, i.e., when associated indicator variable = 1) were mapped to branches of the phylogeny and visualized alongside a heatmap showing VN titers using the ggtree R package (37). Separately, a two-dimensional hierarchical clustering of reference and test viruses was performed and visualized as a heatmap.
Results
Antigenic Diversity Among SAT3 Viruses in Southern Africa
We applied one-way antigenic relationships (r1-values), measured by VNTs, to investigate the antigenic variability of viruses belonging to the SAT3 serotype in southern Africa. SAT3 viruses showed a significant degree of cross-reactivity to the sera of the SAT3 reference viruses (SAT3/SAR/1/06 and SAT3/BOT/6/98) (Table 2). At least 92% (n = 11) and 100% (n = 12) of the SAT3 viruses showed r1-values ≥0.3 to the SAT3/SAR/1/06 (topotype I) and SAT3/BOT/6/98 (topotype II) sera, respectively. However, one of the viruses in topotype I, SAT3/KNP/1/03, had an r1-value of <0.2 when tested against SAT3/SAR/1/06, but cross-reacted with SAT3/BOT/6/98 antisera with an r1-value of 0.39. Cross-reactivity to the SAT3/KNP/10/90 (topotype I) reference sera indicated that 67% (n = 8) of the viruses were neutralized by the sera with an r1-value above 0.3. Interestingly, three viruses showed r1-values >1.0 against SAT3/BOT/6/98 antisera and four viruses had a similar high cross-reactivity to the SAT3/SAR/1/06 antisera, one of which was as high as 2.24. We then investigated whether the higher neutralization titers of these viruses (KNP/10/90, SAR/14/01, KNP/14/96 and BOT/6/98) were as a result of increased avidity of the antisera to the particular viruses.
Table 2. Comparison of the number of variable amino acids in a pairwise alignment of the structural proteins (P1 polypeptide) and r1-values between reference viruses and test viruses.
The avidity index of the SAT3/BOT/6/98 and SAT3/SAR/1/06 bovine antisera against the SAT3 viruses with r1-values >1.0 (SAT3/KNP/10/90, SAT3/SAR/14/01, SAT3/KNP/14/96), and the homologous viruses is shown in Figure 1. The avidity index of the SAT3/KNP/10/90 (AI = 72%) and SAT3/SAR/14/01 (AI = 67%) viruses to the SAT3/SAR/1/06 antisera was higher than the avidity to the homologous virus (AI = 56%), albeit statistically insignificant (p > 0.05) (Figure 1A). Avidity values of <25% were observed for SAT3/BOT/6/98 and SAT3/KNP/14/96 viruses to the SAT3/SAR/1/06 antisera. In contrast, antibodies in SAT3/BOT/6/98 antisera bound with high avidity to the SAT3/KNP/10/90 (AI = 65%; p < 0.01), SAT3/SAR/14/01 (AI = 72%; p < 0.001), and SAT3/SAR/1/06 (AI = 47%; p > 0.05) viruses, while the avidity against the SAT3/KNP/14/96 (AI = 11%) and the homologous virus, SAT3/BOT/6/98 (AI = 28%), was lower (Figure 1B).
Figure 1. Avidity index of the SDG-purified SAT3 viruses SAT3/SAR/1/06, SAT3/BOT/6/98, SAT3/KNP/10/90, SAT3/SAR/14/01, and SAT3/KNP/14/96, to the bovine antisera raised against SAT3/SAR/1/06 (A) and SAT3/BOT/6/98 (B) are indicated. The data are means ± SD of quadruplicate experiments. **p < 0.01, ***p < 0.001 at 95% CI.
Genetic Variation in the Capsid Proteins of SAT3 Viruses
The intratypic nucleotide variation of the SAT3 P1 region was calculated to be 45.6% (n = 22) and is comparable to the intratypic variation reported for SAT1 (47.3%; n = 20) and SAT2 (48.9%; n = 23) viruses, but higher than types A (42.5%; n = 50) and O (38.2%; n = 41) (16, 19). The nucleotide and amino acid variation in a complete alignment of the SAT3 capsid proteins and coding region is summarized in Table 3. With the exception of SAT3/KNP/10/90, the P1 region of SAT3 viruses was 2,220 nucleotides in length and encodes 740 amino acids representing the four structural proteins. The VP1-coding region of SAT3/KNP/10/90 contains a three-nucleotide-insertion between nucleotides 252 and 253, which translates to an additional amino acid (lysine, K) in the βD-βE loop of the VP1 protein. Overall, in the capsid coding region, a total of 1,015 (45.7%) nucleotide positions were variant. The majority of the mutations in the P1 region (36.5%) were synonymous; however, at least 45% of the nucleotide substitutions in the VP1-coding region resulted in amino acid changes in the complete alignment.
Table 3. Variation within the nucleotide and amino acid sequences of the P1 coding region and deduced polyprotein in a complete alignment to each of the SAT3 reference viruses.
A maximum phylogenetic tree constructed from this alignment with topotypes and the positions of viruses further investigated using virus neutralization assays is shown in Figure 2. Phylogenetic resolution of capsid protein sequences of the SAT3 viruses confirmed five of the six topotypes, each with its unique geographic distribution. Topotype I included viruses from South Africa and southern Zimbabwe, topotype II encompassed viruses from Botswana and western Zimbabwe, and topotype IV viruses from Zambia.
Figure 2. Maximum likelihood phylogenetic tree constructed from aligned capsid (P1) nucleotide sequences, with mid-point root. Clades of the phylogeny corresponding to topotypes are labeled. Viruses tested as antigen in virus neutralization (VN) assays are marked with black circles and reference viruses also used to generate antiserum for VN assays are marked with red triangles. Internal nodes are labeled with bootstrap values and branch lengths indicate the estimated number of nucleotide substitutions per site.
A pairwise alignment of the capsid proteins of the SAT3 viruses with the corresponding proteins of each reference virus displayed variation in 28–70 of the amino acid positions, with most variation in the pairwise alignments with SAT3/BOT/6/98 (46–69 variable residues) (Table 2). No clear correlation was observed between the number of variable residues and r1-values to each of the reference viruses (Table 2).
In a complete alignment of the structural proteins, three regions of notable variability (amino acid entropy >1) were observed in the VP2 protein at amino acid positions 92–101 (βC-βD loop), 128–138 (βE-βF loop), and 208–217. In the VP3 protein, 23.5% variable amino acid positions were observed and residues with high entropy (>1) were positioned on the surface-exposed βE-βF loop at 131, 135, and 139 and in the C-terminus at residues 219–220. However, several regions with hypervariability were identified throughout the VP1 protein including: (i) N-terminal residues 7–16; (ii) the linear amino acid region that correlates with a T-cell epitope region in serotype O (39), also in the N-terminus (aa 21–26); (iii) a region in the βB-βC loop (aa 44–55) correlating with O1BFS antigenic site 3 (40); (iv) βD-βE loop (aa 79–91); (v) βF-βG loop (aa 109–116); (vi) residues 137–146 and 149–163 of the βG-βH loop; (vii) residues 175–185 and lastly, (viii) the C-terminus (aa 196–206 and aa 207–216).
Predicting Antigenic Substitutions in the Outer Capsid Proteins of SAT3 Viruses
Next, we explored the genetic basis of variation expressed in VN titers. In Figure 3, two heatmaps show the same VN titers (log10) for 12 viruses (rows) and reference antisera (columns) raised to three reference viruses organized in two ways: firstly, where test viruses (rows) are sorted according to the phylogeny and secondly where test viruses (rows) are sorted according to a hierarchical clustering of the VN titers. The hierarchical clustering analysis, also expressed in the dendograms to the right of the heatmaps, indicated that viruses of the same topotype did not consistently cluster together on the basis of cross-reactivity data.
Figure 3. Heatmaps of virus neutralization titers (VN) ordered by phylogeny and by hierarchical clustering. The two heatmaps show the same VN titers (log10) for 12 viruses (rows) and reference antisera (columns) raised to reference viruses SAT3/BOT/6/98, SAT3/SAR/1/06, and SAT3/KNP/10/90. To the left, rows of the heatmap are ordered according to the phylogenetic tree constructed from capsid nucleotide sequences (far left). To the right, rows of the heatmap are ordered according to a hierarchical clustering algorithm applied to VN titers—a dendogram generated by this algorithm is shown (far right). In both heatmaps, black framing is used to highlight homologous titers. Highlighted branches of the phylogeny were associated with variation in VN titers using a sparse hierarchical Bayesian model. Branch color indicates the average effect on titers: green indicates a branch where amino acid substitutions tended to lead to an increase in the VN titer to the three reference sera pools, while blue branches correlated with decreases in VN titers. No internal branches of the phylogeny tended to correlate with variation in VN titers. Topotype nomenclature appears next to clades of the phylogeny and alongside each virus name associated with the hierarchical clustering dendogram.
To probe the relationship between VN titers and genetic differences in greater detail, a sparse hierarchical Bayesian model was used to test whether substitutions at each non-conserved amino acid residue, within the VP1, VP2, and VP3 proteins, were predictors of reduced antigenic cross-reactivity. Residues would be selected if substitutions between test and reference virus tended to correlate with lower VN titers. The model also accounted for other sources of variation in measured VN titers (Supplementary Figure 1). When compared with the mean titers recorded for each virus and reference virus combination, the mean difference to these for individual recorded titers was 0.25 log10 titer (maximum 0.89). Some of the variation in recorded titers was attributed to day-to-day variability in the assay (Supplementary Figure 1B). The average residual difference between measured and fitted titers, after accounting for day-to-day variability was reduced to 0.15 log10 titer (maximum 0.83).
Variable representing amino acid substitutions were tested alongside terms representing branches of the phylogeny that could also identify branches leading to individual viruses or groups of viruses that tended to have higher VN titers, perhaps as a result of differences in avidity for the cellular receptor. Four well-supported branches, to which variation in VN titers mapped, are shown in the phylogenetic tree in Figure 3. Each branch effect is caused by the combined effect of one or more residue changes that significantly affect cross-reactivity between reference and test viruses. Each of the four identified branches were terminal branches leading to a single virus, three correlated with low VN titers and one branch with higher VN titers. The terminal branch for SAT3/KNP/14/96 significantly accounts (inclusion probability = 0.97) for an increase in antigenic cross-reactivity to all three reference sera pools. The increase in cross-reactivity reflected as high VN titers regardless of antisera used and was not due to a higher virus titer (4.7 ± 0.2 log10/ml) or increased avidity (AI = 13.95). Three branches in the phylogenetic tree significantly accounted for a reduction in antigenic cross-reactivity against all three reference sera pools. These branches could indicate that the viruses are antigenically distinct, or that they have low VN titers as a result of increased avidity for the cellular receptor. One highlighted branch caused a partitioning of a single topotype (III) from the rest of the tree (SAT3/ZIM/5/91). The virus SAT3/KNP/1/03, although genetically similar to SAT3/KNP/10/90 (38 aa differences in the capsid proteins), is antigenically distinct from the SAT3/KNP/10/90 and SAT3/SAR/1/06 reference viruses (r1-value <0.3). Similarly, the separation of SAT3/KNP/2/03 from the other topotype I viruses was associated with a decrease in cross-reactivity to the reference sera pools. From our data, the topotype IV virus SAT3/ZAM/5/93 does not seem to be antigenically different from the topotype I and II viruses.
The three branches in the phylogeny in Figure 3 identified as correlating with reduced VN titers lead to single viruses that are potentially antigenically distinct due to amino acid residue substitutions in the capsid protein. Amino acid substitutions mapping to each of these branches were identified. The branch leading to the virus SAT3/ZIM/5/91 correlated with 13 residue substitutions in the outer capsid proteins, while the branch leading to SAT3/KNP/1/03 correlated with substitutions at five residue positions, therefore there were several candidate substitutions in these two instances. Only two amino acid substitutions, VP1 L83Q and C164R, mapped to the terminal branch separating SAT3/KNP/2/03 from the rest of the tree; in fact, VP1 83L and 164C are conserved across each of the other 11 viruses in the dataset. Therefore, the substitutions VP1 L83Q and C164R are plausible candidates for causing a reduction in antigenic cross-reactivity. Of these two residues, VP1 164 aligns to a residue that is part of a known epitope in serotype O (17).
Across the phylogeny, three other terms representing amino acid substitutions were identified as correlating with reduced VN titers (Table 4) (model selection indicated terms with posterior inclusion probability >0.25 to have a reasonable level of support). The first of these terms with greatest support (inclusion probability = 0.88) represented simultaneous substitutions at VP2 residue 134 [Lys (10), Gln (1), Thr (1)] and VP3 168 [Phe (10), Tyr (2)], which only substituted together in this dataset and therefore could not be distinguished. The positions in the phylogeny where these residues were both substituted were terminal branches leading to viruses SAT3/KNP/1/03 (VP2 K134Q and VP3 F168Y) and SAT3/ZIM/5/91 (VP2 K134Q and VP3 F168Y), both of which had low titers against each of the three antisera used. Of these two residues, the VP2 residue 134 has been identified as being part of an epitope for serotype O and SAT2 viruses (17, 29, 40). Finally, genetic terms associated with VP1 residue 201 [Thr (8), Val (2), Ala (1), Arg (1)], which forms part of the VP1 C-terminus, and VP2 residue 209 [Tyr (9), Phe (2), His (1)] were also identified as potentially antigenically important with substitution, though with reduced support. The location of the latter six residues can be resolved on the predicted structure of serotype SAT3 capsid and is shown in Figure 4.
Table 4. Amino acid positions in the SAT3 capsid proteins with substitutions explaining a decrease in the VN titers.
Figure 4. (A) Schematic diagram of the capsid proteins showing the amino acid variation in a complete alignment and the relative positions of amino acid substitutions explaining a decrease in the VN titers. (B) A model of the FMDV SAT3 pentamer showing the amino acid residues that correspond to branch formation in a phylogenetic tree and a decline in cross-reactivity in VNTs. The inferred 3-D structure were generated using the SAT1 virus (protein data bank ID: 2WZR) as a template and the structural model rendered by Pymol v 1.8 (DeLano Scientific LLC). The capsid proteins VP1, VP2, and VP3 are shown in blue, green, and pink, respectively, while the exposed amino acid variants are indicated by red spheres. The 3-fold axis is depicted by the black triangles. The pore, located at the 5-fold axis of the capsid (black pentagon), is shown in the middle of the structure. The black lines connect the residues that changed simultaneously.
Discussion
The present study confirms the close antigenic relationship between SAT3 viruses in southern Africa using in vitro cross-reactivity studies. We then used the antigenic variability data and corresponding genetic and structural data to predict naturally occurring amino acid positions that correlated with antigenic changes. Knowledge of the molecular mechanisms of antigenic evolution are essential to implement systematic approaches to predict protection offered by reference vaccine viruses during prophylactic vaccination in endemic regions or emergency vaccination during an outbreak.
Of the three SAT serotype FMD viruses that occur in southern Africa, SAT3 has the most restricted distribution and outbreaks in livestock are only observed sporadically every 8–15 years (12). A comparison of the genetic diversity within the VP1 coding region of SAT3 viruses, collected between 1965 and 1999 in southern Africa and South-western Uganda, divided the SAT3 viruses into six topotypes (12). Findings from our study, using the complete P1 capsid-coding sequences of SAT3 viruses recovered between 1990 and 2008, substantiated the topotype definitions for SAT3 viruses in southern Africa. Viruses recovered from buffalo in the Kruger National Park, South Africa, and southern Zimbabwe clustered together based on the capsid-coding sequences. Topotype I lineage viruses in South Africa are maintained in buffalo from the Kruger National Park with an incursion every 8–15 years to cattle neighboring this endemic area. Topotype II viruses include viruses from Botswana and western Zimbabwe, while virus isolates from Zambia clustered separately in the phylogenetic tree, defined as topotype IV. The single isolate from northern Zimbabwe was genetically distinct and correlated to topotype III, as described by Bastos et al. (12).
The in vitro cross-reactivity analysis of SAT3 viruses was notably high, i.e., 67, 92, and 100% of the SAT3 viruses reacted strongly (r1-values ≥0.3) to the SAT3/KNP/10/90, SAT3/SAR/1/06, and SAT3/BOT/6/98 reference antisera. The implication is that, in a case of a cattle outbreak, vaccines consisting of any one of the three reference viruses will provide sufficient protection. Moreover, some of the SAT3 viruses reacted stronger to the reference sera than with the homologous virus (r1-value >1). Particularly, the SAT3/SAR/1/06 and SAT3/BOT/6/98 antisera were highly cross-reactive to the test viruses as indicated by r1-values >1. Similar results where heterologous cross-reactivity was higher than homologous reactivity have been documented with serotype A FMDV (17, 41). These findings indicate (i) similarities in shared epitopes between the reference and the field viruses, (ii) the reference viruses elicited broadly reactive antibodies in cattle, or (iii) antibodies with high avidity to SAT3 viruses were present. In an attempt to further investigate factors influencing this cross-reactivity, an avidity ELISA was performed to assess and characterize this high heterologous cross-reactivity (32, 42). An increased avidity of SAT3/BOT/6/98 antisera in binding to heterologous viruses (i.e., SAT3/KNP/10/90 and SAT3/SAR/14/01) could explain the higher neutralization titers observed for these viruses. Although higher avidity indexes have been linked to high neutralization titer, this is not always the case. Other factors, such as antibody class or IgG isotype, may also play a role.
The high amino acid variation of the VP1 protein (45% variable residue positions), compared to the other capsid proteins, indicates that VP1 is likely to be under immunologic pressure. Genetic changes and selection of antigenic variants are generally accepted to occur in persistently infected wildlife (8, 43, 44). The majority of variable residues are limited to particular surface-exposed structural loops and changes elsewhere may be under stringent structural and selective constraints (45). The fact that most of the SAT3 capsid amino acid positions with high entropy were identified in the VP1 protein emphasizes that this protein has a major immunogenic role and it also modulates the antigenic variability of the virus. Previous crystallographic studies and structure-based epitope predictions revealed that VP1 is important to interact with antibodies, especially the βG-βH loop and residues toward the 5-fold axis of the capsid (46, 47). The immunological role of an additional K residue within the βD-βE loop of the VP1 protein of one isolate is unknown. Although less variation was identified in the VP2 and VP3 proteins, these proteins still play an important role in antigenic variation of FMDV. A conformational epitope comprising of residues from the VP2 and VP3 capsid proteins and spanning the 3-fold axis, was also present (47–49). This emphasizes that cross-reactivity is influenced by main, variable capsid amino acid residues and may be affected more by residue interactions rather than residue changes (48, 50–52).
We identified substitutions with a profound effect on antigenic variation that were likely associated with immune evasion. Variation at two residue positions in the VP1 protein, residues 83 and 169, were associated with reduced titers against SAT3/KNP/10/90 and SAT3/SAR/1/06 antisera. The VP1 residues 83 and 169 are located at opposite sides of an elevated plateau on the capsid surface, with residue 83 forming an exposed cluster around the 5-fold axis and residue 169 located at the C-terminal base of the VP1 βG-βH loop. The VP1 residue 83 of SAT2 viruses has been found to be accessible to interact with glycosaminoglycan (18), confirming its accessibility to interact with cellular receptors. Similarly, residues 134 in VP2 and 168 in VP3 together, were associated with an antigenic effect for SAT3/KNP/1/03 and SAT3/ZIM/5/91. It is reasonable to hypothesize that the two residues together function as a conformational epitope, however, the same variation in VN titer is equally well-explained by VP2 K134Q/T substitution. The VP2 residue 134 has been described as an antigenic site for serotypes O and SAT2, and is located on a surface exposed structural loop and is structurally more favorable to contribute to variation in antigenicity (48, 49). Residue 168 in VP3 has not been described to play a role in antigenicity before. Both residues are located in a shallow, structural depression, located at the junction between the three major capsid proteins VP2, VP3, and VP1 (Figure 4). Two other residues have also been associated with antigenic variation in SAT3 viruses, one in the C-terminal end of VP2 and the other located on the C-terminus of VP1. Only the VP1 C-terminus residue corresponds to a described antigenic site in serotype O (40, 48).
Amino acids that are important for the antigenicity of SAT1 viruses have been identified at positions 135 or 71 or 76 of VP3; 72 of VP2 and 181 of VP1; and 111 of VP1 using MAb resistant (mar) mutants (49). Similarly, residues 72 or 79 of VP2; 158 of VP1; and 154 or 158 in the βG-βH loop of VP1 of SAT2 viruses have been shown to interact with MAbs or affect the antigenicity of the virus (29, 49). At least five neutralizing antigenic sites, involving the three outer-capsid proteins, have been identified for serotype O viruses. The most prominent surface exposed structure, the βG-βH loop of VP1, and the C-terminus of VP1 have been shown to contribute to antigenic site 1 of serotype O viruses, with critical residues at position 144, 148, 154, and 208 (53–56). Amino acid residues at positions 70–73, 75, 77, and 131 of VP2, 56 and 58 of VP3, and 43 and 44 of VP1 contributes to the remaining antigenic site for serotype O (56). Mar-mutants identified three antigenic sites within the VP1, VP2, and VP3 proteins for serotype A viruses A10, A12, and A22 with residue positions 148, 149, 152, 153, 168, and 205 within VP1 important for antigenicity (57–60). Here, for the first time, we have mapped four unique amino acid regions associated with antigenic changes in SAT3 viruses. In two of these regions two amino acid residues changed together to affect the antigenicity of the virus, i.e., residues 83 and 169 of VP1 and residues 134 in VP2 and 168 in VP3.
We have successfully used phenotypic data, combined with genotypic and structural information in our mathematical models to delineate antigenic sites for SAT3 viruses. The analysis of antigenic differences in outbreak viruses is critical to allow proper vaccine selection for effective control or the design of vaccine antigens tailored for specific geographic localities, using reverse genetics. This work could be further validated using a reverse genetics approach to immune-dampen specific residues to identify its antigenic significance. We anticipate that identifying unique residues associated with a change in cross-reactivity will contribute to improved vaccine development and assessment.
Data Availability Statement
The datasets presented in this study can be found in online repositories. The names of the repository/repositories and accession number(s) can be found in the article/Supplementary Material.
Ethics Statement
The animal study was reviewed and approved by Agricultural Research Council, Onderstepoort Veterinary Research, Animal Ethics Committee.
Author Contributions
WH, JT, RR, and FM conceived and designed the experiments. LM, WH, LR, and PO performed the experiments. RR and FM contributed the materials/analysis tools. LM, WH, LR, PO, JT, RR, and FM wrote the paper. All authors contributed to the article and approved the submitted version.
Funding
The Biotechnology and Biological Sciences Research Council (BBSRC) Department for International Development financially supported the research to determine one-way relationship and antigenic relatedness of SAT viruses [BB/H009175/1] (http://www.bbsrc.ac.uk). BBSRC also funded RR under grant BB/R012679/1. WH was funded by the Medical Research Council (UK) under grant MR/R024758/1. The funders had no role in study design, data collection and analysis, decision to publish, or preparation of the manuscript.
Conflict of Interest
The authors declare that the research was conducted in the absence of any commercial or financial relationships that could be construed as a potential conflict of interest.
The reviewer DK declared a past collaboration with the author RR to the handling editor.
Acknowledgments
The authors would like to express their gratitude to the personnel at Transboundary Animal Diseases (TAD) of the ARC-OVI for their contributions to virus isolation and animal work. The authors would like to thank Dr. M. Van Kleef for commenting and critical reading of the manuscript.
Supplementary Material
The Supplementary Material for this article can be found online at: https://www.frontiersin.org/articles/10.3389/fvets.2020.00568/full#supplementary-material
Supplementary Figure 1. Variability in virus neutralization titers (log10) for 12 viruses tested using antisera raised to reference strains SAT3/BOT/6/98, SAT3/SAR/1/06, and SAT3/KNP/10/90 (N = 198). (A) Histogram of absolute differences in measured titers and the mean log10 titer recorded for each virus and reference strain combination. (B) Violin plot showing posterior model estimates of the variation in VN titers that can be attributed to variability between experiments carried out on 15 different days. Each violin represents 1,600 values sampled from eight independent MCMC chains. Black horizontal lines represent median values. (C) Histogram showing residuals from a model fitted to VN titers—each residual is the absolute difference between a measured titer adjusted for day-to-day variation and the fitted, underlying titer for the particular virus and reference strain combination. (D) Scatterplot showing measured VN titers (black circles) and those same VN titers adjusted to account for day-to-day variability (red crosses) plotted against the fitted, underlying titer for a particular virus and reference strain combination.
References
1. Jemberu W, Mourits M, Sahle M, Siraw B, Vernooij J, Hogeveen H. Epidemiology of foot and mouth disease in Ethiopia: a retrospective analysis of district level outbreaks, 2007–2012. Transbound Emerg Dis. (2016) 63:e246–59. doi: 10.1111/tbed.12338
2. Scoones I, Bishi A, Mapitse N, Moerane R, Penrith M, Sibanda R, et al. Foot-and-mouth disease and market access: challenges for the beef industry in southern Africa. Pastoralism. (2010) 1:135–64. doi: 10.3362/2041-7136.2010.010
3. Ferguson K, Cleaveland S, Haydon D, Caron A, Kock R, Lembo T, et al. Evaluating the potential for the environmentally sustainable control of foot and mouth disease in Sub-Saharan Africa. EcoHealth. (2013) 10:314–22. doi: 10.1007/s10393-013-0850-6
4. FAO/OIE. The Global Foot and Mouth Disease Control Strategy: Strengthening Animal Health Systems Through Improved Control of Major Diseases. Paris: OIE (2012).
5. Thomson G. Overview of foot and mouth disease in southern Africa. Rev Sci Tech. (1995) 14:503–503. doi: 10.20506/rst.14.3.855
6. Miguel E, Grosbois V, Caron A, Boulinier T, Fritz H, Cornélis D, et al. Contacts and foot and mouth disease transmission from wild to domestic bovines in Africa. Ecosphere. (2013) 4:1–32. doi: 10.1890/ES12-00239.1
7. Maree F, de Klerk-Lorist L, Gubbins S, Zhang F, Seago J, Pérez-Martín E, et al. Differential persistence of foot-and-mouth disease virus in African buffalo is related to virus virulence. J Virol. (2016) 90:5132–40. doi: 10.1128/JVI.00166-16
8. Bastos A, Haydon D, Sangare O, Boshoff C, Edrich J, Thomson G. The implications of virus diversity within the SAT 2 serotype for control of foot-and-mouth disease in sub-Saharan Africa. J Gen Virol. (2003) 84:1595–606. doi: 10.1099/vir.0.18859-0
9. Dyason E. Summary of foot-and-mouth disease outbreaks reported in and around the Kruger National Park, South Africa, between 1970 and 2009. J South Afr Vet Assoc. (2010) 81:201–6. doi: 10.4102/jsava.v81i4.148
10. Hall M, Knowles N, Wadsworth J, Rambaut A, Woolhouse M. Reconstructing geographical movements and host species transitions of foot-and-mouth disease virus serotype SAT 2. MBio. (2013) 4:e00591–613. doi: 10.1128/mBio.00591-13
11. Bastos A, Haydon D, Forsberg R, Knowles N, Anderson E, Bengis R, et al. Genetic heterogeneity of SAT-1 type foot-and-mouth disease viruses in southern Africa. Archiv Virol. (2001) 146:1537–51. doi: 10.1007/s007050170077
12. Bastos A, Anderson E, Bengis R, Keet D, Winterbach H, Thomson G. Molecular epidemiology of SAT3-type foot-and-mouth disease. Virus Genes. (2003) 27:283–90. doi: 10.1023/A:1026352000959
13. Dhikusooka M, Tjørnehøj K, Ayebazibwe C, Namatovu A, Ruhweza S, Siegismund H, et al. Foot-and-mouth disease virus serotype SAT 3 in long-horned Ankole calf, Uganda. Emerg Infect Dis. (2015) 21:111. doi: 10.3201/eid2101.140995
14. Meeser M. Foot-and-mouth disease in game animals with special reference to the impala (Aepyceros melampus). J South Afr Vet Med Assoc. (1962) 33:351–5.
15. Thomson G, Bengis R, Esterhuysen J, Pini A. Maintenance mechanisms for foot-and-mouth disease virus in the Kruger National Park and potential avenues for its escape into domestic animal populations. In: Proceedings of the XIII World Congress on Disease of Cattle. Durban (1984). p. 33–8.
16. Maree F, Blignaut B, Esterhuysen J, De Beer T, Theron J, O'Neill H, et al. Predicting antigenic sites on the foot-and-mouth disease virus capsid of the South African territories types using virus neutralization data. J Gen Virol. (2011) 92:2297–309. doi: 10.1099/vir.0.032839-0
17. Reeve R, Borley D, Maree F, Upadhyaya S, Lukhwareni A, Esterhuysen J, et al. Tracking the antigenic evolution of foot-and-mouth disease virus. PLoS ONE. (2016) 11:e0159360. doi: 10.1371/journal.pone.0159360
18. Maree F, Blignaut B, De Beer T, Visser N, Rieder E. Mapping of amino acid residues responsible for adhesion of cell culture-adapted foot-and-mouth disease SAT type viruses. Virus Res. (2010) 153:82–91. doi: 10.1016/j.virusres.2010.07.010
19. Carrillo C, Tulman E, Delhon G, Lu Z, Carreno A, Vagnozzi A, et al. Comparative genomics of foot-and-mouth disease virus. J Virol. (2005) 79:6487–504. doi: 10.1128/JVI.79.10.6487-6504.2005
20. You S, Pyo H, Lee S, Ko M, Choi J, Shin S, et al. Complete genome sequence of foot-and-mouth disease virus serotype SAT3 Zimbabwe/4/81. Genome Announc. (2016) 4:e00801-16. doi: 10.1128/genomeA.00801-16
21. Logan G, Freimanis G, King D, Valdazo-González B, Bachanek-Bankowska K, Sanderson N, et al. A universal protocol to generate consensus level genome sequences for foot-and-mouth disease virus and other positive-sense polyadenylated RNA viruses using the Illumina MiSeq. BMC Genomics. (2014) 15:828. doi: 10.1186/1471-2164-15-828
22. Kärber G. Beitrag zur kollektiven Behandlung pharmakologischer Reihenversuche. Archiv Exp Pathol Pharmakol. (1931) 162:480–3. doi: 10.1007/BF01863914
23. Bastos A. Detection and characterization of foot-and-mouth disease virus in sub-Saharan Africa. Onderstepoort J Vet Res. (1998) 65:37–47.
24. Vangrysperre W, De Clercq K. Rapid and sensitive polymerase chain reaction based detection and typing of foot-and-mouth disease virus in clinical samples and cell culture isolates, combined with a simultaneous differentiation with other genomically and/or symptomatically related viruses. Archiv Virol. (1996) 141:331–44. doi: 10.1007/BF01718403
25. Maree F, Blignaut B, Aschenbrenner L, Burrage T, Rieder E. Analysis of SAT1 type foot-and-mouth disease virus capsid proteins: influence of receptor usage on the properties of virus particles. Virus Res. (2011) 155:462–72. doi: 10.1016/j.virusres.2010.12.002
26. Thompson J, Gibson T, Plewniak F, Jeanmougin F, Higgins D. The CLUSTAL_X windows interface: flexible strategies for multiple sequence alignment aided by quality analysis tools. Nucleic Acids Res. (1997) 25:4876–82. doi: 10.1093/nar/25.24.4876
27. Tamura K, Stecher G, Peterson D, Filipski A, Kumar S. MEGA 6: molecular evolutionary genetics analysis version 6.0. Mol Biol Evol. (2013) 30:2725–9. doi: 10.1093/molbev/mst197
28. OIE. Manual of Diagnostic Tests and Vaccines for Terrestrial Animals. Foot and Mouth Disease (Infection With Foot and Mouth Disease Virus). Chapter 3.1.8. Paris: Office International des Epizooties (2018).
29. Opperman P, Rotherham L, Esterhuysen J, Charleston B, Juleff N, Capozzo A, et al. Determining the epitope dominance on the capsid of a serotype SAT2 foot-and-mouth disease virus by mutational analyses. J Virol. (2014) 88:8307–18. doi: 10.1128/JVI.00470-14
30. Knipe T, Rieder E, Baxt B, Ward G, Mason P. Characterization of synthetic foot-and-mouth disease virus provirions separates acid-mediated disassembly from infectivity. J Virol. (1997) 71:2851–6. doi: 10.1128/JVI.71.4.2851-2856.1997
31. Doel T, Mowat G. An international collaborative study on foot and mouth disease virus assay methods. 2. Quantification of 146S particles. J Biol Standard. (1985) 13:335–44. doi: 10.1016/S0092-1157(85)80048-2
32. Lavoria M, Di-Giacomo S, Bucafusco D, Franco-Mahecha O, Pérez-Filgueira D, Capozzo A. Avidity and subtyping of specific antibodies applied to the indirect assessment of heterologous protection against foot-and-mouth disease virus in cattle. Vaccine. (2012) 30:6845–50. doi: 10.1016/j.vaccine.2012.09.011
33. Hochberg Y. A sharper Bonferroni procedure for multiple tests of significance. Biometrika. (1988) 75:800–2. doi: 10.1093/biomet/75.4.800
34. Guindon S, Dufayard J, Lefort V, Anisimova M, Hordijk W, Gascuel O. New algorithms and methods to estimate maximum-likelihood phylogenies: assessing the performance of PhyML 3.0. Syst Biol. (2010) 59:307–21. doi: 10.1093/sysbio/syq010
35. Darriba D, Taboada G, Doallo R, Posada D. jModelTest 2: more models, new heuristics and parallel computing. Nat Methods. (2012) 9:772. doi: 10.1038/nmeth.2109
36. Davies V, Reeve R, Harvey W, Maree F, Husmeier D. A sparse hierarchical Bayesian model for detecting relevant antigenic sites in virus evolution. Comput Stat. (2017) 32:803–43. doi: 10.1007/s00180-017-0730-6
37. Yu G, Smith D, Zhu H, Guan Y, Lam T. ggtree: an r package for visualization and annotation of phylogenetic trees with their covariates and other associated data. Methods Ecol Evol. (2017) 8:28–36. doi: 10.1111/2041-210X.12628
38. Vosloo W, Bastos A, Sangare O, Hargreaves S, Thomson G. Review of the status and control of foot and mouth disease in sub-Saharan Africa. Rev Sci Tech. (2002) 21:437–45. doi: 10.20506/rst.21.3.1349
39. Bittle J, Houghten R, Alexander H, Shinnick T, Sutcliffe J, Lerner R, et al. Protection against foot-and-mouth disease by immunization with a chemically synthesized peptide predicted from the viral nucleotide sequence. Nature. (1982) 298:30–3. doi: 10.1038/298030a0
40. Mateu M, Hernández J, Martinez M, Feigelstock D, Lea S, Pérez J, et al. Antigenic heterogeneity of a foot-and-mouth disease virus serotype in the field is mediated by very limited sequence variation at several antigenic sites. J Virol. (1994) 68:1407–17. doi: 10.1128/JVI.68.3.1407-1417.1994
41. Ludi A, Horton D, Li Y, Mahapatra M, King D, Knowles N, et al. Antigenic variation of foot-and-mouth disease virus serotype A. J Gen Virol. (2014) 95:384–92. doi: 10.1099/vir.0.057521-0
42. Bachmann M, Kalinke U, Althage A, Freer G, Burkhart C, Roost H, et al. The role of antibody concentration and avidity in antiviral protection. Science. (1997) 276:2024–7. doi: 10.1126/science.276.5321.2024
43. Bengis R, Hedger R, Pini A, De Vos V, Thomson G. Foot-and-mouth disease and the African buffalo (Syncerus caffer): 1. Carriers as a source of infection for cattle. Onderstepoort J Vet Res. (1986) 53:69–73.
44. Haydon D, Bastos A, Knowles N, Samuel A. Evidence for positive selection in foot-and-mouth disease virus capsid genes from field isolates. Genetics. (2001) 157:7–15.
45. Reeve R, Blignaut B, Esterhuysen J, Opperman P, Matthews L, Fry E, et al. Sequence-based prediction for vaccine strain selection and identification of antigenic variability in foot-and-mouth disease virus. PLoS Comput. Biol. (2010) 6:e1001027. doi: 10.1371/journal.pcbi.1001027
46. Acharya R, Fry E, Stuart D, Fox G, Rowlands D, Brown F. The structure of foot-and-mouth disease virus: implications for its physical and biological properties. Vet Microbiol. (1990) 23:21–34. doi: 10.1016/0378-1135(90)90134-H
47. Borley D, Mahapatra M, Paton D, Esnouf R, Stuart D, Fry E. Evaluation and use of in-silico structure-based epitope prediction with foot-and-mouth disease virus. PLoS ONE. (2013) 8:e0061122. doi: 10.1371/journal.pone.0061122
48. Crowther J, Farias S, Carpenter W, Samuel A. Identification of a fifth neutralizable site on type O foot-and-mouth disease virus following characterization of single and quintuple monoclonal antibody escape mutants. J Gen Virol. (1993) 74:1547–53. doi: 10.1099/0022-1317-74-8-1547
49. Grazioli S, Moretti S, Barbieri I, Crosatti M, Brocchi E. Use of monoclonal antibodies to identify and map new antigenic determinants involved in neutralisation on FMD viruses type SAT 1 and SAT 2. In: Report of the Session of the Research Foot and Mouth Disease Group of the Standing Committee of the European Commision of Foot and Mouth Disease. Paphos: Food and Agriculture Organization (2013). p. 287–97.
50. Parry N, Fox G, Rowlands D, Brown F, Fry E, Acharya R, et al. Structural and serological evidence for a novel mechanism of antigenic variation in foot-and-mouth disease virus. Nature. (1990) 347:569–72. doi: 10.1038/347569a0
51. Samuel A, Knowles N, Kitching R. Serological and biochemical analysis of some recent type A foot-and-mouth disease virus isolates from the Middle East. Epidemiol Infect. (1988) 101:577–90. doi: 10.1017/S0950268800029447
52. Hernández J, Martínez M, Rocha E, Domingo E, Mateu M. Generation of a subtype-specific neutralization epitope in foot-and-mouth disease virus of a different subtype. J Gen Virol. (1992) 73:213–6. doi: 10.1099/0022-1317-73-1-213
53. Kitson J, McCahon D, Belsham G. Sequence analysis of monoclonal antibody resistant mutants of type O foot and mouth disease virus: evidence for the involvement of the three surface exposed capsid proteins in four antigenic sites. Virology. (1990) 179:26–34. doi: 10.1016/0042-6822(90)90269-W
54. McCahon D, Crowther J, Belsham G, Kitson J, Duchesne M, Have P, et al. Evidence for at least four antigenic sites on type O foot-and-mouth disease virus involved in neutralization; identification by single and multiple site monoclonal antibody-resistant mutants. J Gen Virol. (1989) 70:639–45. doi: 10.1099/0022-1317-70-3-639
55. Xie Q, McCahon D, Crowther J, Belsham G, McCullough K. Neutralization of foot-and-mouth disease virus can be mediated through any of at least three separate antigenic sites. J Gen Virol. (1987) 68:1637–47. doi: 10.1099/0022-1317-68-6-1637
56. Mahapatra M, Hamblin P, Paton D. Foot-and-mouth disease virus epitope dominance in the antibody response of vaccinated animals. J Gen Virol. (2012) 93:488–93. doi: 10.1099/vir.0.037952-0
57. Thomas A, Woortmeijer R, Puijk W, Barteling S. Antigenic sites on foot-and-mouth disease virus type A10. J Virol. (1988) 62:2782–9. doi: 10.1128/JVI.62.8.2782-2789.1988
58. Baxt B, Garmendia A, Morgan D. Characterization of anti-idiotypic antibodies generated against foot-and-mouth disease virus neutralizing monoclonal antibodies. Viral Immunol. (1989) 2:103–13. doi: 10.1089/vim.1989.2.103
59. Bolwell C, Brown A, Barnett P, Campbell R, Clarke B, Parry N, et al. Host cell selection of antigenic variants of foot-and-mouth disease virus. J Gen Virol. (1989) 70:45–57. doi: 10.1099/0022-1317-70-1-45
Keywords: foot-and-mouth disease (FMD), Southern African Territory (SAT) type 3, antigenic, cross-reactivity, antigenic matching, phylogeny, virus neutralization test
Citation: Maake L, Harvey WT, Rotherham L, Opperman P, Theron J, Reeve R and Maree FF (2020) Genetic Basis of Antigenic Variation of SAT3 Foot-And-Mouth Disease Viruses in Southern Africa. Front. Vet. Sci. 7:568. doi: 10.3389/fvets.2020.00568
Received: 20 April 2020; Accepted: 16 July 2020;
Published: 08 September 2020.
Edited by:
Wilna Vosloo, Commonwealth Scientific and Industrial Research Organisation (CSIRO), AustraliaReviewed by:
Begona Valdazo-Gonzalez, Lab Services Ltd, United KingdomSuresh H. Basagoudanavar, ICAR-Indian Veterinary Research Institute, India
Donald King, Pirbright Institute, United Kingdom
Copyright © 2020 Maake, Harvey, Rotherham, Opperman, Theron, Reeve and Maree. This is an open-access article distributed under the terms of the Creative Commons Attribution License (CC BY). The use, distribution or reproduction in other forums is permitted, provided the original author(s) and the copyright owner(s) are credited and that the original publication in this journal is cited, in accordance with accepted academic practice. No use, distribution or reproduction is permitted which does not comply with these terms.
*Correspondence: Francois F. Maree, bWFyZWVmQGFyYy5hZ3JpYy56YQ==