 Li-li Guo1,2
 Yong-da Zhao
- 1College of Veterinary Medicine, Qingdao Agricultural University, Qingdao, China
- 2National Risk Assessment Laboratory for Antimicrobial Resistance of Microorganisms in Animals, College of Veterinary Medicine, South China Agricultural University, Guangzhou, China
Tulathromycin is a semi-synthetic macrolide antimicrobial that has an important role in veterinary medicine for respiratory disease. The objective of the study was to develop a pharmacokinetic/pharmacodynamic (PK/PD) model to examine the efficacy and determine an optimal dosage of tulathromycin intramuscular (IM) treatment against Haemophilus parasuis infection induced after intraperitoneal inoculation in neutropenic guinea pigs. The PKs of tulathromycin in serum and lung tissue after intramuscular administration at doses of 1, 10, and 20 mg/kg in H. parasuis-infected neutropenic guinea pigs were evaluated by liquid chromatography-tandem mass spectrometry (LC-MS/MS). The tulathromycin minimum inhibitory concentration (MIC) against H. parasuis was ~16 times lower in guinea pig serum (0.03 μg/mL) than in cation-adjusted Mueller-Hinton broth (CAMHB) (0.5 μg/mL). The ratio of the 168-h area under the concentration-time curve (AUC) to MIC (AUC168h/MIC) positively correlated with the in vivo antibacterial effectiveness of tulathromycin (R2 = 0.9878 in serum and R2 = 0.9911 in lung tissue). The computed doses to achieve a reduction of 2-log10 CFU/lung from the ratios of AUC72h/MIC were 5.7 mg/kg for serum and 2.5 mg/kg for lung tissue, which lower than the values of 13.2 mg/kg for serum and 8.9 mg/kg for lung tissue with AUC168h/MIC. In addition, using as objective a 2-log10 reduction and an AUC0−72h as the value of the PK/PD index could be more realistic. The results of this study could provide a solid foundation for the application of PK/PD models in research on macrolide antibiotics used to treat respiratory diseases.
Introduction
Haemophilus parasuis, a Gram-negative bacterium (1), is a commensal organism of the upper respiratory tract and a major cause of swine respiratory disease (SRD) in swine. It is also the etiological agent of Glasser's disease, the clinical symptoms of which are high fever, severe coughing, abdominal breathing, and swollen joints, in addition to the central nervous system (CNS) signs such as lateral decubitus, paddling, and trembling (2–5). At least 15 different genotypes and serotypes of H. parasuis have been described (6, 7) where serotypes 4, 5, and 13 are the most prevalent in some countries of America, Europe, and Asia (8–17) and serotypes 5 and 13 are the most virulent of all the known serotypes (18, 19).
Usually, the relationship of pharmacokinetics (PK) and pharmacodynamics (PD) is used to design the optimal antimicrobial drug dosage (20–23), and to minimize the risk of selection of antibiotic resistance (20, 24, 25). Thus, PK/PD modeling has become an important tool and has been widely applied in human medicine and the veterinary field (26–28). In particular, an in vivo PK/PD model has some advantages over an ex vivo PK/PD model by avoiding some of the limitations of ex vivo PK/PK models. For example, in drug investigation of drug metabolism and body clearance, ex vivo PK/PD models do not exhibit the natural decline in concentration of antibiotics through drug elimination in animals because the animals are continuously exposed to a fixed concentration of the agent over a prescribed period of time (29). In addition, the concentration of a drug in the target site usually varies from that in serum or tissue cage fluid. Because in vivo PK/PD models can account for natural changes in antibacterial concentrations, they can provide more accurate clinical data (29).
Tulathromycin is a semi-synthetic macrolide developed solely for veterinary use by the pharmaceutical company Pfizer Inc. for its potent activity against H. parasuis (30, 31). In veterinary medicine, tulathromycin is highly effective against respiratory diseases in cattle, swine, horses, and goats (32–37). Recently, researchers used serum or tissue cage fluid to investigate the pharmacokinetics and ex vivo pharmacodynamic activity of tulathromycin against Pasteurella multocida (38) and Streptococcus suis (39) in pigs, and against Mannheimia haemolytica and Pasteurella multocida (40) in cattle, and ex-vivo PK/PD model of tulathromycin against H. parasuis in intraperitoneal-inoculated neutropenic guinea pigs (41). However, no study has reported on in vivo PK/PD profiles of tulathromycin in pigs.
Currently, many PK attributes of tulathromycin have been studied in different target animals, such as goats, horses, pigs, and cattle (32, 42–46). However, of the common laboratory animals, only mice (47) and rabbits (48) have been used in tulathromycin studies, whereas, guinea pigs have not. Nevertheless, many reports have shown that guinea pigs can be used as pneumonia models for Gram-negative bacilli (49). Furthermore, guinea pigs have been used as an effective animal model to study the pathogenesis and diagnosis of and immunization against H. parasuis infection (18, 50, 51). Thus, we endeavored to examine the PK/PD of a commonly used antibiotic macrolide, tulathromycin, in a guinea pig infection model.
An experimental H. parasuis-infected, neutropenic guinea pig model was developed to investigate the PKs and PDs of tulathromycin and its efficacy against infections in vivo. The quantity of H. parasuis in serum and lung tissue samples was detected using the viable count method. Our in vivo PK/PD study had two primary objectives: (1) to determine a PK/PD index associated with the potential variability of tulathromycin efficacy; (2) to elucidate the optimal PK/PD parameters to predict efficacy; (3) to assess the different possible clinical situations ranging from a mild infection in a non-immunocompromised animal up to a severe infection in an immunocompromised animal. The data from this study can help improve the use of tulathromycin treatment with respect to bacteriological and clinical outcomes by providing a rational approach to the design of optimal dosage regimens for target animals.
Materials and Methods
Organisms, Chemicals, and Susceptibility Assay
A standard strain of H. parasuis, serotype 13 (13R), was provided by Professor Huanchun Chen (College of Veterinary Medicine, Huazhong Agricultural University, Wuhan, China), which is one of the most prevalent and the most virulent of H. parasuis (8–13, 16, 17, 19). Tulathromycin (99.85%) was supplied by Shandong Lukang Pharmaceutical Co., Ltd (Shandong, China). Roxithromycin was purchased from National Institutes for Food and Drug Control (Beijing, China) and used as an internal standard. An injectable solution of tulathromycin (Draxxin) was purchased from Zoetis (New York, USA) and used for IM administration to guinea pigs. The MIC of tulathromycin against H. parasuis 13R was determined by a microdouble-dilution method according to protocols by the Clinical and Laboratory Standards Institute (52) and a previous report (53). The H. parasuis strain was cultured to reach the exponential phase and diluted to ~1 × 10⁶ CFU/mL. A series of concentrations of tulathromycin were prepared by doubling dilutions (final concentrations ranged from 0.015 to 8 μg/mL) with CAMHB medium. A 0.1 mL aliquot of this media with different concentrations of tulathromycin was added to a 96-well plate and another 0.1 mL aliquot of prepared H. parasuis 13R was added to each well to reach final titers of ~5 × 10⁵ CFU/mL. Tests were conducted in triplicate and included growth controls (H. parasuis in the CAMHB only), and germ-free controls (blank media only). The bacteria in the 96-well plates were cultured at 37°C for 24 h. The MIC value was defined as the lowest concentration exhibiting no visible growth of H. parasuis. The MIC of tulathromycin against H. parasuis 13R in serum was determined by the same method described above.
Experimental Models and Sample Collection
Neutropenia Model
In order to study the efficacy of tulathromycin, alone, and to reduce the inherent variability in immunity among different guinea pigs, a neutropenic model was used. The Qingdao Agriculture University Animal ethics committee approved the animal experiment procedures (No. 2020-025). All procedures were performed to minimize animal suffering as defined by the guidelines issued by this committee. Three-week old guinea pigs (240–250 g) were provided by the Laboratory Animal Center, Qingdao Agriculture University in Qingdao, China (License number: SCXK (LU) 2018–2022). Guinea pigs were free of H. parasuis and fed antibacterial-free food and water ad libitum. Three days post arrival, guinea pigs were rendered neutropenic by intraperitoneal injection (IP) with cyclophosphamide (TCI (Shanghai) Development Co., Ltd, Shanghai, China) at 100 mg/kg one time a day for 3 days. Blood samples were drawn from the heart.
H. parasuis Intraperitoneal Infection Model
Neutropenic guinea pigs were inoculated with a 0.2 mL aliquot solution containing ~1 × 10⁹ CFU of the H. parasuis strain and was equivalent to a 95% infective dose (ID95) as determined in pilot studies on intraperitoneal injection for single-dose. Clinical symptoms were recorded and bacteriological examinations were performed to ensure infection. To quantify pathogen load, lung tissue was removed at sacrifice by using an overdose of pentobarbital.
Tulathromycin PKs in the Neutropenic Intraperitoneal Infection Model
A total of 384 infected, neutropenic guinea pigs were allocated to three groups and treated with tulathromycin at single IM doses of 1, 10, or 20 mg/kg, respectively. Aliquots of 2 mL blood samples were collected from the heart at 5, 10, 15, and 30 min, and 1, 2, 4, 8, 12, 24, 48, 72, 96, 120, 144, and 168 h after drug administration. Eight guinea pigs were sampled at each time point. All experimental animals were euthanized by using an overdose of pentobarbital after blood sampling. Lung tissue samples were homogenized and immediately placed in cryo-tubes to freeze at −20°C. Serum was obtained by centrifuging blood samples at 4,000 g for 10 min and immediately stored at −20°C until analysis (within 1 month of sampling).
Analysis Methods
Neutropenia Model
Leukocytes were counted with an automatic blood cell analyzer (Mindray BC-2800Vet, Shenzhen, China). Animals were severely granulocytopenic (absolute leukocyte count <1,000/mm3).
H. parasuis Intraperitoneal Infection Model
Lung tissue was homogenized in 0.5 mL of phosphate-buffered saline (PBS), and centrifuged at 7,200 g for 15 s by a Precellys Evolution Super Homogenizer (Bertin Technologies, France). Aliquots of 0.1 mL of the supernatant were used in 10-fold serial dilutions that were incubated at 37°C for 36–48 h. Subsequently, viable counts were obtained by the spot-plate method. Blood samples were collected from the heart before euthanasia and obtaining viable counts. The lowest detectable count was 100 CFU/mL. All samples were performed in triplicate.
Tulathromycin PKs
Tulathromycin concentrations in serum and lung were determined via a high-performance LC-MS/MS method as described previously (54, 55). The limit of quantitation was confirmed at 2.0 ng/mL for serum and 10 ng/g for lung tissue. The coefficient of correlation (r2) was 0.9974 for the linear range of 2.0–500 ng/mL for serum and 0.9941 for the linear range of 10–1,000 ng/mL for lung tissue. To overcome the carryover effect, water was inserted in the detection queue after every 10 samples. Over the validated range, plasma assay accuracy and precision were in the ranges of 94.6–101.5 and 2.2-−6.8%, respectively. For lung tissue, the assay accuracy and precision were in the ranges of 89.4–98.2 and 5.6–12.4%, respectively.
Efficacy of Tulathromycin in the Neutripenic Guinea Pig Intraperitoneal Infection Model
To evaluate the effectiveness of tulathromycin, infected, neutropenic guinea pigs were treated with either 0.9% NaCl (Control group) or tulathromycin at 1, 2, 4, 6, 8, 10, 15, or 20 mg/kg (Treatment group), at 2 h post-infection of a single dose. Three days after IM drug administration, animals were euthanized after blood sampling. Then the lungs were collected, homogenized in 0.5 mL PBS, and centrifuged at 7,200 rpm for 15 s. The viable counts of H. parasuis were measured by the viable count method as described above. The number of H. parasuis was expressed as CFU/mL.
PKs and PDs Analyses
The PK profiles of tulathromycin were analyzed by the non-compartmental model with uniform weighting using WinNonlin software (version 5.2; Pharsight, CA, USA). The surrogate marker of antibacterial effectiveness, AUC168h/MIC, was calculated using in vitro MIC values and PK parameters obtained from lung tissue samples from three individuals treated with IM administrations of tulathromycin. The effectiveness of tulathromycin was expressed as a reduction of H. parasuis loading calculated by subtracting loading of the treatment group from the control group. The in vivo PK/PD relationship of tulathromycin was described using a sigmoid inhibitory Emax model with the WinNonlin software (version 5.2; Pharsight, CA, USA) where the equation is as follows:
where E is the antibacterial effect measured as the reduction in log10 CFU/lung after administration of tulathromycin compared to that of the log10 CFU/lung in the untreated control group; Emax is the reduction in log10 CFU/lung for the untreated control guinea pigs; E0 is the maximum reduction after administration and represents the maximum antibacterial effect; Ce is the AUC/MICserum parameter; EC50 is the AUC/MICserum value required to achieve 50% of the maximal antibacterial effect; and N is the Hill coefficient that describes the steepness of the AUC/MICserum and effect curve.
Dosage Calculation
In order to determine a more optimal dose regimen for treatment of H. parasuis, the dose required for a given antibacterial activity is calculated by the equation (56):
where Dose is the optimal dose (mg/kg/day); Cl is the serum (or lung) clearance; factor is the dimensionless numerical value of AUC/MICserum; MIC90 is the 90th percentile of the MIC distribution; fu is the free drug fraction; and F is the bioavailability.
Results
Susceptibility Testing
The MICs of tulathromycin against the study strain in CAMHB and serum were 0.5 and 0.03 μg/mL, respectively.
Neutropenia Model
Animals were severely granulocytopenic (absolute leukocyte count <1,000/mm3), and remained in this condition for at least 3 days after the last injection of cyclophosphamide.
H. parasuis Intraperitoneal Infection Model
Evaluation of the H. parasuis infection model mainly depended on clinical symptoms and bacteriological assays. Depression, mouth breathing, and roughened hair coats were observed in infected animals. In addition, infection was observed in 100% of the inoculated guinea pigs. Mean H. parasuis load in lungs was 4.5 × 10⁶ CFU/g and in blood was 1 × 10⁷ CFU/mL for all inoculated guinea pigs. Morbidity and mortality rates were 100 and 15% within 3 days after infection, respectively. Neither clinical sign was observed in non-infected control animals. The bacteriological assay was negative in control guinea pigs.
PK Profiles of Tulathromycin in the Neutropenic Intraperitoneal Infection Model
The mean values of PK parameters of serum samples were derived from the three dosage treatment groups and are presented in Table 1. The geometric mean serum concentrations (Cmax) of tulathromycin were 1.08, 3.49, and 7.39 μg/mL for the 1, 10, and 20 mg/kg doses, respectively, and were observed at 0.5 h after administration (Figure 1). The mean half-lives, T1/2β, were 25.7, 26.9, 28.6 h for the three respective doses. In addition, a concentration dependent AUC168h was observed where mean AUC168h increased with the increase in dosage (11.02, 57.18, and 89.60 μg·h /mL for 1, 10, and 20 mg/kg, respectively). For lung tissue, the mean values of PK parameters derived from the three treatment groups are presented in Table 2. With respect to each successive dosage level, the mean Cmax was 0.15, 5.21, and 10.14 μg/g and tmax was 0.5, 0.5, and 1 h post-administration (Figure 2). The mean half-lives in lung tissue were about 67.4, 72.1, and 70.1 h for the three different dose treatments, respectively. Similar to the serum results, a concentration dependent AUC168h was observed where mean AUC168h increased with the increase in dosage (9.59, 262.78, and 434.95 μg·h /g for 1, 10, and 20 mg/kg, respectively).
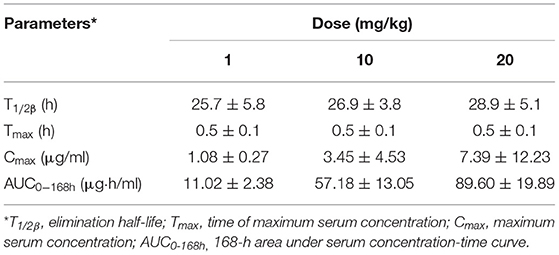
Table 1. Pharmacokinetic parameters of tulathromycin in serum following single dose intramuscular administration at 1, 10, or 20 mg/kg in H. parasuis infected guinea pigs (mean ± SD, n = 8/group).
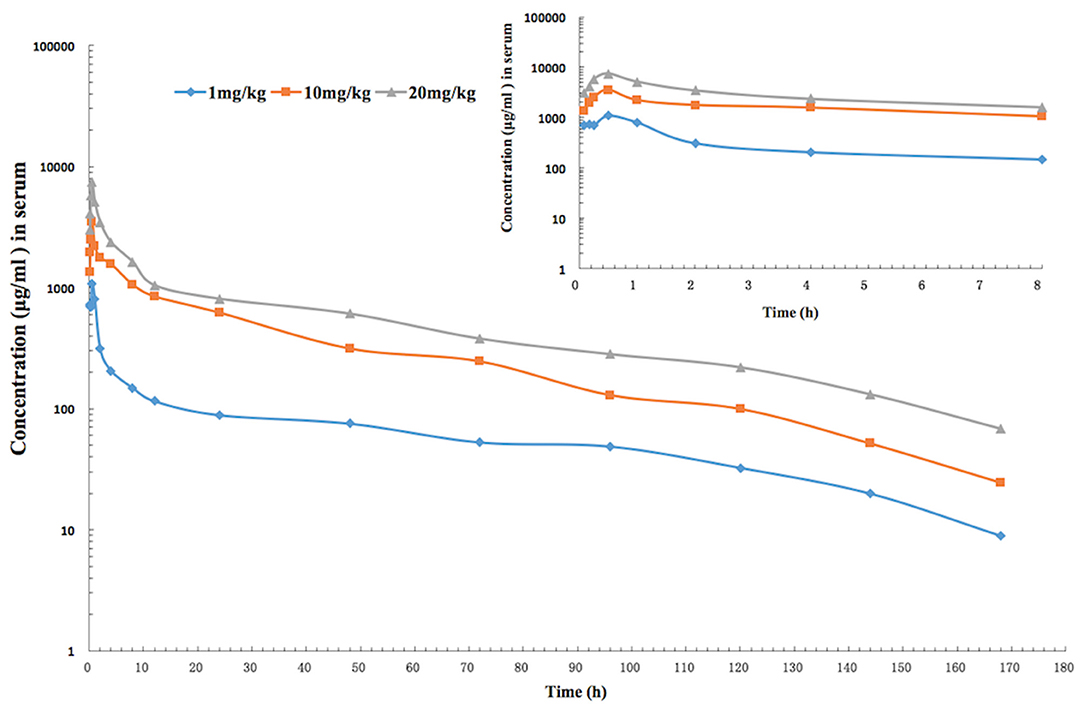
Figure 1. The time-concentration curve of tulathromycin in serum for each of three intramuscular administrations of 1, 10, and 20 mg/kg in a H. parasuis infection model (inset depicts the serum concentrations in the first 8 h post-administration; n = 8/time point).
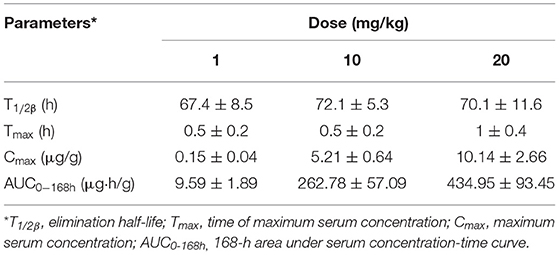
Table 2. Pharmacokinetic parameters of tulathromycin in lung tissues following single dose intramuscular administration at 1, 10, or 20 mg/kg in H. parasuis infected guinea pigs (mean ± SD, n = 8/group).
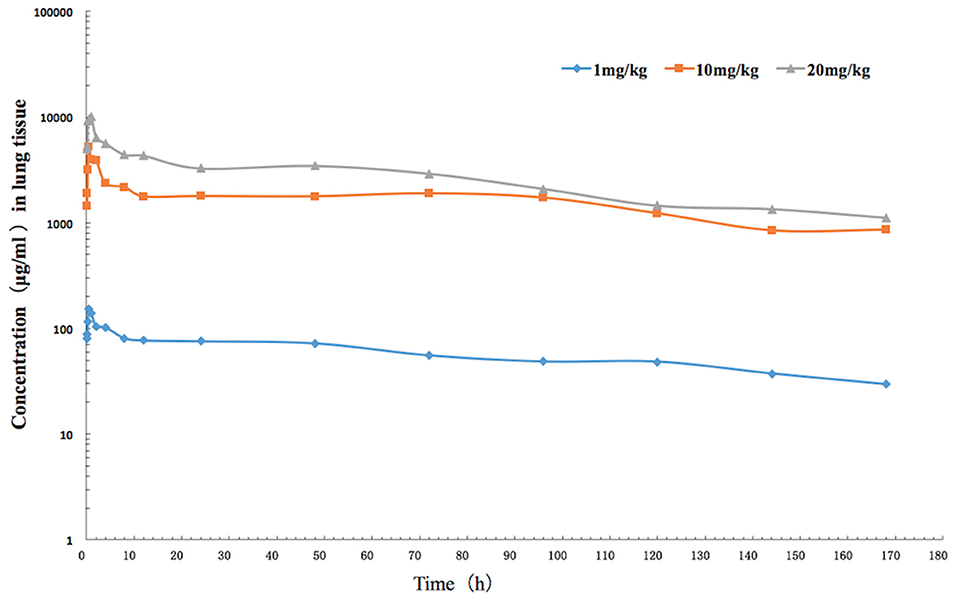
Figure 2. The time-concentration curve of tulathromycin in lung tissue for each of three intramuscular administrations of 1, 10, and 20 mg/kg in a H. parasuis infection model (n = 8/time point).
Because AUC168h linearly increased with dose from 1 to 20 mg/kg, we were able to interpolate values for AUC168h at 2, 4, 6, 8, and 15 mg/kg. Of the serum samples, significant correlations between dose treatment and AUC168h (R2 = 0.9829) or Cmax (R2 =0.9889) were observed. Similarly for lung samples, significant correlations between dose treatment and AUC168h (R2 =0.9806) or Cmax (R2 =0.9986) were observed.
In vivo Effectiveness of Tulathromycin in the Neutropenic Guinea Pig Intraperitoneal Infection Model
The viable counts of H. parasuis in lung tissues and blood from guinea pigs given doses of 0, 1, 2, 4, 6, 8, 10, 15, and 20 mg/kg of tulathromycin decreased with the increasing levels of dose, which implies that the bacteria loading decreased. In serums, the viable counts decreased sharply between dosages of 0 and 1 mg/kg. In lung tissues, the viable counts decreased sharply between dosages of 1 and 8 mg/kg, and then moderately varied between 8 and 20 mg/kg. The calculated number of H. parasuis in vivo after drug treatment is shown in Figure 3.
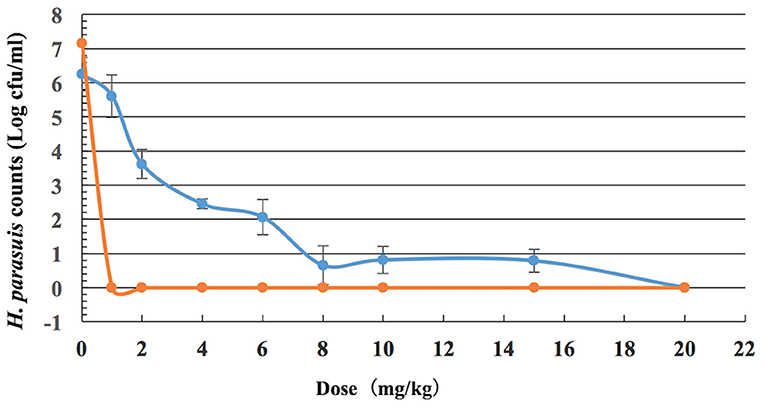
Figure 3. Viable counts of H. parasuis in blood and lung tissues of guinea pigs after a single dose of tulathromycin (n = 8/dose).
Tulathromycin PK/PD Profiles
In serum, the ratios of AUC72h/MIC and AUC168h/MIC for each dose of 0, 1, 2, 4, 6, 8, 10, 15, and 20 mg/kg were 0, 331.48, 435.78, 644.38, 852.98, 1,061.58, 1,270.18, 1,791.68, 2,313.18 h, and 0, 367.32, 607.95, 882.56, 1,157.17, 1,431.79, 1,906.08, 2,392.93, 2,986.61 h, respectively. The parameter AUC72h/MIC and AUC168h/MIC highly correlated with tulathromycin effectiveness (R2 = 0.9863 and 0.9878, respectively). The values of AUC72h/MIC of serum for H. parasuis 1-, 2-, 3- and 4-log10 CFU/mL reduction were 268.84, 399.99, 521.9, and 650.28 h, respectively (Table 3). The values of AUC168h/MIC of serum for H. parasuis 1-, 2-, 3-, and 4-log10 CFU/mL reduction were 366.06, 552.51, 728.47, and 916.90 h, respectively (Table 3). The profile of the sigmoid Emax model illustrating the relationship of antibiotic effectiveness and AUC168h/MIC is presented in Figure 4. The EC50 of AUC72h/MIC (h) and AUC168h/MIC were 544.21 and 761.04 h, respectively, and the slope of the graph of the AUC72h/MIC (h) and AUC168h/MIC ratio vs. effectiveness were 2.82 and 2.72, respectively (Table 3).
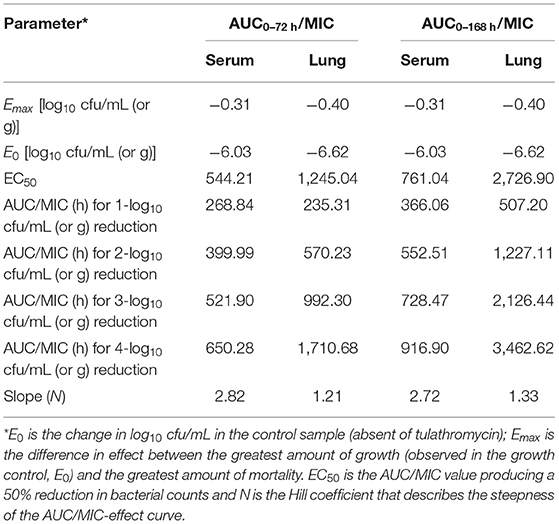
Table 3. Pharmacodynamic analysis of tulathromycin in a H. parasuis intraperitoneal infection model.
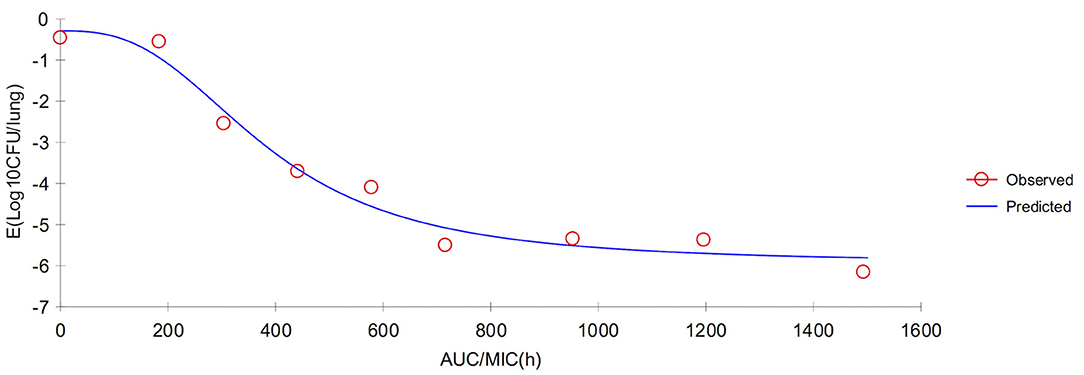
Figure 4. Sigmoid Emax relationship between anti-Haemophilus parasuis effect (E, log10 CFU/serum) and in vivo AUC168/MIC ratio against H. parasuis in the serum of guinea pigs.
In lung tissue, the ratios of AUC72h/MIC and AUC168h/MIC for each dose of 0, 1, 2, 4, 6, 8, 10, 15, and 20 mg/kg were 0, 280.36, 742.16, 1,665.76, 2,589.36, 3,512.96, 4,436.56, 6,745.56, 9,054.56 h, and 0, 319.79, 1,667.00, 3,153.14, 4,639.27, 6,125.40, 8,759.35, 11,326.87, and 14,498.35 h, respectively. The parameter AUC72h/MIC and AUC168h/MIC highly correlated with antibiotic effectiveness (R2 = 0.9985 and 0.9911, respectively). The values of AUC72h/MIC of serum for H. parasuis 1-, 2-, 3-, and 4-log10 CFU/mL reduction were 235.31, 570.23, 992.3, and 1,710.68 h, respectively. The values of AUC168h/MIC (h) of lung tissue for H. parasuis 1-, 2-, 3-, and 4-log10 CFU/mL reduction were 507.20, 1,227.11, 2,126.44, and 3,462.62 h, respectively (Table 3). The profile of the sigmoid Emax model illustrating the relationship of antibiotic effectiveness and AUC168h/MIC (h) is presented in Figure 5. The EC50 of AUC72h/MIC (h) and AUC168h/MIC were 1,227.11 and 2,726.90 h, respectively, and the slope of the graph of the AUC72h/MIC (h) and AUC168h/MIC ratio vs. effectiveness were 1.21 and 1.33, respectively (Table 3).
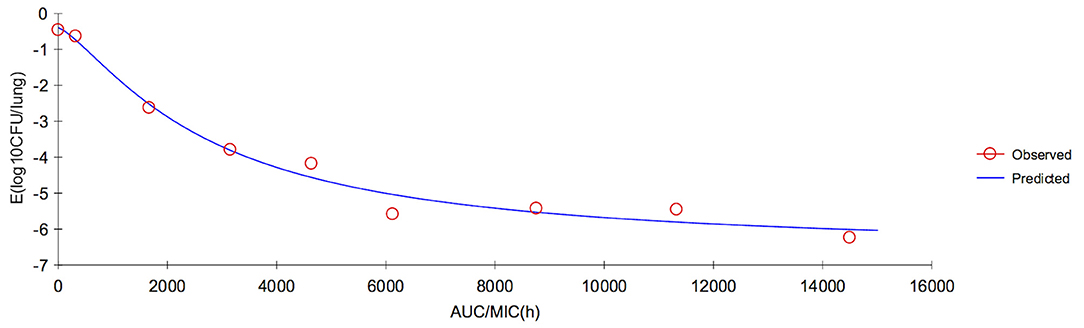
Figure 5. Sigmoid Emax relationship between anti-Haemophilus parasuis effect (E, log10 CFU/lung) and in vivo AUC168/MIC ratio against H. parasuis in the lung tissues of guinea pigs.
Dosage Calculation
The MIC of 13R was substituted for the MIC90 because we obtained an insufficient amount of tulathromycin MIC data to provide an estimate of MIC90 in serum. In this study, the single dosage values to achieve a reduction of 1-, 2-, 3-, and 4-log10 CFU/lung were calculated from the ratios of AUC72h/MIC were 3.8, 5.7, 7.5, and 9.3 mg/kg for serum and 1.7, 2.5, 4.3, and 7.4 mg/kg for lung tissue (Table 4), respectively. For AUC168h/MIC, the single dosage values to achieve a reduction of 1-, 2-, 3-, and 4-log10 CFU/lung were 8.7, 13.2, 17.4, and 21.9 mg/kg for serum and 3.7, 8.9, 15.4, and 25.1 mg/kg for lung tissue (Table 4), respectively.
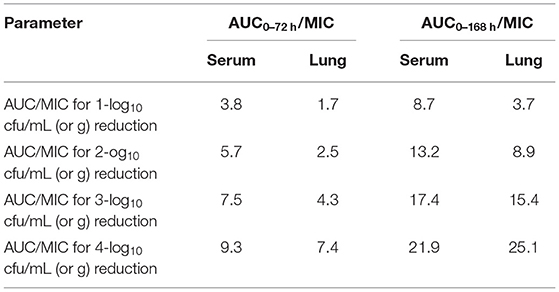
Table 4. The single dosage values (mg/kg) calculated from the ratios of AUC/MIC against H. parasuis.
Discussion
H. parasuis is a common source of bacterial respiratory infections in pigs, such as Glasser's disease (57–60) which can be found in the majority of the lobes of lungs in animals with pneumonia (61–65). Tulathromycin has been widely used in more than 30 countries across America, Europe, Oceania, and Asia (66). Selection of antimicrobial-resistant bacteria is a constant risk with the application of antimicrobials (59). Thus, in order to obtain a dosage regimen to ensure clinical efficacy and minimize risk of selection of antibiotic resistance, an in vivo model was used to examine the PK/PD of tulathromycin in this study.
In some cases, it has been difficult to use PK/PD integration to assess the efficacy of some antimicrobial drugs, particularly drugs with long half-lives against respiratory bacteria. To the best of our knowledge, some authors have determined appropriate dosage regimens of other antibiotics, such as marbofloxacin (67, 68) and cefquinome (29) to eliminate H. parasuis infection. Other researchers have successfully predicted optimal doses of tulathromycin to eliminate other bacteria, such as Streptococcus suis (39), Mannheimia haemolytica (40), and Pasteurela multocida (38, 40) by in vitro PK/PD models. Untreated H. parasuis infection of the blood can lead to septicemia and serofibrinous serositis in various tissues (3, 4, 50). Thus, the threshold loads of H. parasuis in blood and lungs that can lead to these serious conditions should be determined to help avoid greater morbidity and mortality. From the results of our in vivo infection model, we ascertained the threshold loads of H. parasuis at (7.15 ± 0.49) log10 CFU/blood and (6.24 ± 0.62) log10 CFU/lung, when the inoculum size was 9.26 log10 CFU/mL via intraperitoneal injection. Therefore, it is optimal to apply a single inoculum of a 0.2 mL aliquot solution containing ~109 CFU of the H. parasuis strain in an in vivo H. parasuis infection model. These findings show that a threshold load should be determined to avoid an infected animal from dying.
Currently, there is little information on in vivo infection models of macrolide antibacterial agents against H. parasuis. To the best of our knowledge, this study is the first to investigate the efficacy of tulathromycin against H. parasuis using a neutropenic guinea pig infection model in the veterinary field. The advantages of our in vivo model over in vitro models and the main innovative points of the overall research are as follows: (1) H. parasuis colonies in blood and lung tissues of guinea pigs were simultaneously quantitated for dose optimization; (2) The drug concentrations in plasma and lung tissue were concurrently detected for the in vivo PK/PD model. (3) This is the first time that the dose proportionality of tulathromycin PKs in the dose range of 1 to 20 mg/kg has been described in guinea pig based on AUC (in serum and lung) and MIC (in serum). (4) An experimental animal model can be used instead of a target animal model to predict dose regimen of tulathromycin based on an in vivo PK/PD model. Both guinea pigs and pigs infected with H. parasuis produce similar symptoms of systemic infection; however, because tulathromycin targets lungs (42, 44), laboratory animal models are more beneficial because they provide more lung tissue data.
In the present study, pharmacokinetics of tulathromycin were investigated by examining tissue infection response to single doses of 1, 10, and 20 mg/kg in an H. parasuis infection model. The PK profiles revealed that the average tulathromycin concentration and AUC in lung tissues were higher than the concentration and AUC in serum at the same sampling periods (0–168 h) which supports that tulathromycin targets lung tissues. For the doses of 10 and 20 mg/kg, the Cmax values of tulathromycin for lung tissue were 5.21 and 10.14 μg/g, respectively, and for serum were 3.45 and 7.39 μg/ml, respectively. The Cmax lung/serum ratios were 1.5:1 and 1.4:1, respectively. The lung AUCs (at the last time point of 7 days) were 262.79 and 434.95 μg·h/ml and the serum AUCs (at the last time point of 7 days) were 57.18 and 89.6 μg·h/ml with respect to the 10 and 20 mg/kg doses. The AUC lung/serum ratios were 4.6:1 and 4.8:1, respectively. These results were similar to previously published articles. For example, the Cmax lung/serum ratio was 5.6:1 in pig (42), 8.0:1 in cattle (44), and 1.3:1 (7 mg/kg) or 2.4:1 (28 mg/kg) in mice (47). However, the lungs were not a reservoir for tulathromycin to be then gradually released into the blood. In fact, it is the other way around. Tulathromycin gradually accumulate in the lungs over several days. Nowakowski et al. reported the progressive increase of the tulathromycin concentration ratio between lung and plasma ranging from 15 (at 12 h post administration) to 220 (at 360 h post administration) (44), which seems to be the case in the present study. It means that the lungs act as a sink, not a reservoir.
The AUC lung/serum ratio was 51.3:1 in pig (42), 56.5:1 in cattle (44), and 5.7:1 (7 mg/kg) or 7.9:1 (28 mg/kg) in mice (47). However, at a dose of 1 mg/kg, the average tulathromycin concentration in lung tissue was lower than the corresponding concentration in serum between 5 min and 48 h after administration, which is similar to a report of a Cmax lung/serum ratio of 0.6:1 in infected mice with a dose of 7 mg/kg (47). Research has shown that a total tissular concentration has no therapeutic meaning (69). This is particularly true for tulathromycin that accumulates massively in phagolysosome of the lung because their pH is very low (ionic trapping). This pH is can be as low as 4.5(70) and for this pH, tulathromycin loses all its activity (71, 72). It means it is not this high local lung concentration, which is responsible for the microbiological effects of tulathromycin on lung pathogens. In addition, for mild infections, H. parasuis is mainly localized in extracellular areas (73). These findings show that lab animal models can be used to closely represent target animals' PK/PDs.
Of the other PK parameters that we examined, Tmax in serum (0.5 h) was similar to previous studies: 0.5 h in mice (47), 1 h in rabbits (48), 0.25 h in pig (42), and 1.8 h in cattle (44). In lung tissue, Tmax ranged between 0.5 and 1 h in the present study and was similar to other laboratory animals' ranges: 0.5–1 h in mice (47) and 1 h in rabbits (48). However, our Tmax was more early than that found in target animals: 24 h in pig (42) and 24 h in cattle (44). It was because the terminal half-life is shorter the above animals. In contrast, T1/2β in serum ranged from 25.7 to 28.9 h in guinea pig, which was longer than that found in mice, 13.5–18.1 h (47), and shorter than that in rabbits, 31.69 h (48); pig, 75.6 h (42), and 78.7 h (74); and cattle, 90 h (44). In lung tissue, T1/2β (a range of 67.4–72.1 h) in the present study was shorter than that of other animals, such as, a range of 82 h−112 h in mice (47), 142 h in pig (42), and 184 h in cattle (44). We speculate that the metabolism and distribution of tulathromycin in lungs may have been reduced by the swollen lesions that we observed in the tissues. Moreover, laboratory animal models, commonly used in studies, typically have much faster rates of elimination of antibiotics than target animals (75).
Antibiotic resistance and its development are a complex subject. Owing to the over-use of antibiotics and cross resistance, antibiotic resistance is on the rise and in particular, more bacteria are developing resistance against tulathromycin (76, 77). Thus, a suitable dose rate must be determined to ensure the continued efficacy of tulathromycin for susceptible organisms and to minimize selection for antibiotic resistance in bacteria (78, 79). In the present study, we found that we can estimate the AUC168h for any dose level from 1–20 mg/kg based on the linear relationship between our treatment levels of dose (1, 10, 20 mg/kg) and AUC168h (R2 = 0.9829 and R2 = 0.9806 for serum and lung tissue, respectively). These results indicate that this analytical chemistry method is a reasonable tool to derive meaningful PK profiles that may help predict tulathromycin efficacy. This relationship supports previous studies that examined tulathromycin PK in pig within a range of 0.94–4.77 mg/kg (43) and tulathromycin PK in cattle within a range of 1.27–5.05 mg/kg (43), where the R2 were 0.9982 and 0.9191, respectively. Altogether, these studies suggest that tulathromycin is characterized by linear pharmacokinetics both in lab and target animals.
The MIC of tulathromycin against H. parasuis in serum was tested, where the CAMHB /serum ratio was 16:1 (MICCAMHB = 0.5 ug/mL and MICserum = 0.03 ug/mL). Thus, tulathromycin was subjected to a large serum effect. Furthermore, ratios of MICbroth/MICbiologicmatrix of tulathromycin against other bacteria have been reported in previous studies that are similar to the ratios determined in our study (38–40, 80). Our in vivo MIC results indicate that PKPD-based dose prediction of tulathromycin is promising for treatment of H. parasuis infection. Overall findings suggest that an in vivo rather than in vitro experiment may be the better method to determine tulathromycin efficacy and that pharmacodynamic data obtained in biological fluids is very important (80), and more suitable for PK/PD research (40).
Our data showed high correlation among the PK/PD index, AUC/MIC, and the in vivo antibacterial effects of tulathromycin against H. parasuis (R2 > 0.98 and R2 > 0.99 for serum and lung tissue, respectively), which supports previous studies of tulathromycin activity against Streptococcus suis (39) and Pasteurella multocida (38). Different doses of AUC/MIC (0–72 or 0–168 h) for serum and lung were shown in Table 5. In a recent review on PK/PD of antibiotics in veterinary medicine (81), it is reported in the section entitled In vivo infection models that the primary end-point is reduction in bacterial burden in the infected tissue, which is typically assessed at 24 h after initiation of AMD therapy. Bacteriostasis and 1- or 2-log10 reduction in count at 24 h are commonly used end-points, as they are correlated with limited or greater levels of clinical outcomes, respectively. In this study, to assess the different possible clinical situations ranging from a mild infection in a non-immunocompromised animal up to a severe infection in an immunocompromised animal, we compute AUC/MIC corresponding to 1-, 2-, 3-, and 4-log10 based on AUC72h/MIC and AUC168h/MIC, respectively. In fact, the values of the PK/PD indexes are routinely given in terms of free concentrations, not total concentration. In the previous study, the free fraction (fu) of tulathromycin in guinea pig serum was 0.56–0.74 (41). Thus, the PK/PD index, fAUC/MIC (0–72 h) corresponding to 1-, 2-, 3-, and 4-log10 were 174.75, 259.99, 339.24, 422.68 h, respectively, and fAUC/MIC (0–168 h) corresponding to 1-, 2-, 3-, and 4-log10 were 237.94, 359.13, 473.51, 595.99 h, respectively. Here our goal is only to calculate a dose and so we can do this directly from the total plasma concentrations. According to the calculation results, we found that the computed dose more lower using as objective a 2-log10 reduction and an AUC0−72h as the value of the PK/PD index than AUC0−168h. In our previous research, which published in PLOS (41) showed that doses of 7.2–8.0 mg/kg of tulathromycin via an in vitro model resulted in high eradication rates (99.99%). In this study, the computed doses to achieve a reduction of 2-log10 CFU/lung from the ratios of AUC72h/MIC were 5.7 mg/kg for serum and 2.5 mg/kg for lung tissue, which lower than the values of AUC168h/MIC to achieve a reduction of 2-log10 CFU/lung were 13.2 mg/kg for serum and 8.9 mg/kg for lung tissue, respectively. Using as objective a 2-log10 reduction and an AUC (0–72 h) as the value of the PK/PD index, an equivalent dose for target animals can be calculated with a dose conversion coefficient, for example, the dose conversion coefficient for guinea pig to pig is 0.296 and results in a converted doses of 1.7 mg/kg (serum) and 0.7 mg/kg (lung) for pig (82). While, to obtain a reduction of 4-log10 CFU/ml (or g) in the lungs, the converted doses were 2.8 mg/kg (serum) and 2.2 mg/kg (lung) for pig (Table 4), which is similar to the recommended dose for SRD of 2.5 mg/kg (31, 71). Our calculated doses against H. parasuis were different from other studies which have determined a tulathromycin dosage of 13.25 mg/kg against Pasteurella multocida (38) and 3.56 mg/kg against Streptococcus suis (39). Both of these examples were also higher than the recommended dose (2.5 mg/kg). In contrast, results in this study were similar to the results of a previous study that reported an estimated dosage of 2.52 mg/kg of tulathromycin against Pasteurella multocida (40). The difference may be explained by the variable responses of different bacteria to tulathromycin which likely results in different PK/PD models.
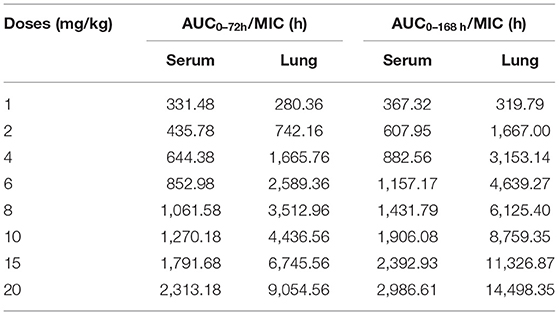
Table 5. Different doses of AUC/MIC (0–72 h or 0–168 h) for serum and lung.
There are two limitations to our study. First, we assumed a value of 100% bioavailability for our dosage calculations because the reported bioavailabilities of tulathromycin are near 100% in other animals, such as 110% in pigs (42), 93.6% in cattle (44), 95.8% in goats (46), and 94.25% in rabbits (48). Second, we did not conduct a dose confirmation on a target animal. Thus, a follow-up study should include more H. parasuis strains to calculate MIC90 and the dose regimen should be validated in clinical practice on swine.
In conclusion, the present study characterized the in vivo effectiveness of tulathromycin against H. parasuis in a neutropenic guinea pig model. This infection model is similar to clinical infection or systemic infection in swine because it has the same clinical symptoms and pathological changes when infected by H. parasuis. Our study indicates that lung pharmacokinetics have an important role as a surrogate marker in establishing PK/PD relationships and clinical efficacy against bacterial respiratory infections, especially for macrolide antibiotics. Furthmore, the in vivo data suggest that animal dosage regimens more accurate than data from in vitro model. Lastly, the computed dose could be more realistic using as objective a 2-log10 reduction and an AUC (0–72 h) as the value of the PK/PD index.
Data Availability Statement
The original contributions presented in the study are included in the article/Supplementary Material, further inquiries can be directed to the corresponding author/s.
Ethics Statement
The animal study was reviewed and approved by Qingdao Agriculture University Animal Ethics Committee approved the animal experiment procedures (No. 2020-025).
Author Contributions
Y-dZ and B-hF conceived and designed the experiment. L-hW, S-jL, and L-lG performed the experiments. L-lG and R-yG analyzed data and drafted the manuscript. All authors read and approved the final manuscript.
Funding
This work was supported by the Development of new raw materials and preparations for Animal Respiratory Disease Control under Grant 20201220 and the PhD Fund of Qingdao Agricultural University (663-1119017), and Shandong Provincial College Student Innovation and Entrepreneurship Training Program Project (S202010435088).
Conflict of Interest
The authors declare that the research was conducted in the absence of any commercial or financial relationships that could be construed as a potential conflict of interest.
Publisher's Note
All claims expressed in this article are solely those of the authors and do not necessarily represent those of their affiliated organizations, or those of the publisher, the editors and the reviewers. Any product that may be evaluated in this article, or claim that may be made by its manufacturer, is not guaranteed or endorsed by the publisher.
Acknowledgments
We would like to thank Professor Huan-chun Chen (College of Veterinary Medicine, Huazhong Agricultural University) for providing the 15 H. parasuis reference strains.
Supplementary Material
The Supplementary Material for this article can be found online at: https://www.frontiersin.org/articles/10.3389/fvets.2021.715887/full#supplementary-material
References
1. Biberstein EL, White DC. A proposal for the establishment of two new Haemophilus species. J Med Microbiol. (1969) 2:75–8. doi: 10.1099/00222615-2-1-75
3. Peet RL, Fry J, Lloyd J, Henderson J, Curran J, Moir D. Haemophilus parasuis septicaemia in pigs. Aust Vet J. (1983) 60:187. doi: 10.1111/j.1751-0813.1983.tb05960.x
4. Amano H, Shibata M, Kajio N, Morozumi T. Pathologic observations of pigs intranasally inoculated with serovar 1, 4 and 5 of Haemophilus parasuis using immunoperoxidase method. J Vet Med Sci. (1994) 56:639–44. doi: 10.1292/jvms.56.639
5. Oliveira S, Pijoan C. Haemophilus parasuis: new trends on diagnosis, epidemiology and control. Vet Microbiol. (2004) 99:1–12. doi: 10.1016/j.vetmic.2003.12.001
6. Oliveira S, Pijoan C, Morrison R. Evaluation of Haemophilus parasuis control in the nursery using vaccination and controlled exposure. J Swine Health Prod. (2004) 12:123–8. doi: 10.1111/j.1748-5827.2004.tb00235.x
7. Cai X, Chen H, Blackall PJ, Yin Z, Wang L, Liu Z, et al. Serological characterization of Haemophilus parasuis isolates from China. Vet Microbiol. (2005) 111:231–6. doi: 10.1016/j.vetmic.2005.07.007
8. Rapp-Gabrielson VJ, Gabrielson DA. Prevalence of Haemophilus parasuis serovars among isolates from swine. Am J Vet Res. (1992) 53:659–64.
9. Rubies X, Kielstein P, Costa L, Riera P, Artigas C, Espuna E. Prevalence of Haemophilus parasuis serovars isolated in Spain from 1993 to 1997. Vet Microbiol. (1999) 66:245–8. doi: 10.1016/S0378-1135(99)00007-3
10. Angen O, Svensmark B, Mittal KR. Serological characterization of Danish Haemophilus parasuis isolates. Vet Microbiol. (2004) 103:255–8. doi: 10.1016/j.vetmic.2004.07.013
11. Tadjine M, Mittal KR, Bourdon S, Gottschalk M. Development of a new serological test for serotyping Haemophilus parasuis isolates and determination of their prevalence in North America. J Clin Microbiol. (2004) 42:839–40. doi: 10.1128/JCM.42.2.839-840.2004
12. Castilla KS, De Gobbi DD, Moreno LZ, Paixao R, Coutinho TA, Dos Santos JL, et al. Characterization of Haemophilus parasuis isolated from Brazilian swine through serotyping, AFLP and PFGE. Res Vet Sci. (2012) 92:366–71. doi: 10.1016/j.rvsc.2011.04.006
13. Dijkman R, Wellenberg GJ, Van Der Heijden HM, Peerboom R, Olvera A, Rothkamp A, et al. Analyses of Dutch Haemophilus parasuis isolates by serotyping, genotyping by ERIC-PCR and Hsp60 sequences and the presence of the virulence associated trimeric autotransporters marker. Res Vet Sci. (2012) 93:589–95. doi: 10.1016/j.rvsc.2011.10.013
14. Luppi A, Bonilauri P, Dottori M, Iodice G, Gherpelli Y, Merialdi G, et al. Haemophilus parasuis serovars isolated from pathological samples in Northern Italy. Transbound Emerg Dis. (2013) 60:140–2. doi: 10.1111/j.1865-1682.2012.01326.x
15. Palzer A, Austin-Busse RL, Ladinig A, Balka G, Spergser J, Ritzmann M. Different sample types in pigs challenged with Haemophilus parasuis following two treatment schemes with tulathromycin. Acta Vet Hung. (2015) 63:157–66. doi: 10.1556/avet.2015.013
16. Ma L, Wang L, Chu Y, Li X, Cui Y, Chen S, et al. Characterization of Chinese Haemophilus parasuis isolates by traditional serotyping and molecular serotyping methods. PLoS ONE. (2016) 11:e0168903. doi: 10.1371/journal.pone.0168903
17. Wang Z, Zhao Q, Wei H, Wen X, Cao S, Huang X, et al. Prevalence and seroepidemiology of Haemophilus parasuis in Sichuan province, China. PeerJ. (2017) 5:e3379. doi: 10.7717/peerj.3379
18. Rapp-Gabrielson VJ, Gabrielson DA, Schamber GJ. Comparative virulence of Haemophilus parasuis serovars 1 to 7 in guinea pigs. Am J Vet Res. (1992) 53:987–94.
19. Brockmeier SL, Register KB, Kuehn JS, Nicholson TL, Loving CL, Bayles DO, et al. Virulence and draft genome sequence overview of multiple strains of the swine pathogen Haemophilus parasuis. PLoS ONE. (2014) 9:e103787. doi: 10.1371/journal.pone.0103787
20. Toutain PL, Del Castillo JRE, Bousquet-Melou A. The pharmacokinetic-pharmacodynamic approach to a rational dosage regimen for antibiotics. Res Vet Sci. (2002) 73:105–14. doi: 10.1016/S0034-5288(02)00039-5
21. Toutain PL. Antibiotic treatment of animals - a different approach to rational dosing. Vet J. (2003) 165:98–100. doi: 10.1016/S1090-0233(02)00271-X
22. Andes D. Antifungal pharmacokinetics and pharmacodynamics: understanding the implications for antifungal drug resistance. Drug Resist Updat. (2004) 7:185–94. doi: 10.1016/j.drup.2004.06.002
23. Toutain PL. PK/PD approach for antibiotics: tissue or blood drug levels to predict antibiotic efficacy. J Vet Pharmacol Ther. (2009) 32:19–21. Available online at: https://www.slideserve.com/jacoba/pl-toutain-national-veterinary-school-toulouse
24. Derendorf H, Mollmann H, Hochhaus G, Meibohm B, Barth J. Clinical PK/PD modelling as a tool in drug development of corticosteroids. Int J Clin Pharmacol Ther. (1997) 35:481–8.
25. Meibohm B, Derendorf H. Basic concepts of pharmacokinetic/pharmacodynamic (PK/PD) modelling. Int J Clin Pharmacol Ther. (1997) 35:401–13.
26. Dellinger RP, Levy MM, Carlet JM, Bion J, Parker MM, Jaeschke R, et al. Surviving Sepsis Campaign: International guidelines for management of severe sepsis and septic shock: 2008. Crit Care Med. (2008) 36:296–327. doi: 10.1097/01.CCM.0000298158.12101.41
27. Solomkin JS, Mazuski JE, Bradley JS, Rodvold KA, Goldstein EJC, Baron EJ, et al. Diagnosis and management of complicated intra-abdominal infection in adults and children: guidelines by the Surgical Infection Society and the Infectious Diseases Society of America. Clin Infect Dis. (2010) 50:133–64. doi: 10.1086/649554
28. Duszynska W. Pharmacokinetic-pharmacodynamic modelling of antibiotic therapy in severe sepsis. Anaesthesiol Intensive Ther. (2012) 44:158–64. doi: 10.1111/j.1365-3083.1983.tb04016.x
29. Xiao X, Sun J, Yang T, Fang X, Wu D, Xiong YQ, et al. In vivo pharmacokinetic/pharmacodynamic profiles of valnemulin in an experimental intratracheal Mycoplasma gallisepticum infection model. Antimicrob Agents Chemother. (2015) 59:3754–60. doi: 10.1128/AAC.00200-15
30. Morselt M. Tulathromycin, a new antibiotic for farm animals. Tijdschr Diergeneeskd. (2004) 129:306–7.
31. Evans NA. Tulathromycin: overview of a new triamilide antimicrobial for the treatment of respiratory diseases in cows and pigs. Tieraerztliche Umschau. (2006) 61:A1–8.
32. Venner M, Kerth R, Klug E. Evaluation of tulathromycin in the treatment of pulmonary abscesses in foals. Vet J. (2007) 174:418–21. doi: 10.1016/j.tvjl.2006.08.016
33. Nickell JS, White BJ, Larson RL, Blasi DA, Renter DG. Comparison of short-term health and performance effects related to prophylactic administration of tulathromycin versus tilmicosin in long-hauled, highly stressed beef stocker calves. Vet Ther. (2008) 9:147–56. doi: 10.1111/j.1532-950X.2008.00395.x
34. Van Donkersgoed J, Merrill J, Hendrick S. Comparative efficacy of tilmicosin versus tulathromycin as a metaphylactic antimicrobial in feedlot calves at moderate risk for respiratory disease. Vet Ther. (2008) 9:291–7. doi: 10.1111/j.1532-950X.2008.00460.x
35. Heins BD, Nydam DV, Woolums AR, Berghaus RD, Overton MW. Comparative efficacy of enrofloxacin and tulathromycin for treatment of preweaning respiratory disease in dairy heifers. J Dairy Sci. (2014) 97:372–82. doi: 10.3168/jds.2013-6696
36. Mckelvie J, Morgan JH, Nanjiani IA, Sherington J, Rowan TG, Sunderland SJ. Evaluation of tulathromycin for the treatment of pneumonia following experimental infection of swine with Mycoplasma hyopneumoniae. Vet Ther. (2005) 6:197–202. doi: 10.1023/B:VERC.0000048528.76429.8b
37. Wellman NG, O'connor AM. Meta-analysis of treatment of cattle with bovine respiratory disease with tulathromycin. J Vet Pharmacol Ther. (2007) 30:234–41. doi: 10.1111/j.1365-2885.2007.00846.x
38. Zhou Q, Zhang G, Wang Q, Liu W, Huang Y, Yu P, et al. Pharmacokinetic/pharmacodynamic modeling of tulathromycin against Pasteurella multocida in a porcine tissue cage model. Front Pharmacol. (2017) 8:392. doi: 10.3389/fphar.2017.00392
39. Zhou YF, Peng HM, Bu MX, Liu YH, Sun J, Liao XP. Pharmacodynamic evaluation and PK/PD-based dose prediction of tulathromycin: a potential new indication for Streptococcus suis infection. Front Pharmacol. (2017) 8:684. doi: 10.3389/fphar.2017.00684
40. Toutain PL, Potter T, Pelligand L, Lacroix M, Illambas J, Lees P. Standard PK/PD concepts can be applied to determine a dosage regimen for a macrolide: the case of tulathromycin in the calf. J Vet Pharmacol Ther. (2017) 40:16–27. doi: 10.1111/jvp.12333
41. Zhao Y, Guo LL, Fang B, Liu B. Pharmacokinetic/pharmacodynamic (PK/PD) evaluation of tulathromycin against Haemophilus parasuis in an experimental neutropenic guinea pig model. PLoS ONE. (2018) 13:e0209177. doi: 10.1371/journal.pone.0209177
42. Benchaoui HA, Nowakowski M, Sherington J, Rowan TG, Sunderland SJ. Pharmacokinetics and lung tissue concentrations of tulathromycin in swine. J Vet Pharmacol Ther. (2004) 27:203–10. doi: 10.1111/j.1365-2885.2004.00586.x
43. Galer D, Hessong S, Beato B, Risk J, Inskeep P, Weerasinghe C, et al. An analytical method for the analysis of tulathromycin, an equilibrating triamilide, in bovine and porcine plasma and lung. J Agric Food Chem. (2004) 52:2179–91. doi: 10.1021/jf0351624
44. Nowakowski MA, Inskeep PB, Risk JE, Skogerboe TL, Benchaoui HA, Meinert TR, et al. Pharmacokinetics and lung tissue concentrations of tulathromycin, a new triamilide antibiotic, in cattle. Vet Ther. (2004) 5:60–74. doi: 10.1111/j.1532-950X.2004.04027.x
45. Young G, Smith GW, Leavens TL, Wetzlich SE, Baynes RE, Mason SE, et al. Pharmacokinetics of tulathromycin following subcutaneous administration in meat goats. Res Vet Sci. (2011) 90:477–9. doi: 10.1016/j.rvsc.2010.06.025
46. Amer AMM, Constable PD, Goudah A, El Badawy SA. Pharmacokinetics of tulathromycin in lactating goats. Small Ruminant Res. (2012) 108:137–43. doi: 10.1016/j.smallrumres.2012.07.003
47. Villarino N, Brown SA, Martin-Jimenez T. Pharmacokinetics of tulathromycin in healthy and neutropenic mice challenged intranasally with lipopolysaccharide from Escherichia coli. Antimicrob Agents Chemother. (2012) 56:4078–86. doi: 10.1128/AAC.00218-12
48. Abo-El-Sooud K, Afifi NA, Abd-El-Aty AM. Pharmacokinetics and bioavailability of tulathromycin following intravenous, intramuscular and subcutaneous administrations in healthy rabbits. Vet World. (2012) 5:424–8. doi: 10.5455/vetworld.2012.424-428
49. Pennington JE, Stone RM. Comparison of antibiotic regimens for treatment of experimental pneumonia due to Pseudomonas. J Infect Dis. (1979) 140:881–9. doi: 10.1093/infdis/140.6.881
50. Morozumi T, Hiramune T, Kobayashi K. Experimental infections of mice and guinea pigs with Haemophilus parasuis. Natl Inst Anim Health Q. (1982) 22:23–31.
51. Gao C, Chu YF, Zhao P, He Y, Lu ZX. Establishment of guinea pigs model for Haemophilus parasuis infection. Chin J Prev Vet Med. (2009) 2009:991–3. Available online at: http://www.en.cnki.com.cn/Article_en/CJFDTotal-ZGXQ200912022.htm
52. Clsi. Performance Standards for Antimicrobial Disk and Dilution Susceptibility Tests for Bacteria Isolated From Animals; Approved Standard—Fourth Edition. CLSI document VET01-A4. Wayne, PA: Clinical and Laboratory Standards Institute (2013).
53. Pruller S, Turni C, Blackall PJ, Beyerbach M, Klein G, Kreienbrock L, et al. Towards a standardized method for broth microdilution susceptibility testing of Haemophilus parasuis. J Clin Microbiol. (2017) 55:264–73. doi: 10.1128/JCM.01403-16
54. Huang XH, Zhao YD, He LM, Liang ZS, Guo LL, Zeng ZL, et al. Development of high performance liquid chromatography-tandem mass spectrometry method for the detection of tulathromycin in swine plasma. J Integr Agric. (2012) 11:465–73. doi: 10.1016/S2095-3119(12)60032-X
55. Bladek T, Posyniak A, Jablonski A, Gajda A. Pharmacokinetics of tulathromycin in edible tissues of healthy and experimentally infected pigs with Actinobacillus pleuropneumoniae. Food Addit Contam A Chem Anal Control Expo Risk Assess. (2015) 32:1823–32. doi: 10.1080/19440049.2015.1078915
56. Toutain PL, Bousquet-Melou A, Martinez M. AUC/MIC: a PK/PD index for antibiotics with a time dimension or simply a dimensionless scoring factor? J Antimicrob Chemother. (2007) 60:1185–8. doi: 10.1093/jac/dkm360
57. Riley MG, Russell EG, Callinan RB. Haemophilus parasuis infection in swine. J Am Vet Med Assoc. (1977) 171:649–51.
58. Nedbalcova K, Satran P, Jaglic Z, Ondriasova R, Kucerova Z. Haemophilus parasuis and Glasser's disease in pigs: a review. Vet Med. (2006) 51:168–79. doi: 10.17221/5537-VETMED
59. Burch DGS. Examination of the Pharmacokinetic/Pharmacodynamic (PK/PD) Relationships of Orally Administered Antimicrobials and Their Correlation With the Therapy of Various Bacterial and Mycoplasmal Infections in Pigs. Fellowship Thesis. London: The Royal College of Veterinary Surgeons (2012).
60. Olvera A, Cerda-Cuellar M, Nofrarias M, Revilla E, Segales J, Aragon V. Dynamics of Haemophilus parasuis genotypes in a farm recovered from an outbreak of Glasser's disease (vol 123, pg 230, 2007). Vet Microbiol. (2012) 157:251–251. doi: 10.1016/j.vetmic.2011.09.023
61. Zimmerman JJ, Yoon KJ, Wills RW, Swenson SL. General overview of PRRSV: a perspective from the United States. Vet Microbiol. (1997) 55:187–96. doi: 10.1016/S0378-1135(96)01330-2
62. Oliveira S, Batista L, Torremorell M, Pijoan C. Experimental colonization of piglets and gilts with systemic strains of Haemophilus parasuis and Streptococcus suis to prevent disease. Can J Vet Res. (2001) 65:161–7. doi: 10.2307/1592925
63. Yu J, Wu J, Zhang Y, Guo L, Cong X, Du Y, et al. Concurrent highly pathogenic porcine reproductive and respiratory syndrome virus infection accelerates Haemophilus parasuis infection in conventional pigs. Vet Microbiol. (2012) 158:316–21. doi: 10.1016/j.vetmic.2012.03.001
64. Palzer A, Haedke K, Heinritzi K, Zoels S, Ladinig A, Ritzmann M. Associations among Haemophilus parasuis, Mycoplasma hyorhinis, and porcine reproductive and respiratory syndrome virus infections in pigs with polyserositis. Can Vet J Revue Veterinaire Canadienne. (2015) 56:285–7.
65. Kavanova L, Matiaskova K, Leva L, Stepanova H, Nedbalcova K, Matiasovic J, et al. Concurrent infection with porcine reproductive and respiratory syndrome virus and Haemophilus parasuis in two types of porcine macrophages: apoptosis, production of ROS and formation of multinucleated giant cells. Vet Res. (2017) 48:28. doi: 10.1186/s13567-017-0433-6
66. Villarino N, Brown SA, Martin-Jimenez T. The role of the macrolide tulathromycin in veterinary medicine. Vet J. (2013) 198:352–7. doi: 10.1016/j.tvjl.2013.07.032
67. Vilalta C, Giboin H, Schneider M, El Garch F, Fraile L. Pharmacokinetic/pharmacodynamic evaluation of marbofloxacin in the treatment of Haemophilus parasuis and Actinobacillus pleuropneumoniae infections in nursery and fattener pigs using Monte Carlo simulations. J Vet Pharmacol Ther. (2014) 37:542–9. doi: 10.1111/jvp.12134
68. Sun J, Xiao X, Huang RJ, Yang T, Chen Y, Fang X, et al. In vitro dynamic pharmacokinetic/pharamcodynamic (PK/PD) study and COPD of Marbofloxacin against Haemophilus parasuis. BMC Vet Res. (2015) 11:5. doi: 10.1186/s12917-015-0604-5
69. Mouton JW, Theuretzbacher U, Craig WA, Tulkens PM, Derendorf H, Cars O. Tissue concentrations: do we ever learn? J Antimicrob Chemother. (2008) 61:235–7. doi: 10.1093/jac/dkm476
70. Wang C, Zhao T, Li Y, Huang G, White MA, Gao J. Investigation of endosome and lysosome biology by ultra pH-sensitive nanoprobes. Adv Drug Deliv Rev. (2017) 113:87–96. doi: 10.1016/j.addr.2016.08.014
71. Evans NA. Tulathromycin: an overview of a new triamilide antibiotic for livestock respiratory disease. Vet Ther. (2005) 6:83–95.
72. Godinho KS. Susceptibility testing of tulathromycin: interpretative breakpoints and susceptibility of field isolates. Vet Microbiol. (2008) 129:426–32. doi: 10.1016/j.vetmic.2007.11.033
73. Bello-Orti B, Costa-Hurtado M, Martinez-Moliner V, Segales J, Aragon V. Time course Haemophilus parasuis infection reveals pathological differences between virulent and non-virulent strains in the respiratory tract. Vet Microbiol. (2014) 170:430–7. doi: 10.1016/j.vetmic.2014.01.011
74. Wang X, Tao YF, Huang LL, Chen DM, Yin SZ, Ihsan A, et al. Pharmacokinetics of tulathromycin and its metabolite in swine administered with an intravenous bolus injection and a single gavage. J Vet Pharmacol Ther. (2012) 35:282–9. doi: 10.1111/j.1365-2885.2011.01322.x
75. Craig WA. In vitro and animal PK/PD models. In: Vinks A, Derendorf H, Mouton J, editors, Fundamentals of Antimicrobial Pharmacokinetics and Pharmacodynamics. New York, NY: Springer-Verlag (2014). p. 23–44. doi: 10.1007/978-0-387-75613-4_2
76. Nedbalcova K, Kucerova Z. Antimicrobial susceptibility of Pasteurella multocida and Haemophilus parasuis isolates associated with porcine pneumonia. Acta Veterinaria Brno. (2013) 82:3–7. doi: 10.2754/avb201382010003
77. Dayao DaE, Kienzle M, Gibson JS, Blackall PJ, Turni C. Use of a proposed antimicrobial susceptibility testing method for Haemophilus parasuis. Vet Microbiol. (2014) 172:586–9. doi: 10.1016/j.vetmic.2014.06.010
78. Drusano GL. Antimicrobial pharmacodynamics: critical interactions of “bug and drug”. Nat Rev Microbiol. (2004) 2:289–300. doi: 10.1038/nrmicro862
79. Olofsson SK, Cars O. Optimizing drug exposure to minimize selection of antibiotic resistance. Clin Infect Dis. (2007) 45:S129–36. doi: 10.1086/519256
80. Lees P, Illambas J, Potter TJ, Pelligand L, Rycroft A, Toutain PL. A large potentiation effect of serum on the in vitro potency of tulathromycin against Mannheimia haemolytica and Pasteurella multocida. J Vet Pharmacol Ther. (2017) 40:419–28. doi: 10.1111/jvp.12372
81. Toutain PL, Pelligand L, Lees P, Bousquet-Melou A, Ferran AA, Turnidge JD. The pharmacokinetic/pharmacodynamic paradigm for antimicrobial drugs in veterinary medicine: recent advances and critical appraisal. J Vet Pharmacol Ther. (2021) 44:172–200. doi: 10.1111/jvp.12917
Keywords: PK/PD, tulathromycin, in vivo, Haemophilus parasuis, guinea pig
Citation: Guo L-l, Gao R-y, Wang L-h, Lin S-j, Fang B-h and Zhao Y-d (2021) In vivo Pharmacokinetic/Pharmacodynamic (PK/PD) Profiles of Tulathromycin in an Experimental Intraperitoneal Haemophilus parasuis Infection Model in Neutropenic Guinea Pigs. Front. Vet. Sci. 8:715887. doi: 10.3389/fvets.2021.715887
Received: 27 May 2021; Accepted: 07 October 2021;
Published: 12 November 2021.
Edited by:
Nora Mestorino, National University of La Plata, ArgentinaReviewed by:
Pierre-Louis Toutain, Ecole Nationale Vétérinaire de Toulouse, FranceIjaz Ahmad, University of Agriculture, Peshawar, Pakistan
Copyright © 2021 Guo, Gao, Wang, Lin, Fang and Zhao. This is an open-access article distributed under the terms of the Creative Commons Attribution License (CC BY). The use, distribution or reproduction in other forums is permitted, provided the original author(s) and the copyright owner(s) are credited and that the original publication in this journal is cited, in accordance with accepted academic practice. No use, distribution or reproduction is permitted which does not comply with these terms.
*Correspondence: Yong-da Zhao, eWR6aGFvQHFhdS5lZHUuY24=