 Ping Jiang
 Ambreen Iqbal
 Mengyan Wang2
 Xibi Fang
 Haibin Yu
 Zhihui Zhao
- 1College of Coastal Agricultural Sciences, Guangdong Ocean University, Zhanjiang, China
- 2College of Animal Science, Jilin University, Changchun, China
The acyl-CoA dehydrogenase family of enzymes includes short/branched-chain acyl-CoA dehydrogenase (ACADSB), which catalyzes the dehydrogenation of acyl-CoA derivatives in fatty acid metabolism. Our previous findings suggested that ACADSB was a critical candidate gene affecting milk fat synthesis by comparing the transcriptome in bovine mammary epithelial cells (bMECs) from Chinese Holstein dairy cows producing high-fat and low-fat milk as well as gene functional validation studies on the cellular level. In the present study, ACADSB in bMECs was knocked out (KO) using a CRISPR/Cas9 system, and mRNA transcriptome was further sequenced to verify the function of the ACADSB gene and analyze its correlation with lipid metabolism. The findings revealed that 15,693 genes were expressed, 1,548 genes were differentially expressed genes (DEGs), and 6,098 GO terms were enriched, of which 637 GO terms were greatly enhanced, such as phospholipid-translocation ATPase activity (GO:0004012), lipoprotein lipase activity (GO:0004465), acyl-CoA desaturase activity (GO:0016215), and so on. The analysis by KEGG showed that DEGs were distributed over 247 pathogens, of which 49 were significantly enriched, including the metabolism of fatty acids (PATH: 01212), metabolism of glycerolipid (PATH: 00561), and signaling of adipocytokines (PATH: 04920). The CHOL, TGs and FFA contents in bMECs were reduced when the ACADSB gene was knocked out. The RT2 Profiler PCR array also revealed that the loss of the ACADSB gene changed the expression levels of functional genes involved in lipid metabolism, including ACADL, ACOX2, ACAT2, and FABP3. In conclusion, the current findings show that ACADSB is a key regulator of lipid metabolism in bMECs. The ACADSB−/− bMECs could also be useful genetic material and tools for future research into gene functions related to lipid and fatty acid metabolism. It will be valuable for revealing the gene regulatory roles and molecular mechanisms in milk fat synthesis.
Introduction
Milk fat is the most significant energy component in milk, and it plays a critical role in milk quality. Milk has a total fat content of about 3–5%. However, with the advancement of technology, the genetic mechanisms involved in milk fat synthesis are hitherto (1). The short/branched-chain acyl-CoA dehydrogenase (ACADSB) ENSBTAG00000018041) gene has two alternatively spliced transcripts and is found on the bovine chromosome 26:43134415-43184345. In bovine mammary epithelial cells (bMECs), ACADSB is a vital gene involved in lipid and fatty acid metabolism and has regulated triglyceride (TG) synthesis (2). Fat is oxidatively decomposed by lipase in lipid metabolism into triglycerides and free fatty acids and further decomposed into acetyl-CoA intrusive to the cycle of tricarboxylic acids (TCA), which involves glucose, lipid, and amino acids metabolism (3–5). The ACADSB gene also belongs to the ACAD mitochondrial family (6, 7). When a gene for a key enzyme in the mitochondria is mutated or deleted, it directly impacts the mitochondria's energy metabolism and the organism's aerobic respiration and glycolysis (8, 9). As a key functional gene in the lipid and fatty acid metabolism pathways, ACADSB could be an important link in these major metabolic networks.
Using gene overexpression and RNA interference (RNAi) approaches, the goal of this study was to learn more about the regulatory roles of the ACADSB, a candidate gene in bMECs involved in lipid and FA metabolism. However, the knock-out model of ACADSB gene cells remains less obvious in these studies (2). Therefore, the bMECs line has been chosen, which is capable of synthesizing and secreting milk in vitro and the mammary tissue of dairy livestock. Moreover, it can be used as a test model for cells to study gene function linked to the metabolism of milk lipids. The gene-editing technology CRISPR-Cas9 allows for the genetic modification of a wide range of cell and animal models. As a result, using CRISPR-Cas9 editing technology to create a Knock out cell line model further verifies the function of the target gene that regulates lipid metabolism and uses high-throughput RNA-seq to unravel the complex molecular mechanisms underlying various biological processes.
Materials and Methods
Preparation of Cells and Cell Culture
The experimental samples in this research were bMECs that had been stored in our laboratory. The bMECs were purified and cultured from a healthy dairy cow according to previous work performed in our laboratory by tissue nubble culture method (10). The cells were cultured in a basal medium containing Dulbecco's modified Eagle's medium and Nutrient Mixture F-12 (DMEM/F12, HyClone, Logan, USA) containing 10% FBS (fetal bovine serum, Tian hang, Zhejiang, China), 25 μL hydrocortisone (25 g/ml, Abcam, Cambridge, UK), and 25 μL insulin (0.25 EU/mg, Abcam, Cambridge (HyClone, Logan, USA).
Constructing Knockout Vector ACADSB–/–
The Zhang lab's pSpCas9(BB)-2A-GFP (PX458, addgene 48318) vector was chosen as the vector backbone because it expresses Cas9 Streptococcus pyogenes with an invariant sgRNA scaffold and cloning sites for inserting the guide sequence. Two complementary sgRNA oligo DNA were synthesized, annealed to form double-stranded DNA in the presence of 10 × NEB annealing buffer, and cloned into the BbsI sites of the PX458 targeting vector, according to the location and specificity. Transient transfecting bMECs resulted in the knockout of the ACADSB gene fragment. After 24 h, the cells were collected using trypsin without EDTA solution, and the cells were screened using flow cytometry to see if they could express a green fluorescent protein. The single positive cells were cultured in 96-well plates containing 20% serum and 1% antibiotics. Seven days later, under a microscope, a small pile of cell pellets can be seen. After digesting the cells and continuing culturing, a large population of cells can be observed under the microscope 15 days later.
PCR Identification and Sequencing
The genomic DNA was extracted from the cells, and PCR amplification was performed using the ACADSB gene detection primers. The detection primer sequence was: ACADSB F 5′-CGATACATACAGGCTTTTGGAAG-3′; ACADSB R 5′-AAGATGAGGGGCAATGGCT-3′. The edited cell lines were screened by PCR products sequencing.
Sample Collection and cDNA Library Construction
Total RNA was extracted with standard chloroform extraction from ACADSB−/− and negative control cells. DNase I (NEB, Beijing, China) was used to treat total RNA and Trizol reagent to extract it (Invitrogen, USA). The RNA quality was checked using the Bioanalyzer 2200 (Aligent)and then stored at −80°C. The cDNA libraries for each pooled RNA sample were created using the VAHTSTM Total RNA-seq (H/M/R) according to the manufacturer's instructions.
RNA Sequencing Mapping
Pair-end read mapping is a technique for mapping reads that have been split into two halves. Before the mapping was read, clear readings of the raw readings were obtained by removing adapter sequences, readings of >5% ambiguous bases (N) and low-quality readings containing more than 20% bases with <20. The clean readings were then aligned with the target genome.
Differentially Expressed Gene (DEG) Analysis in ACADSB–/– bMECs
Based on the fragments per kilobase of exon per million fragments mapped (FPKM) values, the expression information from RNA-seq data for the ACADSB−/− bMECs and wild-type (WT) bMECs was acquired. The DEGs were identified and filtered using the EB-Seq algorithm (11). P-value and FDR analysis were used to identify up-regulated or down-regulated DEGs after significant expression analysis (12).
Gene Enrichment Analysis and Pathway Analysis
The analysis of gene ontology (GO) was conducted to elucidate the biological consequences of unique genes insignificant or representative target gene profiles (13). NCBI (http://www.ncbi.nlm.nih.gov/), UniProt (http://www.uniprot.org/), and the Gene Ontology (http://www.geneontology.org/) provided the GO annotations. The significant GO categories were identified using Fisher's exact test, and the P-values were corrected using the FDR method. Pathway analysis was used to identify the effective path of KEGG differential genes. Fisher's exact test was used to select the significant route, and P-value and FDR defined the threshold of significance (14). Corrected p < 0.05 has been considered to be significantly enhanced.
Construction of the Interactive Network
KEGG refers to as we are all aware of several biological processes, including metabolism, membrane transport, signal translation and cell cycle pathways. The DEGs were enriched by biological pathways and the graphic representations of pathways using Cytoscape 3.6.1 (15). The study of gene interaction can reflect the function of genes and the regulatory role of genes.
Analysis of ACADSB Expression by Quantitative Real-Time Polymerase Chain Reaction (qRT-PCR) and Western Blotting (WB) in the Knockout Cells
With the help of an RNA extraction kit, total RNA was extracted from the ACADSB−/− and WT bMECs (Analytik Jena, Germany). A spectrophotometer was used for the concentration and purity of the RNA and further confirmed with 1.5 per cent of the agarose gel electrophoresis. The cDNA was obtained with a synthesis kit for cDNA (TaKaRa Biotechnology, RR047A, Dalian, China). The first printing was made of 5′-AGCTACTGTGCGCTGCTG-3′ and reverse priming, 5′-TCCATTGCTGTTGAG-3′. Then, the qRT-PCR was performed with SYBR® Premix Ex Taq TM (TaKaRa Biotechnology, RR420L, Dalian, China) (2). The following conditions were used for PCR amplification in a 10 μL reaction volume: an initial denaturing step of 95°C for 30 s, followed by 40 cycles of 95°C for 10 s, and then 60°C for 45 s. The concentrations of all the samples were adjusted to the same level. qRT-PCR was used to determine mRNA expression, with β-actin serving as an internal control gene. All qRT-PCRs were carried out three times in total.
The total protein was extracted from the ACADSB−/− and WT bMECs using a radio immunoprecipitation assay buffer (RIPA, AR0105, BOSTER, China) containing protease and phosphatase inhibitors. The Enhanced BCA Protein Quantitation Assay Kit was used to determine the total protein concentration (KeyGEN BioTECH, KGP902, Jiangsu, China). Technical replicates were used for the three experiments on the same sample, and protein concentration was measured in triplicate. The rabbit polyclonal anti-ACADSB antibody (1:1550 dilution in 1 TBS, sigma Antibodies, AV-54586, China) and tubulin (1:20, 000 dilution in 1 TBS, bioss, bs-4511R, Beijing, China) were then incubated for 16 h at 4°C on the polyvinylidene fluoride membrane. A gray value analyzer was used to calculate the relative expression of the target proteins in different cells (Tanon 5200, Shanghai, China).
Validation of mRNAs by RT2 Profiler PCR Array
An RNeasy Mini Kit extracted 1 μg of total RNA from the bMECs (Qiagen, 74134, Frankfurt, Germany). Then, according to the protocol, cDNA was synthesized using an RT2 First Strand Kit (Qiagen, 330404, Frankfurt, Germany). Mx3005p was used to perform the qRT-PCR (Agilent Stratagene, California, USA). An RT2 Profiler PCR Array was used to determine the transcript levels of genes involved in the lipid and fatty acid metabolism pathways (Qiagen, CLAB24070A, Frankfurt, Germany). 5 different housekeeping genes were selected as reference genes, β-actin (ACTB), glyceraldehyde-3-phosphate dehydrogenase (GAPDH), tyrosine 3-monooxygenase (YWHAZ), hypoxanthine phosphoribosyltransferase 1 (HPRT1) and TATA-box binding protein (TBP). The Ct values were standardized based on the gene selection. The expression fold change/regulation was calculated using the delta/delta Ct method of the data analysis web portal in which delta Ct is calculated between the gene of interest (GOI) and the average reference genes (HKG), followed by delta-delta Ct calculations. Then the fold change was calculated with formula 2 (−delta delta Ct) (5).
Analysis of the Triglyceride, Cholesterol and Free Fatty Acids Contents in bMECs
TG detection kit was used to determine the content of TGs in the samples. The total CHOL content of cells was determined using a tissue/cell total CHOL assay kit (Applygen Technologies, Beijing, China). The FFA assay kit was used to determine the amount of free fatty acids in the sample (Solarbio life sciences, Beijing, China). WT and ACADSB−/− cells were seeded at a density of 2 × 10⁵ cells per well in culture plates. The concentrations were measured using a microplate reader (YongChuang SM600, Shanghai, China) after the cellular contents of TGs, CHOL, and FFA were adjusted by each microgram of protein. The TGs, CHOL, and FFA of cells were extracted following the manufacturer's instructions.
Statistical Analysis
Experimental data is displayed as ± SEM means. The P-value (p < 0.05) has been defined as statistically significant differences. A comparative Ct method (2−delta delta Ct) was used for qRT-PCR data on relative gene expression. GraphPad Prism 6 software (GraphPad, San Diego, CA, USA) is used in the data analysis with a two-tailed t-test. The online RT2 Profiler PCR Array data analysis software (https://geneglobe.qiagen.com/cn/analyze) analyzed the relative expression information for genes.
Results
Generation of ACADSB–/– bMECs
The exon 5, the conserved domain of the ACADSB gene opening read frame (ORF) sequence, was selected as a potential target sequence for ACADSB−/− sgRNAs. BbsI restriction site behind the U6 promoter was recognized, and the enzyme ligated into the PX458 plasmid (Figure 1A). After the recombinant plasmid was transfected into bMECs through transiently transfecting, the cells containing ACADSB sgRNA were identified with green fluorescence under a fluorescence microscope (Figure 1B). One single live cell was screened by the flow cytometry and then transferred into 96-well plates for the culture of ACADSB−/− bMECs. Upon agarose gel electrophoresis, WT cells demonstrated a 344bp band for the ACADSB PCR product (Figure 1C). In addition, the sequencing data of genomic DNA extracted from WT cells and ACADSB−/− bMECs confirmed that the target sequence of ACADSB was effectively disrupted in bMECs (Figure 1D). The expression of ACADSB−/− bMECs was determined by qPCR and WB technology. ACADSB−/− bMECs showed a significant decrease compared with WT cells in the mRNA level (Figure 1E). ACADSB−/− bMECs also showed a significant decrease compared with WT cells in protein level (Figure 1F).
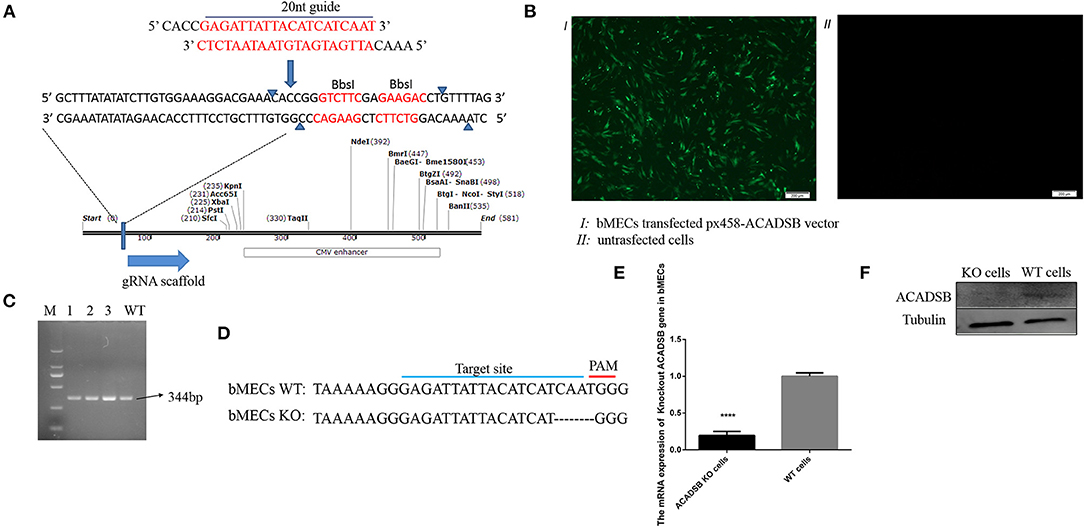
Figure 1. Construction of ACADSB gene knockout vector and identification of mRNA and protein levels. (A) Construction of ACADSB gene recombinant knockout vector (PX458-ACADSB). (B) PX458-ACADSB recombinant knockout vectors were transfected into bMECs. (C) The single positive cells were screened which can express green fluorescent protein by flowing cytometry and then were cultured for extracting the genome DNA to identify the edited cell line by PCR. (D) The sequence of the monoclonal PX458-ACADSB knockout cell line was compared with the wild cell line, the gRNA sequence was missing 4 bases near the PAM site, causing a frameshift mutation. (E) ACADSB relative mRNA expression levels in ACADSB−/− bMECs and wild type bMECs line. (F) ACADSB relative protein expression levels in ACADSB−/− bMECs and wild type bMECs line.
Analysis of the Triglyceride, Cholesterol and Free Fatty Acids Contents in bMECs
The results showed that the CHOL content in ACADSB−/− bMECs was decreased compared with that in the WT bMECs (p < 0.05, Figure 2A). Furthermore, the TG content was lower in ACADSB−/− bMECs than in the WT bMECs (p < 0.05, Figure 2B). The content of FFA was also significantly inhibited in ACADSB−/− bMECs than in the WT bMECs (p < 0.05, Figure 2C).
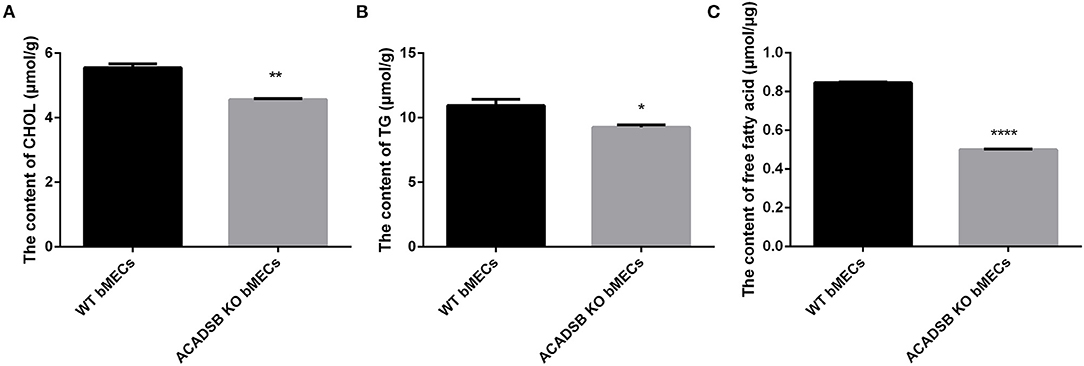
Figure 2. The effect of ACADSB on TGs, CHOL and FFA contents in bMECs. (A) The CHOL content in ACADSB−/− bMECs was decreased compared with that in the WT bMECs. (B) The TG content was lower in ACADSB−/− bMECs compared with that in the WT bMECs. (C) The content of FFA was also significant inhibited in ACADSB−/− bMECs than in the WT bMECs (Experimental data are shown as mean ± SEM). ****p < 0.0001, **p < 0.01, *p < 0.05.
Identification of DEGs in ACADSB–/– bMECs
RNA-seq analysis of ACADSB−/−bMECs was performed to clarify the mechanism of the ACADSB gene. A total of 1,548 DEGs were obtained for the ACADSB−/− bMECs compared to the WT groups, including 750 upregulated DEGs, 798 downregulated DEGs, as shown in the hierarchical clustering heatmaps (Figures 3A,B) including five upregulated DEGs such as ACADSB, fatty acid desaturase 1(FADS1), carnitine palmitoyltransferase 1C(CPT1C), solute carrier family 27 member 5(SLC27A5), 2,4-dienoyl-CoA reductase 2(DECR2), and five downregulated DEGs such as protein kinase cAMP-activated catalytic subunit beta (PRKACB), glycerol-3-phosphate dehydrogenase 2(GPD2), acyl-CoA synthetase medium-chain family member 3(ACSM3),acyl-CoA synthetase long-chain family member 1(ACSL1), solute carrier family 27 member 6 (SLC27A6) showed in Table 1.
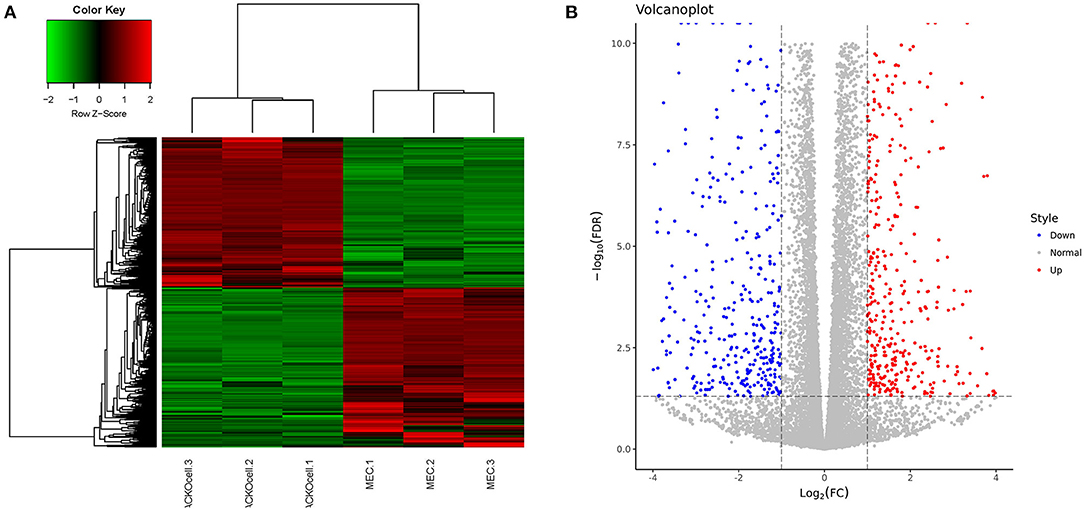
Figure 3. Identification of DEGs in WT and ACADSB−/− bMECs by RNA-seq. (A) Hierarchical clustering heatmaps of WT and ACADSB−/− bMECs. (B) Volcanoplot of WT and ACADSB−/− bMECs.
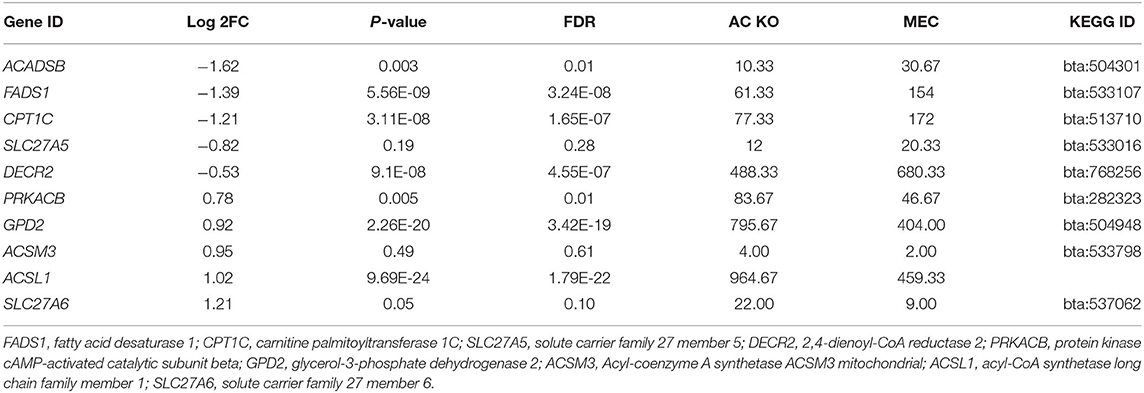
Table 1. The expression levels details of partial regulated genes in ACADSB−/− bMECs.
Validation of mRNAs in a Fatty Acid Pathway by RT2 Profiler PCR Array
To aid interpretation, the fold change results of relative genes involved in the lipid and fatty acid metabolism pathways are normalized in Table 2. ACADSB−/− up-regulated seven genes, including acyl-CoA dehydrogenase long-chain (ACADL) and acyl-CoA oxidase 2 (ACOX2), according to the findings. ACADSB−/− also caused the down-regulation of ten genes, including acetyl-CoA acetyltransferase 2 (ACAT2) and fatty acid-binding protein 3 (FABP3). The results were also consistent with the RNA-seq results, confirming the RNA seq's reliability.
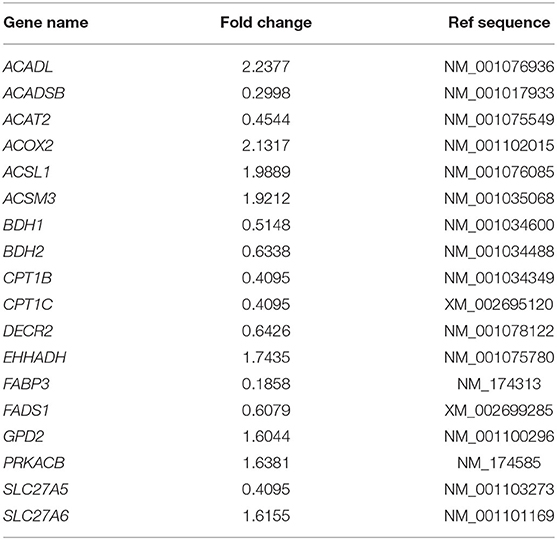
Table 2. Fold changes in expression of genes involved in lipid and fatty acid metabolism that are regulated in ACADSB−/− bMECs.
Gene Ontology and Functional Enrichment Analysis in ACADSB–/– bMECs
The Gene Ontology (GO) term functional enrichment demonstrates that DEGs have been enriched in 6,098 GOs, with 637 GOs significantly enriched, including 405 biological GO processes (Figure 4A), 113 molecular GO in Figure 4B and 45 cellular GO components (Figure 4C). Based on the molecular function, primary including ligand-activated sequence-specific DNA binding RNA polymerase II transcription factor activities (GO: 0004879), including insulin-like growth factor I binding (GO: 0031994). The biological process main including localization of cell adhesion (GO: 0007155) and extracellular matrix organization (GO: 0030198). Extracellular matrix (GO:031012) and proteinaceous extracellular matrix (GO: 0005578) are included in the cellular components. Figure 4D shows the top 20 GO terms, ordered by corrected P-value in ascending order. ACADSB−/− bMECs have been subject to the enrichment analysis for KEGG pathways to explore the pathways associated with DEGs. Figure 5A juxtaposes the most significant pathway among the top 20 enriched pathways in the ACADSB−/− bMECs group. In total, 247 pathways were discovered, with 49 pathway terms significantly enriched in Figure 5B. Down-regulated genes were significantly enriched in 27 pathways in ACADSB−/− bMECs, with the ECM-receptor interaction (PATH: 04512) and glycerolipid metabolism (PATH: 00561) were significantly enriched in ACADSB−/− bMECs, and ECM-receptor interaction pathway showed the highest enrichment in Figure 5C. Figure 5D shows that up-regulated genes are enriched in 46 pathways, including the Adipocytokine signaling pathway (PATH: 04920), Glycerophospholipid metabolism (PATH: 00564), and the Oxytocin signaling pathway (PATH: 04921).
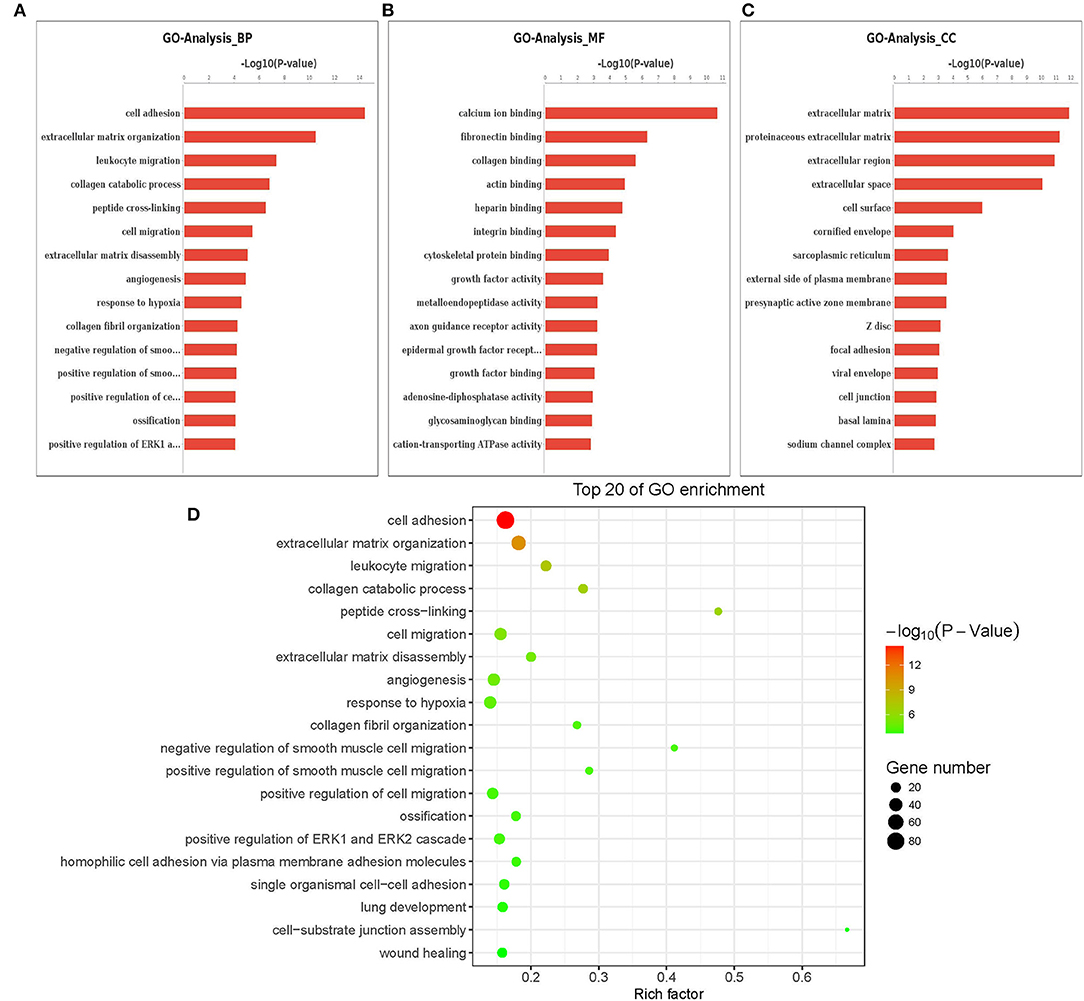
Figure 4. Enriched GO terms of DGEs in ACADSB−/− bMECs. (A) The most significant differences in biological processes. (B) The most significant differences in cellular components. (C) The most significant differences in molecular functions. (D) The top 20 GO terms. GO, Gene Ontology. BP, biological process. CC, cellular component. MF, molecular function. DEG, differentially expressed gene.
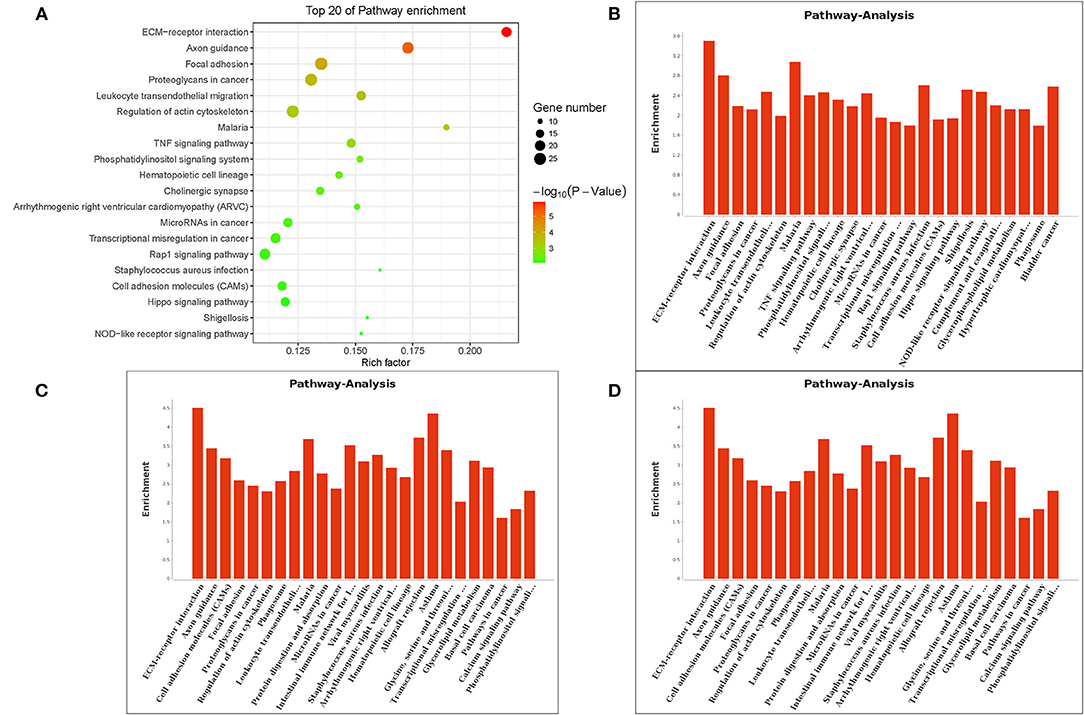
Figure 5. Enriched KEGG pathways of DGEs in ACADSB−/− bMECs. (A) The top 20 enriched pathways for DEGs. (B) Pathway terms of DEGs. (C) Pathway terms of down-regulated genes. (D) Pathway terms of up-regulated genes. KEGG, Kyoto Encyclopedia of Genes and Genomes.
The pathway-act network represents the interaction of different pathways to explore interactions in an enriched biologic direction. The red dots represent up-regulated pathways, and the green dots represent down-regulated pathways shown in Figure 6.
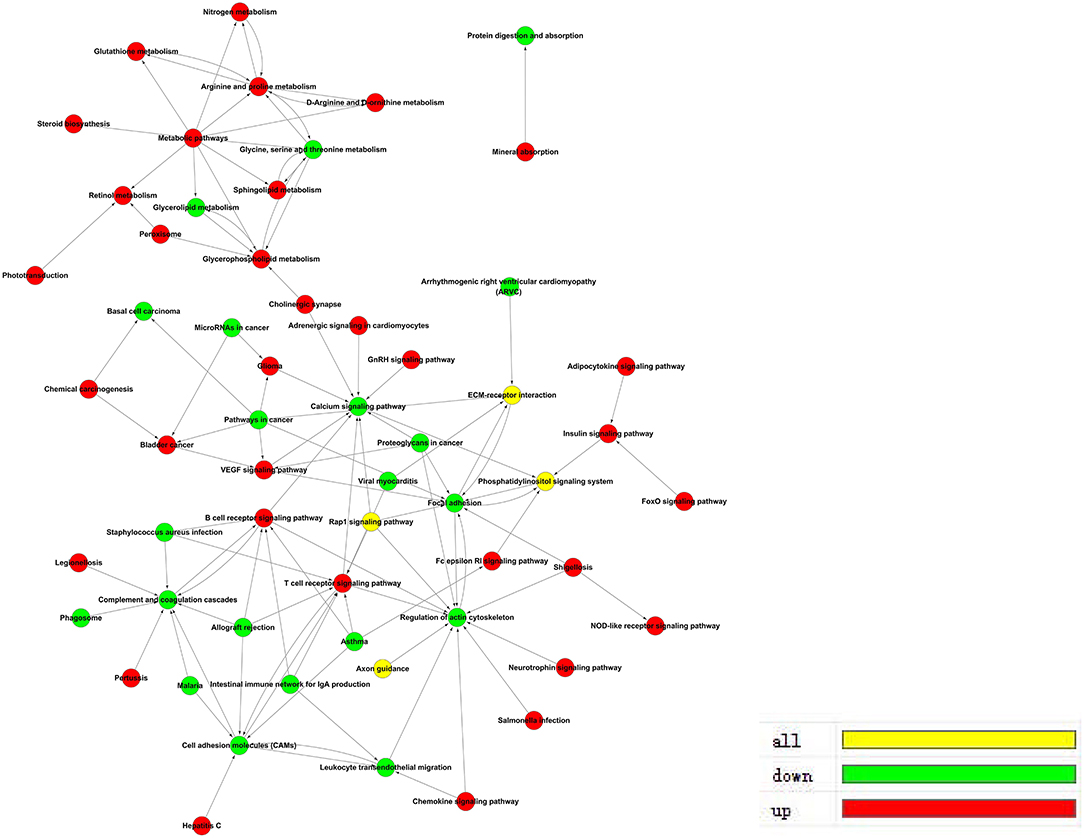
Figure 6. Pathway-Act network in ACADSB−/− bMECs.
Predictive Analysis of Interaction Relationship Between Differential Genes
The transcriptome analysis of differential expression genes protein interaction relationship in ACADSB gene knockout cells line revealed that up-regulated gene PPARA might promote the expression of up-regulated gene CPT1A and down-regulated gene CPT1C, which led to the up-regulated gene CPT1A and the down-regulated gene CPT1C may interact respectively with the up-regulated gene ACSL6 and the down-regulated gene ACSL5 to form a complex. The up-regulated genes COL5A3 and COL6A2 and the down-regulated genes COL1A2, LAMC2, FN1, and COL3A1, may collaborate to activate the down-regulated gene CD44 (Figure 7), intimating that the ACADSB gene can influence CD44 transcription levels by regulating the expression of other genes.
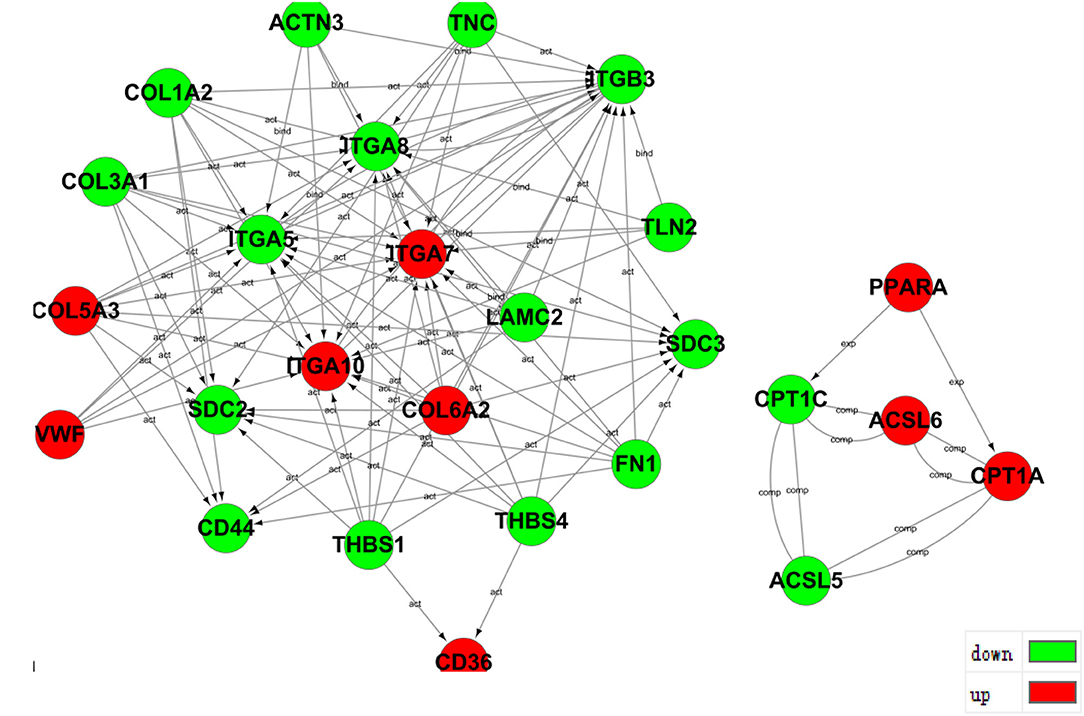
Figure 7. Prediction of protein interaction among partial differentially expressed genes.
Discussion
The term “gene-editing technology” refers to the process of altering an organism's genome artificially. The efficiency of gene editing has been dramatically improved due to the tremendous development of CRISPR/Cas9 technology. The effect of gene modification on a variety of cell models and animal models in several species has been realized (16, 17)1. CRISPR/Cas9 technology is effective in gene editing in eukaryotic cells in a growing number of studies. Gene-editing production, as a novel gene tool, can be used to investigate gene functions that aren't clear (18). Using the CRISPR/Cas9 system, some researchers successfully constructed myostatin (MSTN) KO animals such as cattle, pigs, sheep, mice, and rabbits, which is a reliable and effective animal model for the study of muscle development and related diseases, as well as having a good application prospect in transgenic animal production by improving muscle quality (19–22)2. According to recent research, CRISPR/Cas9 technology was used to knock out or knock down various functional genes, resulting in the regulation of related metabolic pathways. The role of genes was clearly explained in vivo and in animal models. The variety of cell models also were widely used in molecular research or related diseases, such as Fragile X Mental Retardation 1 (FMR1) homozygous knock out human embryonic stem cell line, which can further study the biological importance of Fragile X Mental Retardation Protein(FMRP) at a cellular level (23); Regulator of G protein signaling 18 (RGS18) knockout cell line from a human embryonic stem cell line was constructed, which can further understand roles of RGS18 in biological and cellular processes (24); The diacylglycerol kinase θ (DGKθ) gene was knocked out in liver cancer cell line HepG2 to investigate the role of DGKθ in lipid metabolism and insulin resistance (25), etc. This study revealed that knocking out a target gene can help researchers learn much about how it plays a role in the various metabolic, pathway, and biological processes at the cellular level. As a result, bMECs can be used as an experimental model to investigate the function of ACADSB−/−, which can be used to validate whether ACADSB−/− can regulate the synthesis of fat milk components and play a significant role in milk fat synthesis.
In this study, gRNA sequences were designed in the conserved regions of the candidate genes. The coding regions of the candidate genes were precisely targeted, solving the problem of RNAi technology's low interference performance.
The ACADSB gene, involved in fat milk synthesis, has previously been differentially expressed (2). The mammary gland tissue of dairy cows can be used as a bioreactor for most biological research because it has the physiological functions of synthesizing and secreting milk. However, there are some limitations to using this model to research TG synthesis in the mammary gland (26). Culturing in-vitro bovine breast epithelial cells can maintain this ability to synthesize and secrete milk. And bMECs can be used as cell models to study the connection between objective genes and a milk fat synthesis pathway. Therefore, we are developing the knockout ACADSB vector to construct a knockout ACADSB cell line, so we can continue exploring in-depth. The current study has shown that ACADSB−/− may impact the CHOL, FAs, and TGs content of bMECs following past research (2). As anticipated, ACADSB−/− cells contained a significantly lower content of triglycerides, cholesterol, and FAs than control cells, indicating that the ACADSB−/− cell line was the potential and valuable tool to evaluate the expression of relatively lipid-associated genes.
GO Term enrichment study demonstrated that DEGs have been massively enriched by GO terms linked to lipid metabolism and GO terms associated with cell metabolism. The level of expression considerably up-regulated gene enrichment for the GO-Term Gene in a cell-line of ACADSB−/−and wild-type bMECs has shown DEGs like the CD36 molecule(CD36), a Low- Density lipoprotein receptor-related protein 1B(LRP1B), which are part of low-density lipoprotein receptor activity Go term(GO:0005041), CD44 molecule(CD44) gene involved in cytokine receptor activity in Go term(GO:0004896), insulin-like growth factor-binding protein 5(IGFBP5) involved in insulin-like growth factor II binding GO term (GO: 0031995). Furthermore, the GO term-mRNA network study aims at finding genes associated with multiple lipid metabolism-related GO terms, such as apolipoprotein B mRNA editing enzyme, catalytic polypeptide 1(APOBEC1), NPC1-like 1(NPC1L1), oxidized low-density lipoprotein (lectin-like) receptor 1(OLR1), peroxisome proliferator-activated receptor-alpha (PPARA), apolipoprotein L domain containing 1 (APOLD1), etc. Furthermore, the level of gene expression was significantly reduced. The relative expression of target genes involved in lipid metabolism or cell metabolism was also regulated by knocking out the ACADSB gene, according to GO term enrichment.
The KEGG enrichment analysis of differentially expressed genes in ACADSB−/− cell line and wild-type bMECs revealed that 247 pathways were enriched in differentially expressed genes, 49 of which were significantly enriched (p < 0.05), and 27 pathways were enriched in down-regulated genes, such as ECM-receptor interaction (PATH:04512), glyceride metabolism pathway (PATH:00561), and phosphatidylinositol metabolism pathway (PATH:04070), protein digestion and absorption (PATH:04974), etc. Up-regulated genes are found in 46 pathways, including the glycerophospholipid signaling pathway (PATH:00564), the oxytocin signaling pathway (PATH:04921), the adipocytokine signaling pathway (PATH:04920), the insulin signaling pathway (PATH:04910), and the metabolic pathway (PATH:01100), among others. According to the research results, the complete loss of the ACADSB gene resulted in differences in the expression levels of genes involved in fatty acid and lipid metabolism, regulating the lipid metabolism process in bMECs.
Following the KEGG enrichment and GO term enrichment analysis, which indicated ACADSB gene involved in the lipid metabolism and fatty acids metabolism, therefore, relative genes which involve in the lipid and fatty acids pathway were selected to confirmed by qPCR array. The ACADSB−/− gene qPCR array results revealed that the following genes were up-regulated: ACADL, ACOX2, ACSL1, ACSM3, EHHADH, GPD2, PRKACB, SLC27A5, SLC27A6, while the genes such as ACAT2, BDH1, BDH2, CPT1B, CPT1C, DECR2, FABP3 were down-regulated, which is consistent with the ACADSB−/− transcriptome sequencing results. The above findings suggest that knocking out the ACADSB gene may affect the differential candidate genes identified by RNA-seq, which are functional genes that influence lipid and fatty acid metabolism.
Predictive analysis in ACADSB−/− cell lines for differential gene-protein interactions showed that CD44 was activated by other multiple genes, and CD44 expression is down-regulated, suggesting that the silence of the ACADSB gene leads to decreased CD44-expression regulation. In the previous study, CD44 gene silencing has also been found to decrease the level of expression of the ACADSB gene. This shows that ACADSB and CD44 genes may be able to interact, and their function both focuses on lipid metabolism and fatty acids metabolism. However, the expression levels of all genes are not consistent due to differently regulated genes. This also reminds us that in the future, the interactive relationship between two or several genes can also be a hotspot for further exploration, and the ACADSB and CD44 genes may have a common effect on lipid metabolism, or one of the ACADSB and CD44 gene may affect lipid metabolism by regulating the expression of another gene.
In conclusion, our findings revealed that ACADSB regulates the metabolism of FFAs, TGs, and CHOL by controlling the expression of related genes involved in the lipid metabolism pathway. The findings also showed that ACADSB is a pivotal gene that regulates related genes such as ACADL and ACOX2, playing a crucial role in lipid metabolism. This study discovered the role of the ACADSB gene in lipid metabolism in bMECs in vitro and identified several key players in the ACADSB gene's regulatory network in lipid metabolism, laying the groundwork for future research into the molecular mechanism by which ACADSB influences the synthesis of milk fat component in vivo. Furthermore, in this study, the ACADSB−/− cell line model was established, which could be used as genetic material and directly applied to lipid metabolism-related gene molecular research.
Data Availability Statement
The datasets presented in this study can be found in online repositories. The names of the repository/repositories and accession number(s) can be found below: NCBI GEO, accession no: GSE181131.
Author Contributions
ZZ and PJ designed the study. XL and XF collected the samples. MW and HY collected the data. PJ conducted the bioinformatics analyses and wrote the manuscript. AI and PJ revised the manuscript. All authors read and approved the final manuscript.
Funding
This work was supported by the youth Project of Innovative Strong School Engineering by the Department of Education of Guangdong Province (2019KQNCX042), the National Natural Science Foundation of China (No. 32002165, 31772562, and 32072717), and the Key Platform Project of Innovative Strong School Engineering by the Department of Education of Guangdong Province (2018302).
Conflict of Interest
The authors declare that the research was conducted in the absence of any commercial or financial relationships that could be construed as a potential conflict of interest.
Publisher's Note
All claims expressed in this article are solely those of the authors and do not necessarily represent those of their affiliated organizations, or those of the publisher, the editors and the reviewers. Any product that may be evaluated in this article, or claim that may be made by its manufacturer, is not guaranteed or endorsed by the publisher.
Supplementary Material
The Supplementary Material for this article can be found online at: https://www.frontiersin.org/articles/10.3389/fvets.2021.744287/full#supplementary-material
Footnotes
1. ^Salimi M, Mehravar M, Shirazi A, Sarvari A, Behzadi B. Epigenetic events and germ line transmission in rag1 knock-out chimeric mice produced by CRISPR/Cas9 technology. (2021). 10.21203/rs.3.rs-153876/v1 (Unpublished preprint).
2. ^Zhang Y, Zheng Y, Wu L, Li Z, Cui K. Generation of heritable double muscle buttocks rabbits via myostatin mutation with CRISPR/Cas9 system. (2020). 10.21203/rs.3.rs-125471/v1 (Unpublished preprint).
References
1. Zhou C, Shen D, Li C, Cai W, Zhang S. Comparative transcriptomic and proteomic analyses identify key genes associated with milk fat traits in chinese holstein cows. Front Genet. (2019) 10:672. doi: 10.3389/fgene.2019.00672
2. Ping J, Fang X, Zhao Z, Yu X, Yang R. The effect of short/branched chain acyl-coenzymeA dehydrogenase gene on triglyceride synthesis of bovine mammary epithelial cells. Archives Animal Breeding. (2018) 61:115–22. doi: 10.5194/aab-61-115-2018
3. Rodríguez A, Esteban L, Martín L, Jiménez M, Hita E, Castillo B, et al. Synthesis of 2-monoacylglycerols and structured triacylglycerols rich in polyunsaturated fatty acids by enzyme catalyzed reactions. Enzyme Microb Technol. (2012) 51:148–55. doi: 10.1016/j.enzmictec.2012.05.006
4. Lubary M, Hofland GW, Horst J. The potential of milk fat for the synthesis of valuable derivatives. Eur Food Res Technol. (2011) 232:1–8. doi: 10.1007/s00217-010-1387-3
5. Jiang P, Xia L, Jin ZK, Ali S, Zhao Z. New function of the CD44 gene: Lipid metabolism regulation in bovine mammary epithelial cells. J Dairy Sci. (2020) 7:6661–71. doi: 10.3168/jds.2019-17415
6. Arden KC, Viars CS, Fu K, Rozen R. Localization of short/branched chain acyl-CoA dehydrogenase (ACADSB) to human chromosome 10. Genomics. (1995) 25:743–5. doi: 10.1016/0888-7543(95)80023-F
7. Alfardan J, Mohsen A-W, Copeland S, Ellison J, Keppen-Davis L, Rohrbach M, et al.Characterization of new ACADSB gene sequence mutations and clinical implications in patients with 2-methylbutyrylglycinuria identified by newborn screening. Mol Genet Metab. (2010) 100:333–8. doi: 10.1016/j.ymgme.2010.04.014
8. Ensenauer R, Miao H, Willard JM, Goetzman ES, Corydon T, Vandahl BB, et al. Enzyme Catalysis and Regulation: Human acyl-CoA dehydrogenase 9 (ACAD-9): characterization of a novel role in the mitochondrial β-oxidation of unsaturated fatty acids. J Bio Chemist. (2005) 280:32309–16. doi: 10.1074/jbc.M504460200
9. Nguyen TV, Andresen BS, Corydon TJ, Ghisla S, Razik AE, Mohsen A, et al. Identification of isobutyryl-CoA dehydrogenase and its deficiency in humans. Mol Genetics Metabol. (2002) 77:68–79. doi: 10.1016/S1096-7192(02)00152-X
10. Lu C, Yang R, Liu B, Li Z, Zhao Z. Establishment of two types of mammary epithelial cell lines from chinese holstein dairy cow. J Animal Vet Adv. (2012) 11:1166–72. doi: 10.3923/javaa.2012.1166.1172
11. Ning L, Dawson JA, Thomson JA, Victor R, Rissman AI, Smits B, et al. EBSeq: an empirical Bayes hierarchical model for inference in RNA-seq experiments. Bioinformatics. (2013) 29:1035–43. doi: 10.1093/bioinformatics/btt087
12. Benjamini Y, Dan D, Elmer G, Kafkafi N, Golani I. Controlling the false discovery rate in behavior genetics research. Behav Brain Res. (2001) 125:279–84. doi: 10.1016/S0166-4328(01)00297-2
13. Ashburner Michael Ball, Catherine A, Blake, Judith A, et al. Gene Ontology: tool for the unification of biology. Nat Genet. (2000) 25: 25–29. doi: 10.1038/75556
14. Draghici S, Khatri P, Tarca AL, Amin K, Done A, Voichita C, et al. A systems biology approach for pathway level analysis. Genome Res. (2007) 17:1537–45. doi: 10.1101/gr.6202607
15. Shannon P. Cytoscape: a software environment for integrated models of biomolecular interaction networks. Genome Res. (2003) 13:2498–504. doi: 10.1101/gr.1239303
16. Yue M, Yan W, Chen H, Zhong SS, Ju XD. Recent progress in CRISPR/Cas9 technology. J Genet Genomics. (2016) 43:63–75. doi: 10.1016/j.jgg.2016.01.001
17. Mananares A, Cabezas J, Rojas D, Manriquez J, Castro FO. 207 Editing of prostaglandin E2 gene receptors EP2 and EP4 by CRISPR/Cas9 technology in equine adipose mesenchymal stem cells. IETS. (2020) 32: 232–32. doi: 10.1071/RDv32n2Ab207
18. Oliveira V, Junior C, Belizário J, Krieger JE, Ambrósio C. Characterization of post-edited cells modified in the TFAM gene by CRISPR/Cas9 technology in the bovine model. PLoS ONE. (2020) 15:e0235856. doi: 10.1371/journal.pone.0235856
19. Ding Y, Zhou SW, Ding Q, Cai B, Chen YL. The CRISPR/Cas9 induces large genomic fragment deletions of MSTN and phenotypic changes in sheep. J Integr Agric. (2020) 19:1065–73. doi: 10.1016/S2095-3119(19)62853-4
20. Hua W, Bi Y, Liu X, Zhang L, Xiao H, Zheng X, et al. Preparation of myostatin gene knock out pig cells using a CRISPR/Cas9 system. Genom Applied Bio. (2015) 34:945–9. doi: 10.1038/srep16623
21. Wang X, Chen Y. Heritable gene disruption in goats with CRISPR/Cas9 results in expected phenotypes. J Anim Sci. (2016) 94:176–176. doi: 10.2527/jas2016.94supplement4176x
22. Ren HY, Yan-Zhen BI, Li L, Zheng XM. Production of MSTN Gene Mutant Mice Using CRISPR/Cas9 System. Hubei Agricultural Sciences. (2015) 54:5155–8. doi: 10.14088/j.cnki.issn0439-8114.2015.20.058
23. Giri S, Purushottam M, Viswanath B, Muddashetty RS Generation of a FMR1 homozygous knockout human embryonic stem cell line (WAe009-A-16) by CRISPR/Cas9 editing. Stem Cell Research. (2019) 39:101494. doi: 10.1016/j.scr.2019.101494
24. Feng Y, Li X, Zhang L, Sun Y, Long B. Generation of a RGS18 gene knockout cell line from a human embryonic stem cell line by CRISPR/Cas9. Stem Cell Res. (2020) 49:102072. doi: 10.1016/j.scr.2020.102072
25. Zhang J, Zhao J, Zheng X, Cai K, Mao Q, Xia H. Establishment of a novel hepatic steatosis cell model by Cas9/sgRNA-mediated DGKθ gene knockout. Molecular Medicine Reports,. (2018) 17:2169–76. doi: 10.3892/mmr.2017.8140
Keywords: ACADSB, CRISPR/Cas9, DEGs, lipid metabolism, fatty acid metabolism
Citation: Jiang P, Iqbal A, Wang M, Li X, Fang X, Yu H and Zhao Z (2021) Transcriptomic Analysis of Short/Branched-Chain Acyl-Coenzyme a Dehydrogenase Knocked Out bMECs Revealed Its Regulatory Effect on Lipid Metabolism. Front. Vet. Sci. 8:744287. doi: 10.3389/fvets.2021.744287
Received: 20 July 2021; Accepted: 12 August 2021;
Published: 07 September 2021.
Edited by:
Peixin Jiao, Northeast Agricultural University, ChinaReviewed by:
Zhangping Yang, Yangzhou University, ChinaDongxiao Sun, China Agricultural University, China
Jiangjiang Zhu, Southwest Minzu University, China
Copyright © 2021 Jiang, Iqbal, Wang, Li, Fang, Yu and Zhao. This is an open-access article distributed under the terms of the Creative Commons Attribution License (CC BY). The use, distribution or reproduction in other forums is permitted, provided the original author(s) and the copyright owner(s) are credited and that the original publication in this journal is cited, in accordance with accepted academic practice. No use, distribution or reproduction is permitted which does not comply with these terms.
*Correspondence: Zhihui Zhao, emh6aGFvQGpsdS5lZHUuY24=; Haibin Yu, eXVoYkBnZG91LmVkdS5jbg==
†These authors have contributed equally to this work