Interaction Between Florfenicol and Doxycycline Involving Cytochrome P450 3A in Goats (Capra hricus)
- 1National Reference Laboratory of Veterinary Drug Residues (HZAU) and MAO Key Laboratory for Detection of Veterinary Drug Residues, Huazhong Agricultural University, Wuhan, China
- 2MOA Laboratory for Risk Assessment of Quality and Safety of Livestock and Poultry Products, Wuhan, China
- 3Department of Pharmacology and Toxicology, Faculty of Veterinary Medicine, Universidad Complutense de Madrid, Madrid, Spain
When two drugs are combined, drug-drug interactions (DDI) often occur. Metabolic DDI usually occur due to inhibition of the metabolism of one drug by the other. This leads to an increase in the plasma concentration of the drug whose metabolism is inhibited. The objective of this research study was to verify the DDI risk of two antibacterial, florfenicol (FF) and doxycycline (DOX) due to metabolism. Because food containing residues of any pharmacologically active substance could potentially constitute a public health hazard, we selected a food producing animal, goat, goat liver microsomes and recombinant metabolic enzymes, for in vivo and in vitro metabolism studies. In vitro experiments showed that CYP3A was the key enzyme subfamily in FF metabolism, DOX slowed down FF metabolism and R440 was possibly the key amino acid in the metabolic interaction between FF and DOX. In vivo studies in the goats showed that DOX inhibited up-regulation of CYP3A24 gene expression produced by FF; in liver and kidney, DOX slightly slowed down FF metabolism. Quantitative prediction of DDI risk suggest that when DOX is used in combination with FF in veterinary medicine, may result in a clinical significant increase of FF plasma and tissue concentrations, resulting a prevalence of harmful tissue residues of medicinal products in the food chain. Through our experimentation, when DOX is used in combination with FF, the withdrawal period of FF in the kidney was extended by 1 day. Otherwise, an appropriate withdrawal period (20 days) of FF was established for FF and DOX combined use to ensure that the animal can be safely slaughtered for food.
Introduction
Florfenicol (FF), 2-dichloro-N-{(1R,2S)-3-fluoro-1-hydroxy-1-4-(methylsulfonyl) phenyl] propan-2-yl} acetamide, is a synthetic, broad-spectrum, primarily bacteriostatic antibiotic, of choice for the treatment of pneumonia and associated respiratory infections in livestock (1, 2). It is indicated in goats for the treatment of respiratory infections caused by Mannheimia haemolytica, Pasteurella multocida, and Histophilus somni associated with pyrexia (3, 4). The total FF residue in the tissue is calculated as the sum of FF and florfenicol amine (FFA). According to the European Union Regulation (EU) (5), the maximum residue limits (MRLs) of FF in goats are as follows: muscle (200 μg/kg), liver (3,000 μg/kg) and kidney (300 μg/kg). The MRL represents one of several standard options for risk managers to limit the presence of unwanted substances.
One of appropriate and suitable methods that would increase the effectiveness of chemotherapy of bacterial infections is a rational use of a combination of antimicrobial agents. Combination of antimicrobial agents is often presented as one of the few remaining effective strategies for the treatment of clinical diseases for which standard treatments have become ineffective. When two or more drugs are combined, the combinational effect can be defined as synergism, no interaction, or antagonism. Doxycycline (DOX), α-6-deoxy-5-hydroxytetracycline, a “second-generation” tetracycline, is also a primarily bacteriostatic antibiotic indicated in gastrointestinal and respiratory tract infections (6, 7). The combined use of FF and DOX has a synergistic or additive effect, both are usually combined to improve their efficacy. A study was conducted to study in vitro (P. multocida isolates) synergism of FF with DOX. The results reveal that synergistic interactions were observed in 15% of the tested isolates for FF + DOX. Consideration of synergism plus fractional inhibitory concentration index produced higher overall percentages of FF + DOX (69%) combination (8).
However, when more than one drug is used concurrently in combination therapy, drug-drug interactions (DDI) may occur, especially if their metabolism involves overlapping mechanisms (9). Cytochrome P450 (CYP450) enzyme-based drug metabolism is a key factor in DDI (10). Existing studies have shown that FF metabolism in rabbits and chickens is affected by CYP3A, and when P450 enzyme substrates, inhibitors or inducers are added, the drugs may interact and cause adverse effects (11, 12). In addition, studies have shown that DOX can inhibit the metabolism of quinine to 3-OH quinine via CYP3A (13). That is, DOX is likely to have an inhibitory effect on CYP3A. However, the possibility of DDI between DOX and FF under the influence of CYP3A has not yet been investigated.
Studies on the pharmacokinetics of FF in goats are relatively extensive, but there are few studies on the detection of FF tissue residues and the recommended withdrawal period (14, 15). The “withdrawal period” means the minimum period between the last administration of a veterinary medicinal product to an animal and the production of foodstuffs from that animal which under normal conditions of use is necessary to ensure that such foodstuffs do not contain residues in quantities harmful to public health (16).
With the gradual expansion of meat goat herds, goat meat has become an increasingly important animal-derived food, and its tissue residues have also received widespread attention (17). In this study, in vitro and in vivo experiments were carried out in goats to evaluate the DDI produced when DOX and FF are combined.
Materials and Methods
Bacteria and Plasmid
Escherichia coli BL21 (DE3) and E. coli DH5α were purchased from Vazyme (Nanjing, China). Plasmid pET-28a was obtained from the National Reference Laboratory of Veterinary Drug Residues (HZAU), Wuhan, China.
Experimental Methods
Goat Liver Microsomes Experiments
Goat liver microsomes were purchased from PrimeTox Bio-medical Technology Co. LTD (Wuhan, China). The protein concentration was 20 mg/kg and the activity of the microsomes was appropriate. To determine the key metabolic enzymes of FF metabolism, we used six CYP450 inhibitors: ketoconazole (CYP3A4), diosmetin (CYP1A), quinidine (CYP2D6), fomepizole (CYP2E1), methoxsalen (CYP2A6), and sulfaphenazole (CYP2C9) were co-incubated with FF in goat liver microsomes. In order to study the effect of DOX on FF, we divided the experiment into a single group of florfenicol and a combined group of florfenicol and doxycycline. Both of these two combinations were incubated with goat liver microsomes. The production of FFA was determined by liquid chromatography tandem mass spectrometry (LC-MS/MS). Each reaction was performed in triplicate.
Cloning of the CYP3A24 Gene
According to the mRNA sequence of goat CYP3A24, specific primers (forward: 5′-cagcaaatgggtcgcggatccATGGAGCTAATCCCAAGCTTTTC-3′ and reverse: 5′-gtggtggtggtggtgctcgagGGCTCCACTTATGGTTCCATCTC-3′) were designed containing restriction enzyme sites BamH I and Xho I to amplify the coding sequence of CYP3A24. The goat CYP3A24 gene fragment was obtained by polymerase chain reaction (PCR) and ligated into the expression plasmid pET-28a. The ligated plasmid pET-28a-CYP3A24 was used to transformed E. coli DH5α. Isolated transformant was cultured and the recombinant plasmid was confirmed by sequencing.
Homology Modeling and Molecular Docking
Using the homology modeling phantom of the Sybyl-X2.0 software (Tripos, USA), the 3D structure of goat CYP3A24 was obtained based on the crystal structure of the human CYP3A4 protein (PDB ID: 4D7D). Sybyl-X2.0 was also used for molecular docking of the CYP3A24 protein with FF and DOX to obtain the key amino acids (AA) involved in the formation of hydrogen bonds between the protein and each drug (AA within 5Å of the active pocket are considered possible AA related to affinity) (18).
Site-Directed Mutagenesis
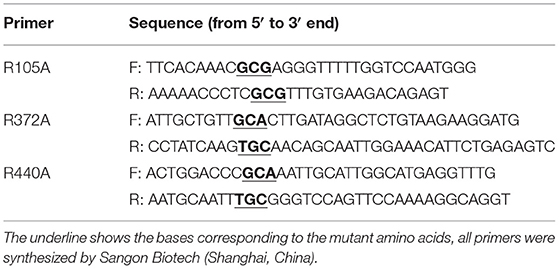
The steps for site-directed mutagenesis were as follows: First, the recombinant plasmid pET-28a-CYP3A24 was used as a template to obtain the required mutant plasmid PCR, and the primers used to introduce the mutation are shown in Table 1. Second, the mutant plasmid was digested with the restriction enzyme Dpn I and then used to transform E. coli DH5α cells (19). Third, the mutant plasmid was transformed into E. coli BL21 (DE3) for recombinant expression and then sequenced for confirmation.
The protein expression and purification process of bacteria was based on the published article of our laboratory (18). Then, the purified proteins were concentrated through concentrator tubes and confirmed by SDS-PAGE and Western blot. The protein concentration of each sample was determined by the method of Bradford (20).
The Protein Activity Verification of CYP3A24 and Its Mutants
Testosterone (TS) is a specific substrate of CYP3A, which can generate 6β-OHTS under the action of CYP3A (21). In order to study the protein activity of CYP3A24 and its mutants, we incubated each protein with TS. The experimental steps were as follows: protein (0.5 mg/mL) and NADPH (1 mmol/L) were added to PBS (pH 7.4) for 10 min at 37°C, then TS (Dr. Ehrenstorfer GmbH, Germany, 1 μmol/L) was added to start the reaction. The total reaction volume was 200 μL. At 60 min after drug addition, 200 μL of ice-cold acetonitrile was added to terminate the reaction. After centrifugation at 12,000 g/min for 15 min, the supernatant was filtered through a 0.22 μm membrane and analyzed by LC-MS/MS (AB SCIEX API5000, USA). For TS and 6β-OHTS, chromatographic separation occurred using a Thermo Scientific Hypersil Gold C18 column (150 × 2.1 mm, 5 μm particles), and analytes were detected on an API5000 mass analyser. Mobile phase A was 0.1% formic acid in water, and mobile phase B was methanol. The mass spectrometric parameters for TS and 6β-OHTS was shown in Table 2. The flow rate was 0.2 mL/min with a linear gradient under the following conditions: 0–0.10 min 5–85% B, 0.10–4.10 min 85% B, 4.10–8.00 min 85–5% B. The injection volume was set to 10 μL. The limit of quantitation (LOQ) of the analysis was 0.1 μmol/L, and the limit of detection (LOD) of the analysis was 0.02 μmol/L. All inter-assay coefficients of variation were within 8.6%, the intra-assay coefficients of variation were within 12.4%, and the recovery rates were between 84.5 and 115.4%. After activity verification, CYP3A24 and its mutants were co-incubated with FF and DOX, and the key amino acid residues for metabolism of FF and DOX were studied by the determination of FFA production.
Animal Experimental Design
In this study, a total of 54 Boaer-cross goats (Capra hircus) of both sexes, about 8 months old, were selected, weighing 28–36 kg. During the 1st week of acclimatization, all animals were raised in the usual way, with free access to feed and water. The experiment was conducted in accordance with the Guidelines for the Care and Use of Laboratory Animals issued by HZAU and approved by the Ethics Committee of Veterinary College of HZAU.
Throughout the experiment, all goats had ad libitum access to feed and water without antibiotics. The goats were divided into three groups, namely the control group (6 animals), the single group (24 animals), and the combined group (24 animals). The control group was fed without medication. In the single group, FF (Zhonglongshenli Animal Pharmaceutical Co., Ltd. Hefei, China, specification: 10 mL: 1 g) was injected into the neck muscles at 48 h intervals, twice in total. In the combined group, FF was injected into the neck muscles at 48 h intervals, twice in total, and DOX-hyclate (Zhonglongshenli Animal Pharmaceutical Co., Ltd. Hefei, China, specification: 10 mL: 1 g) was injected into the neck muscles, once a day for 3 days. The volume of the treatment solution was calculated individually for each goat to provide a dose equivalent to 20 mg FF/kg bw and 10 mg DOX/kg bw.
The control group was euthanized by use of ketamine hydrochloride (Fujian Gutian Pharmaceutical Co. Ltd., China: 10–15 mg/kg bw) and xilazine hydrochloride (Shengda Animal Medicine Co. Ltd., China: 2 mg/kg bw) for anesthesia followed by euthanasia with T61 (Bayer Animal Health GmbH, Germany: 4–6 mg/50 kg bw) and tissue samples (liver, kidney and muscle) were collected and were used to the validation of the analytical method for the compounds FF and FFA.
Goats of the single group (treated with FF) and goats of the combined group (treated with FF and DOX) were euthanized as previously described at 0.5 (n = 4), 1 (n = 4), 3 (n = 4), 7 (n = 4), 14 (n = 4), and 21 days (n = 4) after the last dose of 20 mg FF/kg bw (single group) and after the last dose of 20 mg FF/kg bw plus 10 mg DOX/kg bw (combined group). Goats were immediately exsanguinated, and tissue specimens of liver, kidney and muscle were collected separately. Each of the tissue specimens was carefully weighed and stored frozen at −20°C until assayed for concentrations of FF and FFA.
Gene Expression of CYP3A24 in Goats
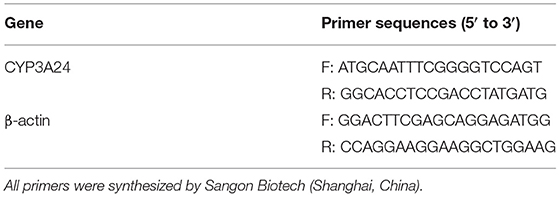
Real-time quantitative polymerase chain reaction (qPCR) was used to detect the expression of CYP3A24 in treated goats. Total RNA was extracted from goat liver by using the Trizol method. The concentration and purity of RNA was detected by Q3000 (Thermo, USA). The extracted RNA was reverse transcribed into cDNA. Goat-specific primers have shown as Table 3. The reaction procedure is: stage 1, 95°C for 30 s; stage 2, 40 cycles at 95°C for 3 s, 60°C for 10 s and 72°C for 20 s; stage 3, melt phase. The data were analyzed by the 2ΔΔCt method.
Sample Pre-treatment and Residue Detection
The method of FF and FFA pre-processing in the target tissues was as follows: Tissue samples weighing 1.00 ± 0.01 g were placed in a 10 mL centrifuge tube, then 5 mL 2% ammoniated ethyl acetate was added, and the tube was vortexed, sonicated and centrifuged. The above steps were repeated, and the supernatants were pooled and dried under a stream of nitrogen. The residue was reconstituted in 5% acetic acid in water, vortexed and passed through an MCX solid-phase extraction column (the order of the column was methanol, water, sample, 5% acetic acid water and 8% ammoniated ethyl acetate), then the eluate was dried under nitrogen, re-dissolved in 2 mL of degreased n-hexane, passed through a 0.22 μm filter membrane and subjected to LC-MS/MS (AB SCIEX API5000, USA) analysis.
For FF and FFA, chromatographic separation was performed using a Thermo Scientific Hypersil Gold C18 column (150 × 2.1 mm, 5 μm particles). Mobile phase A was 0.1% formic acid in water, and mobile phase B was acetonitrile. The mass spectrometric parameters for FF and FFA was shown in Table 4. The flow rate was 0.3 mL/min with a linear gradient under the following conditions: 0–1 min 10% B, 1–5 min 10–70% B, 5–6 min 70% B, 6–6.1 min 70–10% B, and 6.10–9.00 min 10% B. All calibration curves exhibited a correlation co-efficient (r) exceeding 0.99 across the concentration range. All inter-assay coefficients of variation in each tissue were within 9.93%, the intra-assay coefficients of variation in each tissue were within 11.08%, and the recovery rates in each tissue were between 70.62 and 113.55%. The LC-MS/MS results of FF and FFA standard products showed that the method had good specificity. For FF and FFA, the LOQ of the analysis was 10 μg/kg, and the LOD of the analysis was 2 μg/kg. The peak times of FFA and FF were 1.80 and 6.05, respectively (Figure 1).
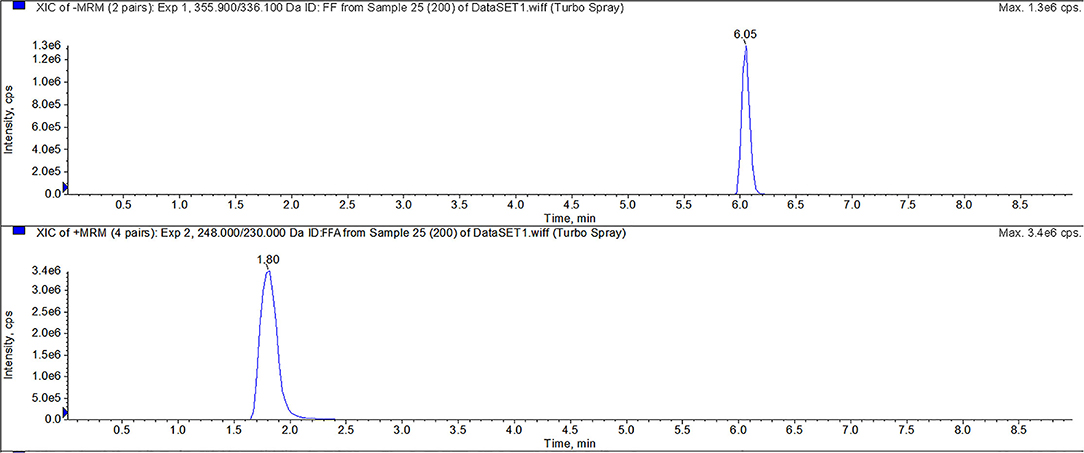
Figure 1. LC-MS/MS method for detecting FF, and FFA. The peak times of FFA and FF were 1.80 and 6.05 min, respectively.
Analysis of Experimental Data
Significance analysis between different groups using one-way ANOVA with SPSS Statistics, version 18.0 (SPSS Inc., Chicago, IL). 0.01 < P < 0.05 indicates a significant difference, marked with *; P < 0.01 indicates a very significant difference, marked with **.
The withdrawal period was estimated by linear regression analysis of log-transformed tissue concentrations and was determined at the time when the 95% upper one-side tolerance limit was below the MRL with 95% confidence (22).
Results
CYP3A24 May Be the Main Metabolic Enzyme of FF in Breed Goat Liver Microsomes
The influence of CYP450-specific inhibitors on the production of FFA is shown in Figure 2A. Compared with the inhibitor-free group (control group), the production of FFA decreased at all times after the addition of CYP450 inhibitors. The inhibition percentage of FFA production was as follows: at 0.5 h of incubation, the order was CYP3A4 (43.66%) > CYP2E1 (31.20%) > CYP2D6 (31.19%) > CYP1A (27.13%) > CYP2C9 (23.01%) > CYP2A6 (22.28%) inhibitors. After 1 h of incubation, the order of influence on FF metabolism was: CYP3A4 (65.94%) > CYP2A6 (62.02%) > CYP1A (59.13%) > CYP2D6 (56.90%) > CYP2C9 (56.16%) > CYP2E1 (53.71%) inhibitors. After 2 h of incubation, the order of influence on FF metabolism was: CYP2C9 (71.70%) > CYP3A4 (68.73%) > CYP1A (67.95%) > CYP2A6 (66.44%) > CYP2E (66.06%) > CYP2D6 (64.62%) inhibitors. In general, the result showed that CYP3A is the most critical enzyme in FF metabolism.

Figure 2. The influence of specific inhibitors of CYP450 [ketoconazole (CYP3A4), diosmetin (CYP1A), quinidine (CYP2D6), fomepizole (CYP2E1), methoxsalen (CYP2A6) and sulfaphenazole (CYP2C9)] on the generation of FFA (A). The effect of DOX on the metabolism of FF in goat liver microsomes (B). (A) The horizontal axis represents the incubation time, and the vertical axis represents the FFA production in the inhibitor group to that in the control group. (B) The horizontal axis represents the incubation time of the drug and goat liver microsomes, and the vertical axis represents the amount of FFA produced. The results were expressed as mean ± standard deviation (error bars) and repeated three times of each reaction. P < 0.05 (*) was considered to be statistically significant. P < 0.01 (**) was considered a significant difference.
In Breed Goat Liver Microsomes, DOX Slows Down FF Metabolism
The result is represented in Figure 2B. After 0.5 and 1 h incubations, there was no significant difference in the amount of FFA produced between the single group (FF) and the combined group (FF + DOX). After 2 and 4 h incubations, the production of FFA in the single group was significantly higher (41.4 and 46.5%, respectively), than that of the combined group. It is speculated that FF and DOX interact in liver microsomes, slowing down FF metabolism.
Homologous Modeling Molecular Docking
The protein structure of goat CYP3A24 was modeled using CYP3A4 as a template, which is displayed by the visualization software Pymol, as shown in Figure 3A. In order to better explore the mechanism by which DOX affects FF metabolism, FF and DOX were molecularly docked with CYP3A24, and the docking results are shown in Figures 3B,C. For FF, three hydrogen bonds were formed between the CYP3A24 protein and FF in the active pocket. Among the hydrogen bonds forming AAs, one hydrogen bond was, respectively, formed with R105, R372, R440. The key amino acid residues in CYP3A24 that play a role in FF metabolism may be R105, R372, and R440. For DOX, four hydrogen bonds were formed between the CYP3A24 protein and DOX in the active pocket. Among the hydrogen bonds forming AAs, in which one hydrogen bond was formed with T309, and three hydrogen bonds were formed with R440. The amino acid residues in CYP3A24 that interact with DOX may be T309 and R440. It is speculated that the interaction between FF and DOX may be related to R440.
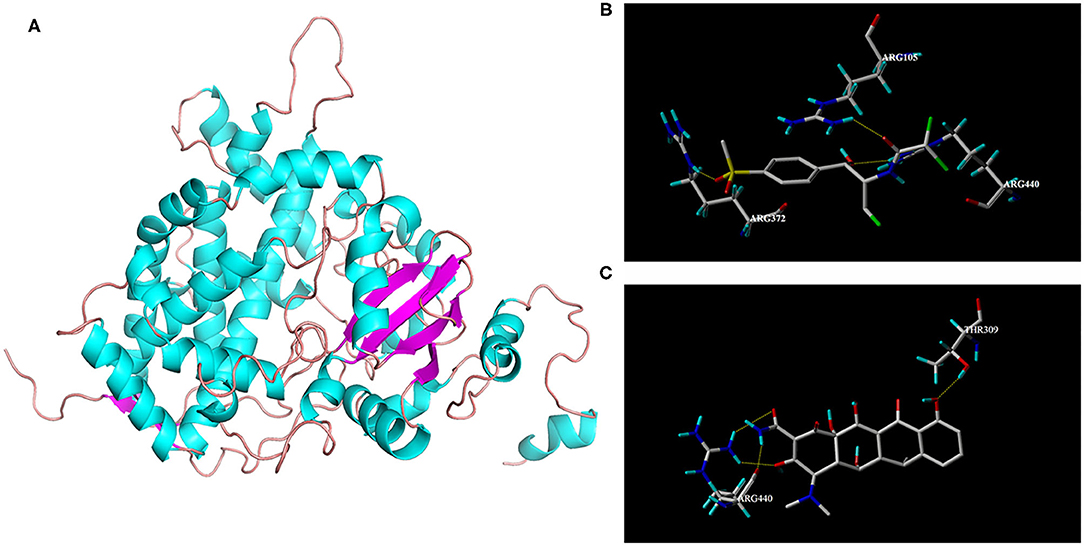
Figure 3. 3D structure of CYP3A24 (A) and interaction with FF (B) and DOX (C), respectively. (A) 3D structure of CYP3A24 was represented as a cartoon, with α-helices colored in cyan, β-stands in magenta, and loops in salmon. (B) Amino acid residues involved in the interaction of CYP3A24 with FF. (C) Amino acid residues involved in the interaction of CYP3A24 with DOX. The hydrogen bonds were represented as yellow dotted lines. The FF molecular was colored in gray.
Protein Expression of CYP3A24 and Its Mutants
The R (arginine) side chain is positively charged and forms ionic interactions with negatively charged groups. A (alanine) has a non-polar side chain, which is non-reactive and can eliminate the ionic interaction (23). For this reason, we mutated R to A. According to the website http://web.expasy.org/compute_pi/, the protein molecular weight of CYP3A24 is predicted to be about 58 kDa. As shown in Figure 4, the results of SDS-PAGE and Western blot show that the molecular weight of the protein is consistent with the prediction.
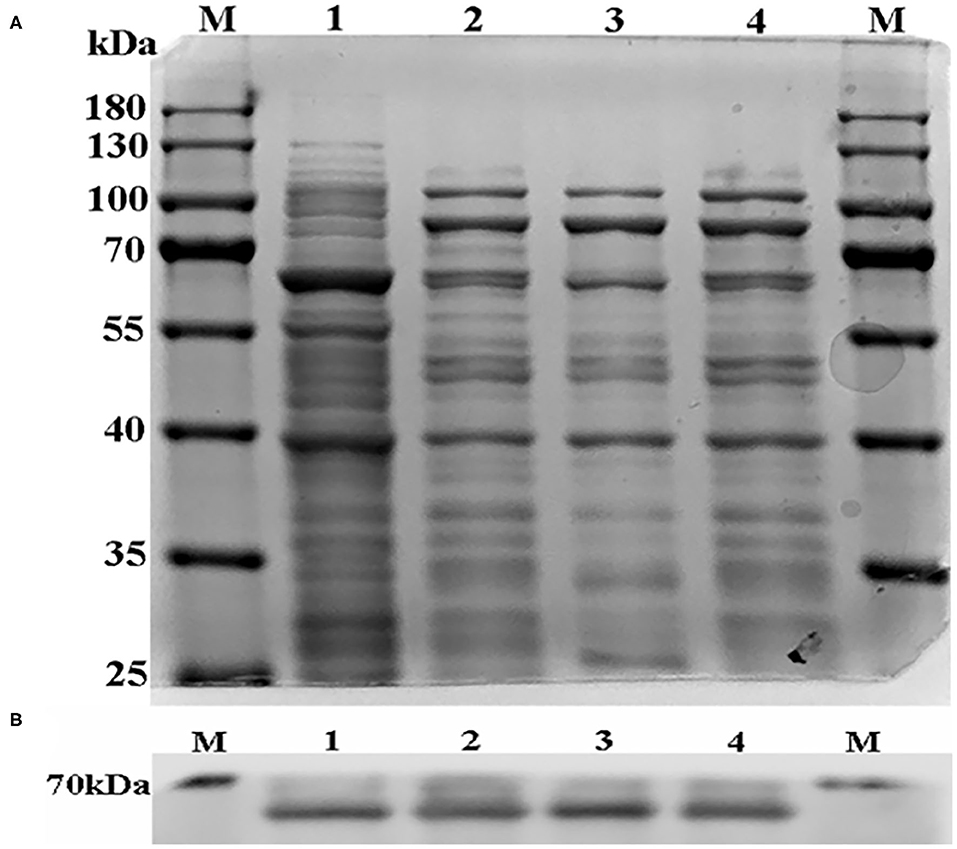
Figure 4. The SDS-PAGE result of CYP3A24 and its mutants (A). The Western blot result of CYP3A24 and its mutants (B). (A) The sample volume in each line was 20 μL, and no protein quantization was carried out. (B) The sample of each protein was 30 μ4g. Line M is protein marker, lines 1–4 are CYP3A24, R105A, R372A, R440A, respectively.
CYP3A24 Enzyme and Its a Mutant Protein Had Good Activity
TS can be metabolized into 6β-OHTS by CYP3A enzyme. The peak time of 6β-OHTS was about 4.95 min. The results show that CYP3A24, R105A, R372A, and R440A could metabolize TS, and all the proteins were active (Figure 5).
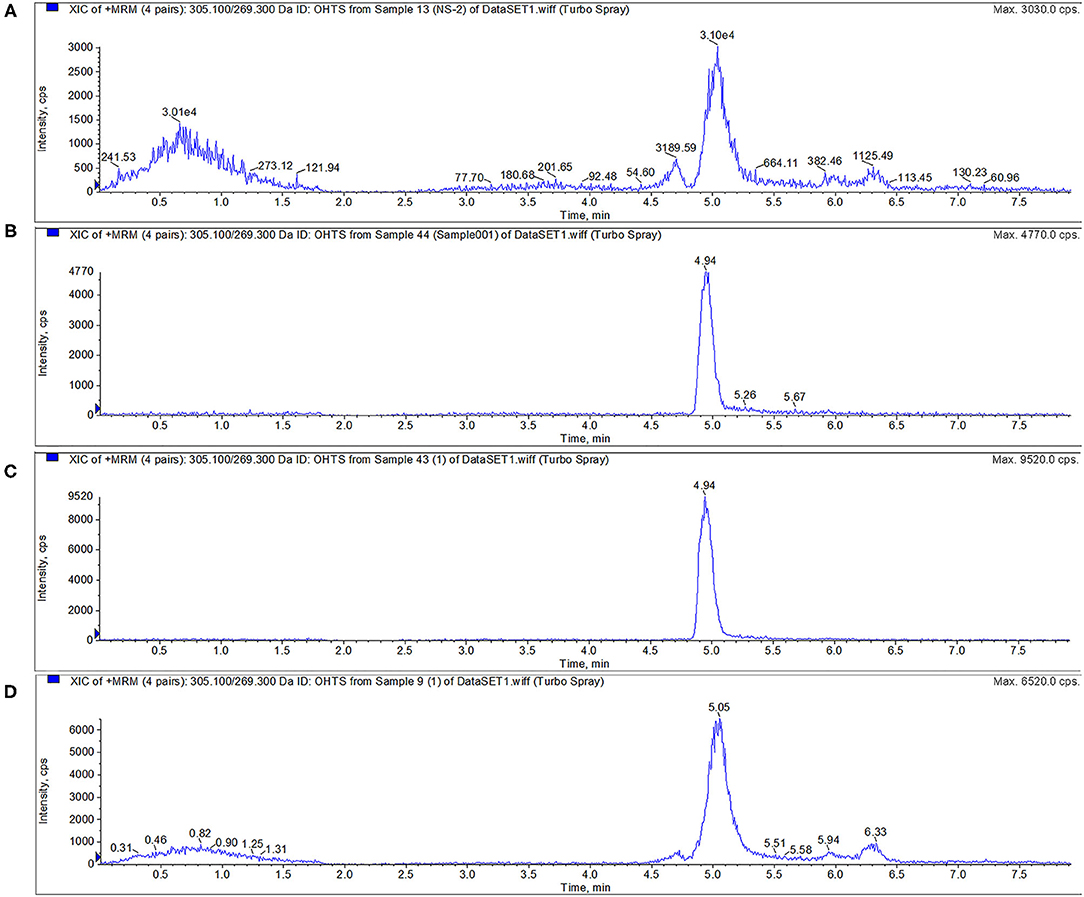
Figure 5. Activity verification of CYP3A24 and mutant protein. The results (A–D) show that CYP3A24, R105A, R372A and R440A could metabolize TS into 6β-OHTS. Note: (A–D) are the chromatograms of CYP3A24 (A), R105A (B), R372A (C), and R440A (D).
R440A May Be a Key Amino Acid Through Which DOX Affects the FF Metabolism
According to Figure 6 when incubated with CYP3A24, the addition of DOX reduced the production of FFA in 17.8%, that is, the metabolism of FF was inhibited. The key amino acid sequence that reduced FF metabolism was: R440A (65.8%) and R372A (32.9%). R440A is a key amino acid for CYP3A24 enzyme to metabolize FF. Since R440A is the common site in the docking result of FF and DOX, it is speculated that the reason why DOX inhibits FF metabolism is that DOX competes with R440 for the CYP3A24 enzyme.
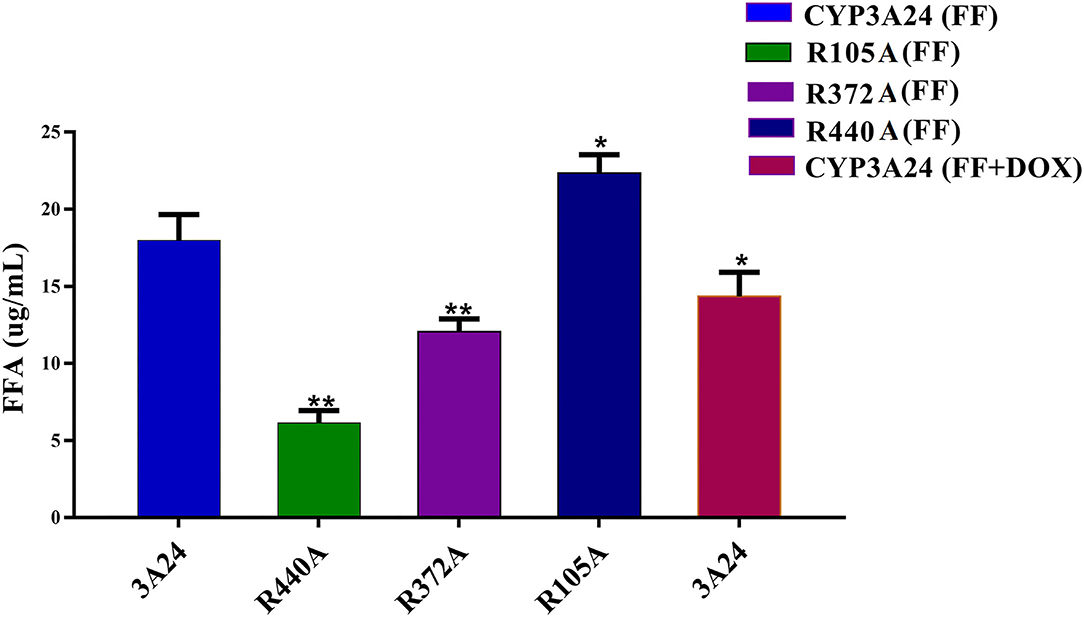
Figure 6. Incubation of CYP3A24 with FF and DOX and its mutants (R105A, R372A, and R440A). The vertical axis represents FFA production. The data were expressed as mean ± standard deviation (error bars) (n = 3). **(P < 0.01) and *(P < 0.05) indicate statistically significant difference between the CYP3A24 and each mutant.
The Effect of DOX and FF on CYP3A24 Gene Expression in Goats
The concentration and purity of RNA extracted from goat liver were good. The A260/280 ratio of all RNA extracted was between 1.8 and 2.0, and the concentration was about 2,000 ng/μL. The effect of single administration of FF and co-administration of FF and DOX on the expression level of the CYP3A24 gene in goats is shown in Figure 7.
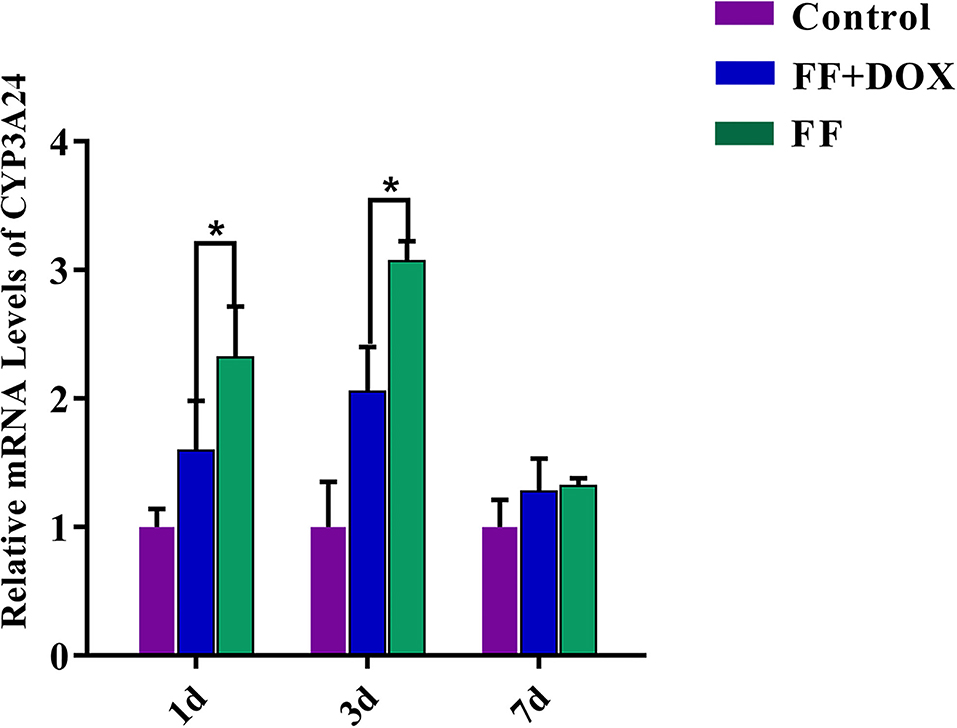
Figure 7. CYP3A24 gene expression in goats. The data were expressed as mean ± standard deviation (error bars) (n = 3). *(P < 0.05) indicates statistically significant difference between the combined group (FF + DOX) and the single group (FF).
When FF was stopped for 1 and 3 days, the gene expression level of CYP3A24 enzyme was up-regulated in the single groups, about 2.3 and 3-fold, respectively compared to control.
When FF + DOX was stopped for 1 and 3 days, the up-regulation of CYP3A24 enzyme gene expression in the combined groups decreased significantly compared to single groups, about 0.7 and 1-fold, respectively. This indicates that DOX can inhibit up-regulation of the CYP3A24 gene.
Tissue Residue Depletion
Residues of FF and its metabolite FFA in tissue specimens after intramuscular administration of FF (20 mg/kg bw, at 48 h intervals, twice in total) in single group and after FF (20 mg/kg bw, at 48 h intervals, twice in total) plus DOX (10 mg/kg bw, once a day for 3 days) in combined group, were determined. The tissue concentration-time profiles are presented in Table 5 for liver, kidney, and muscle from single and combined groups at 0.5, 1, 3, 7, 14, and 21 days after administration of the final dose of FF (single group) and a after administration of the final dose of FF plus DOX (combined group).
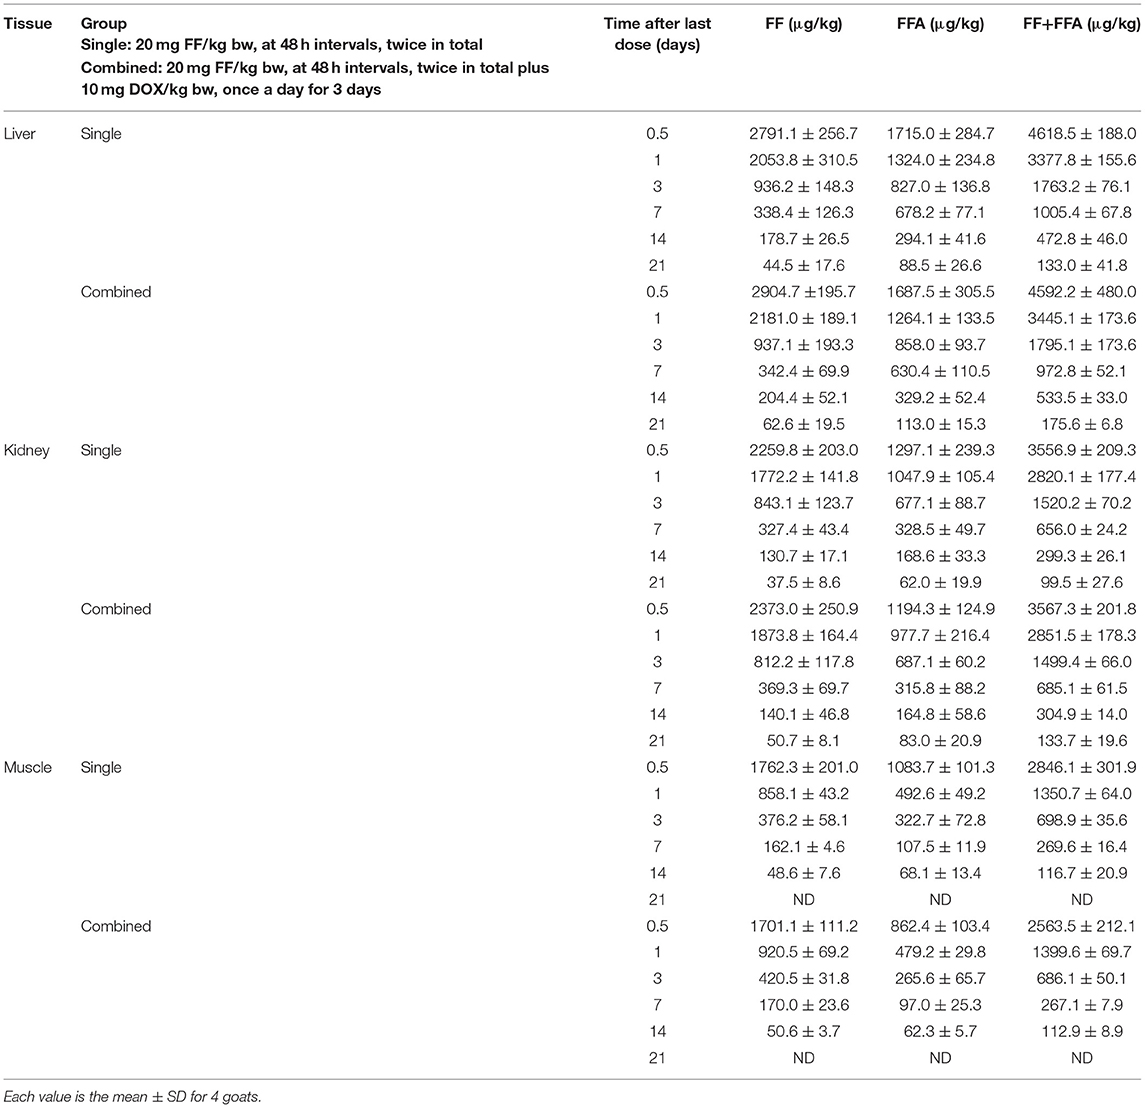
Table 5. Tissue concentrations of FF and FFA for goats treated intramuscularly with FF (single group) and for goats treated with FF plus DOX (combined group).
Withdrawal Period Estimation
Linear regression analysis of the logarithmic transformed data can be considered for the calculation of the withdrawal periods. Using this approach, the withdrawal period was determined as the period when the one-sided, 95% upper tolerance limit of the regression line with 95% confidence level was below the MRL (22). Using this approach and considering the marker residue for the MRL (the sum of FF and its metabolite FFA) recommended by de EU, the withdrawal period for FF was calculated for single group and combined group in kidney (tissue which showed slower residue depletion). After intramuscular administration of FF (20 mg/kg bw, at 48 h intervals, twice in total) in single group and after FF (20 mg/kg bw, at 48 h intervals, twice in total) plus DOX (10 mg/kg bw, once a day for 3 days) in combined group, the withdrawal periods were 17.18 days and 18.61 days, respectively (Figures 8A,B). When DOX is used in combination with FF, the withdrawal period of FF in the kidney was extended by 1 day.
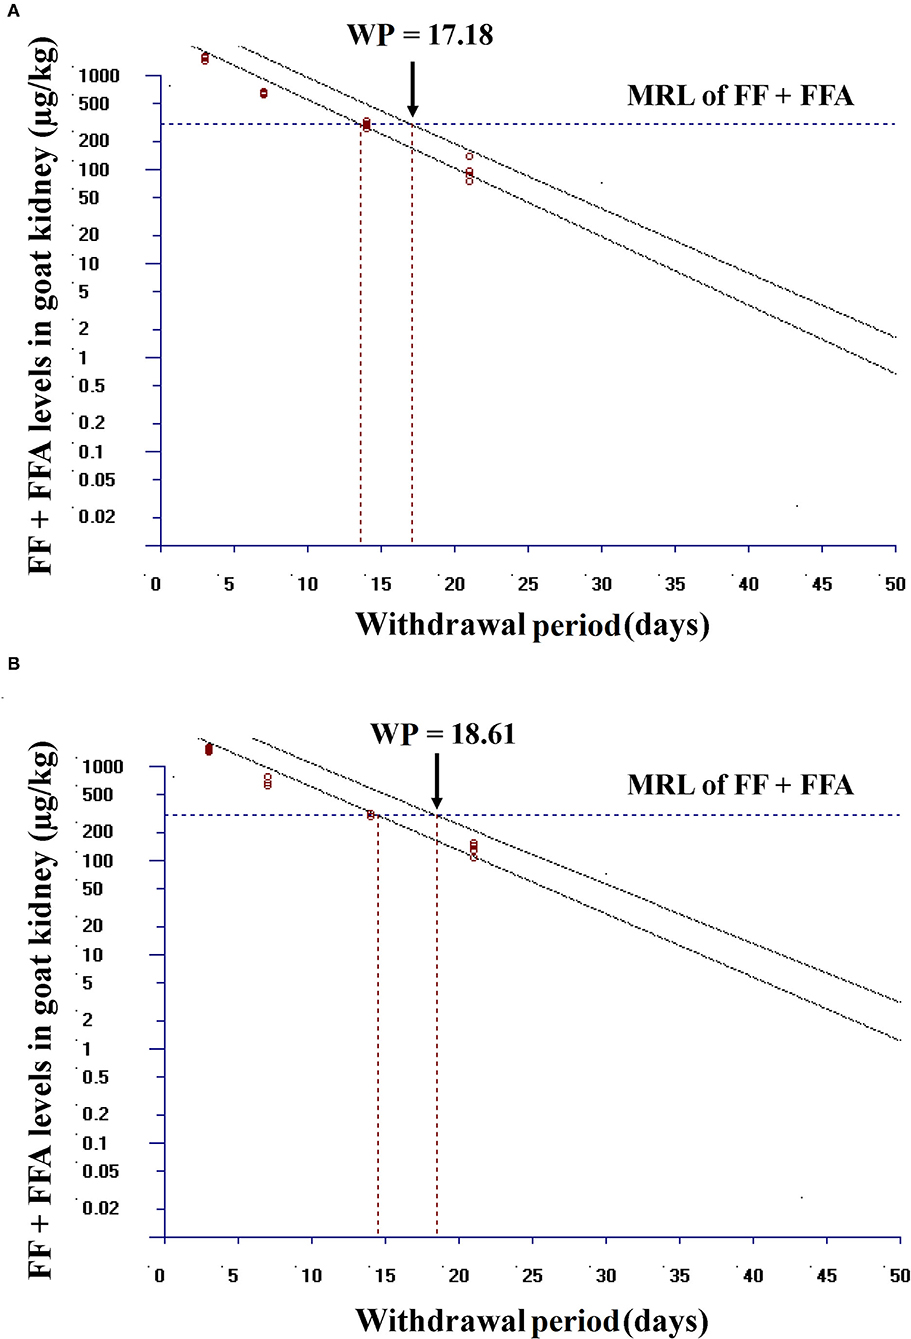
Figure 8. Plot of the withdrawal period calculation for FF in goat kidney at the time when the one-sided 95% upper tolerance limit is below the EU MRL for FF (300 μg/kg). (A) In single group, after intramuscular administration of FF (20 mg FF/kg bw, at 48 h intervals, twice in total) and (B) in combined group, after intramuscular administration of FF (20 mg FF/kg bw, at 48 h intervals, twice in total) plus DOX (10 mg DOX/kg bw, once a day for 3 days). Residue marker is the sum of florfenicol (FF) and its metabolite florfenicol-amine (FFA).
Discussion
In veterinary medicine, drugs are often used in combination; improving efficacy is the primary factor in drug combination. However, DDI often produces some adverse effects (24). Metabolism is a key factor affecting DDI, and CYP450 enzymes are a key factor affecting metabolism (25). The inhibition of CYP enzymes may cause the accumulation of drugs in the body, resulting in toxicity or prolonging the drug withdrawal period (26). Therefore, it is necessary to study combinations of drugs from the perspective of enzymes. FF and DOX are often used together in clinical treatment. Previous studies have shown that the metabolism of FF in rabbits and chickens is affected by CYP3A (11, 12), and DOX has the effect of inhibiting CYP3A (13). Therefore, this research studies the combined use of DOX and FF from the perspective of liver microsomes and recombinant metabolic enzymes. Moreover, in vivo experiments were also conducted to verify the effects of the two antibacterial on metabolism, and to recommend a withdrawal period, so as to better guide clinical medication.
In vitro goat liver microsome experiments showed that CYP3A is the most important metabolic enzyme that affects the metabolism of FF (Figure 2A). This is consistent with studies in rabbit and chicken (11, 12). The addition of DOX will slow down the metabolism of FF (Figure 2B). If the functionally homologous proteins have sequence homology >30%, then a known protein crystal structure can be used as a template to establish a highly accurate target protein structure model. The sequence homology between goat CYP3A24 and human CYP3A4 enzymes reached 76.5%. So we used human CYP3A4 as a template for homology modeling and obtained CYP3A24 (Figure 3A). Then we have molecularly docked FF and DOX with CYP3A24 enzyme and screened out the possible key amino acids for FF metabolism as R105, R372, and R440 (Figure 3B), and T309 and R440 as possible key amino acids for DOX metabolism (Figure 3C). Site-directed mutagenesis is often used to study the impact of specific sites on the overall structure (27). Therefore, in this experiment, the three amino acids (R105, R372, and R440) were mutated to R105A, R372A, and R440A. The mutated protein was incubated with the drug to determine that R440A may be the key amino acid through which DOX affects FF (Figure 6). Combined with previous research on the interaction between R440 and CYP2D6, R440 is very likely to be the main site of CYP2D6 binding to reductase (28). This research suggests that R440 plays an important role in the electron transfer and binding between CYP3A24 and its reductase. When it is destroyed, the metabolism of FF and DOX will be affected; when FF is used in combination with DOX, the DOX will compete for R440 on the CYP3A24 enzyme, which will slow down FF metabolism.
Notably, the effect of DOX on FF metabolism was significant. In vivo experiments have shown that DOX can inhibit the up-regulation of CYP3A24 gene expression caused by FF (Figure 7). Residue depletion studies in goats showed that the addition of DOX would slow down the elimination half-life of FF and FFA (Table 3). EMA withdrawal-period calculation-program WT1.4 software (22) was used to analyse the withdrawal period of FF from goat target tissue concentrations of FF and FFA (Figure 8). Notably, the effect of DOX on FF metabolism was significant. The combination of FF and DOX caused a prolonged withdrawal period of FF in the kidney; the withdrawal period of FF in the kidney was extended by 1 day. In addition, the kidney toxicity of FF has been confirmed in animals. FF can up-regulate the expression of pro-apoptotic factors and accelerate the abnormal apoptosis of renal cells (29). Therefore, whether the effect of DOX on FF metabolism in the kidney will lead to the enhancement of this toxic effect remains to be studied.
Data Availability Statement
The raw data supporting the conclusions of this article will be made available by the authors, without undue reservation.
Ethics Statement
The animal study was reviewed and approved by Ethics Committee of Veterinary College of Huazhong Agricultural University (HZAU).
Author Contributions
XW and YY: software, validation, formal analysis, investigation, data curation, visualization, and writing—original draft. M-AM, MM, BL-T, M-RM-L, and IA: software, validation, formal analysis, investigation, data curation, visualization, writing—original draft, and writing—review and editing. XW and AA: conceptualization, methodology, resources, investigation, writing—original draft, writing—review and editing, supervision, and project administration. All authors contributed to the article and approved the submitted version.
Funding
This work was supported by the National Key Research and Development Program of China (2018YFC1603005), the Fundamental Research Funds for the Central Universities (2662020DKPY020), and Project Ref. PID 2020-115979RR-C33 from the Ministerio de Ciencia e Innovación, Spain.
Conflict of Interest
The authors declare that the research was conducted in the absence of any commercial or financial relationships that could be construed as a potential conflict of interest.
Publisher's Note
All claims expressed in this article are solely those of the authors and do not necessarily represent those of their affiliated organizations, or those of the publisher, the editors and the reviewers. Any product that may be evaluated in this article, or claim that may be made by its manufacturer, is not guaranteed or endorsed by the publisher.
References
1. Anadón A, Martínez MA, Martínez M, Ríos A, Caballero V, Ares I, et al. Plasma and tissue depletion of florfenicol and florfenicol-amine in chickens. J Agric Food Chem. (2008) 56:11049–56. doi: 10.1021/jf802138y
2. Berge ACB, Sischo WM, Craigmill AL. Antimicrobial susceptibility patterns of respiratory tract pathogens from sheep and goats. J Am Vet Med Assoc. (2006) 229:1279–81. doi: 10.2460/javma.229.8.1279
3. Shah JM, Qureshi TA, Shah T, Shah QA, Arain MA, Bhutto ZA, et al. Impact of therapeutic and high doses of florfenicol on kidney and liver functional indicators in goat. Vet World. (2016) 9:1135–40. doi: 10.14202/vetworld.2016.1135-1140
4. Wei CF, Shien JH, Chang SK, Chou CC. Florfenicol as a modulator enhancing antimicrobial activity: example using combination with thiamphenicol against Pasteurella multocida. Front Microbiol. (2016) 7:389. doi: 10.3389/fmicb.2016.00389
5. EU (European Union). Commission Regulation No 37/2010 of 22 December 2009 on pharmacologically active substances and their classification regarding maximum residue limits in foodstuffs of animal origin. Official J Eur Union. L 15/1. (2010). Available online at: https://ec.europa.eu/health/sites/default/files/files/eudralex/vol-5/reg_2010_37/reg_2010_37_en.pdf
6. Anadón A, Martínez-Larrañaga MR, Diaz MJ, Bringas P, Fernandez MC, Fernandez-Cruz ML, et al. Pharmacokinetics of doxycycline in broiler chickens. Avian Pathol. (1994) 23:79–90. doi: 10.1080/03079459408418976
7. Anadón A, Martínez-Larrañaga MA. Residues of antimicrobial drugs and feed additives in animal products: regulatory aspects. Livest Prod Sci. (1999) 59:183–98. doi: 10.1016/S0301-6226(99)00026-3
8. Rattanapanadda P, Kuo HC, Vickroy TW, Sung CH, Rairat T, Lin TL, et al. In vitro and in vivo synergistic effects of florfenicol and thiamphenicol in combination against swine Actinobacillus pleuropneumoniae and Pasteurella multocida. Front Microbiol. (2019) 10:2430. doi: 10.3389/fmicb.2019.02430
9. Karbownik A, Miedziaszczyk M, Grabowski T, Stanisławiak-Rudowicz J, Jazwiec R, Wolc A, et al. In vivo assessment of potential for UGT-inhibition-based drug-drug interaction between sorafenib and tapentadol. Biomed Pharmacother. (2020) 130:110530. doi: 10.1016/j.biopha.2020.110530
10. Shoombuatong W, Prathipati P, Prachayasittikul V, Schaduangrat N, Malik AA, Pratiwi R, et al. Towards predicting the cytochrome P450 modulation: from QSAR to proteochemometric modeling. Curr Drug Metab. (2017) 18:540–55. doi: 10.2174/1389200218666170320121932
11. Liu N, Guo M, Mo F, Sun YH, Yuan Z, Cao LH, et al. Involvement of P-glycoprotein and cytochrome P450 3A in the metabolism of florfenicol of rabbits. J Vet Pharmacol Ther. (2012) 35:202–5. doi: 10.1111/j.1365-2885.2011.01310.x
12. Wang GY, Zheng HH, Zhang KY, Yang F, Kong T, Zhou B, et al. The roles of cytochrome P450 and P-glycoprotein in the pharmacokinetics of florfenicol in chickens. Iran J Vet Res. (2018) 19:9–14.
13. Zhao XJ, Ishizaki T. The in vitro hepatic metabolism of quinine in mice, rats and dogs: comparison with human liver microsomes. J Pharmacol Exp Ther. (1997) 283:1168–76.
14. Ali BH, Al-Qarawi AA, Hashaad M. Comparative plasma pharmacokinetics and tolerance of florfenicol following intramuscular and intravenous administration to camels, sheep and goats. Vet Res Commun. (2003) 27:475–83. doi: 10.1023/A:1025741724701
15. Naeem MA, Karrow NA, Ashraf MM, Wu J. Kinetic interaction between albendazole and florfenicol in healthy adult female Beetal goats. J Biol Regul Homeost Agents. (2019) 33:835–41.
16. EU (European Union). Regulation (EU) 2019/6 of the European Parliament and of the Council of 11 December 2018 on Veterinary Medicinal Products and Repealing Directive 2001/82/EC. L 4/43. (2019). Available online at: https://eur-lex.europa.eu/legal-content/EN/TXT/PDF/?uri=CELEX:32019R0006&from=es (accessed July 15, 2021).
17. Smith JS, Mochel JP, Borts DJ, Griffith RW. Effects of experimentally induced respiratory disease on the pharmacokinetics and tissue residues of tulathromycin in meat goats. J Vet Pharmacol Ther. (2019) 42:420–9. doi: 10.1111/jvp.12764
18. Ning J, Ahmed S, Cheng G, Chen T, Wang Y, Peng D, et al. Analysis of the stability and affinity of BlaR-CTD protein to β-lactam antibiotics based on docking and mutagenesis studies. J Biol Eng. (2019) 13:27. doi: 10.1186/s13036-019-0157-4
19. Silva D, Santos G, Barroca M, Collins T. Inverse PCR for point mutation introduction. Methods Mol Biol. (2017) 1620:87–100. doi: 10.1007/978-1-4939-7060-5_5
20. Shahrisa A, Nikkhah M, Shirzad H, Behzadi R, Sadeghizadeh M. Enhancing catecholase activity of a recombinant human tyrosinase through multiple strategies. Iran J Biotechnol. (2020) 18:e2310. doi: 10.30498/ijb.2020.137293.2310
21. Mustapić DS, Debeljak Ž, Maleš Ž, Bojic M. The inhibitory effect of flavonoid aglycones on the metabolic activity of CYP3A4 enzyme. Molecules. (2018) 23:2553. doi: 10.3390/molecules23102553
22. EMA (European Medicines Agency). Guideline on Determination of Withdrawal Periods for Edible Tissues. EMA/CVMP/SWP/735325/2012, Committee for Medicinal Products for Veterinary Use (CVMP). Canary Wharf, London, U.K. (2018). p. 1–36. Available online at: https://www.ema.europa.eu/en/documents/scientific-guideline/guideline-determination-withdrawal-periods-edible-tissues-revision-1_en.pdf
23. Cheng G, Liu C, Wang X, Ma H, Pan Y, Huang L, et al. Structure-function analysis of porcine cytochrome P450 3A29 in the hydroxylation of T-2 toxin as revealed by docking and mutagenesis studies. PLoS ONE. (2014) 9:e106769. doi: 10.1371/journal.pone.0106769
24. Patrick MT, Bardhi R, Raja K, He K, Tsoi LC. Advancement in predicting interactions between drugs used to treat psoriasis and its comorbidities by integrating molecular and clinical resources. J Am Med Inform Assoc. (2021) 28:1159–67. doi: 10.1093/jamia/ocaa335
25. Lee J, Yang Y, Zhang X, Fan J, Grimstein M, Zhu H, et al. Usage of in vitro metabolism data for drug-drug interaction in physiologically based pharmacokinetic analysis submissions to the US food and drug administration. J Clin Pharmacol. (2021) 61:782–8. doi: 10.1002/jcph.1819
26. Hurtado FK, de Braud F, De Castro Carpeño J, de Migel Luken MJ, Wang D, Scott J, et al. Effect of ceritinib on the pharmacokinetics of coadministered CYP3A and 2C9 substrates: a phase I, multicenter, drug-drug interaction study in patients with ALK + advanced tumors. Cancer Chemother Pharmacol. (2021) 87:475–86. doi: 10.1007/s00280-020-04180-3
27. Wu J, Zhu S, Wu Y, Jiang T, Wang L, Jiang J, et al. Multiple CH/π interactions maintain the binding of aflatoxin B1 in the active cavity of human cytochrome P450 1A2. Toxins. (2019) 11:158. doi: 10.3390/toxins11030158
28. Allorge D, Bréant D, Harlow J, Chowdry J, Lo-Guidice JM, Chevalier D, et al. Functional analysis of CYP2D631 variant: homology modeling suggests possible disruption of redox partner interaction by Arg440His substitution. Proteins. (2005) 59:339–46. doi: 10.1002/prot.20399
Keywords: florfenicol, florfenicol amine, doxycycline, metabolism, interaction, CYP3A, residue depletion study
Citation: Wang X, Yang Y, Martínez M-A, Martínez M, Lopez-Torres B, Martínez-Larrañaga M-R, Wang X, Anadón A and Ares I (2021) Interaction Between Florfenicol and Doxycycline Involving Cytochrome P450 3A in Goats (Capra hricus). Front. Vet. Sci. 8:759716. doi: 10.3389/fvets.2021.759716
Received: 16 August 2021; Accepted: 21 September 2021;
Published: 18 October 2021.
Edited by:
Valentina Meucci, University of Pisa, ItalyReviewed by:
Benito Soto-Blanco, Federal University of Minas Gerais, BrazilWilson Kiiza Rumbeiha, University of California, Davis, United States
Copyright © 2021 Wang, Yang, Martínez, Martínez, Lopez-Torres, Martínez-Larrañaga, Wang, Anadón and Ares. This is an open-access article distributed under the terms of the Creative Commons Attribution License (CC BY). The use, distribution or reproduction in other forums is permitted, provided the original author(s) and the copyright owner(s) are credited and that the original publication in this journal is cited, in accordance with accepted academic practice. No use, distribution or reproduction is permitted which does not comply with these terms.
*Correspondence: Xu Wang, wangxu@mail.hzau.edu.cn; Arturo Anadón, anadon@vet.ucm.es orcid.org/0000-0002-0580-7204
 Xiaojing Wang
 Yaqin Yang2
  Marta Martínez
 Xu Wang
 Arturo Anadón
 Irma Ares