 Amanda J. Gibson1†
 Ian J. Passmore2
 Valwynne Faulkner1†
 Dong Xia1
 Irene Nobeli3
 Jennifer Stiens3Sam Willcocks2
 Taane G. Clark2Ben Sobkowiak2
 Dirk Werling1Bernardo Villarreal-Ramos4†
 Brendan W. Wren2
 Sharon L. Kendall1*
- 1Centre for Emerging, Endemic and Exotic Diseases, Pathobiology and Population Sciences, Royal Veterinary College, Hatfield, United Kingdom
- 2Department of Infection Biology, London School of Hygiene and Tropical Medicine, London, United Kingdom
- 3Institute of Structural and Molecular Biology, Biological Sciences, Birkbeck, University of London, London, United Kingdom
- 4Animal and Plant Health Agency, Surrey, United Kingdom
Members of the Mycobacterium tuberculosis complex (MTBC) show distinct host adaptations, preferences and phenotypes despite being >99% identical at the nucleic acid level. Previous studies have explored gene expression changes between the members, however few studies have probed differences in gene essentiality. To better understand the functional impacts of the nucleic acid differences between Mycobacterium bovis and Mycobacterium tuberculosis, we used the Mycomar T7 phagemid delivery system to generate whole genome transposon libraries in laboratory strains of both species and compared the essentiality status of genes during growth under identical in vitro conditions. Libraries contained insertions in 54% of possible TA sites in M. bovis and 40% of those present in M. tuberculosis, achieving similar saturation levels to those previously reported for the MTBC. The distributions of essentiality across the functional categories were similar in both species. 527 genes were found to be essential in M. bovis whereas 477 genes were essential in M. tuberculosis and 370 essential genes were common in both species. CRISPRi was successfully utilised in both species to determine the impacts of silencing genes including wag31, a gene involved in peptidoglycan synthesis and Rv2182c/Mb2204c, a gene involved in glycerophospholipid metabolism. We observed species specific differences in the response to gene silencing, with the inhibition of expression of Mb2204c in M. bovis showing significantly less growth impact than silencing its orthologue (Rv2182c) in M. tuberculosis. Given that glycerophospholipid metabolism is a validated pathway for antimicrobials, our observations suggest that target vulnerability in the animal adapted lineages cannot be assumed to be the same as the human counterpart. This is of relevance for zoonotic tuberculosis as it implies that the development of antimicrobials targeting the human adapted lineage might not necessarily be effective against the animal adapted lineage. The generation of a transposon library and the first reported utilisation of CRISPRi in M. bovis will enable the use of these tools to further probe the genetic basis of survival under disease relevant conditions.
Introduction
Mycobacterium bovis and Mycobacterium tuberculosis are closely related members of the Mycobacterium tuberculosis complex (MTBC). Although both species are >99% identical at the nucleotide level each species shows distinct host tropisms. M. bovis, the animal adapted species, is the main causative agent of bovine tuberculosis in cattle (1) while M. tuberculosis is the main cause of human tuberculosis (TB) and is responsible for ~1.5 million deaths annually (1, 2). M. bovis exhibits a broader host range than M. tuberculosis and is also able to cause TB in humans through zoonotic transfer, representing a serious public health risk in countries without a control programme in domestic livestock (2, 3). The WHO recognises that zoonotic transfer of tuberculosis threatens the delivery of the end TB strategy, highlighting the importance of understanding the differences between the two species (3).
Many studies have explored the genotypic and phenotypic differences between M. tuberculosis and M. bovis to better understand host preference. Genome sequencing of the reference strains (H37Rv and AF2122/97) showed that the main genetic differences between these pathogens were several large-scale deletions, or regions of difference (RD), and over 2,000 single-nucleotide polymorphisms (SNPs) (4–7). More recently, studies that include clinically circulating strains have confirmed that all animal adapted lineages share deletions RD7, 8, 9, and 10 (8). Transcriptomic studies which have measured significant changes in gene expression between H37Rv and AF2122/97 have provided a functional insight into the impacts of some of these polymorphisms (9–11). For instance, a SNP in rskA (Mb0452c) an anti-sigma factor in M. bovis, prevents repression of sigK activity, leading to constitutively high levels of expression of mpb70 and mpb83, genes that encode key immunogenic antigens; MPB70 and MPB83 (12, 13). Recent studies have shown that MPB70 mediates multi-nucleated giant cell formation in M. bovis infected bovine macrophages, but not in M. bovis (or M. tuberculosis) infected human macrophages, providing insight into bacterial effectors of the species-specific response (14). Transcriptomic studies have also indicated a differential response to in vitro mimics of host stresses such as acid shock and highlight the impact of SNPs in the signalling and response regulons in two-component systems such as PhoPR and DosSRT (15–18).
Genome-wide transposon mutagenesis coupled with next-generation sequencing (TnSeq) has allowed genome wide predictions of gene essentiality in M. tuberculosis (19–24). These studies have provided information on the genetic requirements for in vitro growth under a number of conditions and also for growth in disease relevant models such as macrophages (20). Most of these studies performed in the MTBC have used strain H37Rv. More recently Tnseq of different clinical strains of M. tuberculosis has shown that there are strain specific differences in fitness associated with Tn insertions in certain genes. The implication of this observation is that different strains can show different antibiotic sensitivities as a result (25). To date, there has been a single reported Tnseq study performed in M. bovis (AF2122/97) which focused on intra-cellular genetic requirements (26).
A direct comparison of gene essentiality in M. bovis and M. tuberculosis has not been reported. In this study, we created dense transposon libraries in both M. bovis (AF2122/97) and M. tuberculosis (H37Rv) generated on the same medium to enable direct comparisons between the two related species. We identified that there are key differences in gene essentiality in M. bovis compared to M. tuberculosis. We used CRISPRi to directly demonstrate that silencing the expression of a gene annotated to be involved in glycerophospholipid metabolism has different impacts on growth in the two species. This has implications for target discovery programmes as it implies that inhibition of therapeutically relevant pathways may have different impacts in the different species. This is important in the context of zoonotic tuberculosis.
Materials and Methods
Bacterial Strains and Culture Methods
M. bovis AF2122/97 was maintained on modified Middlebrook 7H11 solid medium containing 0.5% lysed defibrinated sheep blood, 10% heat inactivated foetal bovine serum and 10% oleic acid-albumin-dextrose-catalase (OADC) (27). Liquid cultures of M. bovis were grown in Middlebrook 7H9 medium containing 75 mM sodium pyruvate, 0.05% Tween®80 and 10% albumin-dextrose-catalase (ADC). M. tuberculosis H37Rv and Mycobacterium smegmatis mc2155 were maintained on Middlebrook 7H11 solid medium supplemented with 0.5% glycerol and 10% OADC. Liquid cultures were grown in Middlebrook 7H9 medium supplemented with 0.2% glycerol, 0.05% Tween®80 and 10% ADC unless stated otherwise. MycomarT7 Phagemid was propagated on M. smegmatis mc2155 lawns grown on Middlebrook 7H10 solid medium supplemented with 0.5% glycerol and 10% OADC in a 0.6% agar overlay. The strains and plasmids used or made in this study are given in Table 1.
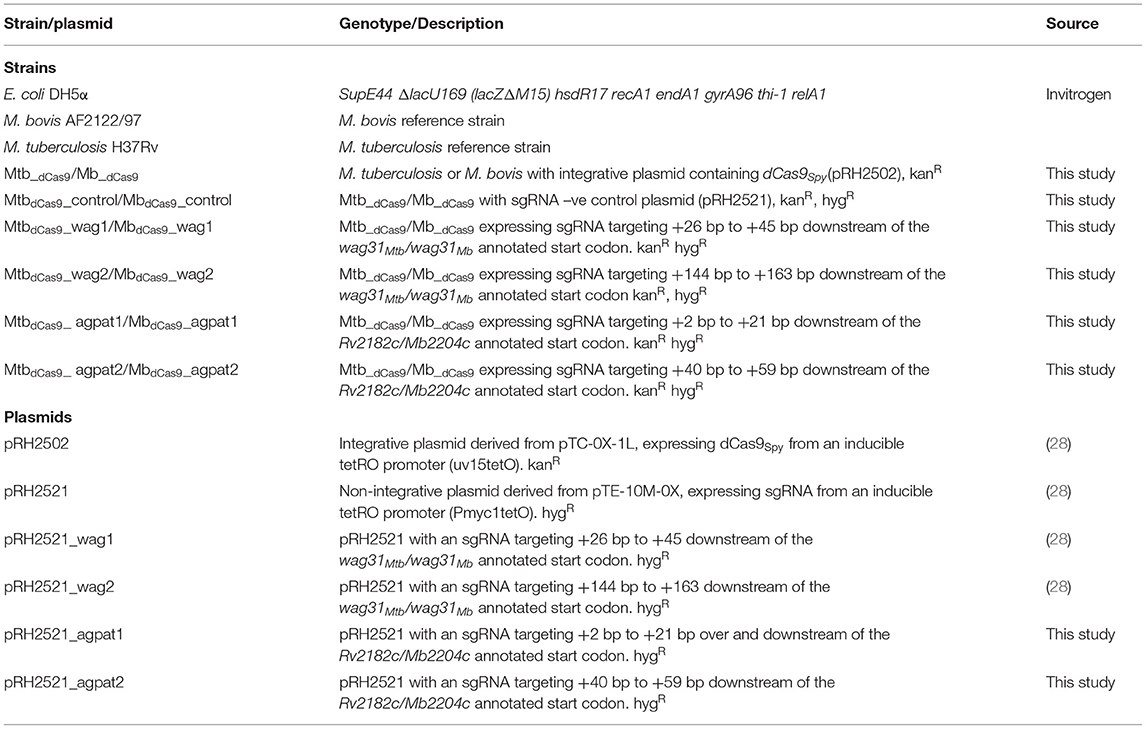
Table 1. Strains and plasmids used in this study.
Generation of Transposon Libraries
Transposon libraries in M. bovis (AF2122/97) and M. tuberculosis (H37Rv) were generated using the previously described MycomarT7 phagemid system as per Majumdar et al. with modifications (29). Briefly, 50 ml cultures of M. bovis and M. tuberculosis at OD600≅1 were washed twice with MP buffer (50 mM Tris-HCl, pH 7.5, 150 mM NaCl, 10 mM MgSO4 and 2 mM CaCl2) at 37°C, and then incubated with ~1011 pfu of ϕMycoMarT7 phage for 16–18 h at 37°C without rolling. Transduced bacteria were washed in pre-warmed PBS + 0.05% Tween®80 to remove extra-cellular phage and plated on Middlebrook 7H11 solid medium containing 0.5% lysed defibrinated sheep blood, 10% heat inactivated foetal bovine serum, 10% OADC, 25 μg/ml kanamycin and 0.05% Tween®80. Cultures were allowed to grow for 5–6 weeks. Concurrent CFU plating was performed to estimate transduction efficiency. Approximately 15–20 colonies from each library were used for validation of random insertion using a nested PCR strategy followed by Sanger sequencing, method and data are shown in Supplementary Material S1. Libraries were scraped from the plates and incubated in liquid medium at 37°C with hourly vortexing for 3 h to homogenise. Homogenised mutants were distributed to cryovials and stored at −80°C for further selection or gDNA extraction.
DNA Extraction
Unless stated otherwise, reagents were acquired from Sigma Aldrich. Genomic DNA from harvested libraries was isolated by a bead beating procedure (mechanical lysis) or using de-lipidation followed by enzymatic lysis as previously described by Long et al. (30) and Belisle et al. (31). Briefly, for mechanical lysis, library aliquots were disrupted using 0.1 mm glass beads and bead-beating by 3 × 15 s bursts (5000 rpm) interspersed with 2 mins on ice using a beat-beater (Biospec). For enzymatic lysis, libraries were de-lipidated with equal volumes chloroform-methanol (2:1) for 1 h with agitation every 15 mins, suspension was centrifuged at 3,488 × g for 10 mins the bacterial pellet allowed to dry for 2 h after removal of both solvent layers. De-lipidated bacteria were suspended in TE buffer and incubated with 100 μg/ml lysozyme in the presence of 100 mM TrisBase (pH 9.0) at 37°C for 12–16 h. Bacterial lysis was completed by incubating for 3 h at 55°C in the presence of 1% SDS and 100 μg/ml proteinase K (NEB). Lysates from both methods were extracted twice with equal volumes of phenol–chloroform–isoamyl alcohol (25:24:1). The aqueous layer was harvested by centrifugation at 12,000 × g for 30 mins and DNA was precipitated with 0.1 volumes of 3M sodium acetate (pH 5.2) and one volume of ice-cold isopropanol overnight at −20°C. DNA pellets were washed several times in ethanol. DNA was re-suspended in water and quantity and quality were determined using a DeNovix Spectrophotometer (DeNovix Inc, USA), agarose gel electrophoresis and fluorometry using Qubit4 (Invitrogen).
Library Preparation for Transposon Directed Inserted Sequencing
Two μg of extracted DNA libraries were resuspended in purified water and sheared to approximately 550 bp fragments using a S220 focussed-ultrasonicator (Covaris), according to the manufacturer's protocol. Sheared DNA was repaired using NEBNext blunt-end repair kit (New England Biolabs) and purified using Monarch PCR clean-up kit (New England Biolabs). Blunted DNA was A-tailed using NEBNext dA-tailing kit and column-purified. Custom transposon sequencing adaptors, or “TraDIS tags,” (Table 2) were generated by heating an equimolar mix of adaptor standard primer and adaptor P7+index to 95°C for 7 mins and then allowed to cool to room temperature. Adaptors were ligated to A-tailed library fragments using NEBNext quick ligase kit. Transposon-containing fragments were enriched by PCR using ComP7 primers ComP5 using Phusion DNA polymerase (New England Biolabs) in a 20-cycle reaction. Library fragments were subsequently cleaned up with AMPureXP purification beads (Beckman).

Table 2. Oligonucleotides used in this study.
Data Analysis
Indexed libraries were combined, spiked with 20% PhiX, and sequenced on the Illumina HiSeq 3000 platform, using v2 chemistry, generating single-end reads of 150 bp. Raw FASTQ sequence files were pre-processed using the TPP utility of TRANSIT python package (32) including removing TRADIS tags and adapter sequences and mapping using BWA-MEM algorithm [32], to generate insertion files in.wig format. Custom annotations, “prot tables,” were created from the M. bovis strain AF2122/97 annotation file (NCBI Accession Number LT708304, version LT708304.1) and for the M. tuberculosis strain, H37Rv [NCBI Accession Number AL123456, version AL123456.3, assembly build GCA_000195955.2 (ENA)]. TRANSIT software was run on both M.bovis and M. tuberculosis files using the default normalisation (TTR), which normalises by trimming the top and bottom 5% of read counts and normalising to the mean read count. The TRANSIT HMM algorithm (33) was used to make calls of essentiality for each TA insertion site, and for each gene based on annotated gene boundaries. Data files (fastq) are deposited in SRA (PRJNA754037).
CRISPRi Mediated Gene Silencing
We utilised dCas9 from Streptococcus pyogenes (dCas9Spy) for silencing as previously described (28). sgRNA targeting wag31Mtb/Mb and Rv2182c/Mb2204c were designed according to the parameters derived from Larson et al. (34). Protospacer adjacent motif (PAM) sites, “NGG,” were chosen and putative sgRNAs 20 bp downstream of the PAM were selected. All sgRNAs designed targeted the coding non-template strand. The probability of complementarity to any other region of the genome and predicted secondary structure of the sgRNA transcript was analysed using a basic local alignment search tool (BLAST) and M-fold, respectively (35, 36). Complementary forward and reverse primers using the sequence (without the PAM) with appropriate ends for ligation to the pRH2521 vector were designed (Table 2). Oligos were annealed and cloned into pRH2521 using BbsI as previously described (28, 37). One microgram of pRH2502 was electroporated at 25 kV, 25 μF with 1000 Ω resistance into electrocompetent M. bovis and M. tuberculosis to generate strains expressing dCas9Spy (Mtb_dCas9/Mb_dCas9). These strains were grown and further electroporated with 1 μg of pRH2521 expressing sgRNAs targeting wag31Mtb/Mb and Rv2182c/Mb2204c or pRH2521, the sgRNA –ve plasmid.
RNA Extraction and RT-qPCR
Cultures were grown to OD600 ≅ 0.1–0.2 and the CRISPRi machinery induced with 200 ng/ml of anhydrotetrcycline (aTc) for 24 h. Total RNA was extracted as previously described (38). Briefly, cultures were centrifuged at 3,488 × g at 4°C for 10 mins. Pellets were resuspended in 1 ml of TRIzol containing 0.1 mm glass beads and were disrupted by three cycles of 30 s pulses at 6,000 rpm using a Precellys homogenizer. RNA was purified using a Qiagen RNeasy kit combined with on-column DNase digestion according to the manufacturer's instructions. Quantity and quality were determined using a DeNovix Spectrophotometer (DeNovix Inc, USA) and agarose gel electrophoresis.
To remove traces of contaminating DNA, RNA samples were treated with RNase-free DNase I (Invitrogen) according to the manufacturer's instructions. cDNA was synthesised from 100 ng of RNA using Superscript III Reverse transcriptase according to manufacturer instructions. qPCRs were performed using PowerUp SYBR Green Master Mix with 1 μl of cDNA and 0.3 μM of either sigA primers or gene specific primers (Table 2) in a final volume of 20 μl. Samples were run on a BioRad CFX96 analyser at 50°C for 2 mins, 95°C for 2 mins, followed by 40 cycles of 50°C for 2 mins, 95°C for 2 mins, followed by 40 cycles of 95°C for 15 s, 72°C for 1 min and 85°C for 5 s at which point fluorescence was captured. A melt curve analysis was also carried out for each run at 65–95°C in increments of 0.5°C. Gene expression data was analysed using the 2−ΔΔCT method (39). Reverse transcriptase –ve samples were used as a control to ensure removal of gDNA. All results were normalised against the house keeping gene sigA. Two or three biological replicates were run, with each measured in duplicate, unless otherwise stated.
Results
Generation of High-Density Transposon Libraries in M. bovis AF2122/97 and M. tuberculosis H37Rv
The Mycomar transposon inserts randomly into TA sites in bacterial genomes (40). There are 73,536 and 74,604 TA sites present in the M. bovis (AF2122/97) and M. tuberculosis (H37Rv) genomes, respectively. The smaller number of TA sites in M. bovis is likely to be reflective of a smaller genome. We successfully generated transposon libraries in M. bovis and M. tuberculosis containing 39,987 (M. bovis) and 29,919 (M. tuberculosis) unique mutants, representing 54 % (M. bovis) and 40 % (M. tuberculosis) saturation (Table 3). This corresponded to an insertion in 3,625/3,989 (91%) coding sequences in M. bovis and 3,554/4,018 (86%) coding sequences for M. tuberculosis. The distribution of transposon insertions in the two species is shown in Figure 1.

Table 3. Summary statistics of the Tn libraries created in this study.
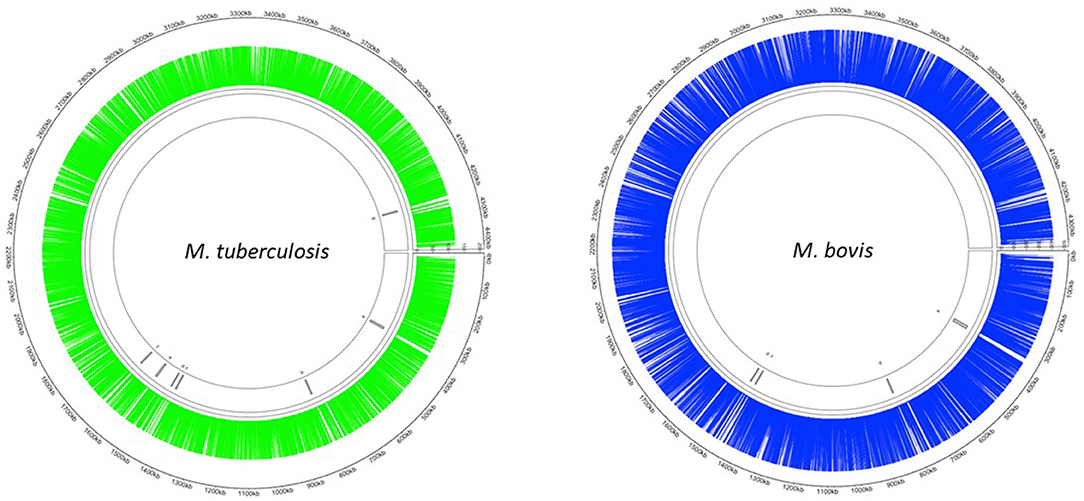
Figure 1. Distribution of Tn insertions in both M. tuberculosis and M. bovis. Transposon libraries were created in M. tuberculosis and M. bovis using the Himar1 system and sequenced on a HiSeq NGS platform (Illumina, UK) as described in the materials and methods. Insertion locations of Himar1 across the M. tuberculosis genome (green) and M. bovis genome (blue) were visualised using Circlize (41).
Himar1 transposase has been previously suggested to exhibit local sequence preferences rendering ~9% of possible TA sites non-permissive to insertion (23) and others have also observed TA insertion cold spots within the M. tuberculosis genome. Using the non-permissive sequence pattern, “SGNTANCS” (where S is either G/C), we identified 6657 non-permissive sites in both M. bovis and M. tuberculosis genomes (data not shown). Taking a similar approach to Carey et al., we found that removing these sites prior to determining gene essentiality as described below did not affect the gene calls (25).
Comparisons of Essentiality Between M. bovis AF2122/97 and M. tuberculosis H37Rv
We examined in vitro gene essentiality in M. bovis and M. tuberculosis using the TRANSIT HMM method (33). This approach classifies genes into four categories; those that are essential for growth and cannot sustain a transposon insertion (ES), those where the transposon insertion results in a growth defect (GD) and those where the transposon insertion results in a growth advantage (GA). Those that show no impact as a result of the transposon insertion are considered non-essential (NE). From this analysis, 527 genes were classified as ES (15.3%), 176 genes were classified as GD (5.1%) and 131 as GA (3.8%) in the M. bovis genome. In M. tuberculosis 477 genes were classified as ES (13.7%), 179 genes were classified as GD (5.1%) and 1 gene as GA (0.03%). A complete list of calls for the genes that are conserved between both species is given in Supplementary Table S1. The status of the genes that are M. bovis specific are also included in the table.
Early sequencing and functional annotation of the genome of M. tuberculosis categorised genes into several different functional classes with an uneven distribution of genes across the classes (4, 5). We examined the distribution of the genes classified as ES in M. tuberculosis (477) and M. bovis (527) across the functional classes to determine if: (i) ES genes are over-represented in any particular functional class when compared to the genome as a whole; (ii) there are differences between the two species. The results are shown in Table 4. Chi squared testing showed that the distribution of ES genes across the functional classes was significantly different to the distribution of all orthologues (p ≤ 0.01). ES genes in both species are over-represented in “information pathways” and “intermediary metabolism and respiration” and under-represented in “conserved hypotheticals” and “PE/PPE” functional classes. Our data are in line with previous reports; Griffin et al. noted that the distribution of ES genes across the different functional classes were different compared to the genome as a whole (22). DeJesus et al. also noted that insertions in PE/PPE genes were under-represented likely due to GC rich sequences and an increased proportion of non-permissive TA sites in the PE/PPE genes (23). There were no major differences in distribution of ES genes across the functional classes when M. tuberculosis and M. bovis were compared with each other except for “insertion sequences and phages” which did not contain any genes classified as ES in the M. bovis genome.
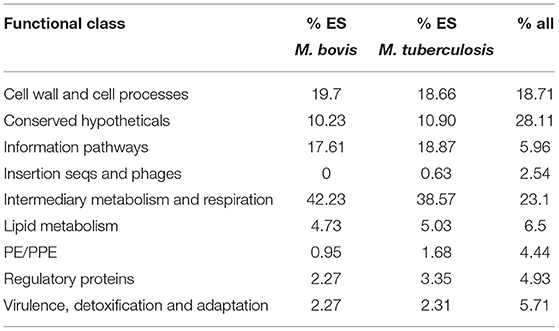
Table 4. Distribution of genes classified as ES across functional class.
Genes categorised as ES in this study were compared between the two species and also compared to previously reported studies (21–23, 26, 42) (Supplementary Table S1). We found that the M. bovis dataset generated in our study shared 370 (70%) of genes classified as ES with M. tuberculosis in vitro (this study; Figure 2A) and up to 86% overlap with three key published M. tuberculosis data sets: DeJesus et al. (23) (71%), Griffin et al. (86%) and Minato et al. (79%) indicating good correlation with previous reports (Figure 2D). Similarly, the M. tuberculosis dataset generated in our study shared good overlap with other published datasets (Figure 2C). When comparing M. bovis genes classified as ES with those reported by Butler et al. (26) we found that 220 (42%) genes were shared between these data sets (Figure 2B). Butler et al. reported a total of 318 genes to be essential in M. bovis in vitro prior to selection in Dictyostelium discoideum compared to 527 reported in this study. Both libraries showed similar saturation levels (58 vs. 54% in this study) and use similar analysis methods, therefore differences might be due to the conditions under which the libraries were generated (although both studies used Middlebrook 7H11 solid medium supplemented with lysed sheep blood, heat inactivated foetal bovine serum and OADC) or between laboratory variation as might be expected for whole genome techniques such as Tnseq. It should also be noted that the similarities between the studies increases when GD genes are considered, for instance of the 307 genes that appear to be uniquely ES in our study, 212 of these are classified as GD in the study by Butler et al., indicating a debilitating impact of the transposon insertion.
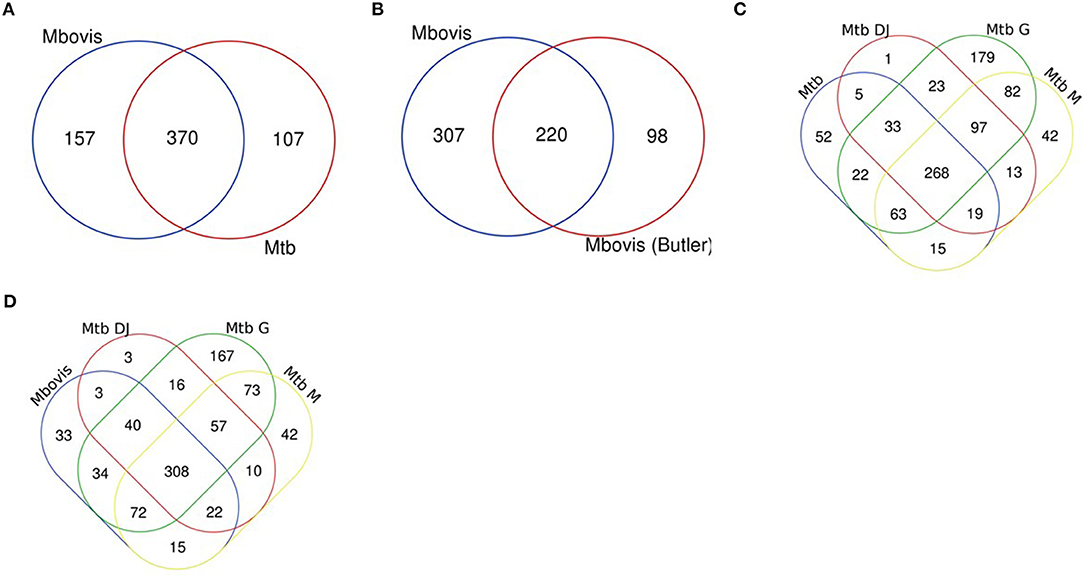
Figure 2. Essential gene comparisons. Gene essentiality was determined for M. bovis and M. tuberculosis using custom HMM analyses with TRANSIT software and compared to previously published datasets. (A) M. bovis and M. tb (both this study), (B) M. bovis (this study) and M. bovis (26) (C) M. tb (this study) and M. tb DJ (23), M. tb G (22) and M. tb M (21) and (D) M. bovis (this study) and M. tb DJ (23), M. tb G (22) and M. tb M (21).
Differences in Gene Essentiality Between M. bovis and M. tuberculosis
Genes uniquely classified as ES in either species are of interest to determine potential genetic insights for phenotypic differences between these closely related mycobacterial species. In this study 157 genes were uniquely ES in M. bovis when compared to the M. tuberculosis (Figure 2A), however, of these 157, 61 were classified as GD in M. tuberculosis. The remaining 96 were classified as NE in M. tuberculosis (Supplementary Table S2). The existence of multiple datasets allows for a robust meta-analysis and so we compared across datasets and found that there were 42 genes that were either ES or GD in this study and the study by Butler et al., and were classified as NE in M. tuberculosis in this study and the study by DeJesus et al. (Supplementary Table S3). Included in this subset of genes is Rv3543c (fadE19), Rv3541c and Rv3540c (lpt2), genes which are encoded on the same operon (Rv3545c-Rv3540c—based on intergenic gaps) regulated by kstR and involved in cholesterol catabolism. This study and the Butler et al., study indicates that insertional mutagenesis of this operon has a debilitating impact in M. bovis but not in M. tuberculosis.
Data for the entire kstR regulon is given in Supplementary Table S4. Interestingly, the media used in this study and the study by Butler et al., contains traces of cholesterol due to the presence of lysed sheep blood, although there is no evidence that cholesterol presented a selective pressure (for M. tuberculosis) in this study as there is little overlap of the M. tuberculosis dataset with the study by Griffin et al., In addition to the Rv3545c-Rv3540c operon considered above, several orthologues in the kstR regulon were classified as ES in M. bovis; Mb3538 (Rv3508), Mb3568 (Rv3538) and Mb3581 (Rv3551), and Mb3595 (Rv3565). Others such as Mb3541 (Rv3511) and Mb3574c (Rv3544c) were classified as GD. Interestingly insertions in the genes belonging to the mce4 operon and required for growth on cholesterol mostly confer a growth advantage for M. bovis. These observations might reflect a difference in the requirement for cholesterol catabolism in vitro in a complex carbon mixture compared to M. tuberculosis.
One of the key metabolic differences between M. bovis and M. tuberculosis is the inability of M. bovis to utilise carbohydrates. Genes in the glycolytic pathway (Supplementary Table S5) such as, enolase (eno), pyruvate kinase (pykA) and pyruvate carboxylase (pca) might be expected to be NE in M. bovis as pykA is non-functional in M. bovis (43). The datasets show that eno is ES in M. bovis as well as M. tuberculosis perhaps indicating that its essentiality is linked to a role other than glycolysis. Similarly, the suggestion that a transposon insertion in pykA confers a growth advantage (this study only) is counter-intuitive and might suggest a non-glycolytic role for this enzyme. Only our dataset suggests that a transposon insertion in icl1, an enzyme required for growth on fatty acids, confers a growth advantage in M. bovis.
The two-component system PhoPR has been shown to control the biosynthesis of sulfolipid (SL-1) and di- and poly-acyltrehaloses (DAT and PAT) and also secretion of ESAT-6 by regulation of the espACD gene cluster (44, 45). It is of particular interest because a non-synonymous SNP in the sensor histidine kinase phoR in M. bovis renders signalling through the system defective and M. bovis lacks SL-1, however, the existence of compensatory mutations that restore ESAT-6 production obscures the role of the regulon in M. bovis (46). Additionally, it is known that genes associated with the synthesis of PDIM are over-expressed in M. bovis AF2122/97 (11) although the mechanism by which this occurs is not entirely known. There is some evidence that PhoPR indirectly controls the expression of PDIMs (16). Of the genes in the PhoPR regulon (Supplementary Table S6) only Rv3778c seems to be consistently required across species and studies. Genes in the redox sensing WhiB family are included in the regulon (whiB1, whiB3 and whiB6) but only whiB1 is ES in M. bovis in our study.
Genes encoding for the transport of inorganic sulphate; subI, cysW, cysW and cysA, were classified as ES in M. bovis in this study. These genes are involved in reductive sulphur assimilation and are conserved across the MTBC (47). This pathway was found to be essential in vitro for BCG Pasteur, but not BCG Danish, when grown on the same media (48). In our study, they were found to be essential in vitro for M. bovis but this was not corroborated in the study by Butler et al., Of the studies with M. tuberculosis, these genes have been found to be essential in vitro in some studies (22, 23) but not others (21). These discrepancies may reflect differences in the ability of the species (or strains) to acquire sulphate from organic sources such as methionine, different affinities of the transporter between species (or strains) or alternatively may reflect differences in the oxidative stress levels of the environment under which the screens are performed. Sulphated metabolites, such as mycothiol play a key role in the protection against oxidative stress (49). The metabolism of fatty acids can increase the cytoplasmic pool of reducing equivalents leading to a redox imbalance, therefore central carbon metabolism might also play a role in the differences observed across the studies.
Finally, as the electron transport chain and ATP synthesis is a relatively new therapeutic pathway, we chose to examine ES more closely in these pathways (Supplementary Table S7). These pathways are targets of recently introduced drugs such as bedaquiline (ATP synthase) and those in development e.g., Q203 which targets the terminal cytochrome bc1-aa3 oxidase (50). Unsurprisingly, the genes encoding the ATP synthase are largely ES in both species in all studies (Rv1304-Rv1311) with the exception of Rv1304 (atpB). The genes that encode a sub-unit of the terminal cytochrome bc1-aa3 oxidase complex (qcrCAB) the target of Q203 are classified as either ES or GD. One interesting observation is that both our study and the study by Butler et al., suggests that a growth defect occurs as a result of an insertion in nuoG but this is not observed in any of the M. tuberculosis studies. nuoG forms part of the multi-subunit NADH reductase-I complex in the respiratory chain and transfers electrons to the menaquinone pool while simultaneously contributing to the proton gradient through its proton pumping function. Menaquinone biosynthesis itself has been a long standing drug target in M. tuberculosis (51–53). Menaquinone is synthesised from chorismate by a series of enzymes (MenF, MenD, MenH, MenC, MenE, MenB, MenA). The enzyme that catalyses the first committed step in this biosynthetic pathway is encoded by menD and is essential in all datasets. Genes in this biosynthetic pathway (menA, menB and menC) are also ES in M. bovis in this study, illustrating that targets of this pathway might also be useful in the treatment of M. bovis infections.
Establishment of CRISPRi in Mycobacterium bovis Using Wag31
Wag31 is required for peptidoglycan synthesis and several Tnseq datasets have classified wag31 in M. tuberculosis as ES in vitro (21–23). Additionally, essentiality of wag31 in M. tuberculosis has been verified using conditional mutants (54). The Tnseq data obtained in this study classified wag31 in M. bovis as ES, but NE in M. tuberculosis. The study by Butler et al., assigned wag31 as NE in M. bovis. In order to probe this discrepancy with the literature and to establish CRISPRi silencing in M. bovis this gene was chosen for silencing. Early CRISPRi studies in M. tuberculosis performed by Singh et al. successfully utilised two plasmids encoding sgRNAs guides targeting +26 bp to +45 bp and +144 bp to +163 bp downstream of the annotated start codon of wag31Mtb (Table 1; Figure 3A). We utilised these plasmids to make strains of M. tuberculosis and M. bovis where wag31 has been silenced. There are no differences in sequence in the area complementary to the sgRNAs between the two species, therefore the plasmids originally designed by Singh et al., for use in M. tuberculosis could be used in M. bovis. M. bovis AF2122/97 was transformed with pRH2502 to create a strain expressing dcas9Spy(Mb_dCas9). Mb_dCas9 was then transformed with plasmids expressing the sgRNA guides. An identical strategy was used to make the equivalent strain in M. tuberculosis. Strains were cultured to exponential phase and serial dilutions were spotted onto agar containing 200 ng/ml aTc. Controls (without aTc, without sgRNA) were also included. The results, presented in Figure 3B, show that silencing wag31Mb in both M. bovis and M. tuberculosis results in a severe growth defect, visible at 10−1 dilution with complete cessation of growth at 10−2 dilution. This supports the consensus in the literature that wag31 is an essential gene in M. tuberculosis. It also supports the classification of wag31 as ES in M. bovis rather than NE as reported by Butler et al., Dysgonic growth of M. bovis on this medium can be observed in the figure. This has been previously reported (43, 55).
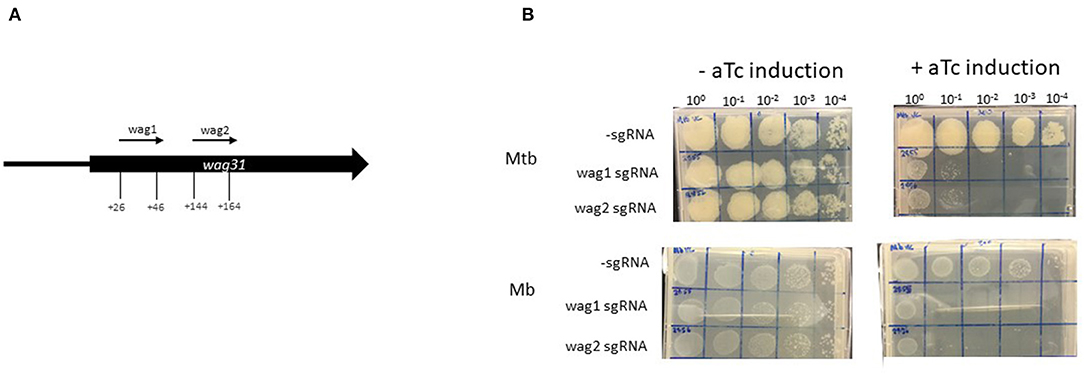
Figure 3. Using CRISPRi/dCas9 to inhibit wag31 expression in M. bovis and M. tuberculosis. (A) Schematic showing the target regions of two sgRNAs designed to target and inhibit wag31 expression. The numbers show the nucleotide position of the sgRNA relative to the annotated start site. (B) CRISPRi strains were cultured in 10 ml of supplemented 7H9 medium to exponential phase and diluted to 2 × 10⁷ CFU/ml. A 10-fold serial dilution to 10−4 was performed and 20 μl of each dilution was spotted onto 7H11 agar without aTc and with 200 ng/ml aTc to induce CRISPRi/dCas9 and the sgRNA in those strains that carried the guide. Two biological replicates were carried out.
Silencing Rv2182c and Its Orthologue Mb2204c Shows a Species-Specific Growth Impact
Rv2182c/Mb2204c is annotated as a 1-acylglycerol-3-phosphate O-acyltransferase (agpat) and involved in glycerophospholipid metabolism. It is thought to synthesise diacylglycerol-3P through the addition of acyl chains to monoacylglycerol-3P. It is classified as ES in M. tuberculosis in this study and by others (22, 23, 56). It is classified as ES in M. bovis in this study but NE in the study by Butler et al., Strains of M. tuberculosis and M. bovis were constructed expressing sgRNAs targeting +2 bp to +21 bp and +40 bp to +59 bp downstream of the annotated start codon of Rv2182c/Mb2204c (Table 2; Figure 4A). The impact of inducing the system on expression of Rv2182c/Mb2204c was measured using RT-qPCR. The results, which are shown in Figure 4B show that dCas9Spy is similarly induced in both M. tuberculosis and M. bovis with 150 to 350-fold induction of expression in the presence of aTc. Additionally, the results show that, in the presence of the sgRNA, there is a clear reduction in expression of Rv2182c/Mb2204c in both species. These data demonstrate effective gene silencing of Rv2182c/Mb2204c in both M. tuberculosis and M. bovis, respectively.
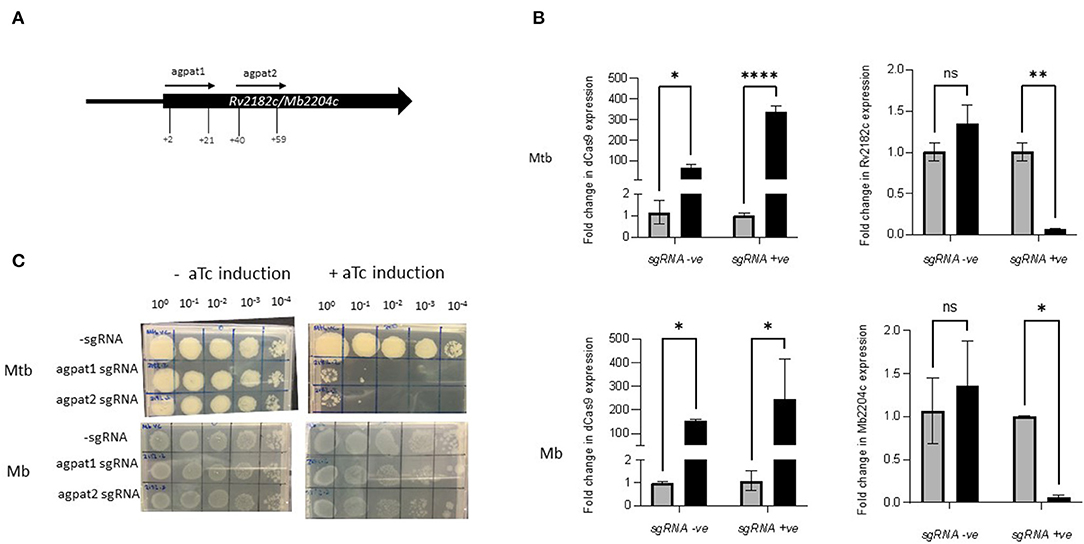
Figure 4. Using CRISPRi/dCas9 to inhibit Rv2182c/Mb2204c expression in M. bovis and M. tuberculosis. (A) Schematic showing the target regions of two sgRNAs designed to target and inhibit Rv2182c/Mb2204c expression. The numbers show the nucleotide position of the sgRNA relative to the annotated start site (B) dCas9 expression and Rv2182c/Mb2204c expression were measured by RT-qPCR as described in the methods section. Expression levels were measured in the strain expressing sgRNA agpat1. Gene expression was analysed using the 2−ΔΔCT method, normalised against sigA. Results represent two biological repeats with two technical repeats each. *P < 0.05, **P < 0.01, ***P < 0.001, ****P < 0.0001 or not significant (ns), analysed using a 2-way ANOVA test. Black bars represent aTc treated cultures and grey bars untreated. (C) CRISPRi strains were cultured in 10 ml of supplemented 7H9 medium to exponential phase and diluted to 2 × 10⁷ CFU/ml. A 10-fold serial dilution to 10−4 was performed and 20 μl of each dilution was spotted onto 7H11 agar without aTc and with 200 ng/ml aTc to induce CRISPRi/dCas9 and the sgRNA in those strains that carried the guide. Two biological replicates were carried out.
To determine the impact of induction of the guides, strains were cultured to exponential phase and serial dilutions were spotted onto agar containing 200 ng/ml aTc. The results (Figure 4C) show that silencing Rv2182c in M. tuberculosis results in a severe growth defect, with almost complete cessation of growth at 10−1 dilution. However, the consequence of silencing Mb2204c on the growth of M. bovis is far less pronounced with a small reduction visible at the lowest dilution 10−4. This demonstrates that, unlike wag31, silencing of Rv2182c and its orthologue Mb2204c in M. tuberculosis and M. bovis respectively, has a differential impact on growth, with M. tuberculosis being more vulnerable and showing a greater growth defect. These results do not support the classification of Mb2204c as an ES gene in M. bovis but they clearly highlight that there are different phenotypic consequences as a result of silencing the orthologue in both species.
Discussion
The aim of this work was to directly compare gene essentiality in the human and animal adapted members of the MTBC. In order to do this, we generated transposon libraries in M. bovis AF2122/97 and M. tuberculosis H37Rv using a rich medium that supported the growth of both species. We assessed gene essentiality using the TRANSIT HMM method to define 527 and 477 genes as ES for M. bovis and M. tuberculosis, respectively. Datasets from each species were compared with each other and with previously published datasets. Genes classified as ES were congruent between the species and also with existing studies of gene essentiality in M. tuberculosis (21–23, 42). Comparing this study with a previously published M. bovis dataset revealed a 42% overlap which increased when genes predicted to show a GD as a result of the transposon insertion were taken into account (26). There were some indications of differences between the species, and a meta-analysis of the data indicated that 42 genes were differentially essential between the species. A recent study using whole genome CRISPRi screens showed that a similar number (80 genes) were differentially essential in two different strains of M. tuberculosis (H37Rv vs. HN878) (57). Genes that appear to show differential essentiality between the two species include those involved in cholesterol catabolism.
Whole-genome TnSeq provides a high-throughput assessment of fitness costs and has allowed the classification of genes based on essentiality but does not provide information on target vulnerability. More recent studies highlight the limitations of the (near) binary classification of genes into and ES/NE and utilise CRISPRi to assess vulnerability (57, 58). Additionally, datasets are prone to false calls of ES due to non-saturating mutagenesis. In this study CRISPRi was utilised to show that there are different impacts on bacterial growth as a result of silencing Rv2182c/Mb2204c in their respective species, despite achieving similar levels of gene silencing. Significant growth inhibition was seen as a result of silencing in Rv2182c in M. tuberculosis while only marginal impacts on growth were observed on silencing the orthologue Mb2204c in M. bovis. Rv2182c/Mb2204c is annotated as a 1-acylglycerol-3-phosphate O-acyltransferase and involved in glycerophospholipid metabolism. It is thought to synthesise diacylglycerol-3P through the addition of acyl chains to monoacylglycerol-3P. This pathway may be involved in detoxification and further work is required to fully understand the differential impact of silencing this gene in the two species. Given that Rv2182c was a predicted target in a recent compound screen (59), differential essentiality estimates in M. bovis and M. tuberculosis are important to predict if zoonotic TB caused by M. bovis can also be suitably treated with drugs designed to be effective against M. tuberculosis.
We have provided a comparative analysis of the genetic requirements for growth of two key MTBC members: M. bovis and M. tuberculosis. Genes which are uniquely ES for either M. bovis or M. tuberculosis have the potential to provide insights into niche specific aspects e.g., host tropism, survival in the environment, phenotype, and anti-tubercular drugs. Host tropism is of particular interest when considering the zoonotic nature of M. bovis and the involvement of wildlife hosts as reservoirs of infection for bovine TB. Use of M. bovis libraries in the context of the host i.e., through experimental infection of bovine TB will enable the study of the genetic requirements for survival in vivo. Further investigations exploring the role and function of ES genes between M. bovis and M. tuberculosis is necessary to better understand the physiological differences in these key MTBC species.
Data Availability Statement
The datasets presented in this study can be found in online repositories. The names of the repository/repositories and accession number(s) can be found below: https://www.ncbi.nlm.nih.gov/bioproject/PRJNA754037; SRA number Temporary Submission ID: SUB10190503.
Author Contributions
AG, SW, IP, and SK designed the study. AG, IP, and VF carried out the experimental work. Data analysis was done by BS, TC, IN, JS, and DX. TC, SK, DW, BW, and BV-R did funding acquisition. AG and SK wrote the first draft of the manuscript. All authors contributed to the manuscript revision, read, and approved the submitted version.
Funding
This work was funded by the BBSRC Grant Ref: BB/N004590/1 [awarded to SK (PI), DW (Co-I), BW (Co-I), TC (Co-I)] and SE3314 to BV-R as part of the joint BBSRC-DEFRA EradbTB consortium. AG, IP, and SW were supported by the funding. VF was in receipt of an RVC PhD studentship. AG currently holds a Sêr Cymru II Lectureship funded by the European Research Development Fund and Welsh Government. BV-R is a Ser Cymru II Professor of Immunology at Aberystwyth University. JS is supported by a Bloomsbury Colleges PhD Studentship (LIDo program).
Conflict of Interest
The authors declare that the research was conducted in the absence of any commercial or financial relationships that could be construed as a potential conflict of interest.
Publisher's Note
All claims expressed in this article are solely those of the authors and do not necessarily represent those of their affiliated organizations, or those of the publisher, the editors and the reviewers. Any product that may be evaluated in this article, or claim that may be made by its manufacturer, is not guaranteed or endorsed by the publisher.
Acknowledgments
We would like to thank Robert Husson for providing us with the wag31 CRISPRi plasmids and also pRH2521 and pRH2520 before they were made available on Addgene.
Supplementary Material
The Supplementary Material for this article can be found online at: https://www.frontiersin.org/articles/10.3389/fvets.2021.760717/full#supplementary-material
References
1. Malone KM, Gordon SV. Mycobacterium tuberculosis complex members adapted to wild and domestic animals. In: Advances in Experimental Medicine and Biology. New York, NY: Springer, p. 135–54. doi: 10.1007/978-3-319-64371-7_7
3. FAO. Roadmap for Zoonotic Tuberculosis. WHO (2017). Available online at: www.who.int (accessed May 11, 2020)
4. Camus JC, Pryor MJ, Médigue C, Cole ST. Re-annotation of the genome sequence of Mycobacterium tuberculosis H37Rv. Microbiology. (2002) 148:2967–73. doi: 10.1099/00221287-148-10-2967
5. Cole ST, Brosch R, Parkhill J, Garnier T, Churcher C, Harris D, et al. Deciphering the biology of Mycobacterium tuberculosis from the complete genome sequence. Nature. (1998) 393:537–44. doi: 10.1038/31159
6. Malone KM, Farrell D, Stuber TP, Schubert OT, Aebersold R, Robbe-Austerman S, et al. Updated reference genome sequence and annotation of mycobacterium bovis AF2122/97. Genome Announc. (2017) 5: e00157-17. doi: 10.1128/genomeA.00157-17
7. Garnier T, Eiglmeier K, Camus JC, Medina N, Mansoor H, Pryor M, et al. The complete genome sequence of Mycobacterium bovis. Proc Natl Acad Sci USA. (2003) 100:7877–82. doi: 10.1073/pnas.1130426100
8. Brites D, Loiseau C, Menardo F, Borrell S, Boniotti MB, Warren R, et al. A new phylogenetic framework for the animal-adapted Mycobacterium tuberculosis complex. Front Microbiol. (2018) 9:2820. doi: 10.3389/fmicb.2018.02820
9. Golby P, Hatch KA, Bacon J, Cooney R, Riley P, Allnutt J, et al. Comparative transcriptomics reveals key gene expression differences between the human and bovine pathogens of the Mycobacterium tuberculosis complex. Microbiology. (2007) 153:3323–36. doi: 10.1099/mic.0.2007/009894-0
10. Rehren G, Walters S, Fontan P, Smith I, Zárraga AM. Differential gene expression between Mycobacterium bovis and Mycobacterium tuberculosis. Tuberculosis. (2007) 87:347–59. doi: 10.1016/j.tube.2007.02.004
11. Malone KM, Rue-Albrecht K, Magee DA, Conlon K, Schubert OT, Nalpas NC, et al. Comparative 'omics analyses differentiate Mycobacterium tuberculosis and Mycobacterium bovis and reveal distinct macrophage responses to infection with the human and bovine tubercle bacilli. Microb Genomics. (2018) 4:163. doi: 10.1099/mgen.0.000163
12. Saïd-Salim B, Mostowy S, Kristof AS, Behr MA. Mutations in Mycobacterium tuberculosis Rv0444c, the gene encoding anti-SigK, explain high level expression of MPB70 and MPB83 in Mycobacterium bovis. Mol Microbiol. (2006) 62:1251–63. doi: 10.1111/j.1365-2958.2006.05455.x
13. Wiker HG. MPB70 and MPB83—major antigens of Mycobacterium bovis. Scand J Immunol. (2009) 69:492–9. doi: 10.1111/j.1365-3083.2009.02256.x
14. Queval CJ, Fearns A, Botella L, Smyth A, Schnettger L, Mitermite M, et al. Macrophage-specific responses to humanand animal-adapted tubercle bacilli reveal pathogen and host factors driving multinucleated cell formation. PLoS Pathog. (2021) 17:e1009410. doi: 10.1371/journal.ppat.1009410
15. Bigi MM, Blanco FC, Araújo FR, Thacker TC, Zumárraga MJ, Cataldi AA, et al. Polymorphisms of 20 regulatory proteins between Mycobacterium tuberculosis and Mycobacterium bovis. Microbiol Immunol. (2016) 60:552–60. doi: 10.1111/1348-0421.12402
16. García EA, Blanco FC, Klepp LI, Pazos A, McNeil MR, Jackson M, et al. Role of PhoPR in the response to stress of Mycobacterium bovis. Comp Immunol Microbiol Infect Dis. (2021) 74:101593. doi: 10.1016/j.cimid.2020.101593
17. Broset E, Martín C, Gonzalo-Asensio J. Evolutionary landscape of the Mycobacterium tuberculosis complex from the viewpoint of phoPR: implications for virulence regulation and application to vaccine development. MBio. (2015) 6:e01289-15. doi: 10.1128/mBio.01289-15
18. Sohaskey CD, Modesti L. Differences in nitrate reduction between Mycobacterium tuberculosis and Mycobacterium bovis are due to differential expression of both narGHJI and narK2. FEMS Microbiol Lett. (2009) 290:129–34. doi: 10.1111/j.1574-6968.2008.01424.x
19. Sassetti CM, Boyd DH, Rubin EJ. Comprehensive identification of conditionally essential genes in mycobacteria. Proc Natl Acad Sci USA. (2001) 98:12712–7. doi: 10.1073/pnas.231275498
20. Rengarajan J, Bloom BR, Rubin EJ. Genome-wide requirements for Mycobacterium tuberculosis adaptation and survival in macrophages. Proc Natl Acad Sci USA. (2005) 102:8327–32. doi: 10.1073/pnas.0503272102
21. Minato Y, Gohl DM, Thiede JM, Chacón JM, Harcombe WR, Maruyama F, Baughn AD. Genomewide assessment of Mycobacterium tuberculosis conditionally essential metabolic pathways. mSystems. (2019) 4: e00070-19. doi: 10.1128/MSYSTEMS.00070-19
22. Griffin JE, Gawronski JD, Dejesus MA, Ioerger TR, Akerley BJ, Sassetti CM. High-resolution phenotypic profiling defines genes essential for mycobacterial growth and cholesterol catabolism. PLoS Pathog. (2011) 7:e1002251. doi: 10.1371/journal.ppat.1002251
23. Dejesus MA, Gerrick ER, Xu W, Park SW, Long JE, Boutte CC, et al. Comprehensive essentiality analysis of the Mycobacterium tuberculosis genome via saturating transposon mutagenesis. MBio. (2017) 8:e02133-16. doi: 10.1128/mBio.02133-16
24. Zhang YJ, Ioerger TR, Huttenhower C, Long JE, Sassetti CM, Sacchettini JC, et al. Global assessment of genomic regions required for growth in Mycobacterium tuberculosis. PLoS Pathog. (2012) 8:e1002946. doi: 10.1371/journal.ppat.1002946
25. Carey AF, Rock JM, Krieger I V, Chase MR, Fernandez-Suarez M, Gagneux S, et al. TnSeq of Mycobacterium tuberculosis clinical isolates reveals strain-specific antibiotic liabilities. PLoS Pathog. (2018) 14:e1006939. doi: 10.1371/journal.ppat.1006939
26. Butler RE, Smith AA, Mendum TA, Chandran A, Wu H, Lefrançois L, et al. Mycobacterium bovis uses the ESX-1 Type VII secretion system to escape predation by the soil-dwelling amoeba Dictyostelium discoideum. ISME J. (2020) 14:919–30. doi: 10.1038/s41396-019-0572-z
27. Gallagher J, Horwill DM. A selective oleic acid albumin agar medium for the cultivation of Mycobacterium bovis. J Hyg. (1977) 79:155–60. doi: 10.1017/s0022172400052943
28. Singh AK, Carette X, Potluri LP, Sharp JD, Xu R, Prisic S, et al. Investigating essential gene function in Mycobacterium tuberculosis using an efficient CRISPR interference system. Nucleic Acids Res. (2016) 44:e143. doi: 10.1093/nar/gkw625
29. Majumdar G, Mbau R, Singh V, Warner DF, Dragset MS, Mukherjee R. Genome-wide transposon mutagenesis in Mycobacterium tuberculosis and Mycobacterium smegmatis. In: Methods in Molecular Biology. Clifton, NJ: Springer (2017), p. 321–35.
30. Long JE, DeJesus M, Ward D, Baker RE, Ioerger T, Sassetti CM. Identifying essential genes in Mycobacterium tuberculosis by global phenotypic profiling. New York, NY: Humana Press (2015), p. 79–95.
31. Belisle JT, Sonnenberg MG. Isolation of genomic DNA from mycobacteria. Methods Mol Biol. (1998) 101:31–44. doi: 10.1385/0-89603-471-2:31
32. DeJesus MA, Ambadipudi C, Baker R, Sassetti C, Ioerger TR. TRANSIT—a software tool for Himar1 TnSeq analysis. PLoS Comput Biol. (2015) 11:e1004401. doi: 10.1371/journal.pcbi.1004401
33. DeJesus MA, Ioerger TR. A Hidden Markov Model for identifying essential and growth-defect regions in bacterial genomes from transposon insertion sequencing data. BMC Bioinform. (2013) 14:1–12. doi: 10.1186/1471-2105-14-303
34. Larson MH, Gilbert LA, Wang X, Lim WA, Weissman JS, Qi LS. CRISPR interference (CRISPRi) for sequence-specific control of gene expression. Nat Protoc. (2013) 8:2180–96. doi: 10.1038/nprot.2013.132
35. Zucker M. Mfold web server for nucleic acid folding and hybridization prediction. Nucleic Acids Res. (2003) 31:3406–15. doi: 10.1093/NAR/GKG595
36. Altschul SF, Gish W, Miller W, Myers EW, Lipman DJ. Basic local alignment search tool. J Mol Biol. (1990) 215:403–10. doi: 10.1016/S0022-2836(05)80360-2
37. Choudhary E, Thakur P, Pareek M, Agarwal N. Gene silencing by CRISPR interference in mycobacteria. Nat Commun. (2015) 6:1–11. doi: 10.1038/ncomms7267
38. Rustad TR, Roberts DM, Liao RP, Sherman DR. Isolation of mycobacterial RNA. Methods Mol Biol. (2008) 465:13–22. doi: 10.1007/978-1-59745-207-6_2
39. Livak KJ, Schmittgen TD. Analysis of relative gene expression data using real-time quantitative PCR and the 22−ΔΔCT method. Methods. (2001) 25:402–8. doi: 10.1006/meth.2001.1262
40. Lampe DJ, Churchill ME, Robertson HM. A purified mariner transposase is sufficient to mediate transposition in vitro. EMBO J. (1996) 15:5470–9. doi: 10.1002/j.1460-2075.1996.tb00930.x
41. Gu Z, Gu L, Eils R, Schlesner M, Brors B. circlize implements and enhances circular visualization in R. Bioinformatics. (2014) 30:2811–2. doi: 10.1093/BIOINFORMATICS/BTU393
42. Serafini A, Tan L, Horswell S, Howell S, Greenwood DJ, Hunt DM, et al. Mycobacterium tuberculosis requires glyoxylate shunt and reverse methylcitrate cycle for lactate and pyruvate metabolism. Mol Microbiol. (2019) 112:1284–307. doi: 10.1111/mmi.14362
43. Keating LA, Wheeler PR, Mansoor H, Inwald JK, Dale J, Hewinson RG, et al. The pyruvate requirement of some members of the Mycobacterium tuberculosis complex is due to an inactive pyruvate kinase: implications for in vivo growth. Mol Microbiol. (2005) 56:163–74. doi: 10.1111/J.1365-2958.2005.04524.X
44. Asensio JG, Maia C, Ferrer NL, Barilone N, Laval F, Soto CY, et al. The virulence-associated two-component PhoP-PhoR system controls the biosynthesis of polyketide-derived lipids in Mycobacterium tuberculosis. J Biol Chem. (2006) 281:1313–6. doi: 10.1074/JBC.C500388200
45. Walters SB, Dubnau E, Kolesnikova I, Laval F, Daffe M, Smith I. The Mycobacterium tuberculosis PhoPR two-component system regulates genes essential for virulence and complex lipid biosynthesis. Mol Microbiol. (2006) 60:312–30. doi: 10.1111/J.1365-2958.2006.05102.X
46. Gonzalo-Asensio J, Malaga W, Pawlik A, Astarie-Dequeker C, Passemar C, Moreau F, et al. Evolutionary history of tuberculosis shaped by conserved mutations in the PhoPR virulence regulator. Proc Natl Acad Sci USA. (2014) 111:11491–6. doi: 10.1073/pnas.1406693111
47. Wooff E, Michell SL, Gordon SV, Chambers MA, Bardarov S, Jacobs WR, et al. Functional genomics reveals the sole sulphate transporter of the Mycobacterium tuberculosis complex and its relevance to the acquisition of sulphur in vivo. Mol Microbiol. (2002) 43:653–63. doi: 10.1046/J.1365-2958.2002.02771.X
48. Mendum TA, Chandran A, Williams K, Vordermeier HM, Villarreal-Ramos B, Wu H, et al. Transposon libraries identify novel Mycobacterium bovis BCG genes involved in the dynamic interactions required for BCG to persist during in vivo passage in cattle. BMC Genomics. (2019) 20:431. doi: 10.1186/s12864-019-5791-1
49. Berney M, Berney-Meyer L, Wong K-W, Chen B, Chen M, Kim J, et al. Essential roles of methionine and S-adenosylmethionine in the autarkic lifestyle of Mycobacterium tuberculosis. Proc Natl Acad Sci USA. (2015) 112:10008–13. doi: 10.1073/pnas.1513033112
50. Pethe K, Bifani P, Jang J, Kang S, Park S, Ahn S, et al. Discovery of Q203, a potent clinical candidate for the treatment of tuberculosis. Nat Med. (2013) 19:1157–60. doi: 10.1038/nm.3262
51. Kurosu M, Crick DC. MenA is a promising drug target for developing novel lead molecules to combat Mycobacterium tuberculosis. Med Chem. (2009) 5:197–207. doi: 10.2174/157340609787582882
52. Berube BJ, Russell D, Castro L, Choi S, Narayanasamy P, Parish T. Novel MenA Inhibitors are bactericidal against Mycobacterium tuberculosis and synergize with electron transport chain inhibitors. Antimicrob Agents Chemother. (2019) 63:e02661–18. doi: 10.1128/AAC.02661-18
53. Dhiman RK, Pujari V, Kincaid JM, Ikeh MA, Parish T, Crick DC. Characterization of MenA (isoprenyl diphosphate:1,4-dihydroxy-2-naphthoate isoprenyltransferase) from Mycobacterium tuberculosis. PLoS ONE. (2019) 14:e0214958. doi: 10.1371/journal.pone.0214958
54. Kang CM, Nyayapathy S, Lee JY, Suh JW, Husson RN. Wag31, a homologue of the cell division protein DivIVA, regulates growth, morphology and polar cell wall synthesis in mycobacteria. Microbiology. (2008) 154:725–35. doi: 10.1099/mic.0.2007/014076-0
55. Chavadi S, Wooff E, Coldham NG, Sritharan M, Hewinson RG, Gordon SV, et al. Global effects of inactivation of the pyruvate kinase gene in the Mycobacterium tuberculosis complex. J Bacteriol. (2009) 191:7545–53. doi: 10.1128/JB.00619-09
56. Minato Y, Gohl DM, Thiede JM, Chacón JM, Harcombe WR, Maruyama F, et al. Genome-wide assessment of Mycobacterium tuberculosis conditionally essential metabolic pathways. bioRxiv. (2019) 2019:534289. doi: 10.1101/534289
57. Bosch B, DeJesus MA, Poulton NC, Zhang W, Engelhart CA, Zaveri A, et al. Genome-wide gene expression tuning reveals diverse vulnerabilities of M. tuberculosis. Cell. (2021) 184:4579–92. doi: 10.1016/j.cell.2021.06.033
58. McNeil MB, Keighley LM, Cook JR, Cheung C, Cook GM. CRISPR interference identifies vulnerable cellular pathways with bactericidal phenotypes in Mycobacterium tuberculosis. Mol Microbiol. (2021) 2021:mmi.14790. doi: 10.1111/mmi.14790
Keywords: TnSeq, mycobacteria, one health, essential genes, CRISPRi, mycobacterium bovis
Citation: Gibson AJ, Passmore IJ, Faulkner V, Xia D, Nobeli I, Stiens J, Willcocks S, Clark TG, Sobkowiak B, Werling D, Villarreal-Ramos B, Wren BW and Kendall SL (2021) Probing Differences in Gene Essentiality Between the Human and Animal Adapted Lineages of the Mycobacterium tuberculosis Complex Using TnSeq. Front. Vet. Sci. 8:760717. doi: 10.3389/fvets.2021.760717
Received: 18 August 2021; Accepted: 29 November 2021;
Published: 24 December 2021.
Edited by:
Jacobus Henri De Waard, Central University of Venezuela, VenezuelaReviewed by:
Jo Stevens, University of Edinburgh, United KingdomStephen V. Gordon, University College Dublin, Ireland
Copyright © 2021 Gibson, Passmore, Faulkner, Xia, Nobeli, Stiens, Willcocks, Clark, Sobkowiak, Werling, Villarreal-Ramos, Wren and Kendall. This is an open-access article distributed under the terms of the Creative Commons Attribution License (CC BY). The use, distribution or reproduction in other forums is permitted, provided the original author(s) and the copyright owner(s) are credited and that the original publication in this journal is cited, in accordance with accepted academic practice. No use, distribution or reproduction is permitted which does not comply with these terms.
*Correspondence: Sharon L. Kendall, c2tlbmRhbGxAcnZjLmFjLnVr
†Present address: Amanda J. Gibson and Bernardo Villarreal-Ramos, Centre of Excellence for Bovine Tuberculosis, IBERS, Aberystwyth University, Aberystwyth, United Kingdom
Valwynne Faulkner, Systems Chemical Biology of Infection and Resistance Laboratory, The Francis Crick Institute, London, United Kingdom