Abstract
Equine piroplasmosis (EP) is a type of blood protozoan disease caused by tick-borne parasites, Theileria equi (T. equi), Babesia caballi (B. caballi) and Theileria haneyi. While many studies have been conducted on EP diagnosis, diagnostic methods exhibiting high sensitivity and specificity remain lacking. Therefore, nested PCR (nPCR) and duplex real-time fluorescence quantitative PCR (qPCR) that can simultaneously detect both T. equi and B. caballi causing agents were established and compared. The two techniques were used to analyze 36 horse blood samples for EP. This set of samples was also detected by a multinested PCR (mnPCR) targeting the EMA-1 gene of T. equi and the RAP-1 gene of B. caballi. By nPCR, duplex real-time fluorescence qPCR and mnPCR, infections with B. caballi were detected in 16.67% (6/36), 2.78% (1/36), 19.44% (7/36) of the horses, respectively. The T. equi prevalence was 58.33% (21/36) by the nPCR, 33.33% (12/36) by the duplex real-time fluorescence qPCR and 2.78% (1/36) by the mnPCR. The overall prevalence of infection with mixed parasites by nPCR was 5.56% (2/36), by duplex real-time fluorescence qPCR was 2.78% (1/36) and by mnPCR 0% (0/36). Results suggest that nPCR can detect T. equi and B. caballi positive samples with good specificity and sensitivity, although distinguishing between the two parasites requires an electrophoresis with 4% agarose gels. The duplex real-time fluorescence qPCR can readily distinguish between T. equi and B. caballi infection, but with low sensitivity.
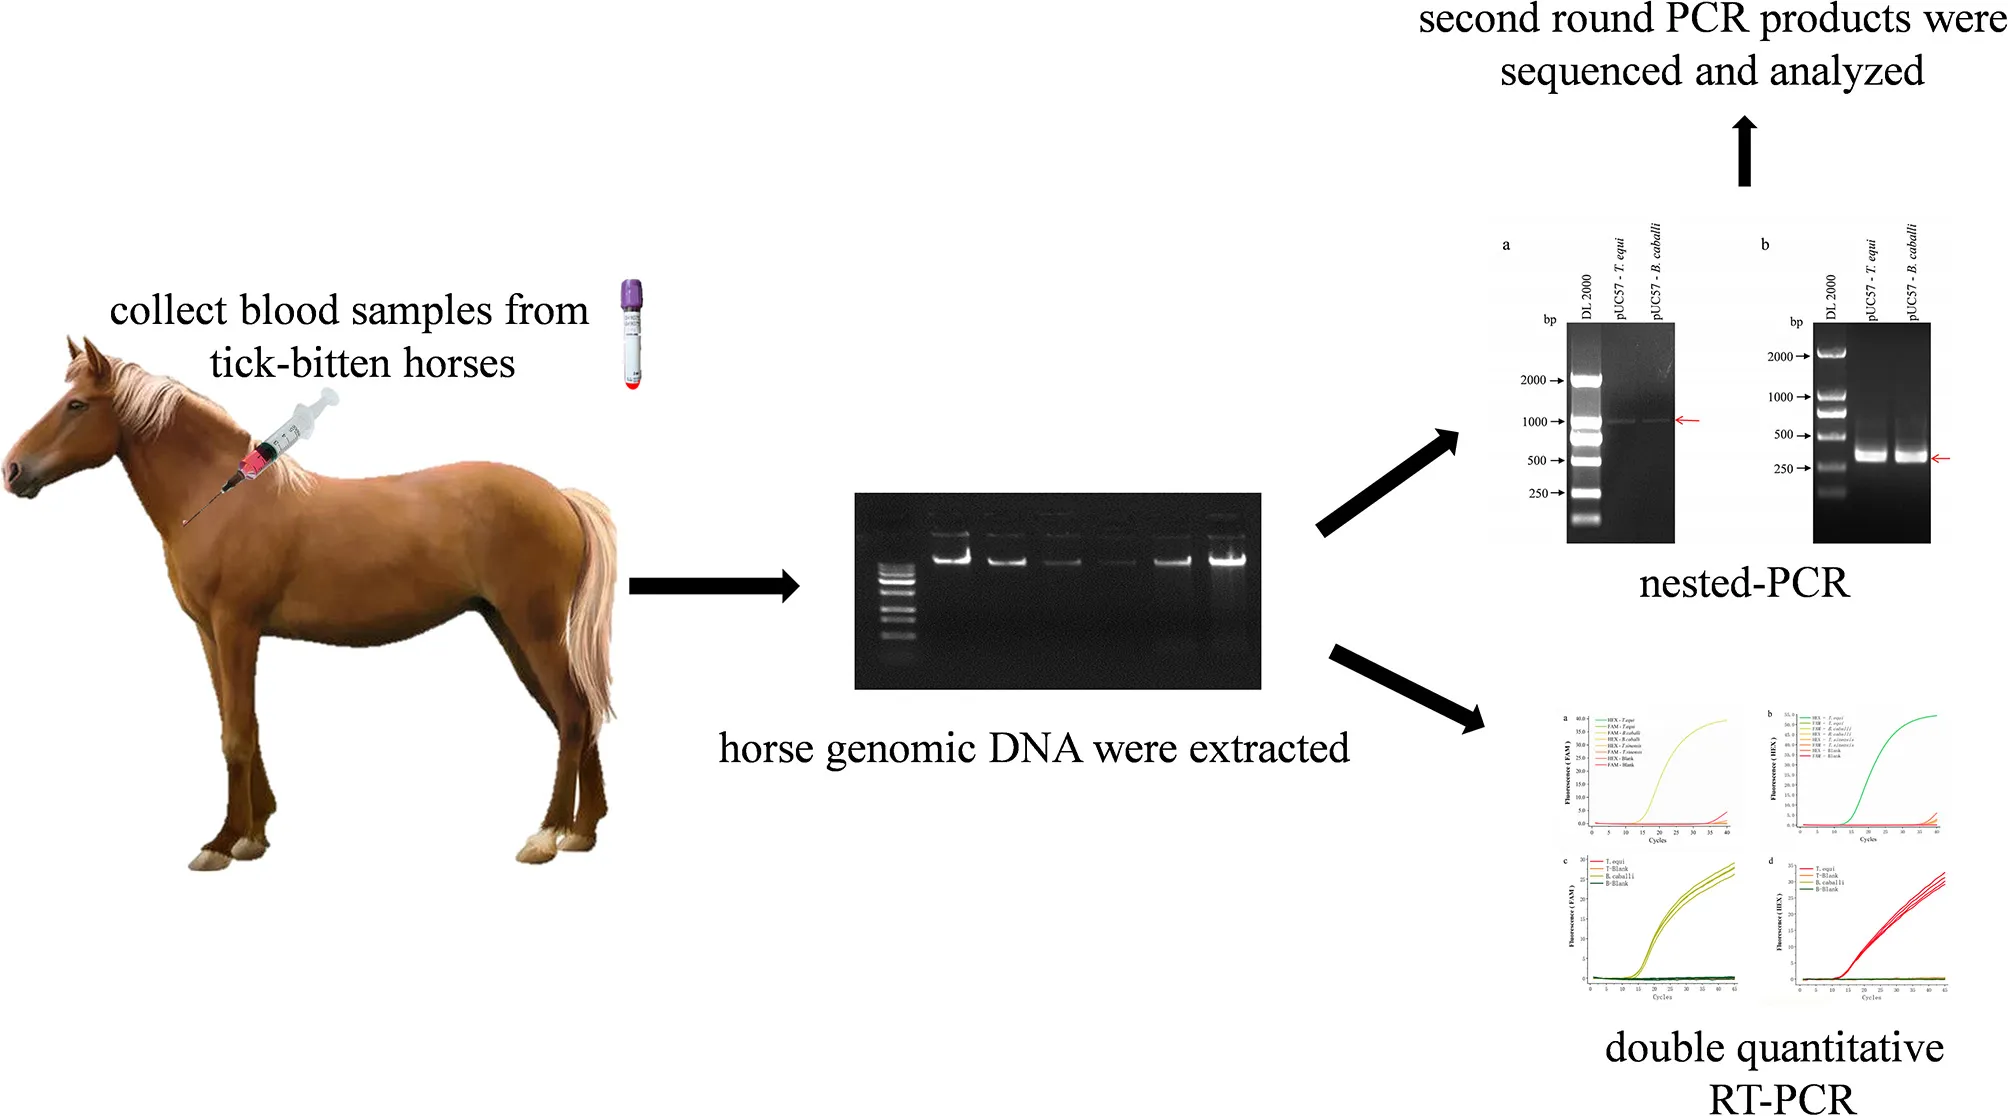
Schematic description of nested PCR and duplex real-time fluorescence quantitative PCR assay for simultaneous detection of B. caballi and T. equi in horse blood specimens.
Introduction
Equine piroplasmosis (EP) is a type of blood protozoan disease caused by the haemoprotozoan parasites, Theileria equi (T. equi), Babesia caballi (B. caballi) (1), and the newly identified species Theileria haneyi (2). EP can be characterized by fever, hemolytic anemia, hemoglobinuria, icterus, splenomegaly and occasionally death, resulting in significant economic loss to the equine industry (3, 4). Further, unwarranted quarantine of horses with EP can lead to restrictions in import and export trade of horses or their participation in international equestrian sports (4–6).
Disease transmission, epidemiology, severity and drug susceptibility of EP can vary greatly depending on whether infected by B. caballi and/or T. equi. Therefore, accurate parasite identification is important. Direct detection, which involves microscopic examination, blood smear staining, lymphatic tissue puncture and histological examination of lymph nodes (7), relies on the experience and proficiency of the examiner to determine parasite sensitivity and specificity. It also relies on parasitemia being high, which can mean less sensitive in the persistent stage of infection when parasitemia levels are generally very low (8, 9). Immunological diagnostic methods such as enzyme-linked immunosorbent assay (ELISA), complement fixation test (CFT), and indirect fluorescent antibody test (IFAT) are often used to diagnose carrier horses. Nowadays, there are many recombinant proteins used for ELISA diagnosis of EP. Among them, T. equi (EMA-1, EMA-2) and B. caballi (RAP-1, Bc48) which can be expressed in E. coli, yield good experimental results (10–13). CFT can accurately diagnose early infections with good sensitivity and specificity, but cannot be detected in individuals who have undergone drug treatment or have developed anti-complement reactions. IFAT is one of the methods recommended by World Organization for Animal Health and readily used in the diagnosis of clinical hosts with EP. However, the technique can exhibit antibody detection limitations and cross-reactivity issues, which can cause misdiagnosis.
Nucleic acid detection methods for B. caballi and T. equi, including nested PCR (nPCR), loop-mediated isothermal amplification and quantitative PCR (qPCR) (12, 14–16). These methods are based on amplifying specific sequences of T. equi and B. caballi and exhibit greater sensitivity than microscopic examination (17–19). Nested PCR is widely used to diagnose sub-clinical infections and help control the importation of infected animals and provide advice for medical treatment (19). Mahmoud et al. analyzed 139 equid blood samples for EP using nPCR and IFAT, respectively (17). IFAT positively identified EP in 48.9%, while nPCR positively identified 56.8%. Nardini et al. conducted a comparison between nPCR and another three PCR-based methods for the detection of EP in 103 field samples (20). Quantitative PCR exhibits high specificity, sensitivity and stability, and is widely used in the qualitative and quantitative detection of various pathogens. The target qPCR genomic site for EP include the EMA-1 gene of T. equi (21, 22) and the 48 kDa merozoite rhoptry protein (BC48) gene of B. caballi (23) or the 18S rRNA gene of T. equi and B. caballi (24–26). Lobanov et al. designed a duplex real-time quantitative PCR (duplex qPCR) method for the T. equi EMA-1 and B. caballi 18S rRNA genes (22). They verified the method using 362 samples of cELISA-negative horses and detected no false positives. Despite such progress in this field, there still remains a need for faster and more sensitive diagnostic methods for EP. Therefore, in this study, two techniques of nPCR and duplex fluorescence qPCR that could simultaneously detect T. equi and B. caballi in the diagnosis of EP were developed and compared.
Materials and Methods
Animals
The present study was conducted in April during a period of high incidence of equine piroplasmosis in 2019 at Ulan Butong Grassland of Chifeng City, Inner Mongolia Autonomous Region, China. Thirty-six tick-bitten malnourished Mongolia horses (4 stallions, 14 geldings and 18 mares) aged 6.7 ± 1.5 years and with mean live weight 286.5 ± 21.3 kg were used for the study. The general condition of horses were fully monitored by routine clinical examinations. The body condition score of horses ranged between 3 and 4, scored on a 9-point scale (1–9, where 1 represents lean minus and 9 represents fat plus), according to the guidelines described by Henneke et al. (27).
Blood Sample and DNA Collection
Blood samples were obtained from the jugular vein of the horses into 10 mL vacuum tubes containing ethylenediaminetetraacetic acid as an anticoagulant (BD Vacutainer, USA). All blood samples were stored in 4 °C and centrifuged for 10 min at 3,000 rpm at 4 °C to separate the red blood cells, and then kept frozen at −80 °C for further analyses.
DNA from 200 uL of red blood cells was extracted. The extraction was carried out using TaKaRa MiniBEST Universal Genomic DNA Extraction Kit Version 5.0 (Takara Biomedical Technology Co., Ltd, Dalian, China) according to the instructions. Standard negative blood samples were obtained from EP-free horses which were detected and confirmed negative using the method described in a previous study (28). Theileria sinensis DNA samples were donated by Heilongjiang Bayi Agricultural University.
Standard Positive Plasmid Preparation
18S rRNA coding sequences (Z15104.1 and Z15105.1) of B. caballi and T. equi (according to the sequence information published by GenBank) were synthesized using Nanjing Kingsley Biotechnology Co., Ltd., and cloned them into pUC57 vector, which were named pUC57-T. equi and pUC57-B. caballi, respectively.
Primers Design and Nested PCR
Based on the 18S rRNA gene sequence of T. equi (Z15105.1, DQ287951.1, EU642511.1, KM046918.1, KF559357.1, AY150063.2) and B. caballi (KY952238.1, KY952236.1, KY952233.1, AY309955.1, AY534883.1, Z15104.1) from GenBank, a set of primers were designed from the conserved regions shared by all gene sequences (Supplementary Figure 1) using Primer 5.0. Table 1 lists the designed internal and external nPCR primers.
Table 1
| Primer name | Sequence (5′–3′) | Amplicon Size (T/B bp)a | Product length (T/B bp)a | |
|---|---|---|---|---|
| First nested PCR primers outer | 18S Out - F | CACATCTAAGGAAGGCAGCA | 396/372 | 1016/986 |
| 18S Out - R | CAGGACATCTAAGGGCATCA | 1411/1357 | ||
| Second nested PCR primers inner | 18S In - F | TTGGAGGGCAAGTCTGGT | 530/505 | 368/341 |
| 18S In - R | TTTCGCAGTAGTTCGTCTTT | 897/845 |
Primer sequences of nested PCR for detecting T. equi and B. caballi.
“T” = T. equi; “B” = B. caballi.
The first round of nPCR was conducted in a 20 μL reaction system containing 10 μL of 2 × PCR Master Mix (Beyotime Biotechnology, Shanghai, China), 0.5 μL of each primer (18S Out – F, 10 μM; 18S Out – R, 10 μM), and 1 ng of a standard positive plasmid. A pre-denaturation step at 95 °C for 5 min was conducted and a total of 35 amplification cycles was performed. Each cycle consisted of denaturation at 95 °C for 15 s, annealing at 56 °C for 15 s, and extension at 72 °C for 30 s. A final extension was also included at 72 °C for 7 min in the PCR profile. In total 0.5 μL of the amplified products were used in the second round of the nPCR, also in a 20 μL reaction system, changing the primers to 18S In – F (10 μM) and 18S In – R (10 μM). The PCR reaction conditions and programs were same as in round one. The amplified products were electrophoresed in 4% agarose gels and the results were documented using the gel doc-IT2 imager system (UVP Inc, CA, USA).
Specificity and Sensitivity of Nested PCR
To determine detection specificity of nPCR, known standard positive plasmids were used for amplification, negative blood DNA samples and genomic DNA of T. sinensis were used as negative controls, and ddH2O was used as a blank control. To determine detection sensitivity, the standard positive plasmid was diluted into different concentrations (1 × 10⁻¹ to 1 × 10⁻⁸ ng/μL) and nPCR amplification were performed. The lowest detectable concentration was determined by observing agarose gel electrophoresis results of second round PCR products.
Detection of Horse Blood Samples by Nested PCR
Using nPCR, 36 horse blood samples were tested. The detection method was performed in triplicate, and second round PCR products were sequenced at Sangon Biotech Co. Ltd., Shanghai. Further, the same set of samples was also detected by a multinested PCR (mnPCR) targeting the EMA-1 gene of T. equi and the RAP-1 gene of B. caballi as previously described (15) and the primers were shown in Table 2.
Table 2
| Target species | Gene | Primer name | Sequence 5′–3′ | Amplicon Size (bp) | Reference | |
|---|---|---|---|---|---|---|
| First multi-nested PCR primers outer | T. equi | EMA-1 | EMA1-outer-R | TGTCGTCACTTAGTAAAATAGAG | 828 | Montes Cortés et al. (15) |
| EMA1-outer-F | ATGATTTCCAAATCCTTTGC | |||||
| B. caballi | RAP-1 | RAP1-outer-R | GCTTCATGTACCACTTCTTATAC | 891 | ||
| RAP1-outer-F | GCGCCCTCTTGCTYGTAG | |||||
| Second multi-nested PCR primers inner | T. equi | EMA-1 | EMA1-inner-R | TGTCCTTGATGTGCCTGAC | 274 | Montes Cortés et al. (15) |
| EMA1-outer-F | ATGATTTCCAAATCCTTTGC | |||||
| B. caballi | RAP-1 | RAP-1outer-R | GCTTCATGTACCACTTCTTATAC | 566 | ||
| RAP1-inner-F | GTACCAACCGCTGACCCTTC |
Primer sequences of multinested PCR for detecting T. equi and B. caballi.
Optimization of Primers and Probes for Duplex Real-Time Fluorescence Quantitative PCR
Table 3 lists the primer sequences and probes used in this study. Primers and probes were designed from the species-specific region of the 18S rDNA (Supplementary Figure 1), using Primer Express (version 3.0) and Primer (version 5.0) software. TaqMan probes with reporter dye 6-Carboxyfluorescein (FAM) or 5-Hexachloro-fluorescein (HEX) at the 5' end, and Black Hole Quencher-1(BHQ1) at the 3' end were labeled.
Table 3
| Primer and probes name | Sequence (5′–3′) |
|---|---|
| B. caballi-F | ACCTGCTAACTAGCTTCCCTTT |
| B. caballi-R | ACCTTTCGGAGCAGGAAAA |
| B. caballi-Probe | FAM-ACAGCTTGTCGCTGTAAAGTCCCTCT-BHQ1 |
| T. equi-F | AATTTCTGCTGTTTCGTTGACT |
| T. equi-R | TCTGGCTCCTAAAACCAACA |
| T. equi-Probe | HEX-ACCCAACCAAGCCGCAACGA-BHQ1 |
Sequence of primers and probes of duplex real-time fluorescence quantitative PCR for detecting T. equi and B. caballi.
Specificity and Sensitivity of Duplex Real-Time Fluorescence Quantitative PCR
To determine detection specificity of duplex fluorescence qPCR, a 50 μL reaction volume was used, containing 1 μL (20 pmol) of each forward and reverse primer, 0.5 μL (10 pmol) of TaqMan probes, 0.5 μL (1 × 10⁻¹ ng/μL) of standard positive plasmid, 25 μL of TaqMan™ Real-Time PCR Master Mixes (Thermo Fisher Scientific, MA, USA), and ddH2O to 50 μL. The following thermocycling program was used: 40–45 cycles of 95 °C for 15 s, 60 °C for 15 s, and 72 °C for 30 s with an initial cycle of 95 °C for 30 s, using the Roche LightCycler 480 real time PCR system (Hoffmann-La Roche Ltd, Basel, Schweiz). All amplifications and detections were conducted using a 96-well reaction plate with optical caps (Sangon Biotech, Shanghai, China). At each cycle, accumulation of PCR products were detected by monitoring the increase in reporter dye fluorescence of the TaqMan probes. To test sensitivity, the standard positive plasmid was diluted into different concentrations (1 × 10⁻¹ to 1 × 10⁻⁸ ng/μL) and the lowest detection efficiency and number of copies were determined.
Detection of Horse Blood Samples by Duplex Real-Time Fluorescence Quantitative PCR
The 36 horse blood samples consisted with those detected by nPCR were tested using duplex fluorescence qPCR, and were performed in triplicate.
Results
PCR Results of Standard Positive Plasmids
The nPCR products were analyzed of standard positive plasmids using agarose gel electrophoresis. First round amplification products of pUC57-T. equi and pUC57-B. caballi (using 18S Out primers) were about 1,000 bp in length, demonstrated by clear and complete electrophoretic bands of the amplified products (Figure 1A). Then, first-round amplification products were amplified a second time (with 18S In primers), revealing clear and bright electrophoretic bands at about 400 bp (Figure 1B).
Figure 1
Fragment lengths obtained from the amplification were consistent with the target product, indicating successful primer design. For further verification, the amplified products were sent to Shanghai Biotechnology Co., Ltd. for sequencing, which confirmed correct sequences. Therefore, the designed primers could be effectively used in subsequent experiments.
Specificity and Sensitivity of Nested PCR
Figure 1 shows a single band at the expected sizes following nPCR, indicating successful primer design. Moreover, Figure 2A shows the absence of a target band when primers were used with T. sinensis, suggesting primers are specific for EP detection. nPCR results, however, failed to easily distinguish the two T. equi and B. caballi pathogens by electrophoresis alone. To determine nPCR sensitivity, a 10-fold serial dilution of the standard positive plasmid (from an initial concentration of 1 ng/μL) was used. Using this method, standard positive plasmids at 1 × 10⁻¹ to 1 × 10⁻⁷ ng/μL could be detected (Figure 2B), indicating that the nPCR method has high sensitivity and can amplify DNA concentrations as low as 1 × 10⁻⁷ ng/μL.
Figure 2
Nested PCR and Multinested-PCR of Horse Blood Samples
Using nPCR, analysis of the 36 blood samples revealed 29 positive samples, demonstrating a positivity rate of 80.56%. Of the 29 positive samples, 21 were infected with T. equi, six with B. caballi, and two were mixed (Supplementary Figure 2, Table 4). This analysis was performed in triplicate, and showed the same results. Sequencing analysis of the nPCR products confirmed these results which showed that six were positive for B. caballi and 21 for T. equi, suggesting that nPCR can be an effective tool in detecting EP infection in clinical disease. However, to separate the 27 bp difference in PCR product of DNA from horse blood samples simultaneous infected with T. equi and B. caballi, electrophoresis with 4% agarose gels was needed. The mnPCR for the 36 blood samples showed that 22.22% of the blood samples (8/36) were positive for equine piroplasmids. The prevalence of infection for T. equi was 2.78% (1/36), and 19.44% (7/36) for B. caballi (Supplementary Figure 3, Table 4). The results mean that nPCR method is more sensitive when the parasitemia was low.
Table 4
| Clinical samples | Value of A260/A280 of DNA | Quantitative PCRb | Nested PCR | Sequencingc | Multi-nested PCR | ||||
|---|---|---|---|---|---|---|---|---|---|
| from clinical samples | |||||||||
| B. caballi | T. equi | B. caballi | T. equi | B. caballi | T. equi | B. caballi | T. equi | ||
| Sample 1 | 1.82 | − | + | − | + | − | + | − | − |
| Sample 2 | 1.83 | − | + | − | + | − | + | − | − |
| Sample 3 | 1.88 | − | − | + | − | + | − | + | − |
| Sample 4 | 1.81 | − | − | − | + | − | + | − | − |
| Sample 5 | 1.82 | − | − | − | + | − | + | − | − |
| Sample 6 | 1.83 | − | + | − | + | − | + | − | − |
| Sample 7 | 1.86 | − | + | − | + | − | + | − | − |
| Sample 8 | 1.84 | − | − | − | + | − | + | − | − |
| Sample 9 | 1.85 | − | − | − | + | − | + | − | − |
| Sample 10 | 1.86 | − | − | − | + | − | + | − | − |
| Sample 11 | 1.85 | − | + | − | + | − | + | − | − |
| Sample 12 | 1.85 | − | − | − | + | − | + | − | − |
| Sample 13 | 1.85 | − | − | − | + | − | + | − | − |
| Sample 14 | 1.81 | − | − | − | + | − | + | − | − |
| Sample 15 | 1.84 | − | + | − | + | − | + | − | + |
| Sample 16 | 1.83 | − | − | + | − | + | − | + | − |
| Sample 17 | 1.81 | − | + | − | + | − | + | − | − |
| Sample 18 | 1.95 | − | + | − | + | − | + | − | − |
| Sample 19 | 1.95 | + | − | + | − | + | − | + | − |
| Sample 20 | 1.84 | − | − | − | − | − | − | − | − |
| Sample 21 | 2.01 | − | − | − | + | − | + | − | − |
| Sample 22 | 1.84 | − | − | − | − | − | − | − | − |
| Sample 23 | 1.82 | + | + | + | + | + | + | + | − |
| Sample 24 | 1.85 | − | − | − | − | − | − | − | − |
| Sample 25 | 1.8 | − | − | + | − | + | − | + | − |
| Sample 26 | 1.83 | − | − | − | − | − | − | − | − |
| Sample 27 | 1.93 | − | + | − | + | − | + | − | − |
| Sample 28 | 1.84 | − | − | − | − | − | − | − | − |
| Sample 29 | 1.82 | − | − | + | − | + | − | + | − |
| Sample 30 | 1.84 | − | + | − | + | − | + | − | − |
| Sample 31 | 1.99 | − | − | − | + | − | + | − | − |
| Sample 32 | 1.8 | − | + | − | + | − | + | − | − |
| Sample 33 | 1.82 | − | + | + | + | + | + | − | − |
| Sample 34 | 1.8 | − | − | + | − | + | − | + | − |
| Sample 35 | 1.8 | − | − | − | − | − | − | − | − |
| Sample 36 | 1.83 | − | − | − | − | − | − | − | − |
Comparison of nested PCR, multi-nested PCR and duplex real-time fluorescence quantitative PCR for detecting equine piroplasmosisa.
“+” = positive; “-” = negative.
Quantitative PCR = duplex real-time fluorescence quantitative PCR.
Sequencing results mean the results of second round PCR products in nested PCR.
Specificity of Duplex Real-Time Fluorescence Quantitative PCR
An array of fluorescent probes and templates (Figures 3A,B) were initially tried, before deciding on HEX to label T. equi (using a detection wavelength range of 533–580 nm) and FAM to label B. caballi (using a detection wavelength range of 465–510 nm). Only a FAM-B. caballi amplification curve in the FAM panel (Figure 3A), and a HEX-T. equi amplification curve in the HEX panel were detected (Figure 3B).
Figure 3
The two different types of primers and probes were then added into one reaction vessel, changing only the template (Figures 3C,D). An amplification curve in the FAM panel was observed when B. caballi template was used (Figure 3C), and an amplification curve in the HEX panel when T. equi template was used (Figure 3D). These results indicate that the duplex fluorescence qPCR method demonstrates good specificity.
Sensitivity of Duplex Real-Time Fluorescence Quantitative PCR
The standard positive plasmid template was diluted into different concentrations (ng/μL): 1 × 10⁻¹, 1 × 10⁻², 1 × 10−3,1 × 10−4, 1 × 10⁻⁵, 1 × 10⁻⁶, 1 × 10⁻⁷, and 1 × 10⁻⁸, respectively, using 1 μL of template in each reaction system and sterile ddH2O as a blank control, and assayed the samples using duplex fluorescence qPCR. In the absence of a template, we failed to observe an amplification curve in either FAM or HEX panel (Figures 4A,B). When 1 × 10⁻⁷ and 1 × 10⁻⁸ ng/μL of template was used, we observed a weak amplification curve (Figures 4A,B). Figure 5 shows standard curves generated from combined data of these runs. The correlation coefficient of B. caballi was R2 = 0.996, and the standard curve equation was y = 16.39–3.1 log(x) (Figure 5A). The correlation coefficient of T. equi was R2 = 0.999, and the standard curve equation was y = 14.75–3.5 log(x) (Figure 5B). These results demonstrate that duplex fluorescence qPCR detected a minimum of 4.47 × 10² copies/μL, indicating that it can identify pathogenic EP species with high efficiency.
Figure 4
Figure 5
Duplex Real-Time Fluorescence Quantitative PCR of Horse Blood Samples
Using duplex fluorescence qPCR, analysis of the 36 blood samples revealed 14 infected samples (shown in Supplementary Figure 4, demonstrating a positivity rate of 38.89%. Of the 14 positive samples, 12 were infected with T. equi, one with B. caballi, and one was mixed (Table 4). Then, 36 samples were tested in triplicate using this method and the results were the same. Compared with the nPCR results, duplex fluorescence qPCR demonstrates lower sensitivity.
Discussion
Rapid and accurate identification of pathogens is the basis of animal disease control. In this study, 36 blood samples from EP clinically suspect horses were analyzed individually for T. equi and B. caballi, and a nPCR and a duplex fluorescence qPCR assay for simultaneous detection of both causative agents of EP were developed. We aimed to provide a convenient and economical PCR-based method for the diagnosis, epidemiological investigation, prevention and control of EP in clinical settings.
Nowadays, many methods have been developed for clinical diagnosis and detection of EP (5, 7, 29). Owing to its simple operation, low cost, convenience and fast detection, blood smear staining has remained the standard method in clinical EP diagnosis. However, the method requires skilled and experienced operators to distinguish mixed from isolated infections. Moreover, the technique cannot easily detect parasites when parasitemia is low, increasing the possibility of misdiagnosis (19). Serological diagnostic methods, such as CFT and IFAT, have been widely used in clinical and laboratory detection of EP (7, 14, 30). However, the preparation of recombinant proteins required by these methods is complex and the operation process can be complicated.
Biomolecular detection methods have developed rapidly in recent years. Particularly, owing to its high sensitivity and specificity, PCR technology has been established as the best method for detecting and differentiate EP (15, 26, 31). Previous studies have shown that nPCR is more sensitive and specific than traditional PCR in detecting EP (9, 16, 19). Nicolaiewsky et al. developed a nPCR for the detection of T. equi based on the merozoite antigen EMA-1 gene sequence (9). Other studies used a nPCR method based on EMA-1 and 18S rRNA or BC48 gene for the detection of T. equi and B. caballi, respectively (17, 20). In this study, we established a nPCR method, based on the homologous region of 18S rRNA gene sequence of T. equi and B. caballi, which could specifically and simultaneously detect EP. In addition, Montes Cortés et al. developed a mnPCR for simultaneous detection of the equine piroplasmids T. equi and B. caballi, by amplification of five genetic markers (15). The present study revealed that the nPCR was more sensitive than mnPCR targeting the EMA-1 gene of T. equi and the RAP-1 gene of B. caballi when the parasitemia was low. Herein, nPCR is convenient with a low cost ($0.8 per sample) and takes about 3 h. However, this method required a 4% gel to separate the 27 bp difference in PCR product.
In the present study, we also established a duplex real-time fluorescence quantitative PCR method that only takes about 1h and costs less than $4, which used single-target 18S rRNA gene for the simultaneous detection of T. equi and B. caballi. In contrast to Lobanov et al., who used a duplex real-time qPCR method based on two different genes (EMA-1 and 18S rRNA) for the detection of both causative agents of EP (22), we designed and synthesized a pair of specific primers and fluorescent probes according to the 18S rRNA sequence of T. equi and B. caballi, respectively. We labeled the fluorescent probes corresponding to T. equi with HEX fluorescein, and the fluorescent probes corresponding to B. caballi with FAM fluorescein. By using two fluorescent probes and two pairs of primers simultaneously in a reaction system, this method could successfully detect and distinguish the two pathogens of EP. Unfortunately, the method failed to detect at low parasitemia levels, which may be because most of the genomic DNA remained contained in the horse blood DNA sample, and only one round of PCR was used. Importantly, both methods revealed PCR products consistent with DNA sequencing results.
Conclusion
Nested PCR method detected T. equi and B. caballi positive samples and mixed samples with good specificity and sensitivity, it is really a convenient and economical method, especially for some economically underdeveloped countries. Meanwhile, our duplex fluorescence qPCR detection method successfully detected and distinguished T. equi and B. caballi, although with low sensitivity, as it could only identify the two parasite strains when parasitemia was high. Altogether, these methods have potential to provide effective technical support for the diagnosis, epidemiological investigation, prevention and control of EP in clinical settings.
Funding
This study was supported by CAMS Innovation Fund for Medical Sciences (CIFMS) (Grant No. 2019-I2M-5-042) and the Foundation of Shenyang Science and Technology Transformation Project (Grant No. 21-116-3-39).
Publisher's Note
All claims expressed in this article are solely those of the authors and do not necessarily represent those of their affiliated organizations, or those of the publisher, the editors and the reviewers. Any product that may be evaluated in this article, or claim that may be made by its manufacturer, is not guaranteed or endorsed by the publisher.
Statements
Data availability statement
The original contributions presented in the study are included in the article/Supplementary Material, further inquiries can be directed to the corresponding author/s.
Ethics statement
The animal study was reviewed and approved by The Ethical Committee of Shenyang Agricultural University approved the laboratory animal experiments (Permit No. SYXK2011-0001). Written informed consent was obtained from the owners for the participation of their animals in this study.
Author contributions
KL and YZ performed the experiments. YY participated in data analysis. ZL helped with sampling and experiments. LD and YZ edited the manuscript. All authors read and approved the final manuscript.
Conflict of interest
The authors declare that the research was conducted in the absence of any commercial or financial relationships that could be construed as a potential conflict of interest.
Supplementary material
The Supplementary Material for this article can be found online at: https://www.frontiersin.org/articles/10.3389/fvets.2022.873190/full#supplementary-material
References
1.
GuidiEPradierSLebertILeblondA. Piroplasmosis in an endemic area: analysis of the risk factors and their implications in the control of Theileriosis and Babesiosis in horses. Parasitol Res. (2015) 114:71–83. 10.1007/s00436-014-4161-9
2.
KnowlesDPKappmeyerLSHaneyDHerndonDRFryLMMunroJBet al. Discovery of a novel species, Theileria haneyi n. sp, infective to equids, highlights exceptional genomic diversity within the genus Theileria: Implications for apicomplexan parasite surveillance. Int J Parasitol. (2018) 48:679–90. 10.1016/j.ijpara.2018.03.010
3.
EleluN. Tick-borne relapsing fever as a potential veterinary medical problem. Vet Med Sci. (2018) 4:271–9. 10.1002/vms3.108
4.
ShortMAClarkCKHarveyJWWenzlowNHawkinsIKAllredDRet al. Outbreak of equine piroplasmosis in Florida. J Am Vet Med Assoc. (2012) 240:588–95. 10.2460/javma.240.5.588
5.
Tirosh-LevySGottliebYFryLMKnowlesDPSteinmanA. Twenty years of equine piroplasmosis research: global distribution, molecular diagnosis, and Phylogeny. Pathogens. (2020) 9:926. 10.3390/pathogens9110926
6.
KerberCEFerreiraFPereiraMC. Control of equine piroplasmosis in Brazil. Onderstepoort J Vet Res. (1999) 66:123–7.
7.
LempereurLBeckRFonsecaIMarquesCDuarteASantosMet al. Guidelines for the detection of Babesia and Theileria parasites. Vector-Borne Zoonotic Dis. (2017) 17:51–65. 10.1089/vbz.2016.1955
8.
BashiruddinJBCammaCRebeloE. Molecular detection of Babesia equi and Babesia caballi in horse blood by PCR amplification of part of the 16S rRNA gene. Vet Parasitol. (1999) 84:75–83. 10.1016/S0304-4017(99)00049-7
9.
NicolaiewskyTBRichterMFLungeVRCunhaCWDelagostinOIkutaNet al. Detection of Babesia equi (Laveran, 1901) by nested polymerase chain reaction. Vet Parasitol. (2001) 101:9–21. 10.1016/S0304-4017(01)00471-X
10.
XuanXLarsenAIkadaiHTanakaTIgarashiINagasawaHet al. Expression of Babesia equi merozoite antigen 1 in insect cells by recombinant baculovirus and evaluation of its diagnostic potential in an enzyme-linked immunosorbent assay. J Clin Microbiol. (2001) 39:705–9. 10.1128/JCM.39.2.705-709.2001
11.
UetiMWPalmerGHKappmeyerLSScolesGAKnowlesDP. Expression of equi merozoite antigen 2 during development of Babesia equi in the midgut and salivary gland of the vector tick Boophilus microplus. J Clin Microbiol. (2003) 41:5803–9. 10.1128/JCM.41.12.5803-5809.2003
12.
BhooraRQuanMZweygarthEGuthrieAJPrinslooSACollinsNE. Sequence heterogeneity in the gene encoding the rhoptry-associated protein-1 (RAP-1) of Babesia caballi isolates from South Africa. Vet Parasitol. (2010) 169:279–88. 10.1016/j.vetpar.2010.01.009
13.
IkadaiHXuanXIgarashiITanakaSKanemaruTNagasawaHet al. Cloning and expression of a 48-kilodalton Babesia caballi merozoite rhoptry protein and potential use of the recombinant antigen in an enzyme-linked immunosorbent assay. J Clin Microbiol. (1999) 37:3475–80. 10.1128/JCM.37.11.3475-3480.1999
14.
BruningAPhippsPPosnettECanningEU. Monoclonal antibodies against Babesia caballi and Babesia equi and their application in serodiagnosis. Vet Parasitol. (1997) 68:11–26. 10.1016/S0304-4017(96)01074-6
15.
Montes CortésMGFernandez-GarciaJLHabela Martinez-EstellezMÁ. A multinested PCR for detection of the equine piroplasmids Babesia caballi and Theileria equi. Ticks Tick Borne Dis. (2019) 10:305–13. 10.1016/j.ttbdis.2018.11.008
16.
AlhassanAPumidonmingWOkamuraMHirataHBattsetsegBFujisakiKet al. Development of a single-round and multiplex PCR method for the simultaneous detection of Babesia caballi and Babesia equi in horse blood. Vet Parasitol. (2005) 129:43–9. 10.1016/j.vetpar.2004.12.018
17.
MahmoudMSEl-EzzNTAbdel-ShafySNassarSANamakyAEKhalilWBet al. Assessment of Theileria equi and Babesia caballi infections in equine populations in Egypt by molecular, serological and hematological approaches. Parasite Vector. (2016) 9:260. 10.1186/s13071-016-1539-9
18.
MalekifardFTavassoliMYakhchaliMDarvishzadehR. Detection of Theileria equi and Babesia caballi using microscopic and molecular methods in horses in suburb of Urmia, Iran. Vet Res Forum. (2014) 5:129–33.
19.
RampersadJCesarECampbellMDSamlalMAmmonsD. A field evaluation of PCR for the routine detection of Babesia equi in horses. Vet Parasitol. (2003) 114:81–7. 10.1016/S0304-4017(03)00129-8
20.
NardiniRBartolomé Del PinoLECersiniAMannaGViolaMRAntognettiVet al. Comparison of PCR-based methods for the detection of Babesia caballi and Theileria equi in field samples collected in Central Italy. Parasitol Res. (2021) 120:2157–64. 10.1007/s00436-021-07153-4
21.
BhooraRQuanMMatjilaPTZweygarthEGuthrieAJCollinsNE. Sequence heterogeneity in the equi merozoite antigen gene (ema-1) of Theileria equi and development of an ema-1-specific TaqMan MGBTM assay for the detection of T. equi. Vet Parasitol. (2010) 172:33–45. 10.1016/j.vetpar.2010.04.025
22.
LobanovVAPeckleMMassardCLScandrettWBGajadharAA. Development and validation of a duplex real-time PCR assay for the diagnosis of equine piroplasmosis. Parasite Vector. (2018) 11:125. 10.1186/s13071-018-2751-6
23.
HeimAPassosLMRibeiroMFCosta-JúniorLMBastosBVCabralDDet al. Detection and molecular characterization of Babesia caballi and Theileria equi isolates from endemic areas of Brazil. Parasitol Res. (2007) 102:63–8. 10.1007/s00436-007-0726-1
24.
KimCMBlancoLBAlhassanAIsekiHYokoyamaNXuanXet al. Diagnostic real-time PCR assay for the quantitative detection of Theileria equi from equine blood samples. Vet Parasitol. (2008) 151:158–63. 10.1016/j.vetpar.2007.10.023
25.
BhooraRVPienaarRCorneliusFJosemansAMattheeOMarumoRet al. Multiplex hydrolysis-probe assay for the simultaneous detection of Theileria equi and Babesia caballi infections in equids. Vet Parasitol. (2018) 255:61–8. 10.1016/j.vetpar.2018.03.022
26.
BhooraRQuanMFranssenLButlerCMKolkJHGuthrieAJet al. Development and evaluation of real-time PCR assays for the quantitative detection of Babesia caballi and Theileria equi infections in horses from South Africa. Vet Parasitol. (2010) 168:201–11. 10.1016/j.vetpar.2009.11.011
27.
HennekeDRPotterGDKreiderJLYeatesBF. Relationship between condition score, physical measurements and body fat percentage in mares. Equine Vet J. (1983) 15:371–2. 10.1111/j.2042-3306.1983.tb01826.x
28.
LeiRWangXZhangDLiuYChenQJiangN. Rapid isothermal duplex real-time recombinase polymerase amplification (RPA) assay for the diagnosis of equine piroplasmosis. Sci Rep. (2020) 10:4096. 10.1038/s41598-020-60997-1
29.
HirataHXuanXYokoyamaNNishikawaYFujisakiKSuzukiNet al. Identification of a specific antigenic region of the P82 protein of Babesia equi and its potential use in serodiagnosis. J Clin Microbiol. (2003) 41:547–51. 10.1128/JCM.41.2.547-551.2003
30.
BoseRJorgensenWKDalglieshRJFriedhoffKTVosAJ. Current state and future trends in the diagnosis of babesiosis. Vet Parasitol. (1995) 57:61–74. 10.1016/0304-4017(94)03111-9
31.
ElsawyBMNassarAMAlzanHFBhooraRVOzubekSMahmoudMSet al. Rapid detection of equine piroplasms using multiplex PCR and first genetic characterization of Theileria haneyi in Egypt. Pathogens. (2021) 10:1414. 10.3390/pathogens10111414
Summary
Keywords
equine piroplasmosis, Theileria equi, Babesia caballi, nested PCR, duplex real-time fluorescence quantitative PCR, simultaneous detection
Citation
Lv K, Zhang Y, Yang Y, Liu Z and Deng L (2022) Development of Nested PCR and Duplex Real-Time Fluorescence Quantitative PCR Assay for the Simultaneous Detection of Theileria equi and Babesia caballi. Front. Vet. Sci. 9:873190. doi: 10.3389/fvets.2022.873190
Received
10 February 2022
Accepted
26 April 2022
Published
18 May 2022
Volume
9 - 2022
Edited by
Theo De Waal, University College Dublin, Ireland
Reviewed by
Longxian Zhang, Henan Agricultural University, China; Deepak Sumbria, The University of Tennessee, United States
Updates
Copyright
© 2022 Lv, Zhang, Yang, Liu and Deng.
This is an open-access article distributed under the terms of the Creative Commons Attribution License (CC BY). The use, distribution or reproduction in other forums is permitted, provided the original author(s) and the copyright owner(s) are credited and that the original publication in this journal is cited, in accordance with accepted academic practice. No use, distribution or reproduction is permitted which does not comply with these terms.
*Correspondence: Liang Deng ldeng@syau.edu.cn
†These authors have contributed equally to this work
This article was submitted to Parasitology, a section of the journal Frontiers in Veterinary Science
Disclaimer
All claims expressed in this article are solely those of the authors and do not necessarily represent those of their affiliated organizations, or those of the publisher, the editors and the reviewers. Any product that may be evaluated in this article or claim that may be made by its manufacturer is not guaranteed or endorsed by the publisher.