 Gianluigi Rossi1,2*
 Barbara Bo-Ju Shih1
 Nkongho Franklyn Egbe3
 Paolo Motta4
 Florian Duchatel1
 Robert Francis Kelly5
 Lucy Ndip6,7
 Melissa Sander8
 Vincent Ngwang Tanya9
 Samantha J. Lycett1,2
 Barend Mark Bronsvoort1,2
 Adrian Muwonge1
- 1The Roslin Institute, R(D)SVS, University of Edinburgh – Easter Bush Campus, Midlothian, United Kingdom
- 2Centre of Expertise on Animal Diseases Outbreaks, EPIC, Edinburgh, United Kingdom
- 3School of Life Sciences, University of Lincoln, Brayford Pool, Lincoln, United Kingdom
- 4The Food and Agriculture Organization of the United Nations, Regional Office for Asia and the Pacific, Bangkok, Thailand
- 5Royal (Dick) School of Veterinary Studies and the Roslin Institute, University of Edinburgh, Easter Bush, Midlothian, United Kingdom
- 6Laboratory for Emerging Infectious Diseases, University of Buea, Buea, Cameroon
- 7Department of Biomedical Sciences, Faculty of Health Sciences, University of Buea, Buea, Cameroon
- 8Tuberculosis Reference Laboratory, Bamenda, Cameroon
- 9Cameroon Academy of Sciences, Yaoundé, Cameroon
When studying the dynamics of a pathogen in a host population, one crucial question is whether it transitioned from an epidemic (i.e., the pathogen population and the number of infected hosts are increasing) to an endemic stable state (i.e., the pathogen population reached an equilibrium). For slow-growing and slow-evolving clonal pathogens such as Mycobacterium bovis, the causative agent of bovine (or animal) and zoonotic tuberculosis, it can be challenging to discriminate between these two states. This is a result of the combination of suboptimal detection tests so that the actual extent of the pathogen prevalence is often unknown, as well as of the low genetic diversity, which can hide the temporal signal provided by the accumulation of mutations in the bacterial DNA. In recent years, the increased availability, efficiency, and reliability of genomic reading techniques, such as whole-genome sequencing (WGS), have significantly increased the amount of information we can use to study infectious diseases, and therefore, it has improved the precision of epidemiological inferences for pathogens such as M. bovis. In this study, we use WGS to gain insights into the epidemiology of M. bovis in Cameroon, a developing country where the pathogen has been reported for decades. A total of 91 high-quality sequences were obtained from tissue samples collected in four abattoirs, 64 of which were with complete metadata. We combined these with environmental, demographic, ecological, and cattle movement data to generate inferences using phylodynamic models. Our findings suggest M. bovis in Cameroon is slowly expanding its epidemiological range over time; therefore, endemic stability is unlikely. This suggests that animal movement plays an important role in transmission. The simultaneous prevalence of M. bovis in co-located cattle and humans highlights the risk of such transmission being zoonotic. Therefore, using genomic tools as part of surveillance would vastly improve our understanding of disease ecology and control strategies.
1. Introduction
In the last two decades, the increased availability, efficiency, and reliability of genomic reading techniques, such as whole-genome sequencing (WGS) techniques, have ignited a profound transformation in understanding disease ecology and epidemiology. This, coupled with improved statistical methodologies and high-performance computing, has enhanced our understanding of pathogen dynamics and evolution (1).
Techniques such as WGS can identify polymorphisms in the genetic material, which is generated by transcription errors that can occur to the pathogen while replicating within their host (2). As the pathogen is transmitted through the host population, the accumulation of polymorphisms in its DNA/RNA can be used as a “transmission signature”. Therefore, by tracking these mutations across bacterial genomes sampled in a host population, we are now able to infer transmission events between individual hosts, sub-populations, geographical areas, or species, while at the same time, we are able to gather insights about the evolutionary trajectory of a pathogen (2). Furthermore, when accurate spatial information on the sampled isolates is available, we can combine it with pathogen genetic data to disentangle the spatiotemporal dynamics of outbreaks, particularly in natural or other scarcely sampled animal populations (3).
Despite these advances, many challenges still exist, including the reconciliation between the temporal signal of outbreaks with pathogen mutations (4). Mycobacterium tuberculosis Complex (MTBC) members are clonal species, and therefore, recombination has been considered rare [although a recent publication showed otherwise (5)]. A few mutations are expected to occur for these species per year, generating little diversity during outbreaks in host populations. Consequently, there is inherent uncertainty in establishing infection patterns within the infected population and their associated infections. Therefore, combining genomic information with metadata is essential for accurate transmission chain estimation (4).
Mycobacterium bovis, a member of the MTBC group, is the etiological agent of animal or bovine tuberculosis (bTB) in bovids and other mammalians and of zoonotic tuberculosis (TB) in humans (6). Its infections are characterized by chronic disease, with or without a latent period, where infected cattle are hard to identify, making it hard to quantify potential infectious contacts (7). The estimation of M. bovis prevalence is often affected by several factors, including the inaccuracy of diagnostic tests (8), and the potential co-infection with other pathogens (9). Such challenges explain why M. bovis has only been successfully eliminated or controlled in a few countries. However, it still represents a significant threat to cattle industries and human health in many other countries. For example, zoonotic tuberculosis due to M. bovis is a major public health problem in low- and medium-income countries (LMICs), where close interaction between people and livestock is common and the access to pasteurized milk is limited (6, 10). Indeed, the magnitude of this burden is likely underestimated since human–animal transmission is predominantly via ingestion of infected products and it presents with a range of non-specific symptoms (11).
In Cameroon, M. bovis is circulating in the cattle population, both in the southern areas (12) and, in particular, in the northern regions, where a previous study on cattle sampled at four regional abattoirs showed a sampled population prevalence ranging from 2.75% (31 positive over 1,129 cattle inspected, Northwest) to 21.25% [34 over 160, North (13)]. Abattoirs surveillance, where carcasses are inspected for TB-like lesions, is the only surveillance strategy regularly implemented in the country; in Bamenda (Northwest region), Awah-Ndukum et al. (14) showed that the TB-like lesion in cattle increased in the period from 1994 to 2010.
Commonly to many LMICs, bTB control in Cameroon is also made difficult by the absence of detailed records on cattle population, by local rearing practices such as pastoralism which expose animals to contact with other herds and potential reservoir wildlife species, and by the transhumance cattle movements westward toward Nigeria, where the demand of meat is driven by a fast human population increase (15).
In a previous study, Egbe et al. (15) employed two molecular typing techniques to understand the relatedness of M. bovis strains circulating in the region. These are spoligotyping and MIRU-VNTR typing as follows: the former is based on the presence of multiple spacer oligonucleotides in the genome direct repeat region, while the latter is based on 12 loci containing variable numbers of tandem repeats of mycobacterial interspersed repetitive units (16, 17). Compared with WGS, these techniques consider a limited genome region and can be more subject to homoplasy (18). The results reported by Egbe (15) showed that most of the isolates belonged to the Af1 clonal complex (n = 250/total n = 255), while the remaining ones had an unidentified clonal complex. They also highlighted an unexpectedly high genetic diversity, as showed by the 37 sampled spoligotypes, of which, 19 were newly observed, and a total of 97 genotypes were obtained by combining spoligotypes with MIRU-VNTR (15).
While those techniques are instrumental to investigating potential infection clusters at a broader level, they can be limited for a more in-depth understanding of the spatiotemporal dynamics of the disease. This study aimed to fill these gaps and enhance our understanding of the M. bovis epidemiology and spatial dynamics in Cameroon using WGS. We applied novel phylogenetic techniques to determine whether there was endemic stability across Cameroon's cattle-rearing regions while examining the role of environmental and ecological variables and animal movements in the pathogen spread.
We used 91 high-quality M. bovis sequences obtained from cattle tissues sampled at regional abattoirs as described by Egbe et al. (13). After determining the single nucleotide polymorphisms (SNPs), we built a tree by joining the Cameroonian WGSs with other African sequences obtained from publicly available repositories, in order to understand how the sampled population fit in the continent context. Then, we ran a continuous space phylogeographical analysis with BEAST (19) on the Cameroonian sequences while testing different random walk diffusion models (20). This was possible because the origin village of the cattle tested at the abattoir was known for 64 M. bovis cattle isolates, allowing us to associate spatial coordinates with these sequences. Furthermore, we tested the association between the spatial pathogen distribution obtained with the georeferenced phylogenetic tree and environmental, anthropic, and ecological factors (21), and we finally ran a machine learning analysis to test whether the empirical cattle movement network (22) or other variables could explain the genetic diversity across isolates.
Our findings strengthen the call for improved M. bovis molecular surveillance in underrepresented regions and countries, to gather insights into potential patterns that can be missed when limiting the studies to areas of low genetic diversity, the consequence of strict control practices such as test-and-cull.
2. Materials and methods
2.1. Data collection
Four regional abattoirs were sampled between 2012 and 2013, in the Northwest (Bamenda), Adamawa (Ngaoundere), North (Garoua), and Extreme North (Maroua) regions of Cameroon (Supplementary Figure 1). As part of the regular operations, cattle carcasses were inspected for the presence of TB-like lesions. The tissues, including lymph nodes, of all animals with lesions and of some randomly chosen ones without lesions were collected to be cultured, and information about the animal (age, breed, and village of provenance, among others) was taken. A detailed description of the data collection and bacterial isolation can be found in the study by Egbe et al. (13). The DNA extraction was conducted in BSL 3 facilities (Tuberculosis Reference Laboratories in Bamenda, Cameroon), and the procedure is fully described in the study by Egbe et al. (15). Sequencing was also attempted for M. bovis isolates sampled in human hosts at the Bamenda hospital (Northwest region) during a cross-sectional study within the wider project. We reported a summary of the number of sampled animals and the number of M. bovis-positive ones in Supplementary Table 1.
2.2. Whole-genome sequencing processing
The sequencing was carried out at Edinburgh Genomic Facilities (University of Edinburgh). Samples were prepared with 1 TruSeq Nano 550 bp insert, 76 Pippin selected library from the supplied genomic DNA, while MiSeq v2 (Illumina) was used to generate 250 base paired-end sequences from the library to yield at least 11M + 11M reads (1 run) at 30x coverage. The output was read from a 4-lane Miseq. A total of 124 M. bovis WGSs were obtained (two from human hosts), while for nine isolates (one from human hosts), the sequencing failed.
We used an adapted BovTB-nf pipeline (23) for quality control. Reads were deduplicated using fastuniq, trimmed using Trimmomatics (24) (-phred33 ILLUMINACLIP:$adapters:2:30:10 SLIDINGWINDOW:10:20 MINLEN:36), and mapped to the reference genome using bwa-mem2 (25). The mapped reads were filtered (-ShuF 2308 -) and sorted using Samtools (26), and then classified using Kraken2 (27) (–quick) against a prebuilt Kraken 2 database [Minikraken v2 (27)]. The Kraken2 output was summarized with Bracken (28) (-r 150 -l S), and the top 20 species from the Bracken output were used to determine if the sample was contaminated with other microorganisms. Variants were called using bcftools (29) (–IndelGap 5 -e ‘DP < 5 && AF < 0.8'), and strain-specific SNPs were used for classifying whether the samples were M. bovis or not [custom script and differentiating SNPs taken from the study mentioned in MMMO (23)]. The percentage of coverage (>60%) on the reference, read depth (>10), and number of reads (> 600,000) were used to identify and remove samples with insufficient data. To curate aligned core-variants for the downstream phylogenetic analysis, variants were called and filtered using Snippy v4.6.0 (30), using the default settings (minimum coverage = 10, minimum VCF variant call quality = 100), with the M. bovis AF2122/97 genome (GenBank: LT708304.1) as the reference genome. Variants from repeated regions were removed [mask for repetitive regions taken from the study mentioned in MMMO (23)]. Core-SNPs were determined by the snippy-core function within Snippy, where a genomic position was considered to be a core-site when present in all samples. We defined “high-quality” sequences as the ones with genome coverage > 90% and reading depth > 10 (31), and we renamed the sequences with a string composed of the following information: host species, location (administrative subdivision or country, see Section 2.3), sequential number, and date.
For each sequence, the spoligotype and the clonal complex were retrieved from the study by Egbe et al. (15). In one case, a sequence was missing the spoligotype number; however, it was assessed with the vSNP pipeline (32). For all bioinformatics tools, we used the default settings unless stated otherwise.
We checked if divergent sequences belonged to other mycobacteria species. We tested the presence of regions of difference (RDs) 1, 4, 9, and 12 patterns (33) in the outlier samples, and raw reads from each sample were aligned to M. tuberculosis (NC_000962.3) with Burrows-Wheeler Aligner v0.7.17 (34) and sorted and indexed with SAMtools v1.10 (35). Primer flanking regions for the RDs on M. tuberculosis were determined by querying the sequences using NCBI web nucleotide BLAST with the default parameters (36), while the presence of RDs was manually determined by examining the read alignment in Integrative Genomics Viewer v2.14.1 (37).
2.3. Cameroonian M. bovis sequences in the African context
We obtained other M. bovis genomes from online repositories as follows: first, from the Patric (now, BV-BRC) dataset (38), and second, selecting the appropriate genomes among the ones listed by Loiseau et al. (39) and obtained from the EBI dataset (for details and references, see Supplementary Table 2). We selected all the available sequences sampled in Africa, in order to qualitatively detect potential genetic similarities between the sampled Cameroonian M. bovis population and other isolates from the African continent, and thus provide a broader context to our analysis.
When analyzing sequences from Patric, genomes were shredded into pseudo by Snippy, followed by the process of alignment and SNP identification described above. The core-SNP alignments were made with and without the other African genomes. We used the iqtree web server (40, 41) to compute a phylogenetic tree (n = 212), which included all the Cameroonian high-quality sequences (n = 91) and the other African ones plus the 1997 reference from the UK (n = 121).
2.4. Cameroonian sequences phylogenetic analysis
The quantitative analyses were performed on a subsample of the Cameroonian sequences, obtained after removing the non-cattle ones, the ones missing the geographical coordinates and potential outliers, i.e., isolates not clustering within the main Cameroonian clade. We initially joined the remaining sequences (n = 64) of the tree using the TN93 genetic distance model and the neighbor-joining (NJ) algorithm ape package (42) in R v4.0.5 (43),
with the sole purpose of estimating a temporal signal within the sample in TempEst v1.5.3 (44). We, then, used the sequences SNP alignment completed with sampling dates, to infer time-scaled phylogenetic trees using BEAST v1.10.4 (19) with the BEAGLE library (45) and evaluated the results with Tracer v1.7.2 (46). Since the sequences had associated geographical location metadata, we included latitudes and longitudes as an additional continuous space variable for phylogeographic inference.
To select the best model, we ran a series of exploratory models using an HKY (47) substitution model, similar to other studies (48–50) and a strict molecular clock. First, we sequentially selected the best continuous trait model and then the best bacterial population size model (tree prior). We tested the Brownian random walk, Cauchy Relaxed Random Walk (RRW), lognormal RRW, and Gamma RRW for the former, and constant population, exponential growth, and Bayesian Skygrid (51, 52) for the latter. In the exploratory BEAST runs, we chose a truncated (between 0 and 0.1) normally distributed clock rate prior, with mean and standard deviation set as the slope in the root-to-tip obtained in Tempest; the chain length was set to 108 and sampled every 104 steps. The models were compared using marginal likelihood estimation (MLE), with path sampling (PS) and stepping-stone sampling (SS), if they reached a satisfactory effective sample size (>200). Once the model features were selected, we ran a final one setting the chain length to 109 steps and sampled every 105 steps. In this case, we used the clock rate posterior of the selected exploratory model as a prior for the final model. The maximum clade credibility (MCC) tree was extracted with TreeAnnotator v1.10.4 (part of the BEAST suite), and clades were visually defined within the MCC tree branches. The MCC tree was plotted against the sequence spoligotype and MIRU-VNTR typing to visually assess the correspondence between molecular typing and clades.
2.5. Spatial statistics and environmental factors analysis
From the final BEAST run, we extracted a set of 100 trees from the posterior distribution and further analyzed using seraphim v1.0 (21, 53), to obtain the spatial spread statistics: branch velocity and epidemic wavefront. The former was calculated for each branch dividing the geographical distance from the origin to the destination nodes by the time branch time duration. The epidemic wavefront shows the geographical range of the epidemic over time: at each time, it is calculated as the geographical distance between the positions of the tree's estimated root and the most distant node (spatial distance wavefront) or accounting for the distance of nodes closer to the root (patristic distance wavefront).
Additionally, seraphim allows to statistically test hypothesis on the effect of environmental layers on the epidemic dynamics; the effect can either be of “conductance”, when the layer favors the pathogen diffusion, or “resistance”, when the layer hampers it. We tested nine layers as follows: elevation, cattle population density, human population density, two describing the road infrastructure (number of intersections and total road length), and four land cover types (waterbodies, forest, grassland, and grazeland, and other vegetation types, such as mosaic, shrub, and sparse vegetation). The original raster layers were downloaded from online repositories (see Supplementary Table 3 for the sources) and adapted to a 5 km × 5 km grid using QGIS v3.26.1. For each cell, elevation, cattle, and human populations were averaged for the 5 × 5 km grids, while road intersections were counted, and road lengths were measured starting from the same road original raster. For the land cover, each value represents the percentage of that cell covered by each land cover type. The original land cover raster included 38 different cover types. To ease computation, we selected the most relevant for the study and merged them into four layers as follows: waterbodies, forest, cropland/grassland, and other vegetation, including mosaic, shrub, and partial cover (Supplementary Table 4).
First, we ran a preliminary analysis on each variable, to determine if it could have played a role as conductance or resistance in the pathogen spread. For each of the 100 extracted trees, we estimated the correlation between dispersal duration and environmental distance. The results are summarized by two statistics as follows: the number of positive variable's coefficient of determination out of the 100 trees, and the number of positive Q statistic, calculated as , that is, the difference between the correlation R2 for the variable's raster and for a null raster, again calculated for each tree (53). For the analysis, we used two path models as follows: straight line (where the branch “weight” is calculated by summing the cell values through which the straight line passes) and least-cost path (where the branch “weight” is calculated by summing the values between adjacent cells along the least-cost path).
Once we identified the potential resistance or conductance factors, we performed 10 tree randomizations and calculated the statistics again. In this case, we used the Bayes Factor (BFe), calculated as BFe = pe /(1 – pe), where pe is the probability that Qobserved > Qrandomized. We used two criteria for tree randomizations as follows: (1) randomizations of node positions while maintaining the branches' lengths, the tree topology, and the location of the most ancestral node; and (2) randomizations of node positions while maintaining only the branches' lengths.
2.6. Genetic distance regression and role of the cattle movements
We, finally, tested which variables can better explain the genetic distances between the sampled M. bovis isolates, to understand the signatures of temporal, spatial, and demographic factors (54, 55). We ran this analysis using a Boosted Regression Tree (BRT) regression model (56) in R software [packages dismo (57) and gbm (58)], a very flexible tool that combines decision trees and boosting techniques (59). In this model, the dependent variable was the genetic distance between M. bovis strains, expressed as SNPs. We tested a total of 28 relational variables, calculated for each pair of isolates (Supplementary Table 5). Except for the temporal and spatial distance (which were calculated from the original isolate metadata) and a binary variable indicating whether two sequences have the same spoligotype, MIRU-VNTR, and clade (yes/no), the other variables are associated with the M. bovis isolates administrative subdivision.
We built two subdivision-level contact networks. The first one is a spatial network where nodes represent subdivisions, and edges between them are positive if they share a border. This network is undirected (edges are not directional) and unweighted (all edge values are set to 1). For this network, we computed six variables to be associated with each pair of isolates: degree and betweenness centrality (60) of both isolates' subdivisions; shortest path and a binary variable indicating whether the two subdivisions belonged to the same network's community.
The second network represented the cattle movements, and edges correspond to the number of animals moved between subdivisions over a year. We built this network by aggregating the empirical data collected by Motta et al. (22), which originally reported the monthly number of cattle exchanged between markets. For this network, we computed eight variables as follows: degree, strength, and between centrality of both isolates' subdivisions; shortest path and the same community binary variable. The degree counts the number of each subdivision's connections, while the strength is the sum of the number of cattle moved to and from each subdivision. All networks' metrics were computed using the R package igraph (61).
Once we computed all the variables (the full list is presented in Supplementary Table 5), we trained the BRT model using 75% of the observations, while the remaining 25% were used for testing. We evaluated the models based on pseudo-R2 and Root Mean Squared Error (RMSE) on the test dataset. These were both calculated using the package caret (62). For BRT, the relative influence of the variables is determined by the times each variable is selected to split the data in a decision tree, which, in turn, is weighted by the improvement in the model fit that resulted from the variable being used at each split (56). All models were fitted with a 10-fold cross-validation. The BRT algorithm has two main parameters as follows: the learning rate, which controls the contribution of each tree to the final model, and the tree complexity, which corresponds to the number of nodes in the tree. We ran some preliminary tests to tune the BRT in order to improve the predictions. Finally, we set the learning rate to 0.05 and the tree complexity to 8.
3. Results
3.1. Cameroonian sequences in the African context
We analyzed 124 M. bovis sequences (nine of the original 133 failed), with 91 having enough read depth and genome coverage to allow further analyses (see Supplementary Table 6 for further details). Two of these sequences came from isolates sampled humans, while for a third, the sequencing failed. One of the excluded sequences was marked as not M. bovis, and based on the presence of the four RDs 1, 4, 9, and 12 patterns (33), it was likely M. tuberculosis. All the high-quality M. bovis sequences were merged into a tree, with other 22 obtained from the Patric dataset, 99 from EBI, and the 1997 UK Reference to provide a continental context. The qualitative phylogenetic tree, in Figure 1, shows that most of the Cameroonian sequences (two of which obtained from human tissue samples) cluster with the Ghanaian human samples, and two Nigerians recovered from unreported hosts. All human samples from West Africa cluster with cattle sequences, except for the Malian human sequence. Most sequences (n = 89) belonged to Af1 clonal complex, and except for one, the spoligotypes were already known; for the other, we identified a new pattern (hex code: 6F-1F-5F-7F-BF-40). Being characterized by the absence of spacer 30, this spoligotype was considered Af1 (63). The dominant spoligotype was SB0944 (n = 32/89).
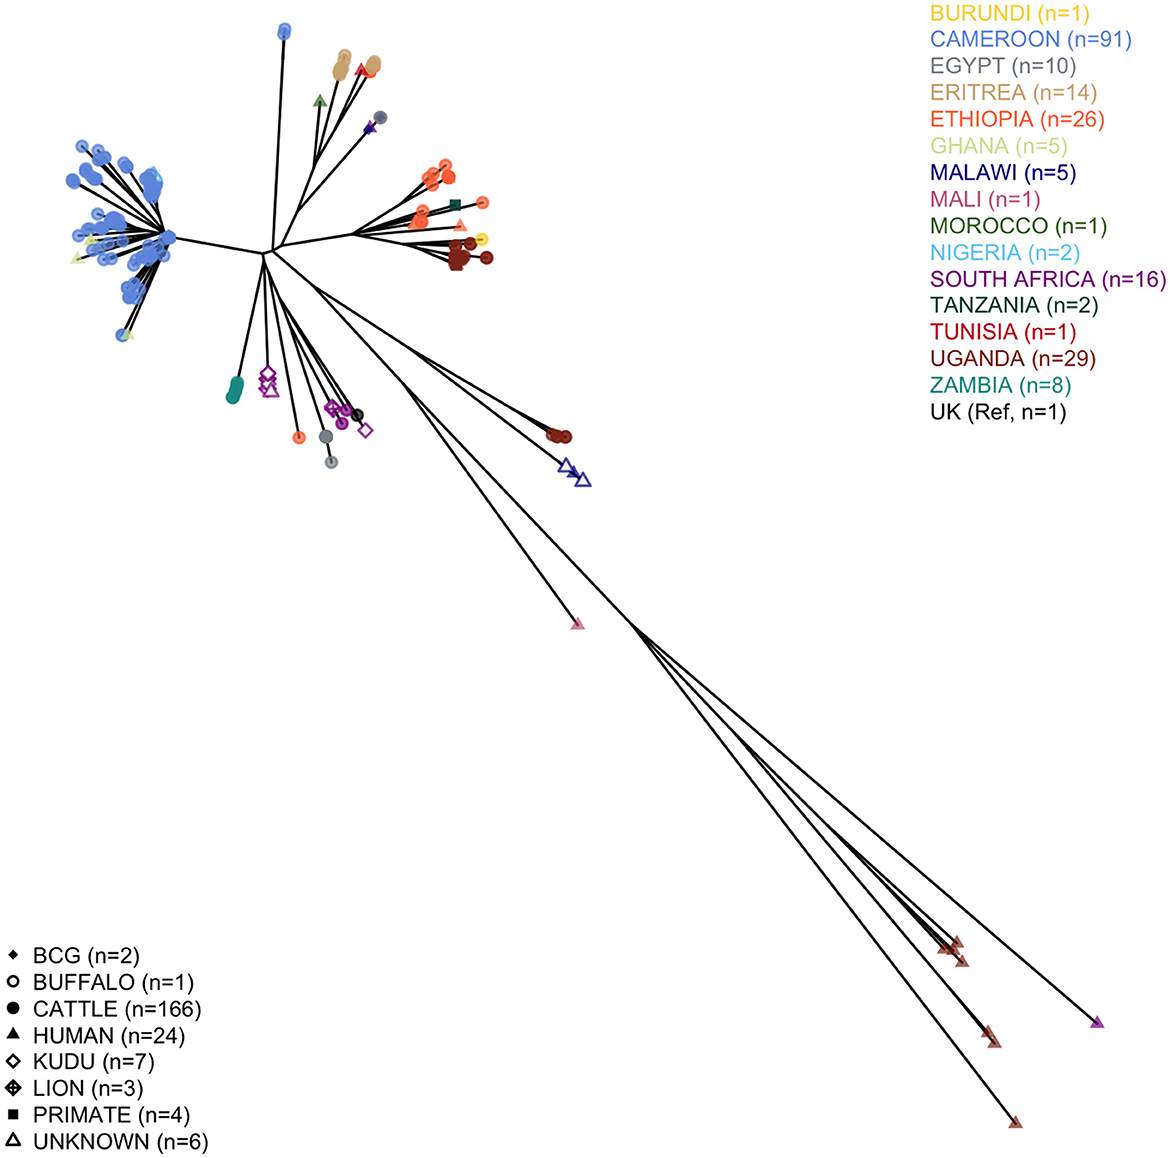
Figure 1. Phylogenetic tree of the African Mycobacterium bovis whole-genome sequences considered in the study. The tree includes 91 high-quality Cameroonian sequences, 101 from the EBI dataset, 20 from Patric, and the 1997 UK M. bovis reference.
Two outlier sequences did not cluster with the rest of the sampled Cameroonian population. Their average distance from the rest of the Cameroonian population (respectively, 235 and 231 SNPs) was slightly higher than the average distance of the 1997 UK Reference from the Cameroonian isolates (222 SNPs), and they did not cluster with any other WGS sequence sampled in Africa (Figure 1). For both outlier sequences, the spoligotype was SB2332, found for the first time in Cameroon and submitted for classification at www.Mbovis.org by Egbe et al. (15). Following Warren et al. (33), we tested the presence of RDs 1, 4, 9, and 12 patterns, finding only the first one, confirming that they are likely M. bovis. We compared this spoligotype pattern with all the others from the http://www.Mbovis.org database, and we identified four patterns differing by two spacers as follows: SB0858 sampled in Spain (64) (different in spacers 20 and 22), SB1102 sampled in Chad (63) and Cameroon (12) (different in spacers 33 and 34), SB2333 reported by Egbe et al. (15) (different in spacers 22 and 34), and SB2691 sampled in France (not found in publications, different in spacers 20 and 34). We also identified 11 patterns differing by three spacers, sampled in France (65), Portugal (66), and Spain (64).
3.2. M. bovis evolutionary time scale in Cameroon
A total of 1,540 SNPs were determined from the Snippy core-SNP analysis on Cameroonian M. bovis genomes (Supplementary Figure 2). This was reduced to 1,106 SNPs when the dataset was reduced to 64 samples with complete metadata and excluding the non-cattle ones (two sampled in humans), which were used for the downstream quantitative analysis. The median SNP distance among the remaining high-quality sequences was 70 SNPs (mean 68, range from 0 to 144, 2.5th and 97.5th quantiles 14 and 118). For two cattle (one from Bibemi and the other from Touboro), two M. bovis isolates sequenced were available (obtained from different tissues). In both cases, the two strains were identical (Bibemi, 3 and 4; Touboro, 7 and 8, Figure 2), which suggests a single infection disseminated in different organs rather than two separate infections.
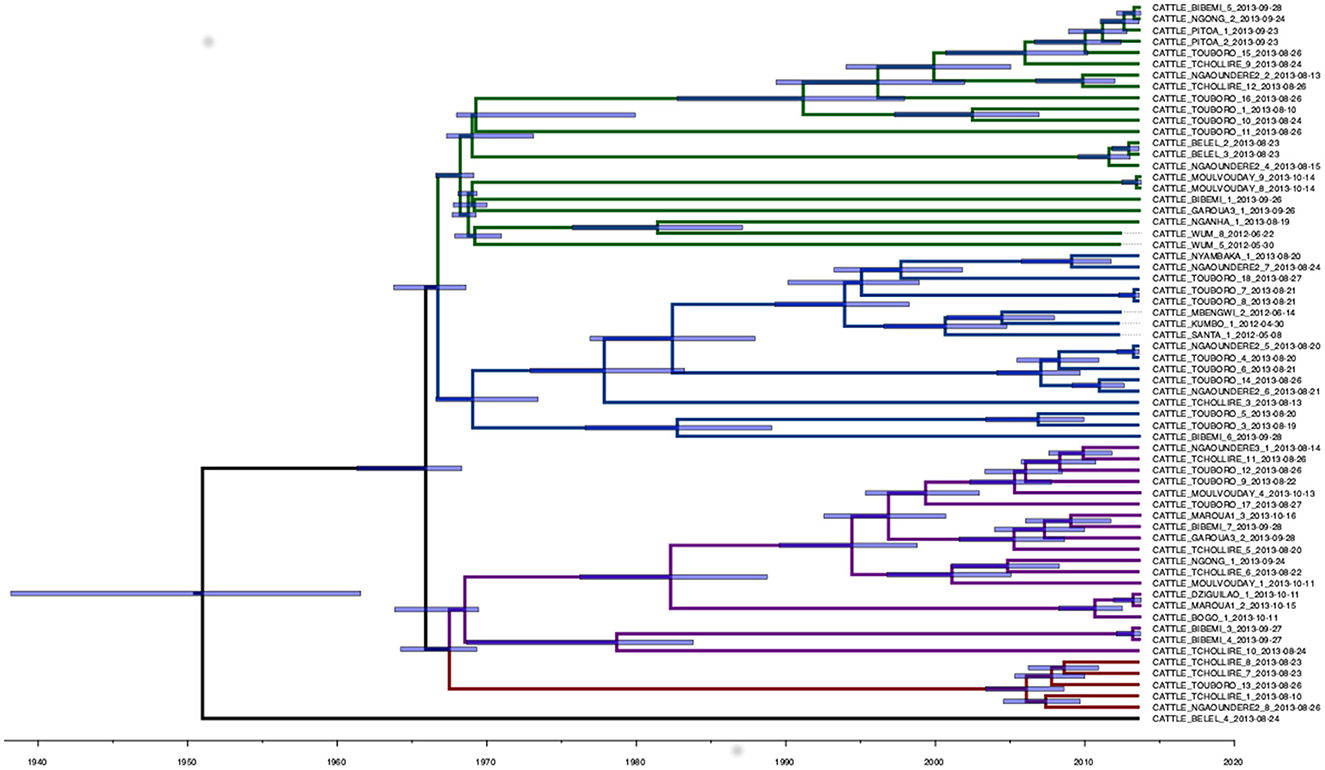
Figure 2. Phylogenetic time-scaled MCC tree of the 64 high-quality M. bovis whole-genome sequences sampled in Cameroon in 2012 and 2013. The blue transparent bars represent the 95th HPD of the internal node dates, while the branch colors represent different clades: 1 (green), 2 (blue), 3 (purple), and 4 (red). A non-time scaled tree showing the genetic distance between the 64 sequences is presented in Supplementary Figure 6.
The analysis in Tempest showed a slightly positive temporal signal (coefficient of determination 0.11 and correlation coefficient 0.33) and a slope of 1.267 × 10⁻² (Supplementary Figure 3). We used a sequential approach in BEAST to select the best spatial model and bacterial population models. Based on the MLE estimation of the exploratory models (Supplementary Table 7), we determined the best model included a Gamma Relaxed Random Walk (RRW) spatial model (first step of the sequential analysis) and the SkygGrid population model (second step). The final BEAST model was run with 10 bins and a cutoff of 400 years. The population trend is shown in Supplementary Figure 4. The model estimates suggest that the mean age of the root was in July 1950 (95th high-posterior density, HPD, April 1938–August 1961), while the average clock rate was 1.32 × 10⁻⁷ substitution/site/year (95th HPD 1.20 × 10⁻⁷ – 1.44 × 10⁻⁷). The maximum clade credibility (MCC) tree is presented in Figure 2, which also shows the division in four clades as follows: clade 1 (green, 22 isolates), clade 2 (blue, 17 isolates), clade 3 (purple, 19 isolates), and clade 4 (red, five isolates). One sequence was excluded from all clades (Belel, 4; Figure 2, reported as “no clade” in the figures). The geographical distribution of the clades is presented in Figure 3, showing the number of M. bovis isolates per administrative subdivision, which ranged from 1 to 17 (see Supplementary Table 8 for the number of isolates per clade by regional abattoir). In Figure 4, we superimposed the MCC tree with spoligotypes; the most prevalent spoligotype, SB0944, occurred 26 times (out of 64 sequences) and was present in three of the four clades. The second most prevalent spoligotypes were SB0953 and SB2312, the first occurring five times in two clades and the latter occurring five times in one clade only (clade 2). We also superimposed the MIRU-VNTR types, as shown in Supplementary Figure 5. The most prevalent MIRU-VNTR type in the sampled population was V89, which occurred nine times; V82 and V37, respectively, occurred six and four times; and V81, V76, and V100 all occurred three times. Seven MIRU-VNTR types occurred two times, while 39 types occurred only once.
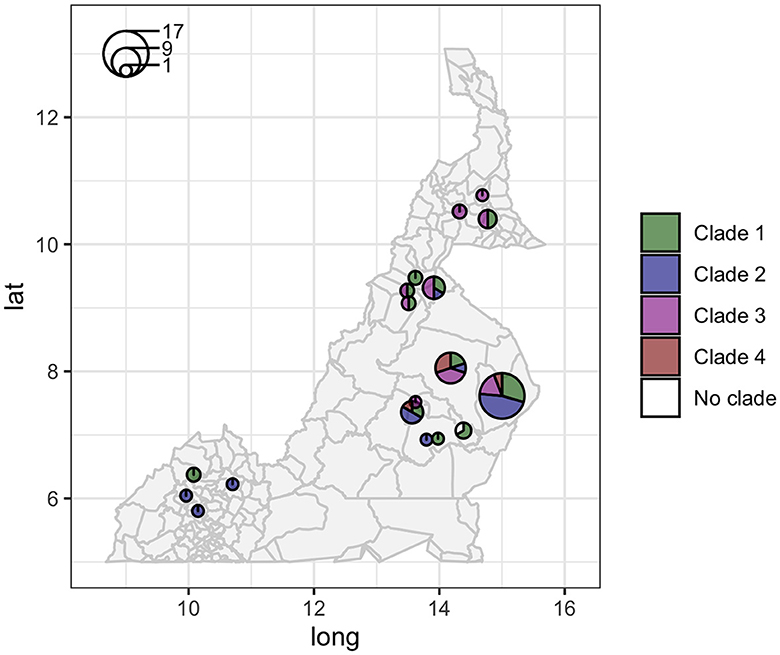
Figure 3. Geographic distribution of the 64 high-quality M. bovis whole-genome sequences in Cameroon. Circle sizes correspond to the number of sequences per administrative subdivision, and colors represent different clades (clade 1 green, clade 2 blue, clade 3 purple, and clade 4 red).
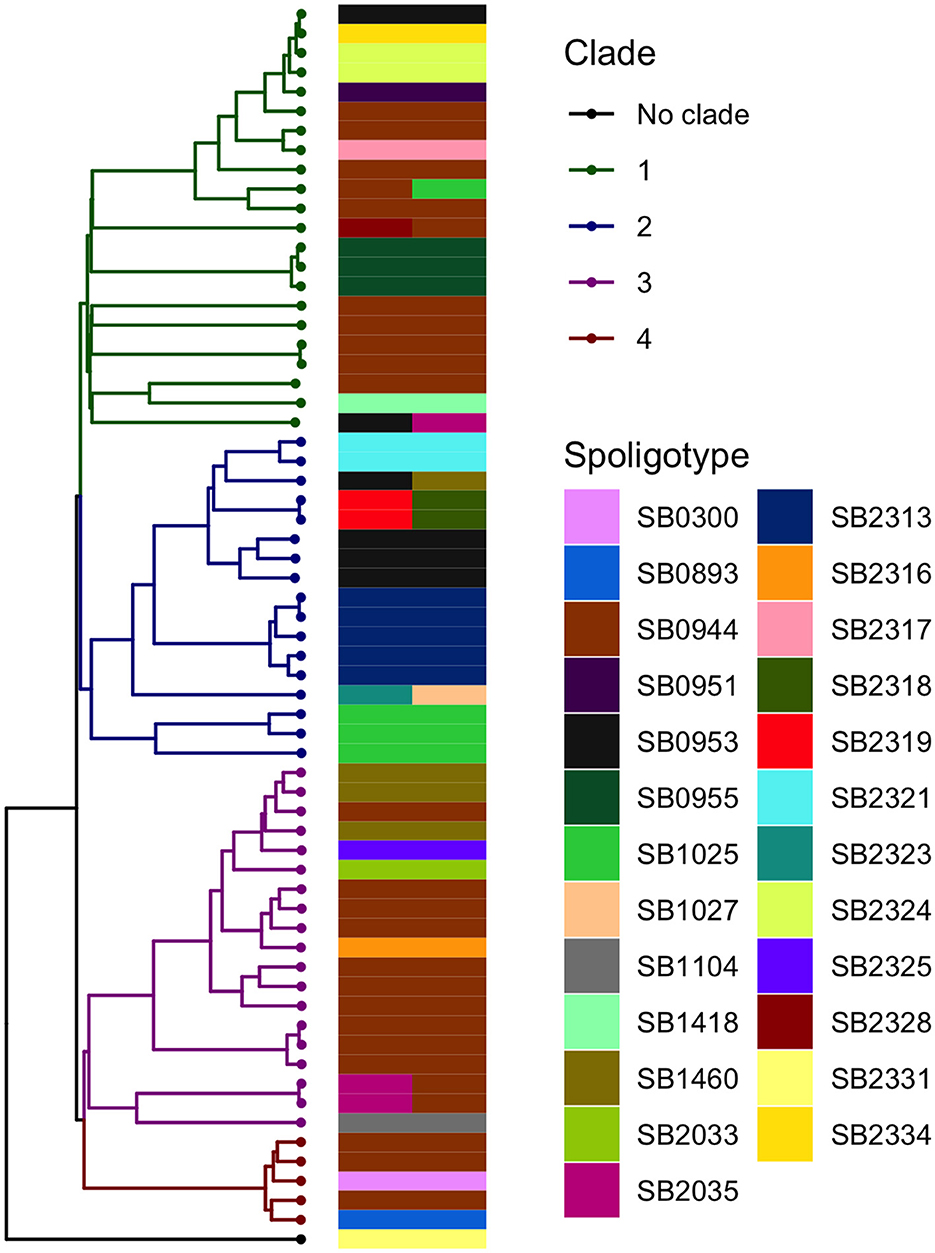
Figure 4. Visual comparison between the M. bovis phylogenetic time-scaled MCC tree and the spoligotypes obtained by Egbe et al. (15). A total of 10 sequences were associated with two spoligotypes because multiple samples from the same animal (up to three) were submitted for spoligotyping.
3.3. Spatiotemporal pathogen expansion
The estimated mean branch velocity was 53.1 km/year (95th CI 18.4–219.0, temporal trend presented in Supplementary Figure 7). The wavefront statistics in Figure 5 suggest that the pathogen expansion was slow until the mid-1960s but accelerated thereafter to reach the entire study area, with a slow but constant expansion in the following period. This is reflected in an increase in the branch velocity at the same time (Supplementary Figure 7), which is approximately the period when the branches formed the observed clades (Figure 2). The timing of the different branches in space is presented in Figure 6 (95th HPD in Supplementary Figure 8, with nodes colored by estimated/observed date).
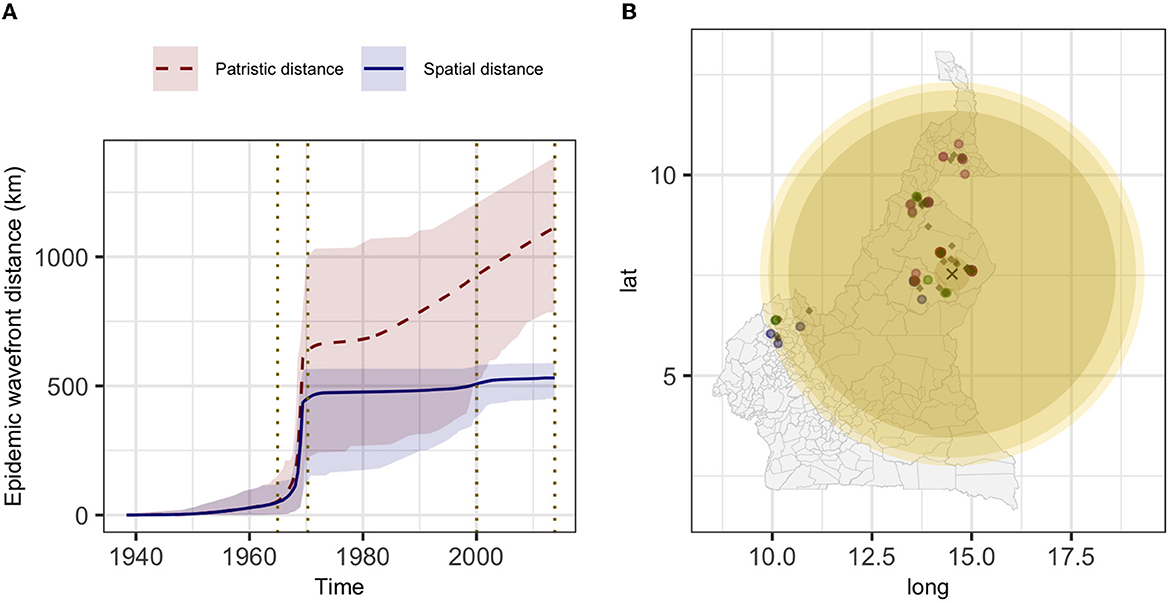
Figure 5. The estimated epidemic wavefront over time (A) and the expansion of the epidemic wavefront on the map (B). (A) mean (lines) and 95th HPD (shades) of the epidemic wavefront spatial distance (blue) and patristic distance (red) over time. (B) different yellow shades represent the epidemic wavefront at a sequential point in time [marked by vertical dotted lines in (A)], and lighter shades of yellow correspond to more recent expansion; the estimated tree's root location is indicated by the black cross, diamonds represent the internal nodes estimated locations and circles the sampled isolates (colored by clade: 1, green; 2, blue; 3, purple; and 4, red).
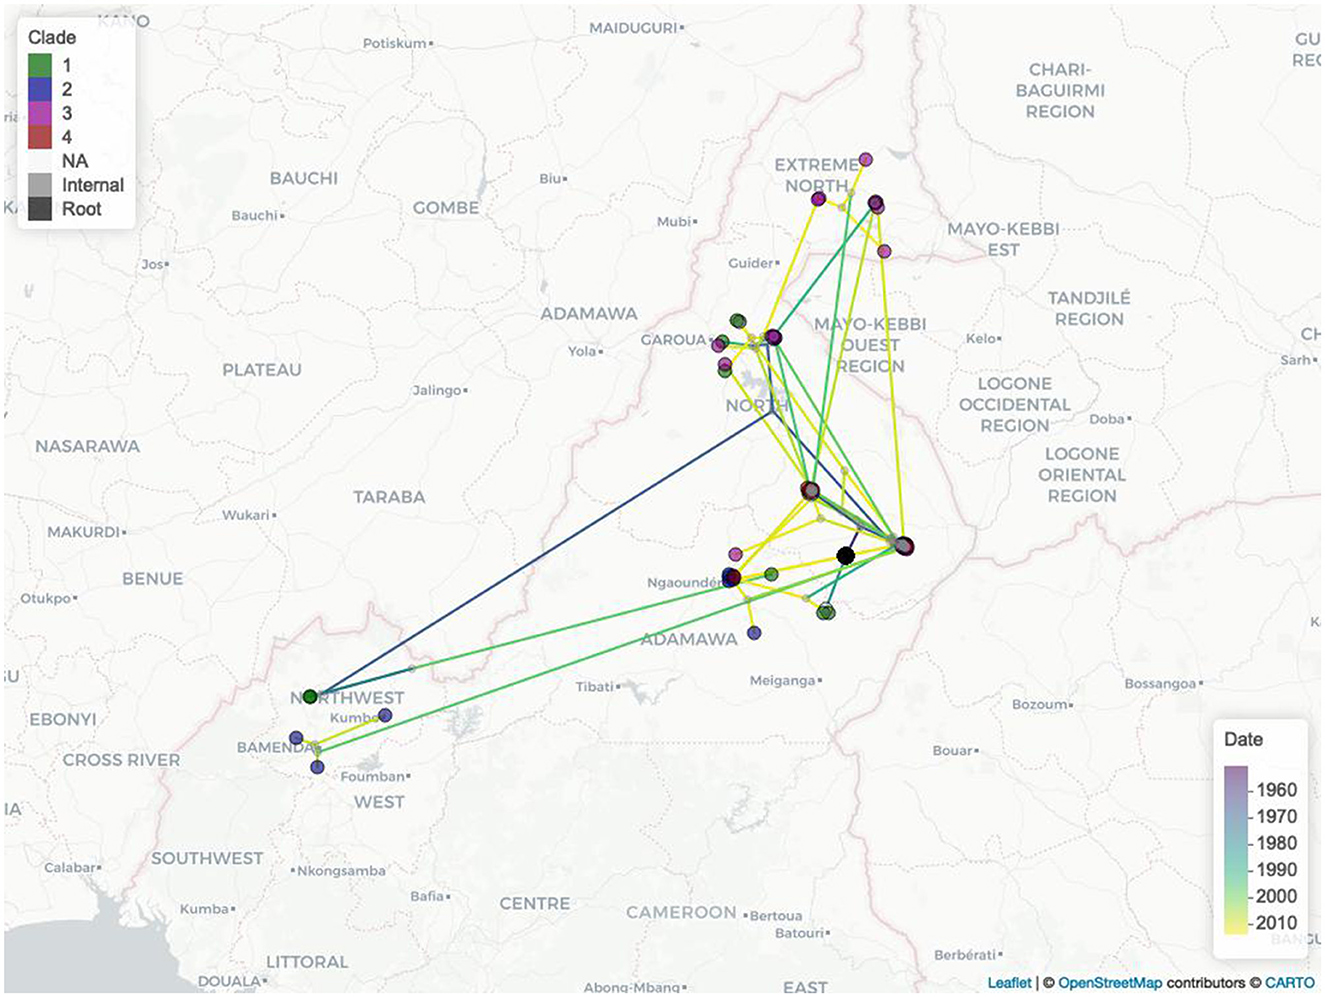
Figure 6. The Cameroonian M. bovis epidemic estimated expansions in space and time. Nodes are colored by clade (1, green; 2, blue; 3 purple; 4, red; no clade, light gray; internal nodes, dark gray; tree root, black), while the branches are colored by estimated movement date from 2007 (purple) to 2013 (yellow).
We tested the association between nine geographical variables with the dispersal duration. Table 1 shows the results obtained using the straight line and the least-cost path models, and the latter run considering the variables as potential conductance or resistance factor. A total of six variables resulted in a significant association (positive coefficients for all at least 95 out of 100 trees and above 75% of positive Q) as follows: mosaic, shrub, and other vegetation covers (with both path models as resistance in the least-cost one); forest cover, elevation, and waterbodies cover (all as conductance); and cattle density (as resistance). However, when their statistical significance was tested through randomization, only forest cover and elevation (both as conductance) showed a Bayes factor significance [≥ 3 (67)]. The result was robust against two different tree randomization algorithms for the forest layer, while for the elevation, this was true only when maintaining the branches' length and excluding the other tree topological characteristics.
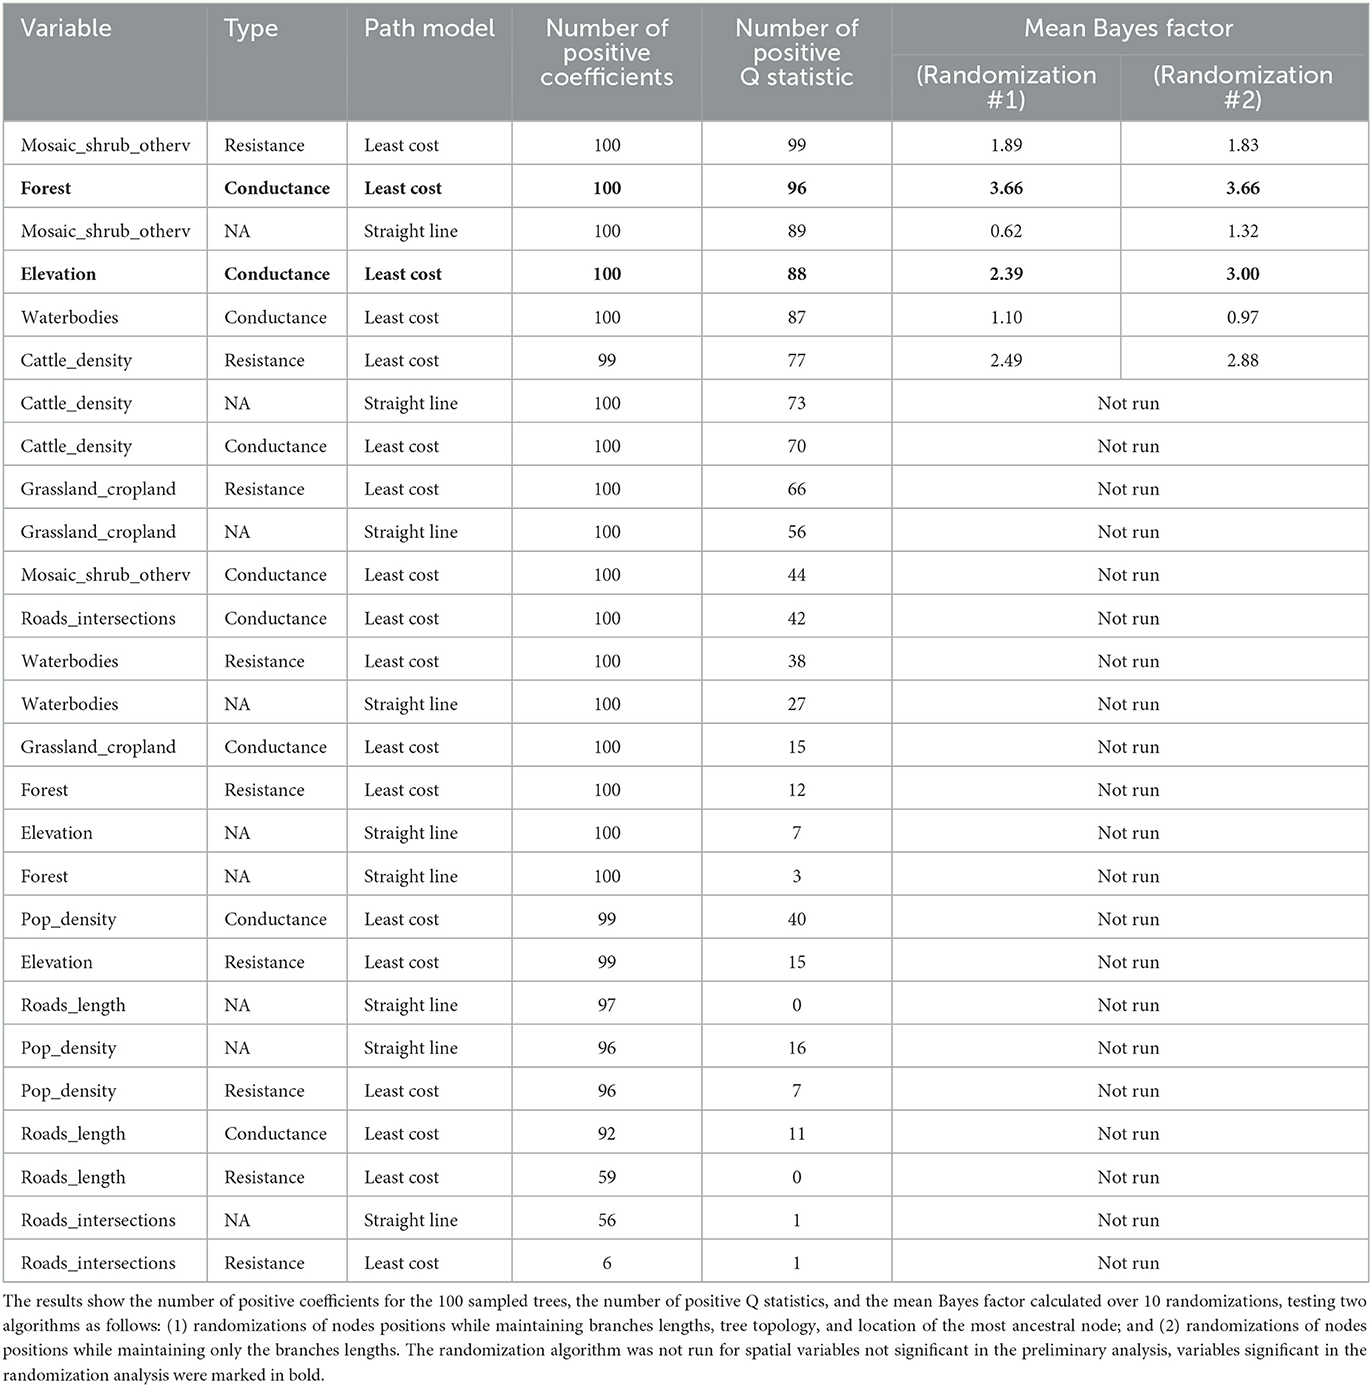
Table 1. The results of the analysis on nine spatial variables, assuming two path models, straight line and least cost, and for the least cost path, whether the variable worked as a conductance or resistance.
3.4. Factors associated with genetic distance
The RMSE of the boosted regression tree BRT model ran using all 28 variables was 20.23, while the R2 was 0.450. We simplified the model using the dismo package, which tests the performance of the model by dropping the less important variables with a procedure similar to backward selection in regression (56). The algorithm brought to eliminating 12 variables (see Supplementary Table 5); nonetheless, the model run using the remaining 16 variables performed very similarly to the original one (RMSE = 20.22 and R2 = 0.452). Therefore, we used the latter to calculate the variable importance (Figure 7).
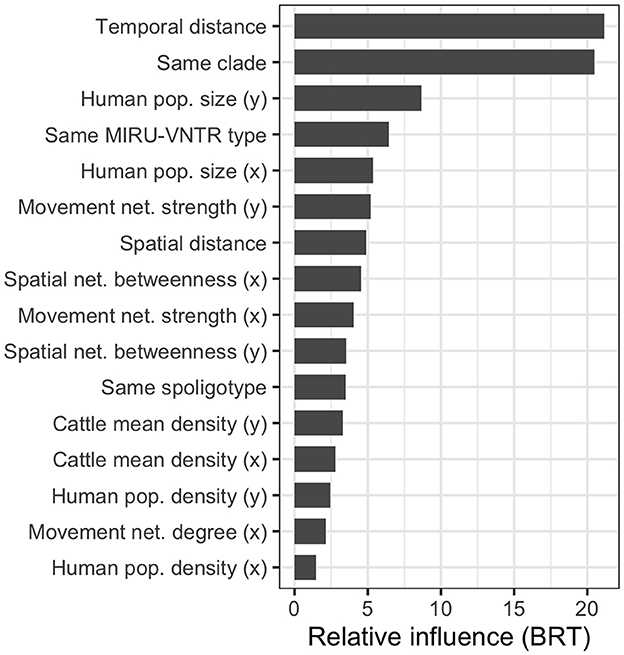
Figure 7. Relative influence of the most relevant variables in the simplified boosted regression tree (BRT) model used to explain the SNP distance between the 64 high-quality M. bovis isolates. Many variables are calculated between isolates pairs, x refers to the oldest isolate's subdivision, and y to the youngest one.
As expected, the most relevant variables were the temporal distance between the samples (first), and the binary variable indicating whether the two M. bovis isolates belonged to the same clade in the MCC tree (second). The variables describing the subdivisions' population were also relevant in the model (population.y, third, and population.x, fifth), as well as whether the two isolates shared the same MIRU-VNTR (fourth). This was more relevant than the two isolates shared the same spoligotypes (11th), suggesting the former was more useful to discriminate closer M. bovis strains. The market movement network strength (i.e., the number of cattle moved from/to a subdivision) was the most important (sixth and ninth) among network-related variables, while the betweenness (eighth and 10th) was the only spatial network variable retained in the simplified model. Interestingly, when both variables were selected for the same metric, the one related to the youngest isolate (marked by y) was always preferred to the one related to the oldest isolate (marked by x). The partial dependency plots, showing the relationship between SNP distance and variables, are presented in Supplementary Figure 9.
4. Discussion
We sought to unravel the characteristics of the spread of a pathogen with zoonotic potential in time and space to improve our understanding and inform control and preparedness strategies. Our basic premise is that the accumulation of mutations in the pathogen's genome can be used as signatures of transmission events from host to host across time and space. Within space, the environment can create barriers that influence the population dynamics of diseases, i.e., altering host-to-host and pathogen–host interactions has direct effects on the genetic structure of the pathogen (68). The availability of high-throughput genomic techniques means we can interrogate the structural changes linked to the environment over time to gain critical insights into how the epidemic has evolved. In this study, we aimed to characterize M. bovis samples from cattle in Cameroon using genetic and demographic data to understand whether the pathogen is in a stable endemic state and the influence on the spread dynamic of environmental and ecological factors and cattle movements.
4.1. Evidence of dynamic endemicity
An important question was whether the M. bovis outbreak in North Cameroon was in a steady state, at an endemic equilibrium, or if it was expanding. Determining whether a pathogen is endemic has implications on risk perception and consequently on resource allocation. At the same time, the chances of zoonotic transmission are likely to be higher in the case of endemicity. In our analysis, the Bayesian model estimation with SkyGrid as a population model showed an increasing pathogen effective population size, corresponding to a constant increase in the disease velocity after the sudden jump during the mid-to-late 1960s. This suggests that the pathogen is not in a state of endemic stability, instead, it has been expanding at various rates over the years. This is in agreement with a previous publication using spoligotypes and MIRU-VNTR (15) and with the study by Awah-Ndukum et al. (14). The expansion of M. bovis might represent an issue for livestock and humans, particularly as we showed that the bacterium is circulating in both. At the moment, disease control in the area is absent, while, on the other hand, the dairy industry in Africa is generally expanding. A lack of widespread milk pasteurization could lead to an increase in zoonotic TB cases, which already represent a problematic issue in the region (11).
4.2. Genetic diversity of M. bovis in Cameroon
We observed a high diversity of M. bovis, confirming earlier observations with molecular typing techniques, providing less granular information (15), and considering the short time span of the sampling campaign and the small sample size. This contrasts with areas such as Great Britain and other European countries, where strict control measures, such as routine testing and stamping out of positive individuals, have been in place for decades. These measures could have resulted in a genetic bottleneck which hampered the pathogen's genetic variability, in particular by reducing the time a pathogen has to develop inside a domestic host and, therefore, the likelihood of substitutions in the DNA. As an example, Crispell et al. (55) reported a similar SNP distance range (0 to 150), albeit across a much bigger sample (n = 230), with a lower median (20 SNPs) and with isolates dating back two decades, while in a similar size monophyletic outbreak (n = 64), Rossi et al. reported a maximum SNP distance of only six SNPs (54). In Spain, Pozo et al. (69) found a similar SNP distance average and range (62 and 0 to 150) in a bigger M. bovis population, sampled in both cattle and wildlife over 13 years. It is noteworthy that high diversity can be associated with dynamic epidemiology and not with endemic stability.
All 64 core isolates belonged to the clonal complex Af1, which was observed in the region in previous studies (63). The most common spoligotype, SB0944, was found by Müller et al. (63) as the most prevalent in West Africa and considered the original of the Af1 clonal complex. Our findings also suggest zoonotic transmission in West Africa, as sequences recovered from humans in Cameroon and Ghana clustered with Cameroonian cattle M. bovis isolates (70). Because it is known that zoonotic TB represents a minoritarian but still crucial part of all TB cases in Africa, these results strengthen the case for One-Health approaches to control, which involve humans, livestock, wildlife, and environmental health (11, 71). Except for the one sequence in Mali and the two Cameroonian outliers, all the sequences from West Africa clustered together, hinting at high connectivity likely caused by cattle movements throughout the area, as previously shown by another study (72). Our results showed that the areas with the highest M. bovis diversity were in the Adamawa and North regions, both reporting all the clades identified by the maximum clade credibility (MCC) tree. All clades were also sampled in the towns of Touboro and Tchollire, both located in the North region but close to the Adamawa border. Previous studies reported that this area receive cattle from neighboring country as part of the transhumance migration, suggesting that cattle movements and markets play an important role in defining the dynamics of the pathogen, and therefore influencing its genetic diversity (15, 22). The Northwest region was underrepresented in the sample, with only five high-quality sequences on 31 infected cattle detected at the abattoir. This inherently reduces the level of diversity, which is far lower than reported using spoligotypes and MIRU-VNTR (15).
Despite covering a smaller portion of the genome and the higher occurrence of homoplasy with respect to WGS, in other contexts, spoligotypes have been used as a proxy cluster or to narrow down potential transmission within the study population (55, 73). Our results showed that this cannot be conducted for areas with high diversity such as the one we considered, as we observed little correspondence between the MCC tree branches and the spoligotypes. Similarly, other studies pointed out the limitations of such typing techniques (18), in the case of an expanding infection where transmission is steadily ongoing, compared with point-source ones (74). The high SNP distances among the sampled isolates also precluded the use of methods to infer direct transmission between hosts (7, 75).
When considering the entire sampled population, therefore including the sequences with incomplete metadata, we found two of the 91 sequences not belonging to the clonal complex Af1. In their spoligotype pattern (SB2332), we noted the absence of spacer 21 (76), and the closest relatives analyzed by Loiseau et al. (39) were identified as part of the clonal complex Eu2, including isolates sampled both in south-western Europe (SB0837, SB1090, and SB1308) and West Africa [SB1102, isolated in Cameroon as well (12)]. We can, then, speculate that these sequences likely belong to Eu2 as well, although we could not exclude one of the “unknown” clonal complexes identified by other studies (39, 77). Further development on this point was beyond the scope of this study, as we focused on the 64 core sequences to gather insights into the pathogen dynamics in the area.
4.3. Tracking the spread of M. bovis in Cameroon
We acknowledge that our estimates for the most recent common ancestor (MRCA) have a wide credible interval around it (23 years). This uncertainty is likely due to the short duration of the sample collection campaign, which also generated a weak temporal signal, although the coefficient of determination was similar to other M. bovis studies in highly sampled populations (54, 55). Nonetheless, our estimates coalesce around 1950, suggesting that the pathogen has been spreading in the area for at least six decades at the time of sampling. For the same reason, the estimated clock rate was higher than others in the literature but in the same order of magnitude (0.67–1.26 × 10⁻⁷, n = 2625 (39)].
The estimated MCC tree located at the most recent common ancestor (MRCA) in Touboro (North region), and from there, a rapid expansion of the outbreak reached most of the study area by the early 1970s. From the estimated origin, the pathogen likely spread first northward to Garoua (in the same region) and westward to the Northwest region, and later to the Extreme North and Adamawa regions and again to the Northwest.
The results of the spatial factor analysis showed that forest cover and elevation were the only significant ones, both acting as “conductance”. Forest cover could be a proxy for potential wildlife interactions, as M. bovis is known to be quite effective in spreading at the wildlife–livestock (and humans) interface (71, 78). The elevation as conductance was counter-intuitive; however, this could be linked to cattle movements in pastoralist communities within the plateau located in the study area. This is important because, if confirmed, altitude could be used as a proxy for the missing pastoralist movements.
Our regression model performed reasonably well, although the amount of variability explained was below 50%. However, our objective was to understand which variables could better explain the genetic distance between M. bovis isolates, expressed as SNP distance. Except for the isolates between temporal distance and clade, the demographic variables were the most effective in explaining SNP distance, particularly the administrative subdivision human population size. These variables had a negative effect on the SNP distance, meaning that a smaller population was associated with a close relatedness of the M. bovis strains. This could be an effect of the population distribution on the country because the northern regions, where cattle are most concentrated, are less populated compared with the cities in the south. The simplified model performed similarly to the full model, suggesting some variables were not important in explaining the genetic distance. Beyond the human population size, also the other demographic variables (population and cattle density) were retained. Conversely, only five network-related variables were retained, three for the cattle movement network (out of eight) and two for the spatial network (out of six). All network-related variables had a positive effect on the SNP distance, with the number of cattle moved in or out of a subdivision (i.e., strength), having the higher predictive effect. Interestingly, this result was similar to other studies where cattle movements alone could not fully capture M. bovis genetic diversity (54, 55).
4.4. Limitations
The major limitation of this dataset was the short data collection time window, less than a year and a half, which resulted in uncertainty in the MRCA estimate and a weak temporal signal. While we can speculate the sampled bacterial population already reached the entire study area before the 1970s, a wider sampling time window would likely allow a stronger temporal signal and improve our estimate of the MRCA, which might be prior with respect to the current estimate. In turn, this affected the pathogen's expansion patterns, including the branch velocity and wavefront, which are also limited by the sampled area size. The spatial uncertainty might also be affected by the absence of dense cattle movement records, so the known spatial coordinates associated with each sequence correspond to the last village the animal lived in. The Adamawa and Northwest regions are home to 1.25 million and 450.000 cattle, respectively (22), and while this abattoir-based study provides a very informative snapshot of the M. bovis population in North Cameroon, it adds to the calls to improve cattle records and movement routine data collections in LMICs (79), as well as bTB detection efforts.
The low-quality WGSs disproportionally affected the Northwest region, as presented in Supplementary Table 7. This could have hampered the representativeness of the M. bovis diversity in that region, reducing the number of clades observed. The Adamawa region was the most represented, despite most of the sequences excluded from the quantitative analysis because of missing coordinates, which came from the Ngaoundere abattoir. The bacterium diversity in the Northwest might also be affected by the demographic of the slaughtered cattle in the region (13) because the region is highly populated by humans and more isolated in the trade network (22), and local animals of both sexes and at any age are slaughtered. Conversely, young male calves from the Adamawa, North, and Extreme North regions are often sent to richer southern regions to maximize their economic values, leaving the older cows to be slaughtered. By being exposed to the M. bovis for longer, the latter has more chances to develop lesions. On the contrary, these trends likely reduce the impact of missing information on the previous location of the animals because these animals have more chances of being reared locally.
In agreement with many studies and with the vSNP analysis result, we used AF2122/97 as a reference genome (49, 50, 54, 55, 77, 80, 81). To account for genes, absent in M. bovis, Loiseau et al. (39) used M. tuberculosis H37Rv, a choice driven by the different purpose of their study compared with ours (define the origin and the global population structure of M. bovis). Generally, the pipelines used to call the SNPs differed in many of the aforementioned studies, contributing to the uncertainty of the estimates and potentially generating biases in the analysis results and the clock rate calculations.
5. Conclusion
In conclusion, our study indicates endemic stability of M. bovis is unlikely in North Cameroon, but rather the disease is slowly expanding over time. Our findings highlight the importance of collecting data in underrepresented areas to enrich insights into the current body of literature, predominantly from developed countries. Moreover, our results pave the way for future research aimed to understand whether the observed M. bovis high-genetic diversity affects the spread dynamics.
Our findings underscore the need to adopt a One-Health surveillance strategy for M. bovis control (11). More studies on combining tools such as phylogeography, statistical modeling, landscape, and ecology will be beneficial to map spread patterns and effectively inform control and preparedness strategies (54).
Data availability statement
The Mycobacterium bovis sequences for this study have been deposited in the European Nucleotide Archive (ENA) at EMBL-EBI under accession number PRJEB61415.
Author contributions
BB, LN, and VT conceived the original project. BB, RK, LN, VT, MS, and NE designed the field study, databases, and survey instrument. RK, NE, VT, and BB developed the field SOPs and collected the data. PM collected the cattle movement data. GR, AM, FD, and FE cleaned the data. GR, BB, SL, and AM conceived the quantitative analysis. GR and SL run the phylogenetic analysis. BS implemented the bioinformatical pipelines. GR performed the machine learning analysis and responsible for writing the initial drafts. All authors contributed to comments for the final draft, contributed to the article, and approved the submitted version.
Funding
The primary data used in this study were generated with funding from Wellcome Trust (WT094945), with BCMB as the principal investigator. BS, SL, MB, BB, and AM are supported by the Biotechnology and Biological Sciences Research Council (BBSRC) program grant to Roslin Institute (Award numbers BBS/E/D/20002172 and BBS/E/D/200021723), and AM later by his BBSRC Future leader Fellowship and current Chancellor's fellowship. GR, SL, and BB additionally received support from the Scottish Government Rural and Environment Science and Analytical Services Division as part of the Center of Expertise on Animal Disease Outbreaks (EPIC). We are also grateful to the staff of MENIPIA, especially the veterinarians and delegates who diligently supported the primary fieldwork that generated this data. BS was partially funded by a BBSRC Core Capability Grant BB/CCG1780/1 awarded to The Roslin Institute. M. bovis sequencing was carried out by Edinburgh Genomics, The University of Edinburgh, which is partly supported through core grants from NERC (R8/H10/56), MRC (MR/K001744/1), and BBSRC (BB/J004243/1).
Acknowledgments
The authors would like to thank Dr. Isaac D. Otchere for providing the isolation year of the M. bovis sequences sampled in Ghana, Dr. Stella Mazeri and Dr. William Harvey, Roslin Institute University of Edinburgh, for data collection and analysis support, and Prof. Kim Vanderwaal, University of Minnesota for the useful comments.
Conflict of interest
The authors declare that the research was conducted in the absence of any commercial or financial relationships that could be construed as a potential conflict of interest.
Publisher's note
All claims expressed in this article are solely those of the authors and do not necessarily represent those of their affiliated organizations, or those of the publisher, the editors and the reviewers. Any product that may be evaluated in this article, or claim that may be made by its manufacturer, is not guaranteed or endorsed by the publisher.
Supplementary material
The Supplementary Material for this article can be found online at: https://www.frontiersin.org/articles/10.3389/fvets.2023.1086001/full#supplementary-material
References
1. Pybus OG, Rambaut A. Evolutionary analysis of the dynamics of viral infectious disease. Nat Rev Genet. (2009) 10:540–50. doi: 10.1038/nrg2583
2. Kao RR, Haydon DT, Lycett SJ, Murcia PR. Supersize me: How whole-genome sequencing and big data are transforming epidemiology. Trends Microbiol. (2014) 22:282–91. doi: 10.1016/j.tim.2014.02.011
3. Pybus OG, Suchard MA, Lemey P, Bernardin FJ, Rambaut A, Crawford FW, et al. Unifying the spatial epidemiology and molecular evolution of emerging epidemics. Proc Natl Acad Sci. (2012) 109:15066–71. doi: 10.1073/pnas.1206598109
4. Campbell F, Strang C, Ferguson N, Cori A, Jombart T. When are pathogen genome sequences informative of transmission events? PLoS Pathog. (2018) 14:1–21. doi: 10.1371/journal.ppat.1006885
5. Patané JSL, Martins J, Castelão AB, Nishibe C, Montera L, Bigi F, et al. Patterns and processes of Mycobacterium bovis evolution revealed by phylogenomic analyses. Genome Biol Evol. (2017) 9:521–35. doi: 10.1093/gbe/evx022
6. WHO. Zoonotic Tuberculosis Factsheet. (2017). Available online at: http://www.who.int/tb/areas-of-work/zoonotic-tb/en (accessed October 26, 2022).
7. Rossi G, Crispell J, Balaz D, Lycett S, Delahay R, Kao R. Identifying likely transmission pairs with pathogen sequence data using Kolmogorov Forward Equations; an application to M. bovis in cattle and badgers. Sci Rep. (2020) 8:1–13. doi: 10.1101/2020.06.11.146894
8. Bernitz N, Kerr TJ, Goosen WJ, Chileshe J, Higgitt RL, Roos EO, et al. Review of diagnostic tests for detection of Mycobacterium bovis infection in south African wildlife. Front Vet Sci. (2021) 8:1–11. doi: 10.3389/fvets.2021.588697
9. Kelly RF, Gordon LG, Egbe NF, Freeman EJ, Mazeri S, Ngwa VN et al. Bovine tuberculosis antemortem diagnostic test agreement and disagreement in a naturally infected african cattle population. Front Vet Sci. (2022) 9: 877534. doi: 10.3389/fvets.2022.877534
10. Sichewo PR, Vander Kelen C, Thys S, Michel AL. Risk practices for bovine tuberculosis transmission to cattle and livestock farming communities living at wildlife-livestock-human interface in northern Kwazulu Natal, South Sfrica. PLoS Negl Trop Dis. (2020) 14:1–18. doi: 10.1371/journal.pntd.0007618
11. Olea-Popelka F, Muwonge A, Perera A, Dean AS, Mumford E, Erlacher-Vindel E, et al. Zoonotic tuberculosis in human beings caused by Mycobacterium bovis—a call for action. Lancet Infect Dis. (2017) 17:e21–5. doi: 10.1016/S1473-3099(16)30139-6
12. Koro Koro F, Ngatchou AF, Portal JL, Gutierrez C, Etoa FX, Eyangoh SI. The genetic population structure of Mycobacterium bovis strains isolated from cattle slaughtered at the Yaoundé and Douala abattoirs in Cameroon. OIE Rev Sci Tech. (2015) 34:1001–10. doi: 10.20506/rst.34.3.2390
13. Egbe NF, Muwonge A, Ndip L, Kelly RF, Sander M, Tanya V, et al. Abattoir-based estimates of mycobacterial infections in Cameroon. Sci Rep. (2016) 6:1–14. doi: 10.1038/srep24320
14. Awah-Ndukum J, Kudi AC, Bradley G, Ane-Anyangwe I, Titanji VPK, Fon-Tebug S, et al. Prevalence of bovine tuberculosis in cattle in the highlands of Cameroon based on the detection of lesions in slaughtered cattle and tuberculin skin tests of live cattle. Vet Med. (2012) 57:59–76. doi: 10.17221/5252-VETMED
15. Egbe NF, Muwonge A, Ndip L, Kelly RF, Sander M, Tanya V, et al. Molecular epidemiology of Mycobacterium bovis in Cameroon. Sci Rep. (2017) 7:1–17. doi: 10.1038/s41598-017-04230-6
16. Kamerbeek J, Schouls L, Kolk A, Van Agterveld M, Van Soolingen D, Kuijper S, et al. Simultaneous detection and strain differentiation of Mycobacterium tuberculosis for diagnosis and epidemiology. J Clin Microbiol. (1997) 35:907–14. doi: 10.1128/jcm.35.4.907-914.1997
17. Supply P, Allix C, Lesjean S, Cardoso-Oelemann M, Rüsch-Gerdes S, Willery E, et al. Proposal for standardization of optimized mycobacterial interspersed repetitive unit-variable-number tandem repeat typing of Mycobacterium tuberculosis. J Clin Microbiol. (2006) 44:4498–510. doi: 10.1128/JCM.01392-06
18. Reis AC, Salvador LCM, Robbe-Austerman S, Tenreiro R, Botelho A, Albuquerque T. Article whole genome sequencing refines knowledge on the population structure of Mycobacterium bovis from a multi-host tuberculosis system. Microorganisms. (2021) 9:523. doi: 10.1101/2021.04.26.441523
19. Suchard MA, Lemey P, Baele G, Ayres DL, Drummond AJ. Rambaut A. Bayesian phylogenetic and phylodynamic data integration using BEAST 110. Virus Evol. (2018) 4:1–5. doi: 10.1093/ve/vey016
20. Lemey P, Rambaut A, Welch JJ, Suchard MA. Phylogeography takes a relaxed random walk in continuous space and time. Mol Biol Evol. (2010) 27:1877–85. doi: 10.1093/molbev/msq067
21. Dellicour S, Rose R, Faria NR, Lemey P, Pybus OG, SERAPHIM. Studying environmental rasters and phylogenetically informed movements. Bioinformatics. (2016) 32:3204–6. doi: 10.1093/bioinformatics/btw384
22. Motta P, Porphyre T, Handel I, Hamman SM, Ngu Ngwa V, Tanya V, et al. Implications of the cattle trade network in Cameroon for regional disease prevention and control. Sci Rep. (2017) 7:1–13. doi: 10.1038/srep43932
23. MMMO. BovTB-nf-docker. (2022). Available online at: https://github.com/oxfordmmm/BovTB-nf-docker (accessed October 31, 2022).
24. Bolger AM, Lohse M, Usadel B. Trimmomatic: A flexible trimmer for Illumina sequence data. Bioinformatics. (2014) 30:2114–20. doi: 10.1093/bioinformatics/btu170
25. Md V, Misra S, Li H, Aluru S. Efficient architecture-aware acceleration of BWA-MEM for multicore systems. In: Proceedings - 2019 IEEE 33rd International Parallel and Distributed Processing Symposium, IPDPS 2019. IEEE (2019). p. 314–324.
26. Li H, Handsaker B, Wysoker A, Fennell T, Ruan J, Homer N, et al. The Sequence Alignment/Map format and SAMtools. Bioinformatics. (2009) 25:2078–9. doi: 10.1093/bioinformatics/btp352
27. Wood DE, Lu J, Langmead B. Improved metagenomic analysis with Kraken 2. Genome Biol. (2019) 20:1–13. doi: 10.1186/s13059-019-1891-0
28. Lu J, Breitwieser FP, Thielen P, Salzberg SL. Bracken: Estimating species abundance in metagenomics data. PeerJ Comput Sci. (2017) 2017:1–17. doi: 10.1101/051813
29. Li H, A. statistical framework for SNP calling, mutation discovery, association mapping and population genetical parameter estimation from sequencing data. Bioinformatics. (2011) 27:2987–93. doi: 10.1093/bioinformatics/btr509
30. Seemann T,. Snippy: Rapid Haploid Variant Calling Core Genome Alignment. (2022). Available online at: https://github.com/tseemann/snippy (accessed October 31, 2022).
31. Jiang Y, Jiang Y, Wang S, Zhang Q, Ding X. Optimal sequencing depth design for whole genome re-sequencing in pigs. BMC Bioinformatics. (2019) 20:1–12. doi: 10.1186/s12859-019-3164-z
32. USDA. vSNP. (2023). Available online at: https://github.com/USDA-VS/vSNP (accessed January 16, 2023).
33. Warren RM, Gey van Pittius NC, Barnard M, Hesseling A, Engelke E, de Kock M, et al. Differentiation of Mycobacterium tuberculosis complex by PCR amplification of genomic regions of difference. Int J Tuberc Lung Dis. (2006) 10:818–22.
34. Li H, Durbin R. Fast and accurate short read alignment with Burrows-Wheeler transform. Bioinformatics. (2009) 25:1754–60. doi: 10.1093/bioinformatics/btp324
35. Danecek P, Bonfield JK, Liddle J, Marshall J, Ohan V, Pollard MO, et al. Twelve years of SAMtools and BCFtools. Gigascience. (2021) 10:1–4. doi: 10.1093/gigascience/giab008
36. Altschul SF, Gish W, Miller W, Myers EW, Lipman DJ. Basic local alignment search tool. J Mol Biol. (1990) 215:403–10. doi: 10.1016/S0022-2836(05)80360-2
37. Robinson JT, Thorvaldsdóttir H, Winckler W, Guttman M, Lander ES, Getz G, et al. Integrative genomics viewer. Nat Biotechnol. (2011) 29:24–6. doi: 10.1038/nbt.1754
38. Wattam AR, Davis JJ, Assaf R, Boisvert S, Brettin T, Bun C, et al. Improvements to PATRIC, the all-bacterial bioinformatics database and analysis resource center. Nucleic Acids Res. (2017) 45:D535–42. doi: 10.1093/nar/gkw1017
39. Loiseau C, Menardo F, Aseffa A, Hailu E, Gumi B, Ameni G, et al. An African origin for Mycobacterium bovis. Evol Med Public Heal. (2020) 2020:49–59. doi: 10.1093/emph/eoaa005
40. Minh BQ, Schmidt HA, Chernomor O, Schrempf D, Woodhams MD, Von Haeseler A, et al. 2: New models and efficient methods for phylogenetic inference in the genomic era. Mol Biol Evol. (2020) 37:1530–4. doi: 10.1093/molbev/msaa015
41. Trifinopoulos J, Nguyen LT, von Haeseler A, Minh BQ, W-IQ-TREE. a fast online phylogenetic tool for maximum likelihood analysis. Nucleic Acids Res. (2016) 44:W232–5. doi: 10.1093/nar/gkw256
42. Paradis E. Schliep K. Ape 50: an environment for modern phylogenetics and evolutionary analyses in {R}. Bioinformatics. (2018) 35:526–8. doi: 10.1093/bioinformatics/bty633
43. R Core Team. R: A Language and Environment for Statistical Computing. (2021). Available online at: https://www.r-project.org/ (accessed March 31, 2021).
44. Rambaut A, Lam TT, Carvalho LM, Pybus OG. Exploring the temporal structure of heterochronous sequences using TempEst (formerly Path-O-Gen). Virus Evol. (2016) 2:1–7. doi: 10.1093/ve/vew007
45. Ayres DL, Darling A, Zwickl DJ, Beerli P, Holder MT, Lewis PO, et al. BEAGLE: an application programming interface and high-performance computing library for statistical phylogenetics. Syst Biol. (2012) 61:170–3. doi: 10.1093/sysbio/syr100
46. Rambaut A, Drummond AJ, Xie D, Baele G. Suchard MA. Posterior summarization in Bayesian phylogenetics using Tracer 17. Syst Biol. (2018) 67:901–4. doi: 10.1093/sysbio/syy032
47. Hasegawa M, Kishino H, Yano T. Aki Dating of the human-ape splitting by a molecular clock of mitochondrial DNA. J Mol Evol. (1985) 22:160–74. doi: 10.1007/BF02101694
48. Crispell J, Zadoks RN, Harris SR, Paterson B, Collins DM, De-Lisle GW, et al. Using whole genome sequencing to investigate transmission in a multi-host system: bovine tuberculosis in New Zealand. BMC Genomics. (2017) 18:180. doi: 10.1186/s12864-017-3569-x
49. Duault H, Michelet L, Boschiroli M-L, Durand B, Canini L, A. Bayesian evolutionary model towards understanding wildlife contribution to F4-family Mycobacterium bovis transmission in the South-West of France. Vet Res. (2022) 53:1–12. doi: 10.1186/s13567-022-01044-x
50. Salvador LCM, O'Brien DJ, Cosgrove MK, Stuber TP, Schooley A, Crispell J. Disease management at the wildlife-livestock interface: using whole-genome sequencing to study the role of elk in Mycobacterium bovis transmission in Michigan, USA. Mol Ecol. (2019) 10:1–14. doi: 10.1111/mec.15061
51. Gill MS, Lemey P, Faria NR, Rambaut A, Shapiro B, Suchard MA. Improving bayesian population dynamics inference: a coalescent-based model for multiple loci. Mol Biol Evol. (2013) 30:713–24. doi: 10.1093/molbev/mss265
52. Hill V. Baele G. Bayesian estimation of past population dynamics in BEAST 110 Using the skygrid coalescent model. Mol Biol Evol. (2019) 36:2620–8. doi: 10.1093/molbev/msz172
53. Dellicour S, Rose R, Pybus OG. Explaining the geographic spread of emerging epidemics: a framework for comparing viral phylogenies and environmental landscape data. BMC Bioinf. (2016) 17:1–12. doi: 10.1186/s12859-016-0924-x
54. Rossi G, Crispell J, Brough T, Lycett SJ, White PCL, Allen A, et al. Phylodynamic analysis of an emergent Mycobacterium bovis outbreak in an area with no previously known wildlife infections. J Appl Ecol. (2022) 59:210–22. doi: 10.1111/1365-2664.14046
55. Crispell J, Benton CHCH, Balaz D, De Maio N, Ahkmetova A, Allen A, et al. Combining genomics and epidemiology to analyse bi-directional transmission of Mycobacterium bovis in a multi-host system. Elife. (2019) 8:1–36. doi: 10.7554/eLife.45833
56. Elith J, Leathwick JR, Hastie T. A working guide to boosted regression trees. J Anim Ecol. (2008) 77:802–13. doi: 10.1111/j.1365-2656.2008.01390.x
57. Hijmans RJ, Phillips S, Leathwick J, Elith J. Dismo: Species Distribution Modeling. (2021) Available online at: https://cran.r-project.org/package=dismo (accessed September 19, 2022).
58. Greenwell B, Boehmke B, Cunningham J, Developers GBM. Gbm: Generalized Boosted Regression Models. (2022). Available online at: https://cran.r-project.org/package=gbm (accessed August 11, 2022).
59. Brock PM, Fornace KM, Grigg MJ, Anstey NM, William T, Cox J, Drakeley CJ, Ferguson HM, Kao RR. Predictive analysis across spatial scales links zoonotic malaria to deforestation. Proc R Soc B Biol Sci. (2019) 286:2351. doi: 10.1098/rspb.2018.2351
61. Csárdi G, Nepusz T. The igraph software package for complex network research. J Comput Appl. (2014) 1695:1–17.
62. Kuhn M, Weston S, Keefer C, Engelhardt A, Cooper T, Mayer Z, et al. Classification Regression Training. (2016). Available online at: https://cran.r-project.org/package=caret (accessed August 09, 2022).
63. Müller B, Hilty M, Berg S, Garcia-Pelayo MC, Dale J, Boschiroli ML, et al. African 1, an epidemiologically important clonal complex of Mycobacterium bovis dominant in Mali, Nigeria, Cameroon, and Chad. J Bacteriol. (2009) 191:1951–60. doi: 10.1128/JB.01590-08
64. Rodríguez S, Romero B, Bezos J, de Juan L, Álvarez J, Castellanos E, et al. High spoligotype diversity within a Mycobacterium bovis population: Clues to understanding the demography of the pathogen in Europe. Vet Microbiol. (2010) 141:89–95. doi: 10.1016/j.vetmic.2009.08.007
65. Hauer A, De Cruz K, Cochard T, Godreuil S, Karoui C, Henault S, et al. Genetic evolution of Mycobacterium bovis causing tuberculosis in livestock and wildlife in France since 1978. PLoS ONE. (2015) 10:1–17. doi: 10.1371/journal.pone.0117103
66. Matos F, Cunha M V, Canto A, Albuquerque T, Amado A, Botelho A. Snapshot of Mycobacterium bovis and Mycobacterium caprae infections in livestock in an area with a low incidence of bovine tuberculosis. J Clin Microbiol. (2010) 48:4337–9. doi: 10.1128/JCM.01762-10
67. Kass RE, Raftery AE. Bayes Factors. J Am Stat Assoc. (1995) 90:773–95. doi: 10.1080/01621459.1995.10476572
68. Real LA, Biek R. Spatial dynamics and genetics of infectious diseases on heterogeneous landscapes. J R Soc Interface. (2007) 4:935–48. doi: 10.1098/rsif.2007.1041
69. Pozo P, Lorente-Leal V, Robbe-Austerman S, Hicks J, Stuber T, Bezos J. Use of Whole-Genome Sequencing to Unravel the Genetic Diversity of a Prevalent Mycobacterium bovis Spoligotype in a Multi-Host Scenario in Spain. Front Microbiol. (2022) 13:915843. doi: 10.3389/fmicb.2022.915843
70. Otchere ID, van Tonder AJ, Asante-Poku A, Sánchez-Busó L, Coscollá M, Osei-Wusu S, et al. Molecular epidemiology and whole genome sequencing analysis of clinical Mycobacterium bovis from Ghana. PLoS ONE. (2019) 14:1–13. doi: 10.1371/journal.pone.0209395
71. Mohamed A. Bovine tuberculosis at the human–livestock–wildlife interface and its control through one health approach in the Ethiopian Somali Pastoralists: a review. One Heal. (2020) 9:100113. doi: 10.1016/j.onehlt.2019.100113
72. Valerio VC, Walther OJ, Eilittä M, Cissé B, Muneepeerakul R, Kiker GA. Network analysis of regional livestock trade in West Africa. PLoS ONE. (2020) 15:1–20. doi: 10.1371/journal.pone.0232681
73. Trewby H, Wright DM, Skuce RA, McCormick C, Mallon TR, Presho EL, et al. Relative abundance of Mycobacterium bovis molecular types in cattle: a simulation study of potential epidemiological drivers. BMC Vet Res. (2017) 13:268. doi: 10.1186/s12917-017-1190-5
74. Rodriguez-Campos S, Aranaz A, De Juan L, Sáez-Llorente JL, Romero B, Bezos J, et al. Limitations of spoligotyping and variable-number tandem-repeat typing for molecular tracing of Mycobacterium bovis in a high-diversity setting. J Clin Microbiol. (2011) 49:3361–4. doi: 10.1128/JCM.00301-11
75. Campbell F, Cori A, Ferguson N, Jombart T. Bayesian inference of transmission chains using timing of symptoms, pathogen genomes and contact data. PLoS Comput Biol. (2019) 15:1–20. doi: 10.1371/journal.pcbi.1006930
76. Rodriguez-Campos S, Schürch AC, Dale J, Lohan AJ, Cunha M V, Botelho A, et al. European 2 - A clonal complex of Mycobacterium bovis dominant in the Iberian Peninsula. Infect Genet Evol. (2012) 12:866–72. doi: 10.1016/j.meegid.2011.09.004
77. Zimpel CK, Patané JSL, Guedes ACP, de Souza RF, Silva-Pereira TT, Camargo NCS, et al. Global Distribution and Evolution of Mycobacterium bovis Lineages. Front Microbiol. (2020) 11:1–19. doi: 10.3389/fmicb.2020.00843
78. Renwick AR, White PCL, Bengis RG. Bovine tuberculosis in southern African wildlife: a multi-species host-pathogen system. Epidemiol Infect. (2007) 135:529–40. doi: 10.1017/S0950268806007205
79. Chaters GL, Johnson PCD, Cleaveland S, Crispell J, De Glanville WA, Doherty T, et al. Analysing livestock network data for infectious disease control: an argument for routine data collection in emerging economies. Philos Trans R Soc B Biol Sci. (2019) 374:264. doi: 10.1098/rstb.2018.0264
80. Reis AC, Cunha M V. The open pan-genome architecture and virulence landscape of Mycobacterium bovis. Microb Genomics. (2021) 7:664. doi: 10.1099/mgen.0.000664
Keywords: Mycobacterium bovis, whole genome sequencing (WGS), genomic surveillance, zoonotic tuberculosis, phylodynamics, phylogeography, multi-host system, one health
Citation: Rossi G, Shih BB-J, Egbe NF, Motta P, Duchatel F, Kelly RF, Ndip L, Sander M, Tanya VN, Lycett SJ, Bronsvoort BM and Muwonge A (2023) Unraveling the epidemiology of Mycobacterium bovis using whole-genome sequencing combined with environmental and demographic data. Front. Vet. Sci. 10:1086001. doi: 10.3389/fvets.2023.1086001
Received: 31 October 2022; Accepted: 14 April 2023;
Published: 17 May 2023.
Edited by:
Christina Leyson, U.S. National Poultry Research Center, Agricultural Research Service (USDA), United StatesReviewed by:
Cristina Kraemer Zimpel, Michigan State University, United StatesHind Yahyaoui Azami, University of Georgia, United States
Laetitia Canini, Agence Nationale de Sécurité Sanitaire de l'Alimentation, de l'Environnement et du Travail (ANSES), France
Copyright © 2023 Rossi, Shih, Egbe, Motta, Duchatel, Kelly, Ndip, Sander, Tanya, Lycett, Bronsvoort and Muwonge. This is an open-access article distributed under the terms of the Creative Commons Attribution License (CC BY). The use, distribution or reproduction in other forums is permitted, provided the original author(s) and the copyright owner(s) are credited and that the original publication in this journal is cited, in accordance with accepted academic practice. No use, distribution or reproduction is permitted which does not comply with these terms.
*Correspondence: Gianluigi Rossi, Zy5yb3NzaUBlZC5hYy51aw==