 Xin Ren
 Juan Ren1
 Gengnan Wang
- 1College of Veterinary Medicine, Hebei Agricultural University, Baoding, Hebei, China
- 2Baoding Institute for Food and Drug Control, Baoding, Hebei, China
Quercetin (QR) is a naturally occurring flavonoid organic compound that has poor solubility in water and highly unstable in alkaline conditions, resulting in limited absorption in poultry. Consequently, in our experiment, QR was employed as a model compound, encapsulated within the caffeic acid graft chitosan copolymer (CA-g-CS) self-assembled micelles to enhance its solubility, stability and exhibit a synergistic antibacterial effect. The optimization of the formula was carried out using a combination of single-factor experimentation and the response surface method. The in vitro release rate and stability of CA-g-CS-loaded QR micelles (CA-g-CS/QR) in various pH media were studied and the pharmacokinetics in white feather broiler chickens was evaluated in vivo. Additionally, the antibacterial activity was investigated using Escherichia coliCMCC44102 and Escherichia coli of chicken origin as the test strain. The results showed the optimized formula for the self-assembled micelles were 4 mL water, 0.02 mg/mL graft copolymer, and 1 mg QR, stirring at room temperature. The encapsulation efficiency was 72.09%. The resulting CA-g-CS/QR was uniform in size with an average diameter of 375.6 ± 5.9 nm. The release pattern was consistent with the Ritger-Peppas model. CA-g-CS/QR also significantly improved the stability of QR in alkaline condition. The relative bioavailability of CA-g-CS/QR was found to be 1.67-fold that of the reference drug, indicating a substantial increase in the absorption of QR in the broiler. Compared to the original drug, the antibacterial activity of CA-g-CS/QR was significantly enhanced, as evidenced by a reduction of half in the MIC and MBC values. These results suggest that CA-g-CS/QR improves the bioavailability and antibacterial activity of QR, making it a promising candidate for clinical use.
1. Introduction
The excessive use of antibacterial drugs in the livestock and poultry industry has caused significant harm to the health of both animals and humans, such as drug poisoning and antibiotic resistance (1). As people's living standards improve and modern farming practices become more widespread, there is growing concern about the safety of these drugs in the food supply. As a result, some antibacterial drugs used for growth promotion in livestock and poultry are being banned or restricted. With advances in pharmacological technology, it has been shown that many natural products are safe and have various beneficial effects. Quercetin (QR), a representative molecule in the flavonoids family, is being increasingly studied as a potential alternative to antibacterial drugs in the livestock and poultry industry (2, 3).
QR, commonly known as oak essence, is a naturally occurring polyhydroxy flavonoid found in fruits, vegetables, and other natural plants, it exhibits various pharmacological activities, such as an antioxidant (4), anti-inflammatory (5), anti-cancer (6), and antibacterial (7) effects. Moreover it has a positive impact on livestock and poultry, reproduction (8), egg-laying performance (9), immunity (10), etc. Despite its structure containing five phenolic hydroxyl groups, its molecular crystals overlap closely, causing its solubility in water to be limited, only 0.17–7.70 μg/mL (11). This affects its in vivo absorption and biological activity, especially in alkaline aqueous solutions, which may destroy QR's structure by hydroxyl ions. Studies have shown that its solubility in water, simulated gastric and simulated intestinal fluids are 7.7 μg/ml, 5.5 μg/ml, and 28.9 μg/ml, respectively. Its oral bioavailability in rats is <17% and even lower in humans, making its use in traditional dosage forms limited (12, 13).
Efforts have been made to overcome these challenges, by incorporating QR into various carriers, such as polymeric conjugates (14), micelles (15), emulsions (16), liposomes (17) and nanocrystals (18). The modification of QR nanoparticles with silver nanoparticles showed a significant improvement in antibacterial effect against drug-resistant Escherichia coli and Staphylococcus aureus (19). Compared to pure QR, the nanoemulsions formulated with QR not only resolved immiscibility and unfavorable interactions, but also displayed greater antioxidant and antibacterial activity and were more effective against Gram-negative bacteria (20). In general, the utilization of natural polymers as drug carriers offers advantages, including low toxicity, versatility in modifying surface properties, increased water solubility, superior biocompatibility, protection of the encapsulated drug, and improvement in stability and prolonged plasma half-life (21, 22).
Chitosan (CS) is a unique cationic polysaccharide with properties such as mucoadhesion, adhesion, film formation, and metal chelation (23). Previous research conducted by our team has demonstrated that chitosan significantly enhances oral absorption. This may be attributed to the reduction in tight junction integrity and improved intestinal absorption facilitated by chitosan (24). However, its limited solubility in water restricts its application. Chemical modification can enhance its solubility and impart new properties to CS (25). Among the various chemical modification methods, the graft copolymerization reaction is the most widely used (26). Additionally, phenolic acids have been effectively covalently linked to CS through graft copolymerization reactions, leading to improve the solubility and biological activity of CS (27, 28).
Caffeic acid (CA) is a phenolic acid compound that exhibits widespread distribution in plants and possesses numerous biological activities. It is characterized by a relatively simple chemical structure and rapid metabolism. Given its status as a widely distributed secondary metabolite in plants, there has been a growing interest in investigating the synthetic pathways and conformational relationships of CA and its derivatives in recent years (29). Extensive research has demonstrated the natural fungicidal properties of CA, which effectively inhibits a diverse range of fungi and bacteria. The inhibitory impact of caffeic acid on E. coli stems from its ability to disrupt the cell wall and membrane structure of bacteria, thereby enhancing cell permeability and causing the leakage of cellular contents. This disruption ultimately leads to the demise of the bacterial cells. (30, 31). The application of CA in derivative design for the synthesis of novel physiologically active green compounds holds considerable practical significance.
Hence, the purpose of this study was to assess the viability of graft copolymer of chitosan and caffeic acid loaded with quercetin micelles (CA-g-CS/QR) in enhancing the stability and solubility of QR and to examine its antibacterial properties and pharmacokinetics in animals following instillation administration, this aims to expand the clinical application of QR.
2. Materials and methods
2.1. Materials and reagents
QR (≥97%), kaempferol (≥98%), caffeic acid (CA, ≥98%), chitosan (CS, 90% deacetylation), all the above reagents were purchased from Source Leaf Bio (Shanghai, China). DMSO was purchased from Comio Chemical Reagent Co., Ltd. (Tianjin, China). Phosphoric acid was purchased from Beichen Founder Reagent Factory (Tianjin, China). Chromatography grade methanol purchased from Fisher Chemical (USA). The entire experiment utilized ultrapure water.
2.2. Experiment animals
The experimental procedures were reviewed and approved by the Institutional Animal Care and Use Committee of Hebei Agricultural University and carried out in accordance with the Guidelines for the Care and Use of Laboratory Animals of China. In this study, 12 healthy 30 days old Chinese white-finned broilers were used for the trial. All broilers were reared from 1 day of age and were provided with adequate basal diets and water, which were formulated to meet or exceed the nutritional requirements of broilers. Room temperature was maintained at 35°C for the first 3 days, then decreased to 28–30°C for the next 2 weeks and 25°C for the rest of the period. Broilers were randomly divided into two treatment groups (six broilers per treatment, n = 6) before the experiment, fasted for 18 h, and watered ad libitum. The experiment was administered by instillation, and blood was collected under the wings during the experiment according to the time designed for the experiment, and the plasma was centrifuged and separated for storage in a refrigerator at −20°C for processing and analysis. At the end of the experiment, broilers were euthanized.
2.3. Establishment of a method for the determination of QR
QR was determined by UV spectrophotometric method by weighing an appropriate amount of QR, dissolving it in methanol and then diluting it to a certain multiple, and scanning it in the wavelength range of 200~600 nm with methanol as the blank control. The results showed that QR had the maximum absorption at 256 nm, so 256 nm was used as the detection wavelength of QR. This assay was developed for the determination of QR content in in vitro assays.
2.4. Preparation of CA-g-CS/QR
2.4.1. Preparation of graft copolymers of chitosan and caffeic acid
0.5 g of CS was completely dissolved in 50 mL of 1% acetic acid solution. subsequently, 1.32 g of ascorbic acid and 1 g of caffeic acid were added. the pH of the solution was adjusted to 6.0 and nitrogen was allowed to flow slowly through the reactor for 60 min. thereafter, 0.375 mL of 10 mol/L hydrogen peroxide was added to the reactor to initiate the reaction. The reaction was carried out under a continuous flow of nitrogen for 16 h. The reacted solution was transferred to a dialysis bag and dialyzed in ultrapure water for 72 h. After dialysis, it was transferred to a flat dish and placed in a freeze dryer for drying (32).
2.4.2. Determination of critical micelle concentration of copolymers
The critical micelle concentration (CMC) of chitosan and caffeic acid graft copolymer (CA-g-CS) was determined by fluorescence spectrophotometry with pyrene as the fluorescent probe, the prepared copolymer solution was diluted step by step, 50 μL pyrene/acetone solution (6 × 10⁻⁵ mol/L) was added to 10 mL different concentration copolymer solutions, vortex for 2 min, sonicated for 2 h and shaken at 37°C without light overnight for putting the probe pyrene into micelles. After the acetone was completely evaporated, cooled to room temperature, and then measured. The measurement was carried out under the condition that the excitation wavelength was 350 nm, and the slit width of both excitation and emission was 5.0 nm. The intensity ratio of the absorption peaks at the first peak (373 nm) and the third peak (383 nm) was selected as the vertical coordinate, and the logarithm of the concentration was used as the horizontal coordinate to make a graph to obtain two straight lines, and the intersection point was CMC.
2.4.3. Preparation of CA-g-CS/QR
A certain concentration of CA-g-CS were prepared according to the above steps, and QR powder was dissolved in a small amount of methanol, and then this QR solution was slowly dropped into the CA-g-CS solution under high-speed stirring at room temperature and stirred overnight to allow the methanol to evaporate fully.
2.5. Optimization of preparation process conditions
2.5.1. Single-factor examination of process conditions
Single-factor experiments were conducted with different weights of QR powder (0.5, 1, 2, and 3 mg), different temperature conditions (25, 37, and 60°C) conditions, different concentrations of CA-g-CS (0.01, 0.02, 0.05, and 0.1 mg/mL), and different volumes of CA-g-CS (2, 4, and 6 mL) as the influencing factors, and the solutions obtained from each factor were filtered and subjected to UV detection. Three parallel experiments were performed for each factor, and the formulation encapsulation rate was calculated according to the following equation:
Where, Wpackage is the amount of encapsulated QR in the micelles and Wtotal is the total amount of QR in the system.
2.5.2. Optimization of preparation conditions by response surface method
According to the results of the single-factor experiments, it is clear that the increase in temperature did not significantly improve the encapsulation rate of CA-g-CS/QR. Therefore, weight of QR, concentration and volume of CA-g-CS, were selected as independent variables to design a 3-factor, 3-level experiment with encapsulation rate as the response value, and the software Design-Expert was used to optimize the process parameters.
2.6. Characterization of CA-g-CS/QR
We evaluated the successful preparation of CA-g-CS by UV absorption and IR detection of CS, CA, and CA-g-CS and compared the solubility of CS as well as CA-g-CS in water. The morphology of CA-g-CS/QR and QR was characterized by transmission electron microscopy. CA-g-CS/QR and QR were dropped on clean copper grids, negatively stained with 2% phosphotungstic acid solution, and the water was evaporated in the air at room temperature. The samples were dried and placed under transmission electron microscopy to observe the morphology.
2.7. Determination of encapsulation rate
The CA-g-CS/QR solution was prepared according to the above method, filtered, and diluted to a certain concentration by adding methanol for UV detection and calculating the encapsulation rate according to the above encapsulation rate formula. All analyses were performed using three batches of samples.
2.8. In vitro release performance
According to the pre-experiment to make QR reach the leaky tank condition and stable, 25% DMSO solution was selected as the release medium. The CA-g-CS/QR solution was prepared, and the above solution was aspirated into a dialysis bag, tied at both ends, placed in 100 mL of release medium, and placed in a water bath at 37°C for release evaluation. Sampling times were 0.5, 1, 1.5, 2, 3, 4, 6, 8, and 10 h, with 1 mL of sample and 1 mL of rehydration solution. UV measurements were performed at the end of sampling and the cumulative release was calculated. Three batches of samples were used for all analyses. CA-g-CS/QR and QR were placed in release media with different pH values and a pharmacokinetic model was fitted to evaluate the release behavior based on the release data.
2.9. Stability studies
The CA-g-CS/QR solution and QR were subjected to different pH conditions, and samples were taken periodically to determine the retention rate of QR and to investigate the effect of pH value on the stability of QR.
2.10. In vivo pharmacokinetic studies
2.10.1. Determination of QR
The Waters Acquity UPLC H-Class system (Waters, Milford, MA, USA) includes a four-stage solvent manager, an autosampler set at 4°C and a Waters Acquity UPLC Shield RP18 column (100 × 2.1 mm, 1.7 μm, Waters. Milford, MA, USA). The mobile phase was methanol-0.1% phosphate (72:28, v/v). Detection was performed by a photodiode array detector at 373 nm at a flow rate of 0.2 mL/min. This assay was developed for the determination of QR in blood plasma.
2.10.2. Preparation of calibration standards
The standard stock solutions of QR and kaempferol were prepared in methanol/0.1% phosphoric acid (4:1, v/v). A series of QR working standard solutions at different concentrations (50.0–5000.0 ng/mL) were prepared by diluting the stock solution. 200 μL of blank plasma were combined with 20 μL of the appropriate QR working solution to create calibration standards, which were then used to create a range of standard solutions with concentrations of 5.0, 10.0, 20.0, 50.0, 100.0, 200.0, and 500.0 ng/mL. Three separate levels of quality control samples representing low, medium, and high QR concentrations of 10.0, 100.0, and 500.0 ng/mL in plasma were generated similarly to the aforesaid procedure.
2.10.3. Plasma sample processing
A 200μL aliquot of plasma was sequentially added 20μL of 40μg/mL kaempferol internal standard, 100 μL of 25% HCL and 2 mL of ethyl acetate vortexed for 2 min equally. This mixture was centrifuged at 5000 rpm for 10 min, and the supernatant was transferred into a centrifuge tube and then concentrated to dryness under nitrogen. The analytes were dissolved in 200 μL of methanol/0.1% phosphoric acid water (4:1, v/v).
2.10.4. Linear relation detection
A series of QR standard solutions with different concentrations were prepared by dilution, 200 μL of blank plasma was taken and 20 μL of QR standard solution was added to obtain standard plasma sample solutions in the concentration range of 5.0~500.0 ng/mL, and the linear regression of QR concentration in plasma was performed by plotting the peak area ratio of QR to kaempferol.
2.10.5. Precision and accuracy and stability
Precision and accuracy were assessed by running the standards (n = 6) for 1 day and three consecutive days for three levels of concentration (10.0, 100.0, and 500.0 ng/ml) at low, medium, and high. The stability of QR in the samples was also investigated by sampling and analyzing the three levels of spiked plasma at −20°C for 1 week and 4°C for 24 h.
2.10.6. Pharmacokinetic experimental design
White-finned broilers were randomly divided into two experimental groups, one for the QR solution group and the other for the CA-g-CS/QR group, with six replicates in each group. The CA-g-CS/QR solution and the original QR solution were prepared and administered to the chickens at a dose of 36 mg/kg, and blood was collected under the wings at 15, 30, 60, 120, 240, 360, 480, 720, 1440, and 2160 min after the administration, placed in sodium heparin anticoagulation tubes and centrifuged to separate the plasma.
2.10.7. Pharmacokinetic data analysis
Pharmacokinetic parameters were estimated by blood concentration-time curves from Phoenix WinNonlin software. The non-atrial model was used to calculate the terminal elimination half-life (t1/2, λz), the area under the blood concentration-time curve (AUC0 − t), terminal feed time (AUC0−∞), total clearance (CL), and volume of distribution (Vd, λz). The peak blood concentration (Cmax) and time to peak (Tmax) were read directly from the observed individual blood concentration-time data. For instillation administration, the relative bioavailability (F) was calculated using the AUC0−∞ of CA-g-CS/QR versus QR.
2.11. Antibacterial test
We selected Escherichia coli CMCC44102 and Escherichia coli of chicken origin as experimental strains to determine their Minimum Inhibitory Concentration (MIC) and Minimum Bactericidal Concentration (MBC). The culture medium was configured and autoclaved, and the bacteria were cultured. The bacterial broth of the logarithmic growth period was diluted by micro broth twofold dilution method, 100 μL broth was added to each well of a sterile 96-well plate, and then 100 μL of prepared drug solution was added to the first well respectively, mixed well, and then diluted in multiples until the last well was mixed and 100 μL of the mixture was discarded. Each well was added with 100 μL of the prepared bacterial diluent, and a positive control (with bacteria and no drug) and a negative control (without bacteria and no drug) were set up. 24 h of incubation at 37°C was taken out and bacterial growth was observed, and each group of experiments was repeated at least three times, and the lowest antibacterial drug concentration contained in the wells without bacterial growth was the MIC. The tritriazolium chloride (TTC) method was used to determine the MIC results. 5 g/L TTC was added to each well of the 96-well plate after incubation for 1 h at 37°C, and the MIC was determined as the lowest antibacterial drug concentration in the wells with bacterial growth and the wells without bacterial growth. 100 μL of the liquid from each well clarified in the above test group was spread on solid, and the lowest drug concentration for no colony growth was its MBC. Agar plate experiments were also performed using the Oxford cup method, using CA-g-CS/QR with QR aqueous solution and maintaining the same concentration, sterile water group and CA-g-CS group were set, and three parallel experiments were performed to further confirm the antibacterial activity of the compounds.
3. Results
3.1. Critical micelle concentration of graft copolymer
As shown in Figure 1, the CMC value of CA-g-CS was 5 × 10⁻³ mg/mL, and the results showed that the emission spectrum intensity of pyrene gradually increased with the increase of CA-g-CS concentration. When the CA-g-CS solution concentration was lower than 5 × 10⁻³ mg/mL to make, there was no significant change in the I373/I383 value, and the emission spectrum changed when the CA-g-CS solution concentration was higher than 5 × 10⁻³ mg/mL.
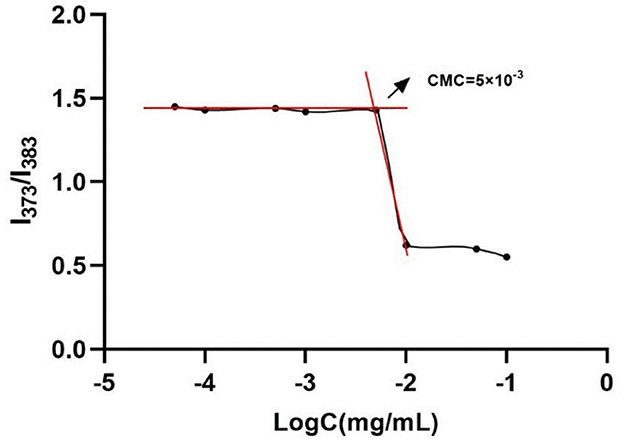
Figure 1. Critical micelle concentration of CA-g-CS(CMC = 5 × 10⁻³).
3.2. Single-factor experiments
From Figure 2A, it can be seen that the encapsulation rate of CA-g-CS/QR increased with the increase of the solution volume, and after 4 mL, the effect of volume on the encapsulation rate did not change much, so the best volume was determined to be 4 mL. From Figure 2B, it can be seen that the encapsulation rate decreased instead of increased after the concentration of CA-g-CS reached 0.02 mg/mL, so the concentration of CA-g-CS was chosen to be the best at 0.02 mg/mL. As shown in Figure 2C, the encapsulation rate started to decrease when the amount of QR reached 1 mg, so 1 mg of QR was chosen as the best amount. From the Figure 2D graph, it can be seen that the increase in temperature does not improve the encapsulation rate of CA-g-CS/QR, probably with the increase in temperature, there is a certain effect on the nature of the drug, resulting in a decrease in the encapsulation rate, so the room temperature can be selected for the preparation.
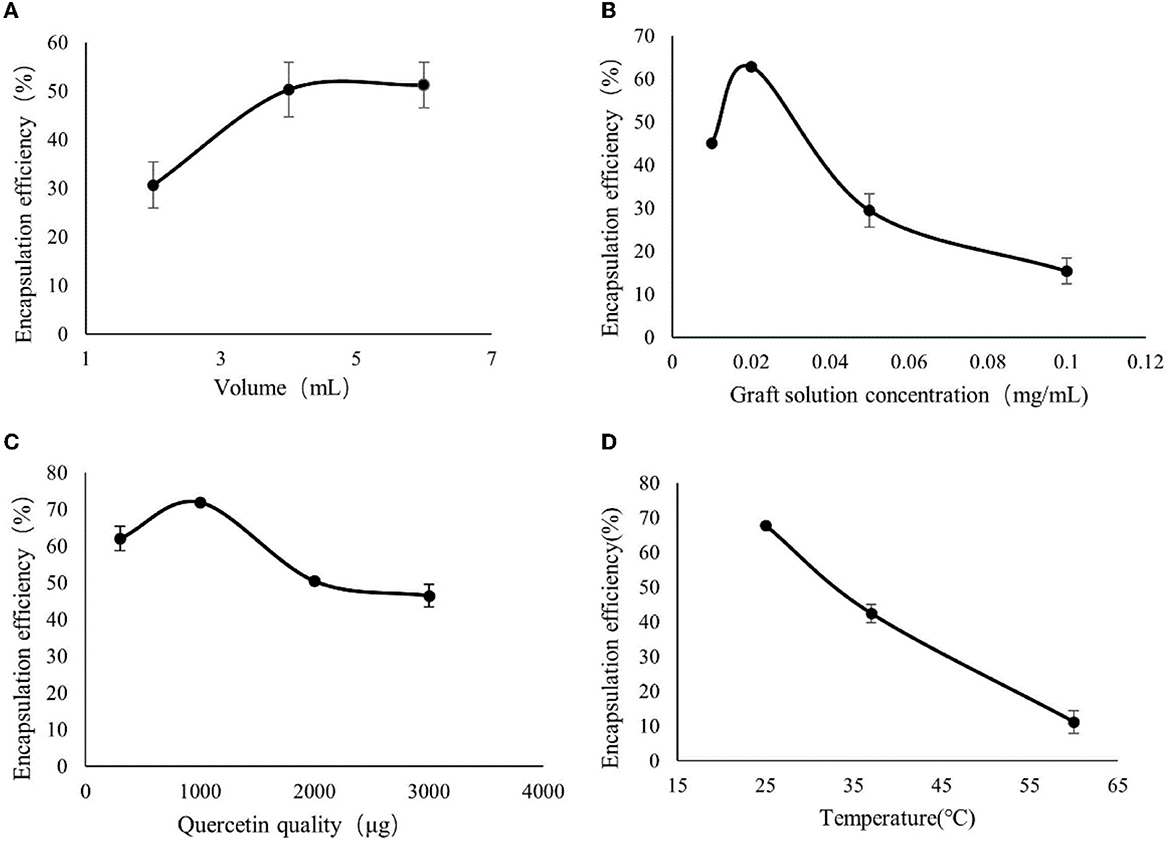
Figure 2. Single-factor experimental results. (A) The effect of CA-g-CS solution volume on the preparation of CA-g-CS/QR; (B) The effect of CA-g-CS solution concentration on the preparation of CA-g-CS/QR; (C) The effect of QR dosage on CA-g-CS/QR preparation; (D) The effect of temperature on CA-g-CS/QR preparation.
3.3. Response surface data
We used the results of the single-factor test to optimize the optimal conditions for the synthesis of CA-g-CS/QR. We found that temperature had minimal impact on the results, and the preparation method was improved through the use of the response surface method. The effect of the preparation method variables (A, B, and C) on the dependent variable (Y) was systematically optimized using response surfaces. The regression equation for each factor and response value after regression fitting was Y=69.00-1.01A+1.92B-0.74C+2.09AB-2.48AC+0.062BC-4.49A2-7.98B2-5.92C2. The results showed (Table 1) that the model P < 0.05, indicating that the model was significant. The misfit term = 0.2517 > 0.05 and the model misfit term is not significant. The correlation coefficient R2 = 98.11%, indicating that 98.11% of the data could be explained by the equation, which has a high correlation, and the experimental error of the model is reasonable. And the correlation off correction coefficient = 95.67%, indicating that high accuracy and reliability of the experiment (33). The results showed that the influence of each factor on the encapsulation rate was B>A>C in order, and the test points of the normal distribution of residuals (Figure 3A) were basically on the same straight line, indicating that the model could better reflect the true relationship between the factors and the response values, confirming that there was a good correlation between the experimental values. The optimal preparation conditions obtained from the analysis were QR quality amount of 1 mg, solution volume of 4 mL, and graft solution concentration of 0.02 mg/mL. And the response surface analysis plots were obtained based on the regression equation, as shown in Figure 3B, the response surface slope is steeper, indicating that the interaction between the amount of QR and the volume of the solution has a strong effect on the encapsulation rate. While the experimental factors interacting in Figures 3C, D have relatively minor impact on the encapsulation rate.
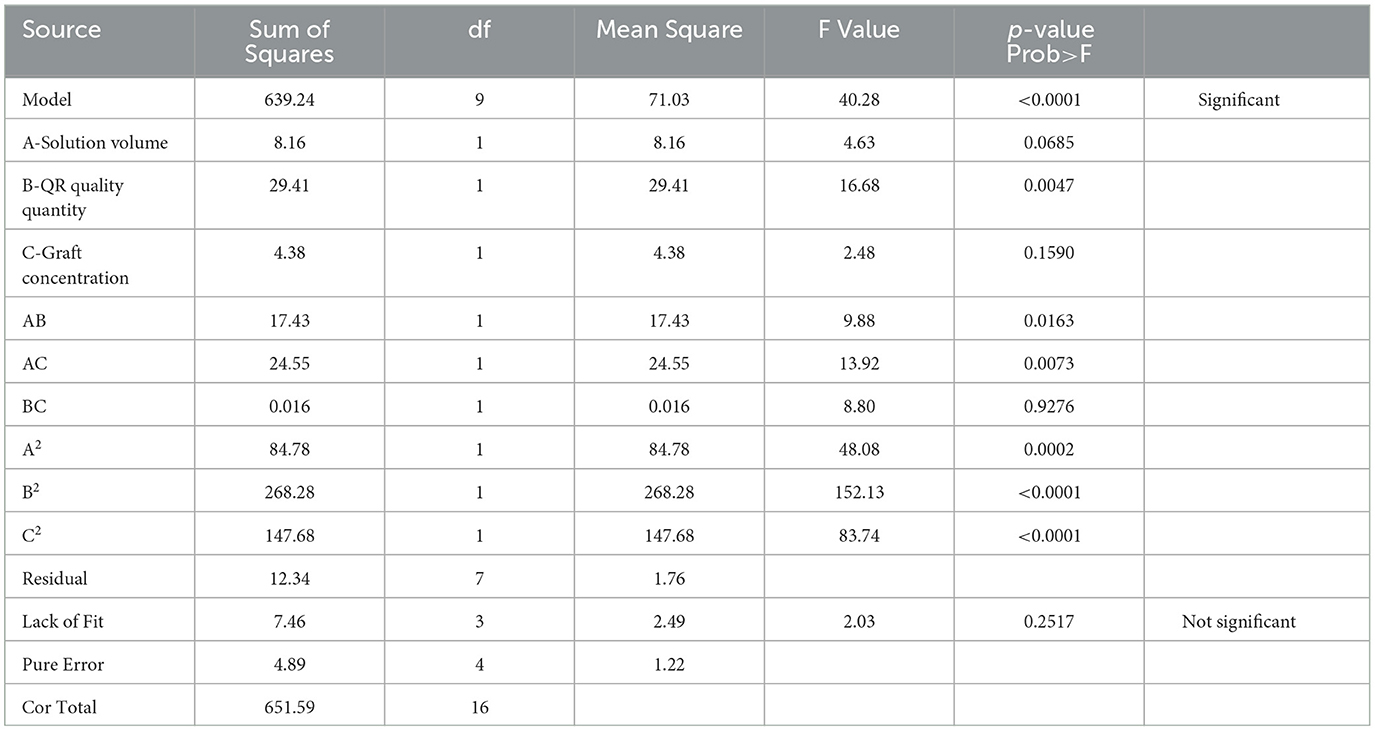
Table 1. Variance analysis of response surface regression model.
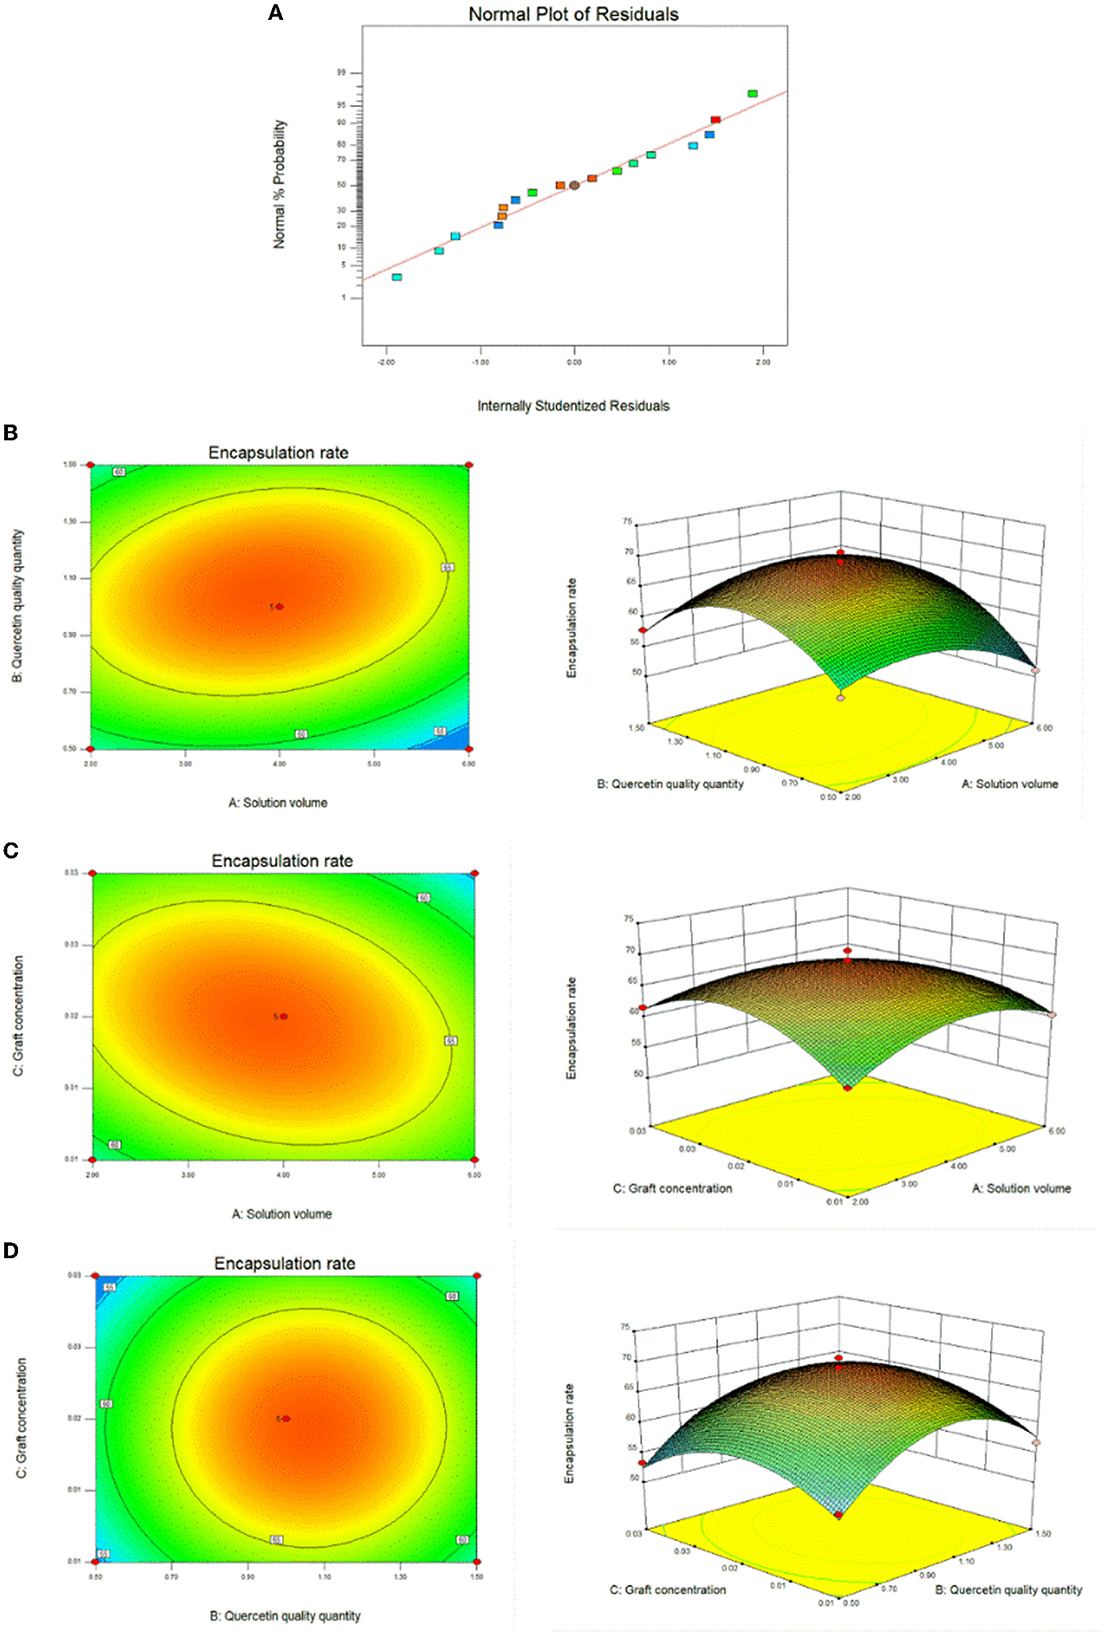
Figure 3. Response surface plots of the interaction effects of different reaction conditions. (A) Response surface method to optimize the residual normal plots of the preparation method; (B) Response surface plot of the effect of the interaction between solution volume and quercetin amount on the preparation of CA-g-CS/QR; (C) Response surface plot of the effect of the interaction of solution volume and graft copolymer concentration on the preparation of CA-g-CS/QR; (D) Response surface plots of the effect of the interaction between quercetin amount and graft concentration on CA-g-CS/QR preparation.
3.4. Validation tests
Based on the results of response surface analysis, the preparation conditions of CA-g-CS/QR were determined as follows: QR 1 mg, CA-g-CS volume 4 mL, and CA-g-CS concentration 0.02 mg/mL. The encapsulation rate under these conditions can reach 70.78%, and the encapsulation rate obtained from the validation test according to this preparation condition is 71.98%, which is very close to the predicted value of the model, indicating that the final optimization of the response surface model The final optimization result of the response surface model is reliable.
3.5. Characterization of CA-g-CS/QR.
Supplementary Figures 1, 2 present the UV and IR spectra of CS, CA, and CA-g-CS, respectively. It is noteworthy that CS exhibits limited solubility in water, whereas the CA-g-CS compound synthesized in our study demonstrates favorable solubility in aqueous solutions. The UV spectrograms obtained for CS, CA, and CA-g-CS reveal notable distinctions in the UV absorption spectra among these three compounds. In IR spectra, it can be judged that the new absorption peak of CA-g-CS at 1619.55 cm−1 may be caused by the stretching vibration of caffeic acid C=C, which proves that caffeic acid can be successfully grafted onto chitosan. Both UV and IR results verified the successful preparation of CA-g-CS.
Figure 4A shows aqueous QR solution, and Figure 4B shows CA-g-CS/QR solution, from which it can be observed that aqueous QR solution exhibits poor solubility and rapid sedimentation, while QR solubility increases in the CA-g-CS. The electron micrographs Figure 4D showed that the particle size of the CA-g-CS/QR prepared in this experiment was 375.6 ± 5.9 nm and the CA-g-CS/QR morphology was small, while the QR Figure 4C was not uniform in size and showed larger rod-shaped crystals. The prepared micelles showed uniform dispersion without aggregation and a smaller particle size compared to the original drug, which was characterized by larger rod-shaped crystals.
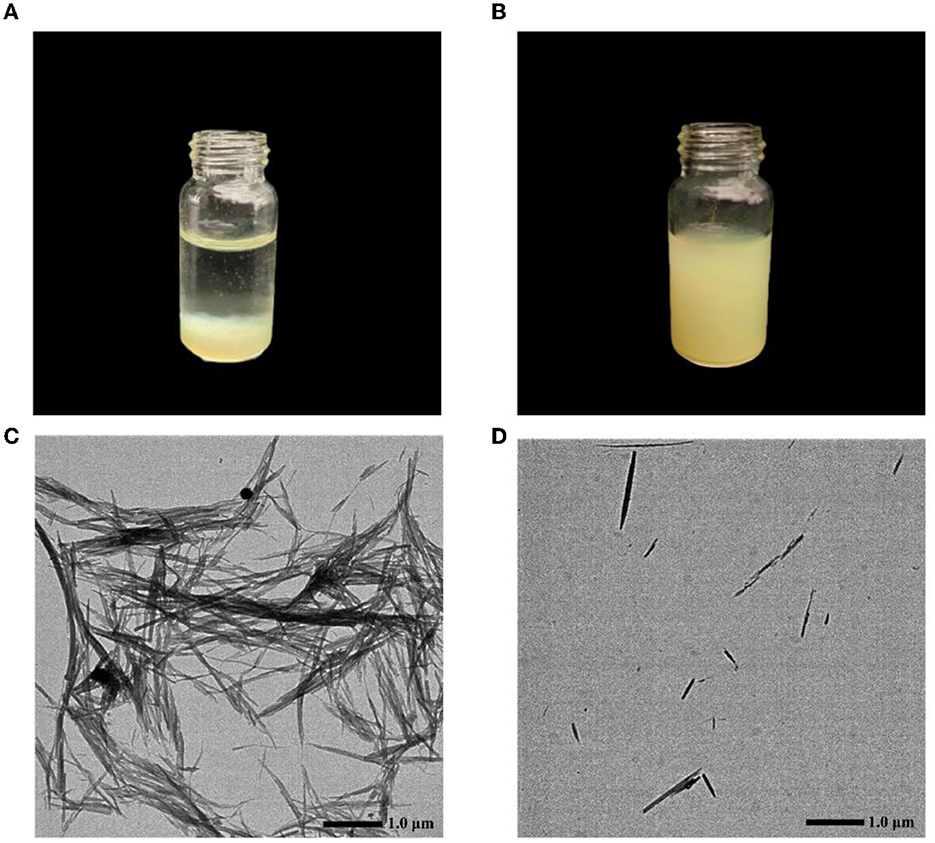
Figure 4. QR and CA-g-CS/QR characterization chart. (A) Aqueous QR solution; (B) CA-g-CS/QR solution; (C) QR transmission electron micrograph, particle size 1.5 ± 0.1μm; (D) CA-g-CS/QR transmission electron micrograph, particle size 375.6 ± 5.6nm.
3.6. CA-g-CS/QR encapsulation rate measurement
The encapsulation rate of CA-g-CS/QR was determined to be 72.09%, which improved the difficulty of poor solubility of QR in water. The determination of the encapsulation rate further validated the feasibility of CA-g-CS/QR preparation.
3.7. In vitro dissolution
In vitro release experiments Figure 5A showed that CA-g-CS/QR showed a significant release-promoting effect compared with QR, and the drug release rate reached 75.89%. The drug release rate was faster when the release medium was pH = 1.2 (Figure 5B), and the drug release was relatively stable when the release medium was pH = 6.8 (Figure 5C). CA-g-CS also enhanced the release rate of QR when the release medium was pH = 7.4 (Figure 5D). In order to clarify the release mechanism of CA-g-CS/QR, several mathematical models were used to fit the release kinetics of CA-g-CS/QR, and the fitting results were shown in Table 2. The fitting results were determined according to R2. As can be seen from the table, the Ritger-Peppas model has the best regression effect. The Ritger-Peppas model was used to study the mechanism of drug release in different pH media. The R2 obtained were 97.72%, 96.72%, and 91.18% respectively, so it is reasonable to choose the Ritger-Peppas model to describe the release mechanism of the drug. The fitted equations were F=3.379t0.541, F=2.855t0.556, and F=1.667t0.630 at pH of 1.2, 6.8, and 7.4, respectively, where the n values were all consistent with 0.45 <n <0.89, so the drug release followed the combined effect of drug diffusion and skeletal dissolution at this time.
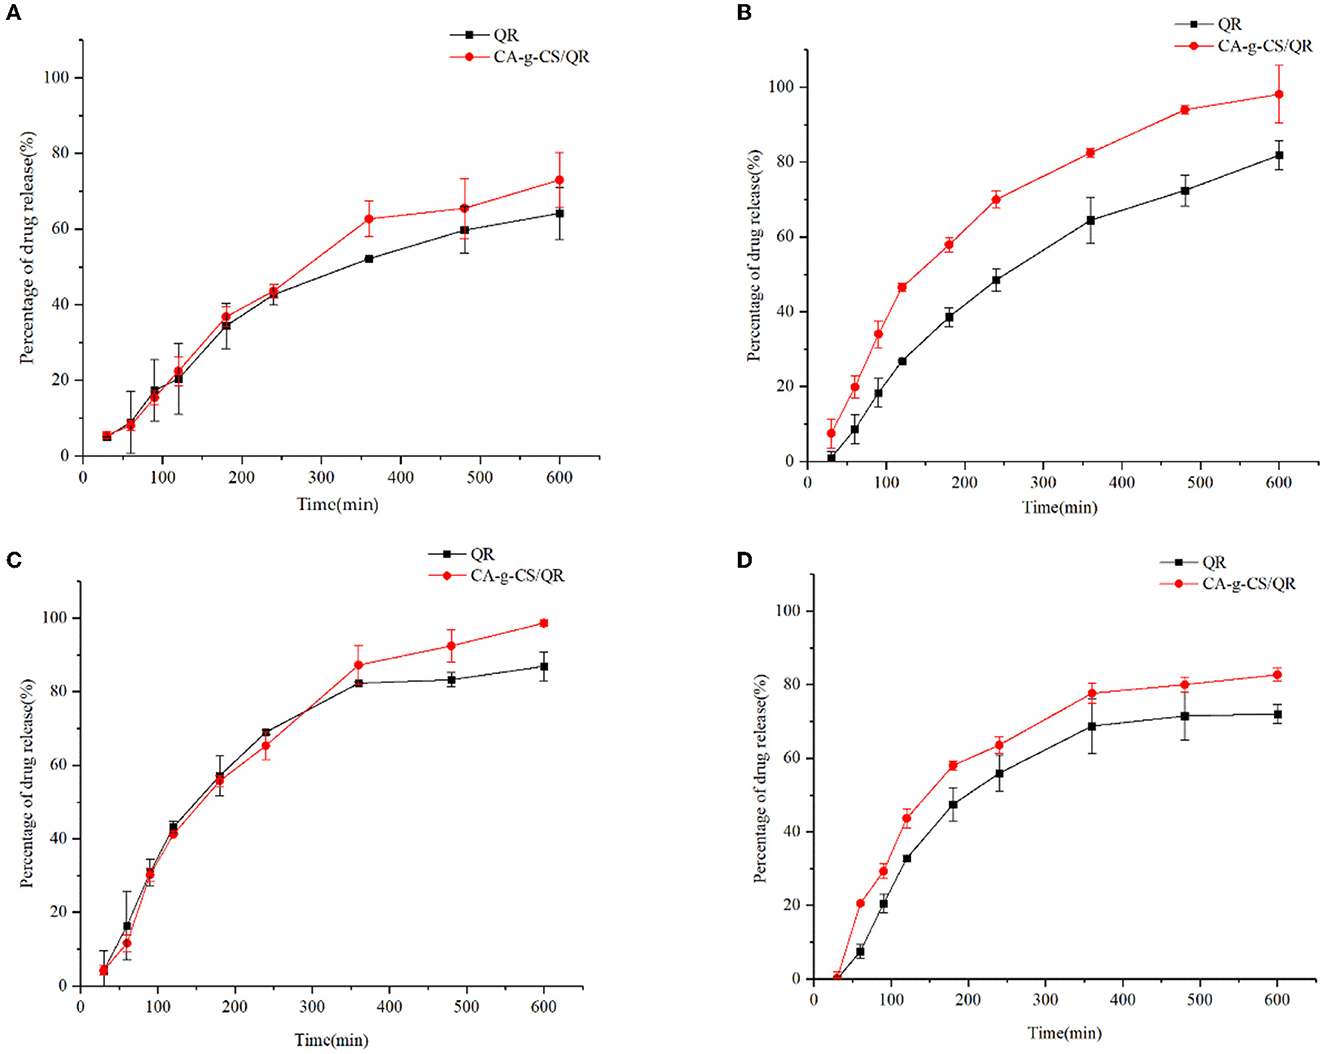
Figure 5. In vitro release analysis of QR and CA in different media. (A) Cumulative release of CA-g-CS/QR and QR in 25% DMSO; (B) Cumulative release of CA-g-CS/QR with QR in release medium at pH 1.2; (C) Cumulative release of CA-g-CS/QR with QR in release medium at pH 6.8; (D) Cumulative release of CA-g-CS/QR with QR in release medium at pH 7.4.
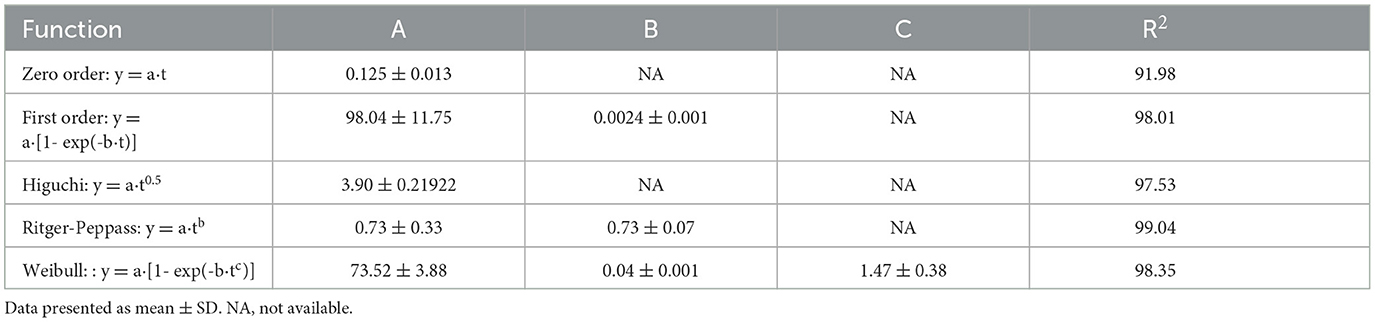
Table 2. Different kinetic model fitting of CA-g-CS/QR drug release data.
3.8. Stability test
As can be seen from Figure 6, the preservation rate of QR decreased significantly with increasing solution pH, while CA-g-CS/QR was significantly better than QR under different pH environmental conditions. In particular, the preservation rate of CA-g-CS/QR was significantly higher than that of QR solution in the medium with pH 7.4, and the results were consistent with the results of in vitro dissolution experiments.
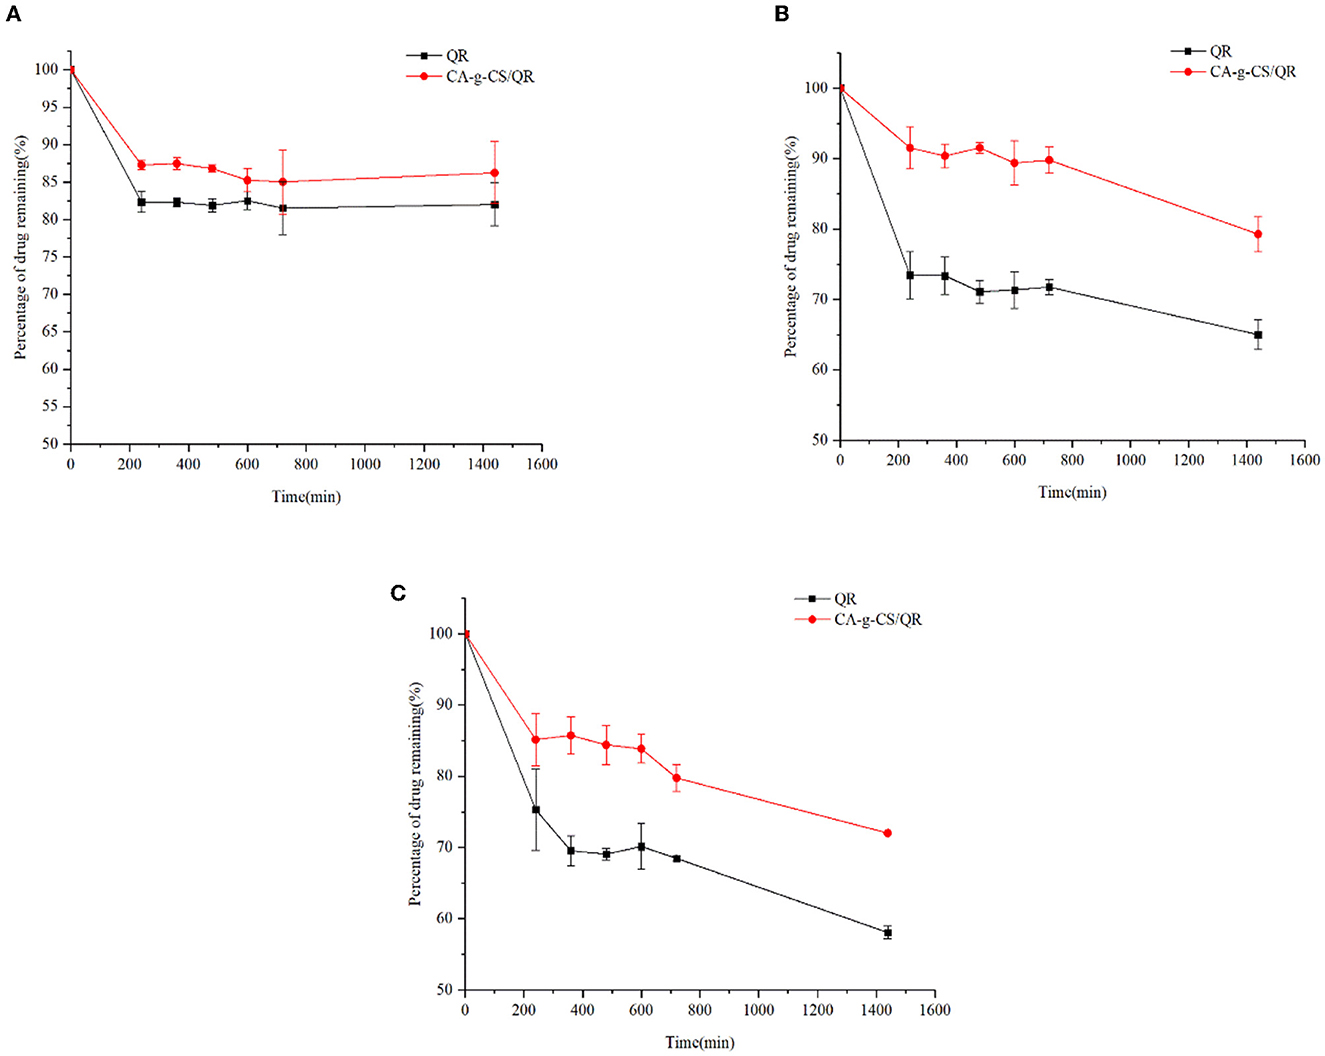
Figure 6. Investigation of QR and CA-g-CS/QR stability in different pH media. (A) Investigation of the stability of CA-g-CS/QR and QR in medium at pH 1.2; (B) Investigation of the stability of CA-g-CS/QR and QR in medium at pH 6.8; (C) Investigation of the stability of CA-g-CS/QR and QR in medium at pH 7.4.
3.9. Pharmacokinetic studies
3.9.1. Methodological validation
The calibration curve is Y = 0.0004x + 0.0087 (20.0–500.0 ng/mL) R2 = 0.9993; Y = 0.0004x + 0.0059 (5.0–100.0ng/mL) R2 = 0.9993. The data of precision, accuracy, stability, and recovery are shown in Tables 3, 4.
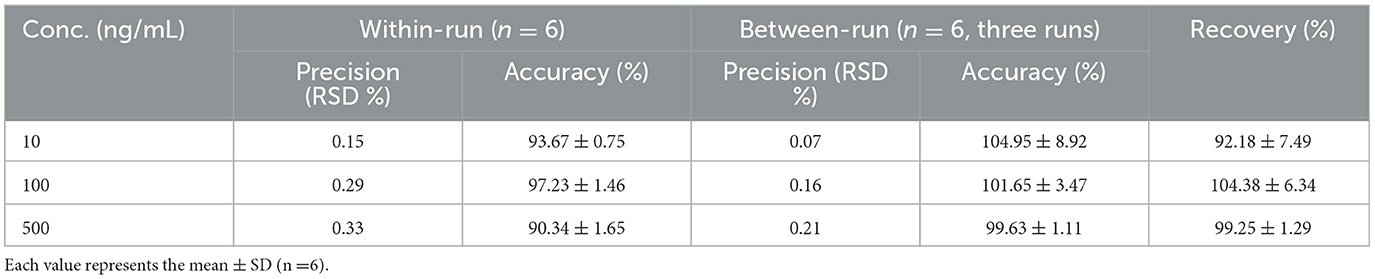
Table 3. The within-day and between-day precision, accuracy and stability of this method for the determination of QR in plasma.
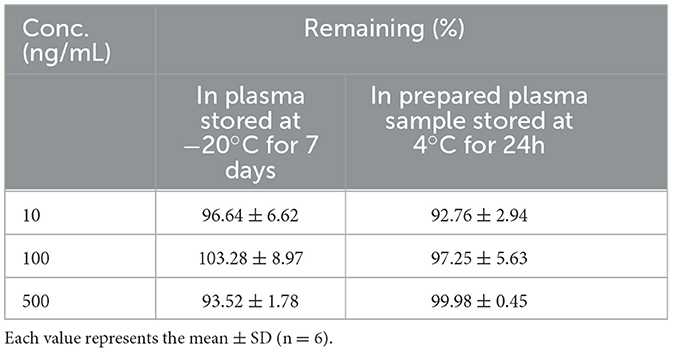
Table 4. Stability of QR in white broiler plasma at −20°C for 7 days and 4°C for 24 h assay.
3.9.2. Pharmacokinetic studies
The relationship between the mean blood concentration and time of CA-g-CS/QR and the prodrug is shown in Figure 7, and the pharmacokinetic parameters are shown in Table 5. CA-g-CS/QR increased the absorption of QR in white broiler chickens over 36 h. Compared with the QR prodrug, the Cmax increased by 1.23 times, the area under the curve AUC0−∞ of the CA-g-CS/QR was about 1.7 times that of the prodrug, and the clearance CL decreased to 126.04 mL/min/kg and the bioavailability was 167%, which indicated that the CA-g-CS/QR could promote the absorption of QR.
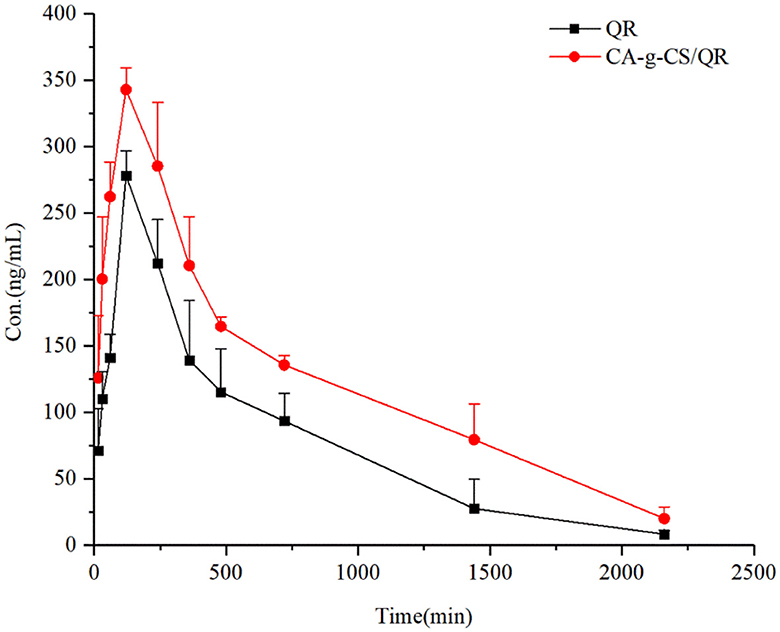
Figure 7. Time profiles of mean blood concentrations in white-finned broiler chickens after infusion of QR or CA-g-CS/QR (i.g., 36 mg/kg) administration (mean ± SD, n = 6).
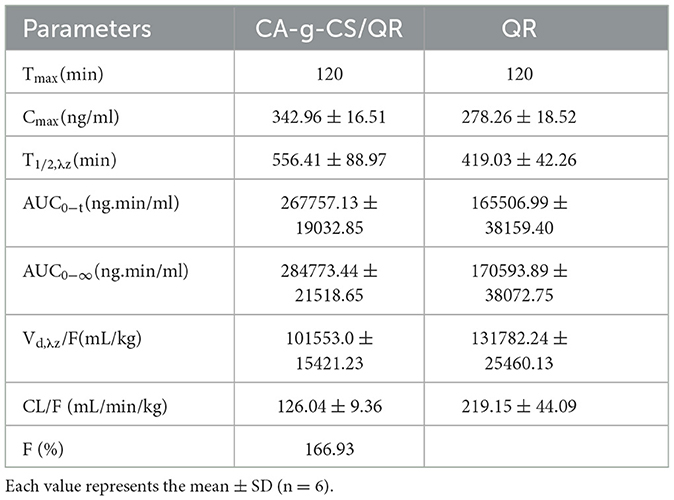
Table 5. Pharmacokinetic parameters after QR or CA-g-CS/QR administration.
3.10. Antibacterial test
CA-g-CS/QR could effectively inhibit the growth of Escherichia coli and chicken Escherichia coli, and the inhibition effect was significant with the increase in CA-g-CS/QR concentration. For Escherichia coliCMCC44102, the measured MIC and MBC of QR were 0.013 mol/L and 0.026 mol/L, while the MIC and MBC of the CA-g-CS/QR were 0.0065 mol/L and 0.013 mol/L. For E. coli of chicken origin, the MIC and MBC measured by QR were 0.0585 mol/L and 0.117 mol/L, respectively, while the MIC and MBC of CA-g-CS/QR were 0.029 mol/L and 0.0585 mol/L, respectively, and the inhibition circle and diameters of each experimental group is marked in Figure 8, and it can be clearly observed that the inhibition activity of CA-g-CS/QR group is better than QR group which judged that the CA-g-CS/QR could significantly improve the antibacterial effect of QR.
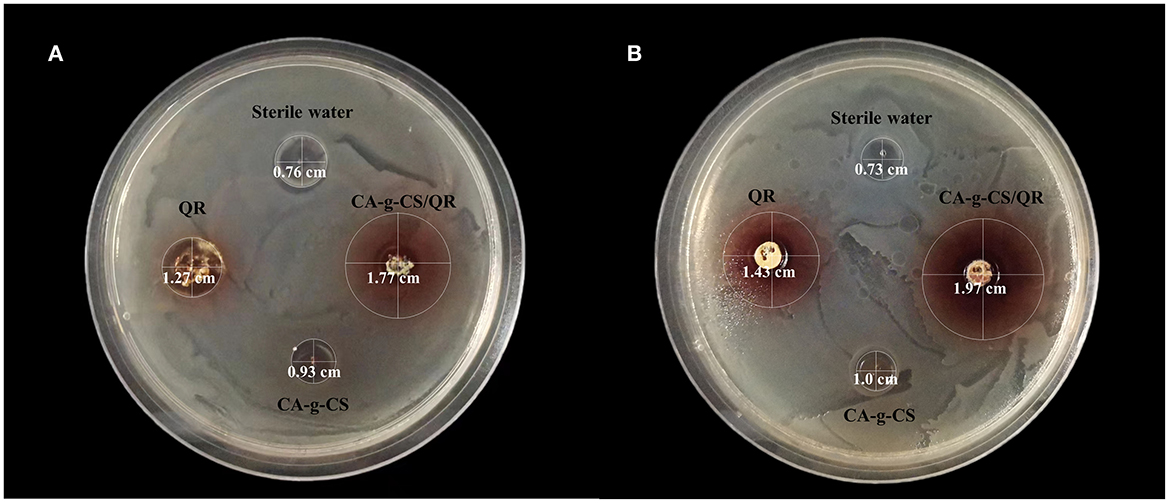
Figure 8. QR and CA-g-CS/QR antibacterial effect chart. (A) Effect of QR, CA-g-CS/QR, CA-g-CS aqueous solution and sterile water on the inhibition circle of E. coli CMCC44102 agar plate. The diameter of the inhibition circle is 1.27 cm, 1.77 cm, 0.93 cm, 0.76 cm respectively in order. (B) Effect of QR, CA-g-CS/QR, CA-g-CS aqueous solution and sterile water on the inhibition circle of E. coli agar plate of chicken origin. The diameter of the inhibition circle is 1.43 cm, 1.97 cm, 1.0 cm, 0.73 cm respectively in order.
4. Discussion
The ban on the use of antibiotics as additives in animal production has led to a new consensus in utilizing biologically active chemical chemicals in plants to enhance animal performance and prevent animal illnesses (34). QR exhibits a range of pharmacological properties making it a promising candidate as green feed additives in animal production. Despite its potential benefits, QR's low solubility and bioavailability have prompted research into the synthesis of QR derivatives to improve its properties (2).
To examine the self-assembly behavior of CA-g-CS in water, we employed pyrene as a fluorescent probe. The pyrene interacted with the hydrophobic region of CA-g-CS while its hydrophilic end was exposed to the aqueous environment, leading to the maintenance of micelle stability. The results showed that the emission spectrum intensity of pyrene increased as the concentration of CA-g-CS increased. The polarity of the pyrene's medium affected the intensity of its vibrational peaks in the emission spectrum. When the CA-g-CS solution concentration was below 5 × 10⁻³ mg/mL, the I373/I383 values remained stable, suggesting that CA-g-CS was present as single chains and non-stable micelles. However, when the concentration exceeded 5 × 10⁻³ mg/mL, the copolymer self-assembles in water to form nano micelles, increasing in intermolecular force and transfer of hydrophobic pyrene from the polar water to the non-polar hydrophobic region of the nano micelles, leading to changes in the emission spectra (35).To synthesize CA-g-CS, we employed free radical-mediated graft copolymerization reaction. This reaction method offers several advantages, such as utilizing green materials and reagents, producing a less toxic reaction products, and being economically and environmentally friendly as it can be performed in room temperature and reduces the degradation and oxidation of phenolic acid (36, 37). Self-assembled micelles exhibit exceptional physical and chemical characteristics, allowing for the reduction or avoidance of toxic side effects from drugs on healthy tissues and organs. This is achieved by encapsulating drugs at higher concentrations specifically at the site of the lesion through self-assembly. In comparison to conventional micelles, self-assembled micelles are more straightforward to prepare and widely utilized due to their lack of dependence on emulsifiers and additional media (38, 39).
Chemical composition is the material basis of a drug, so the number and position of absorption peaks on the absorption spectra of the same drug should be the same, and if there are differences in the number, shape and position of absorption peaks, they can be used to differentiate the drugs. We chose UV absorption spectra and IR spectra to verify the successful preparation of CA-g-CS. the solubility of CS in water was poor, while our prepared CA-g-CS showed good solubility in water. the results of UV and IR spectra of CS, CA and CA-g-CS showed significant differences between the three. The successful preparation of CA-g-CS was verified, which laid the foundation for the successful preparation of CA-g-CS/QR. And we used the results of the single-factor test to optimize the optimal conditions for the synthesis of CA-g-CS/QR. We found that temperature had minimal impact on the results, and the preparation method was improved through the use of the response surface method. The model showed a significant results, with a P value of less than 0.05. The model fit was also deemed appropriate as the misfit term (0.2517) was greater than 0.05, and the correlation coefficient (R2) was 98.11%, indicating that 98.11% of the data could be explained by the equation. which has a high correlation, and the experimental error of the model is reasonable. Furthermore, the adjusted correlation coefficient () was 95.67%, indicating the high accuracy and reliability of the experiment (33). The residuals were found to be normally distributed, further confirming the validity of the model. The optimal preparation condition was determined to be the loading of 1 mg of QR with 4 mL of 0.02 mg/mL CA-g-CS. And the response surface analysis plots were obtained based on the regression equation, and the shape of the response surface was examined after fitting. The optimal process parameters were determined through the analysis of response surface contours, and the interaction between factors could be visualized through the examination of 3D surface plots (40, 41). In the response surface plot, the slope of the surface reflects the level of influence of the test factor on the response value. A steeper slope indicates a greater influence of the test factor on the response value (42). Our experimental results indicate that the interaction between the quantity of QR and the volume of the solution has a significant impact on the encapsulation rate. Additionally, the prepared micelles showed uniform dispersion without aggregation and a smaller particle size compared to the original drug, which was characterized by larger rod-shaped crystals. The determination of the encapsulation rate of the prepared micelles further validated the feasibility of CA-g-CS/QR preparation.
QR is insoluble in water and highly unstable in an alkaline conditions, making it challenging to obtain accurate results in the in vitro release assay with a conventional dissolution medium. However, 25% DMSO was selected as the release medium as it satisfied the leaky tank condition and ensured improved release outcomes. The in vitro release experiments demonstrated that CA-g-CS/QR exhibited a significant release-enhancing effect compared to the QR stock solution. As the CA-g-CS/QR are conjugates, the release of the drug occurs in two stages. The first stage involves the disruption of the encapsulated structure, where the chemically linked chains within the molecule are cleaved before the drug is finally released (43). The combination of CS with drugs can produce a triggered release behavior due to the pH sensitivity of chitosan (44). The weak alkalinity of the release medium and the instability of QR in alkaline solutions caused changes in QR properties in the post-release solution measured after 10 hours, which were consistent with the results of examining the stability of CA-g-CS/QR in the medium solution with pH=7.4. The encapsulation of CA-g-CS provided a protective effect on QR, which became more significant with an increase in solution pH. This is because QR, a flavonoid, is weakly acidic and can exist stably under acidic conditions, but can easily be converted into organic quinones under alkaline conditions (45). The effect of environmental acidity and alkalinity was mitigated through encapsulation with CA-g-CS. Furthermore, the drug release kinetic model was used to fit the drug release data of the particles under different pH conditions. The values of “n” obtained from fitting the drug release data to the Ritger-Peppas model was all consistent with 0.45 <n <0.89, indicating that the drug release was a result of a combination of drug diffusion and skeletal dissolution at this time. These results correspond to the in vitro release performance results.
The clinical effects of QR have been of much interest since the 1990s, and designing new dosage forms have become a priority as traditional forms such as granules or tablets are insufficient for clinical use. Research has indicated that QR micelles have a longer retention time in animals, leading to a higher drug utilization (46). The effects of QR on chicken performance, such as improved eggshell strength and thickness (9, 47) and meat quality and lipid metabolism (48, 49) have been widely studied. While the pharmacokinetic metabolism of QR has been extensively studied in rats, there is limited knowledge in poultry (50, 51). The ultra-high-performance liquid chromatography (UPLC) method was used in this study to determine QR concentration in broiler plasma, with kaempferol as the internal standard, is accurate, sensitive, simple, specific, and reproducible. The results of our in vivo pharmacokinetic study demonstrate that the CA-g-CS/QR can reduce the in vivo clearance of QR and prolong its elimination half-life, effectively improving its bioavailability in vivo and providing a foundation for future in vivo studies of QR in poultry.
QR boasts a broad-spectrum of antimicrobial properties and shows more potent antibacterial effects against Gram-negative bacteria than Gram-positive ones. Its ability to damage cell walls, impede protein/nucleic acid synthesis, and act as a metabolic antagonist is opening up new possibilities for addressing the issue of multidrug resistance in clinical settings (7). Escherichia coli, a common pathogenic bacteria causing infections in livestock and poultry, was targeted in this experiment. Results showed that the MIC and MBC of the CA-g-CS/QR were lower than those of the pure drug, implying that our micelles demonstrate an improved level of bacterial inhibition compared to the original drug. Further research will be conducted to more comprehensively verify this idea.
In conclusion, CA-g-CS/QR not only has a protective effect on QR at lower pH value, slowing down its degradation, but also enhances its antibacterial activity. Most importantly, CA-g-CS/QR showed higher bioavailability in vivo, indicating a significant improvement in the formulation performance of QR proagents. The successful preparation of CA-g-CS/QR laid a foundation for further study of insoluble drugs and their pharmacokinetics in vivo.
Data availability statement
The original contributions presented in the study are included in the article/Supplementary material, further inquiries can be directed to the corresponding author.
Ethics statement
The animal study was reviewed and approved by Institutional Animal Care and Use Committee of Hebei Agricultural University.
Author contributions
Methodology, formal analysis, and writing—original draft preparation: XR and GW. Validation: XR, JR, and YL. Investigation and writing—review and editing: XR, JR, and GW. Supervision: SY and GW. Project administration and funding acquisition: GW. All authors have read and agreed to the published version of the manuscript.
Funding
This work was supported by the National Natural Science Foundation of China (32002343) and the Hebei Natural Science Foundation (C2022204090).
Conflict of interest
The authors declare that the research was conducted in the absence of any commercial or financial relationships that could be construed as a potential conflict of interest.
Publisher's note
All claims expressed in this article are solely those of the authors and do not necessarily represent those of their affiliated organizations, or those of the publisher, the editors and the reviewers. Any product that may be evaluated in this article, or claim that may be made by its manufacturer, is not guaranteed or endorsed by the publisher.
Supplementary material
The Supplementary Material for this article can be found online at: https://www.frontiersin.org/articles/10.3389/fvets.2023.1218025/full#supplementary-material
References
1. Wang S, Yao J, Zhou B, Yang J, Chaudry MT, Wang M, et al. Bacteriostatic effect of quercetin as an antibiotic alternative in vivo and its antibacterial mechanism in vitro. J Food Prot. (2018) 81:68–78. doi: 10.4315/0362-028X.JFP-17-214
2. Li Y, Yao J, Han C, Yang J, Chaudhry MT, Wang S, et al. Quercetin, inflammation and immunity. Nutrients. (2016) 8:167. doi: 10.3390/nu8030167
3. Oktyabrsky ON, Bezmaternykh KV, Smirnova GV, Tyulenev AV. Effect of resveratrol and quercetin on the susceptibility of escherichia coli to antibiotics. World J Microbiol Biotechnol. (2020) 36:167. doi: 10.1007/s11274-020-02934-y
4. Liu S, Zhu Y, Liu N, Fan D, Wang M, Zhao Y. Antioxidative properties and chemical changes of quercetin in fish oil: quercetin reacts with free fatty acids to form its ester derivatives. J Agric Food Chem. (2021) 69:1057–67. doi: 10.1021/acs.jafc.0c07273
5. Shabir I, Kumar PV, Shams R, Dar AH, Dash KK, Khan SA, et al. Promising bioactive properties of quercetin for potential food applications and health benefits: a review. Front Nutr. (2022) 9:999752. doi: 10.3389/fnut.2022.999752
6. Dogan M. Assessment of mechanism involved in the apoptotic and anti-cancer activity of quercetin and quercetin-loaded chitosan nanoparticles. Med Oncol. (2022) 39:176. doi: 10.1007/s12032-022-01820-x
7. Nguyen T, Bhattacharya D. Antimicrobial activity of quercetin: an approach to its mechanistic principle. Molecules. (2022) 27. doi: 10.3390/molecules27082494
8. Amevor FK, Cui Z, Du X, Ning Z, Shu G, Jin N, et al. Combination of quercetin and vitamin e supplementation promotes yolk precursor synthesis and follicle development in aging breeder hens via liver-blood-ovary signal axis. Animals (Basel). (2021) 11. doi: 10.3390/ani11071915
9. Amevor FK, Cui Z, Ning Z, Du X, Jin N, Shu G, et al. Synergistic effects of quercetin and vitamin e on egg production, egg quality, and immunity in aging breeder hens. Poult Sci. (2021) 100:101481. doi: 10.1016/j.psj.2021.101481
10. Amevor FK, Cui Z, Du X, Ning Z, Deng X, Xu D, et al. Synergy between dietary quercetin and vitamin e supplementation in aged hen's diet improves hatching traits, embryo quality, and antioxidant capacity of chicks hatched from eggs subjected to prolonged storage. Front Physiol. (2022) 13:873551. doi: 10.3389/fphys.2022.873551
11. Azuma K, Ippoushi K, Ito H, Higashio H, Terao J. Combination of lipids and emulsifiers enhances the absorption of orally administered quercetin in rats. J Agric Food Chem. (2002) 50:1706–12. doi: 10.1021/jf0112421
12. Kumari A, Yadav SK, Pakade YB, Singh B, Yadav SC. Development of biodegradable nanoparticles for delivery of quercetin. Colloids Surf B Biointerfaces. (2010) 80:184–92. doi: 10.1016/j.colsurfb.2010.06.002
13. Wang Q, Bao Y, Ahire J, Chao Y. Co-encapsulation of biodegradable nanoparticles with silicon quantum dots and quercetin for monitored delivery. Adv Healthc Mater. (2013) 2:459–66. doi: 10.1002/adhm.201200178
14. Rananaware P, Pandit P, Naik S, Mishra M, Keri RS, Brahmkhatri VP. Anti-amyloidogenic property of gold nanoparticle decorated quercetin polymer nanorods in ph and temperature induced aggregation of lysozyme. RSC Adv. (2022) 12:23661–74. doi: 10.1039/d2ra03121c
15. Liu K, Zhang HL, Pan LH Li QM, Luo JP, Zha XQ. The nanomicelles consisting of lotus root amylopectin and quinoa protein: construction and encapsulation for quercetin. Food Chem. (2022) 387:132924. doi: 10.1016/j.foodchem.2022.132924
16. Jaisamut P, Wanna S, Limsuwan S, Chusri S, Wiwattanawongsa K, Wiwattanapatapee R. Enhanced oral bioavailability and improved biological activities of a quercetin/resveratrol combination using a liquid self-microemulsifying drug delivery system. Planta Med. (2021) 87:336–46. doi: 10.1055/a-1270-7606
17. Rodriguez EB, Almeda RA, Vidallon M, Reyes CT. Enhanced bioactivity and efficient delivery of quercetin through nanoliposomal encapsulation using rice bran phospholipids. J Sci Food Agric. (2019) 99:1980–9. doi: 10.1002/jsfa.9396
18. Zhang X, Li L, Gao X, Zhang H, Gao J, Du Y, et al. In vitro evaluation of quercetin nanocrystals with different particle sizes. J Nanosci Nanotechnol. (2020) 20:6469–74. doi: 10.1166/jnn.2020.18580
19. Sun D, Zhang W, Mou Z, Chen Y, Guo F, Yang E, et al. Transcriptome analysis reveals silver nanoparticle-decorated quercetin antibacterial molecular mechanism. Acs Appl Mater Interfaces. (2017) 9:10047–60. doi: 10.1021/acsami.7b02380
20. Zhang L, Kong D, Wang H, Jiao L, Zhao X, Song J, et al. Cocrystal of apixaban-quercetin: improving solubility and bioavailability of drug combination of two poorly soluble drugs. Molecules. (2021) 26. doi: 10.3390/molecules26092677
21. Pang X, Du HL, Zhang HQ, Zhai YJ, Zhai GX. Polymer-drug conjugates: present state of play and future perspectives. Drug Discov Today. (2013) 18:1316–22. doi: 10.1016/j.drudis.2013.09.007
22. Vikas, Viswanadh MK, Mehata AK, Sharma V, Priya V, Varshney N, et al. Bioadhesive chitosan nanoparticles: dual targeting and pharmacokinetic aspects for advanced lung cancer treatment. Carbohydr Polym. (2021) 274: 118617. doi: 10.1016/j.carbpol.2021.118617
23. Negm NA, Hefni H, Abd-Elaal A, Badr EA, Abou KM. Advancement on modification of chitosan biopolymer and its potential applications. Int J Biol Macromol. (2020) 152:681–702. doi: 10.1016/j.ijbiomac.2020.02.196
24. Wang GN Li YP, Yuan SK, Zhang H, Ren J, Ren X, et al. The intestinal absorption mechanism of chicoric acid and its bioavailability improvement with chitosan. Heliyon. (2022) 8:e9955. doi: 10.1016/j.heliyon.2022.e09955
25. Wang W, Meng Q, Li Q, Liu J, Zhou M, Jin Z, et al. Chitosan derivatives and their application in biomedicine. Int J Mol Sci. (2020) 21. doi: 10.3390/ijms21020487
26. Barbosa AI, Costa LS, Reis S. Application of ph-responsive fucoidan/chitosan nanoparticles to improve oral quercetin delivery. Molecules. (2019) 24. doi: 10.3390/molecules24020346
27. Ahmed TA, Aljaeid BM. Preparation, characterization, and potential application of chitosan, chitosan derivatives, and chitosan metal nanoparticles in pharmaceutical drug delivery. Drug Des Devel Ther. (2016) 10:483–507. doi: 10.2147/DDDT.S99651
28. Chandra HK, Prabha S, Chandra R, Ahmed B, Nimesh S. Advances in preparation and characterization of chitosan nanoparticles for therapeutics. Artif Cells Nanomed Biotechnol. (2016) 44:305–14. doi: 10.3109/21691401.2014.948548
29. Zhao X, Liu Z, Liu H, Guo J, Long S. Hybrid molecules based on caffeic acid as potential therapeutics: a focused review. Eur J Med Chem. (2022) 243:114745. doi: 10.1016/j.ejmech.2022.114745
30. Kurt AH, Olutas EB, Avcioglu F, Karakus H, Sungur MA, Kara OC, et al. Quercetin- and caffeic acid-functionalized chitosan-capped colloidal silver nanoparticles: one-pot synthesis, characterization, and anticancer and antibacterial activities. Beilstein J Nanotechnol. (2023) 14:362–76. doi: 10.3762/bjnano.14.31
31. Khan F, Bamunuarachchi NI, Tabassum N, Kim YM. Caffeic acid and its derivatives: antimicrobial drugs toward microbial pathogens. J Agric Food Chem. (2021) 69:2979–3004. doi: 10.1021/acs.jafc.0c07579
32. Liu J, Pu H, Chen C, Liu Y, Bai R, Kan J, et al. Reaction mechanisms and structural and physicochemical properties of caffeic acid grafted chitosan synthesized in ascorbic acid and hydroxyl peroxide redox system. J Agric Food Chem. (2018) 66:279–89. doi: 10.1021/acs.jafc.7b05135
33. Huang L, Elbourne A, Shaw ZL, Cheeseman S, Goff A, Orrell-Trigg R, et al. Dual-action silver functionalized nanostructured titanium against drug resistant bacterial and fungal species. J Colloid Interface Sci. (2022) 628:1049–60. doi: 10.1016/j.jcis.2022.08.052
34. Zhang Y, Du R, Zhao P, Lu S, Wu R, Wu S. Preparation and characterization of natural quercetin-based mongolia medicine sendeng-4 nanoemulsion (n-que-ne) and its antibacterial activity. Curr Drug Deliv. (2021) 18:984–93. doi: 10.2174/1567201818666201214143631
35. Praphakar RA, Munusamy MA, Rajan M. Development of extended-voyaging anti-oxidant linked amphiphilic polymeric nanomicelles for anti-tuberculosis drug delivery. Int J Pharm. (2017) 524:168–77. doi: 10.1016/j.ijpharm.2017.03.089
36. Curcio M, Puoci F, Iemma F, Parisi OI, Cirillo G, Spizzirri UG, et al. Covalent insertion of antioxidant molecules on chitosan by a free radical grafting procedure. J Agric Food Chem. (2009) 57:5933–8. doi: 10.1021/jf900778u
37. Suginta W, Khunkaewla P, Schulte A. Electrochemical biosensor applications of polysaccharides chitin and chitosan. Chem Rev. (2013) 113:5458–79. doi: 10.1021/cr300325r
38. Sakai-Kato K, Nishiyama N, Kozaki M, Nakanishi T, Matsuda Y, Hirano M, et al. General considerations regarding the in vitro and in vivo properties of block copolymer micelle products and their evaluation. J Control Release. (2015) 210:76–83. doi: 10.1016/j.jconrel.2015.05.259
39. Mochida Y, Cabral H, Kataoka K. Polymeric micelles for targeted tumor therapy of platinum anticancer drugs. Expert Opin Drug Deliv. (2017) 14:1423–38. doi: 10.1080/17425247.2017.1307338
40. Ghorbel-Bellaaj O, Hajji S, Younes I, Chaabouni M, Nasri M, Jellouli K. Optimization of chitin extraction from shrimp waste with bacillus pumilus a1 using response surface methodology. Int J Biol Macromol. (2013) 61:243–50. doi: 10.1016/j.ijbiomac.2013.07.001
41. Liu CL, Lin TH, Juang RS. Optimization of recombinant hexaoligochitin-producing chitinase production with response surface methodology. Int J Biol Macromol. (2013) 62:518–22. doi: 10.1016/j.ijbiomac.2013.09.048
42. Zhu Y, Yu J, Jiao C, Tong J, Zhang L, Chang Y, et al. Optimization of quercetin extraction method in dendrobium officinale by response surface methodology. Heliyon. (2019) 5:e2374. doi: 10.1016/j.heliyon.2019.e02374
43. Rodriguez-Felix F, Del-Toro-Sanchez CL, Javier CF, Juarez J, Ruiz-Cruz S, Lopez-Ahumada GA, et al. Preparation and characterization of quercetin-loaded zein nanoparticles byelectrospraying and study of in vitro bioavailability. J Food Sci. (2019) 84:2883–97. doi: 10.1111/1750-3841.14803
44. Szulc M, Lewandowska K. Biomaterials based on chitosan and its derivatives and their potential in tissue engineering and other biomedical applications-a review. Molecules. (2022) 28. doi: 10.3390/molecules28010247
45. Wu N, Zhang Y, Ren J, Zeng A, Liu J. Preparation of quercetin-nicotinamide cocrystals and their evaluation under in vivo and in vitro conditions. RSC Adv. (2020) 10:21852–9. doi: 10.1039/d0ra03324c
46. Lv L, Liu C, Li Z, Song F, Li G, Huang X. Pharmacokinetics of quercetin-loaded methoxy poly(ethylene glycol)-b-poly(l-lactic acid) micelle after oral administration in rats. Biomed Res Int. (2017) 2017:1750895. doi: 10.1155/2017/1750895
47. Torki M, Schokker D, Duijster-Lensing M, Van Krimpen MM. Effect of nutritional interventions with quercetin, oat hulls, beta-glucans, lysozyme and fish oil on performance and health status related parameters of broilers chickens. Br Poult Sci. (2018) 59:579–90. doi: 10.1080/00071668.2018.1496402
48. Wang M, Mao Y, Wang B, Wang S, Lu H, Ying L, et al. Quercetin improving lipid metabolism by regulating lipid metabolism pathway of ileum mucosa in broilers. Oxid Med Cell Longev. (2020) 2020:8686248. doi: 10.1155/2020/8686248
49. Wang M, Wang B, Zhou S, Liu J, Lu H, Wu H, et al. Quercetin ameliorates chicken quality by activating the pi3k/pkb/ampk signaling pathway in broilers. Front Vet Sci. (2022) 9:951512. doi: 10.3389/fvets.2022.951512
50. Yang LL, Xiao N, Li XW, Fan Y, Alolga RN, Sun XY, et al. Pharmacokinetic comparison between quercetin and quercetin 3-o-beta-glucuronide in rats by uhplc-ms/ms. Sci Rep. (2016) 6:35460. doi: 10.1038/srep35460
Keywords: quercetin, chitosan, caffeic acid, white feather broiler, bioavailability
Citation: Ren X, Ren J, Li Y, Yuan S and Wang G (2023) Preparation of caffeic acid grafted chitosan self-assembled micelles to enhance oral bioavailability and antibacterial activity of quercetin. Front. Vet. Sci. 10:1218025. doi: 10.3389/fvets.2023.1218025
Received: 06 May 2023; Accepted: 20 June 2023;
Published: 05 July 2023.
Edited by:
Nora Mestorino, National University of La Plata, ArgentinaReviewed by:
Caiyun Zhang, Anhui University of Chinese Medicine, ChinaSamah Attia Algharib, Benha University, Egypt
Copyright © 2023 Ren, Ren, Li, Yuan and Wang. This is an open-access article distributed under the terms of the Creative Commons Attribution License (CC BY). The use, distribution or reproduction in other forums is permitted, provided the original author(s) and the copyright owner(s) are credited and that the original publication in this journal is cited, in accordance with accepted academic practice. No use, distribution or reproduction is permitted which does not comply with these terms.
*Correspondence: Gengnan Wang, d2FuZ2dlbmduYW5AaGViYXUuZWR1LmNu