 Panliang Chen1,2†
 Yan Li2,3†Meimei Wang1,2,4
 Yizhao Shen1,2
 Mingchao Liu2,3Hongjian Xu1,2Ning Ma2,3Yufeng Cao1,2
 Qiufeng Li1,2
 Mahmoud M. Abdelsattar5
 Zhiyuan Wang1,2Zihan Huo1,2Shuai Ren1,2Linqi Hu1,2Jie Liu1,2
 Yanxia Gao1,2,6,7*
 Jianguo Li1,2,6,7*
- 1College of Animal Science and Technology, Hebei Agricultural University, Baoding, China
- 2Key Laboratory of Healthy Breeding in Dairy Cattle (Co-construction by Ministry and Province), Ministry of Agriculture and Rural Affairs, Baoding, China
- 3College of Veterinary Medicine, Hebei Agricultural University, Baoding, China
- 4Cangzhou Normal University, College of Life Science, Cangzhou, China
- 5Department of Animal and Poultry Production, Faculty of Agriculture, South Valley University, Qena, Egypt
- 6Hebei Technology Innovation Center of Cattle and Sheep Embryo, Baoding, China
- 7Hebei Research Institute of Dairy Industry Technology, Shijiazhuang, China
The dietary rumen-degradable starch (RDS) to rumen-degradable protein (RDP) ratio, denoted as the RDS-to-RDP ratio (SPR), has been proven to enhance in vitro rumen fermentation. However, the effects of dietary SPR in vivo remain largely unexplored. This study was conducted to investigate the effect of dietary SPR on lactation performance, nutrient digestibility, rumen fermentation patterns, blood indicators, and nitrogen (N) partitioning in mid-lactating Holstein cows. Seventy-two Holstein dairy cows were randomly assigned to three groups (24 head/group), balanced for (mean ± standard deviation) days in milk (116 ± 21.5), parity (2.1 ± 0.8), milk production (42 ± 2.1 kg/d), and body weight (705 ± 52.5 kg). The cows were fed diets with low (2.1, control), medium (2.3), or high (2.5) SPR, formulated to be isoenergetic, isonitrogenous, and iso-starch. The study consisted of a one-week adaptation phase followed by an eight-week experimental period. The results indicated that the high SPR group had a lower dry matter intake compared to the other groups (p < 0.05). A quadratic increase in milk yield and feed efficiency was observed with increasing dietary SPR (p < 0.05), peaking in the medium SPR group. The medium SPR group exhibited a lower milk somatic cell count and a higher blood total antioxidant capacity compared to other groups (p < 0.05). With increasing dietary SPR, there was a quadratic improvement (p < 0.05) in the total tract apparent digestibility of crude protein, ether extract, starch, neutral detergent fiber, and acid detergent fiber. Although no treatment effect was observed in rumen pH, the rumen total volatile fatty acids concentration and microbial crude protein synthesis increased quadratically (p < 0.05) as dietary SPR increased. The molar proportion of propionate linearly increased (p = 0.01), while branched-chain volatile fatty acids linearly decreased (p = 0.01) with increasing dietary SPR. The low SPR group (control) exhibited higher concentration of milk urea N, rumen ammonia N, and blood urea N than other groups (p < 0.05). Despite a linear decrease (p < 0.05) in the proportion of urinary N to N intake, increasing dietary SPR led to a quadratic increase (p = 0.01) in N utilization efficiency and a quadratic decrease (p < 0.05) in the proportion of fecal N to N intake. In conclusion, optimizing dietary SPR has the potential to enhance lactation performance and N utilization efficiency. Based on our findings, a medium dietary SPR (with SPR = 2.3) is recommended for mid-lactating Holstein dairy cows. Nevertheless, further research on rumen microbial composition and metabolites is warranted to elucidate the underlying mechanisms of the observed effects.
1 Introduction
Ruminants rely critically on rumen microbes to digest plant feed (1). The rumen microbial activity is closely linked to feed efficiency (2), and their microbial crude protein (MCP) supplies over half of the metabolizable protein reaching the small intestine for ruminants (3). Synchronizing the supply of energy and nitrogen (N) in the rumen was suggested as one effective strategy to maximize the capture of rumen degradable protein (RDP) and enhance rumen microbial activity and growth (4). The effects of synchronous diets have been widely explored in vitro and in vivo studies (5). However, the results were reported to be inconsistent. One potential reason for this discrepancy is the failure to accurately match the form of energy carrier substances. While current research has considered the degradation characteristics of dietary proteins in the rumen, the energy evaluation system for ruminant feed predominantly relies on chemical analysis, which does not accurately reflect the energy supply within the rumen (6).
The availability of carbohydrates serves as the primary factor controlling the energy supply for rumen microbes (7). These carbohydrates were categorized into four fractions (8): neutral detergent fiber (NDF), starch, neutral detergent soluble fiber (NDSF), and water-soluble carbohydrates (WSC). Compared to NDF, starch exhibits a faster fermentation rate in the rumen. This made the supply of energy at a rate closer to the ammonia released, thereby promoting rumen microbial activity and growth (5). The rumen-degradable starch (RDS), representing the extent and rate of starch degradation in the rumen, had been reported to be more effective than rumen-degradable NDF in promoting MCP synthesis (9). Additionally, in comparison to NDSF (e.g., pectin) and WSC (e.g., sucrose), starch could provide more carbon skeletons for rumen microbes (10). The starch-based diet led to more MCP synthesis in vitro culture (10) and milk protein yield in dairy cows (11) compared to a sucrose- (or pectin-) based diet. Therefore, the starch, especially RDS, might be more effective in regulating the rumen microbial growth and fermentation than other carbohydrates. Furthermore, the RDP function as the primary N source for rumen microbes, significantly influencing the composition of rumen microbes (12) and MCP synthesis (13). Davies et al. (14) reported that a judicious combination of RDS and RDP in low crude protein (CP) diets had the potential to improve MCP synthesis efficiency and animal productivity. Martins et al. (15) suggested that dietary recommendations for RDP should consider RDS for a more precise level to enhance MCP synthesis and minimize N excretion. Considering these study results, the dietary RDS to RDP ratio (SPR) might be an effective indicator of optimizing rumen microbial growth and rumen fermentation.
Our previous in vitro study showed a quadratic response in MCP synthesis and total volatile fatty acids (TVFA) concentration with increasing dietary SPR (16). However, the effect of dietary SPR in vivo has yet to be entirely determined. Therefore, we hypothesize that dietary SPR has the potential to optimize rumen microbial growth and fermentation, subsequently modulating lactation performance and nitrogen use efficiency (NUE) in dairy cows. Our objective was to evaluate the effects of dietary SPR on lactation performance, nutrient digestibility, rumen fermentation patterns, and N partitioning in mid-lactating Holstein cows.
2 Materials and methods
2.1 Ethics statement
This study was conducted between March 2021 and June 2021 at Hongda Commercial Dairy Farm in Baoding, China. The experiment was approved by the Institutional of Animal Care and Use Committee at Hebei Agricultural University, Baoding, China (with protocol JGL 2103; approval date: March 1, 2021). The Hongda Commercial Dairy Farm provided the necessary approvals and cooperation for the research.
2.2 Animals and experimental design
Seventy-two Holstein dairy cows (24 head/group) were used in a complete randomized design. Cows balanced for (mean ± standard deviation) days in milk (116 ± 21.5), parity (2.1 ± 0.8), milk production (42 ± 2.1 kg/d), and body weight (705 ± 52.5 kg) were assigned to one of three treatments. Three distinct diets were formulated with different SPR levels, which were low SPR (L-SPR, RDS/RDP = 2.1), medium SPR (M-SPR, RDS/RDP = 2.3), or high SPR (H-SPR, RDS/RDP = 2.5), respectively. The L-SPR treatment was designed as the control group based on the observed dietary SPR value in farms exhibiting low NUE. The M-SPR treatment was derived from the optimal rumen fermentation performance observed in previous in vitro experiment (16). The H-SPR treatment was derived from earlier studies that integrated the maximum levels of RDS without observing adverse effects on rumen function (17). Cows were individually housed in tie stalls equipped with automatic drinking bowls. Cows had free access to water and were fed a total mixed ration (TMR; Table 1) twice daily at 0800 and 1,600 h. Cows were fed ad libitum throughout the study, ensuring at least 5% feed refusals. Cows were milked thrice daily at 0730, 1530, and 2,300 h. The study was conducted with 1-week to adapt to the experimental conditions, followed by an 8-week for sampling and data collection.

Table 1. Ingredients of experimental diet fed as a TMR (% of DM).
2.3 Diets and feed ingredients
The experimental diets were formulated to meet the recommendation of NRC (2001) (18) using the AMTS software platform (Agricultural Modeling & Training Systems, Groton, NY, United States) for a 700 kg cow producing 40 kg/d of milk containing 4.0% fat and 3.0% true protein. The diets contained 49% forage (forage sources and proportions were consistent across all diets) and 51% concentrate on a dry matter (DM) basis. All forages and concentrates were weighed and mixed thoroughly each morning using a mixer wagon (9SJW-500, Goke Agriculture Machinary Co. Ltd., Beijing, China). Diets maintained consistent levels of net energy for milk, CP, starch, neutral detergent fiber (NDF), and acid detergent fiber (ADF; Table 2). Differences in levels of RDS and RDP arose from varying concentrate mixtures. Specifically, RDS levels were adjusted by varying the proportions of ground corn and ground wheat in the diet, and the proportions of solvent-extract soybean meal (SSBM) and heat-treated soybean meal (HSBM) were regulated to maintain a consistent RDP level. A single source of wheat and corn was processed using a roller mill (model SSLG-15, Shuanghe Machinery Manufacturing Co. LTD, Shandong, China) to obtain ground wheat and ground corn. The particle size analysis, performed by the ASAE (2003, method S319.3) (19), revealed that the geometric mean particle sizes were 845 μm for ground wheat and 829 μm for ground corn, respectively. The HSBM used in this study were commercially manufactured using the same production process and batch (Xingpu Feed Co. LTD, Harbin, China). The in situ residues of SSBM and HSBM after 16 h of ruminal incubation were employed to determine the small intestinal digestibility of rumen-undegraded protein (20), with respective digestibility of 82.7 and 75.2%.
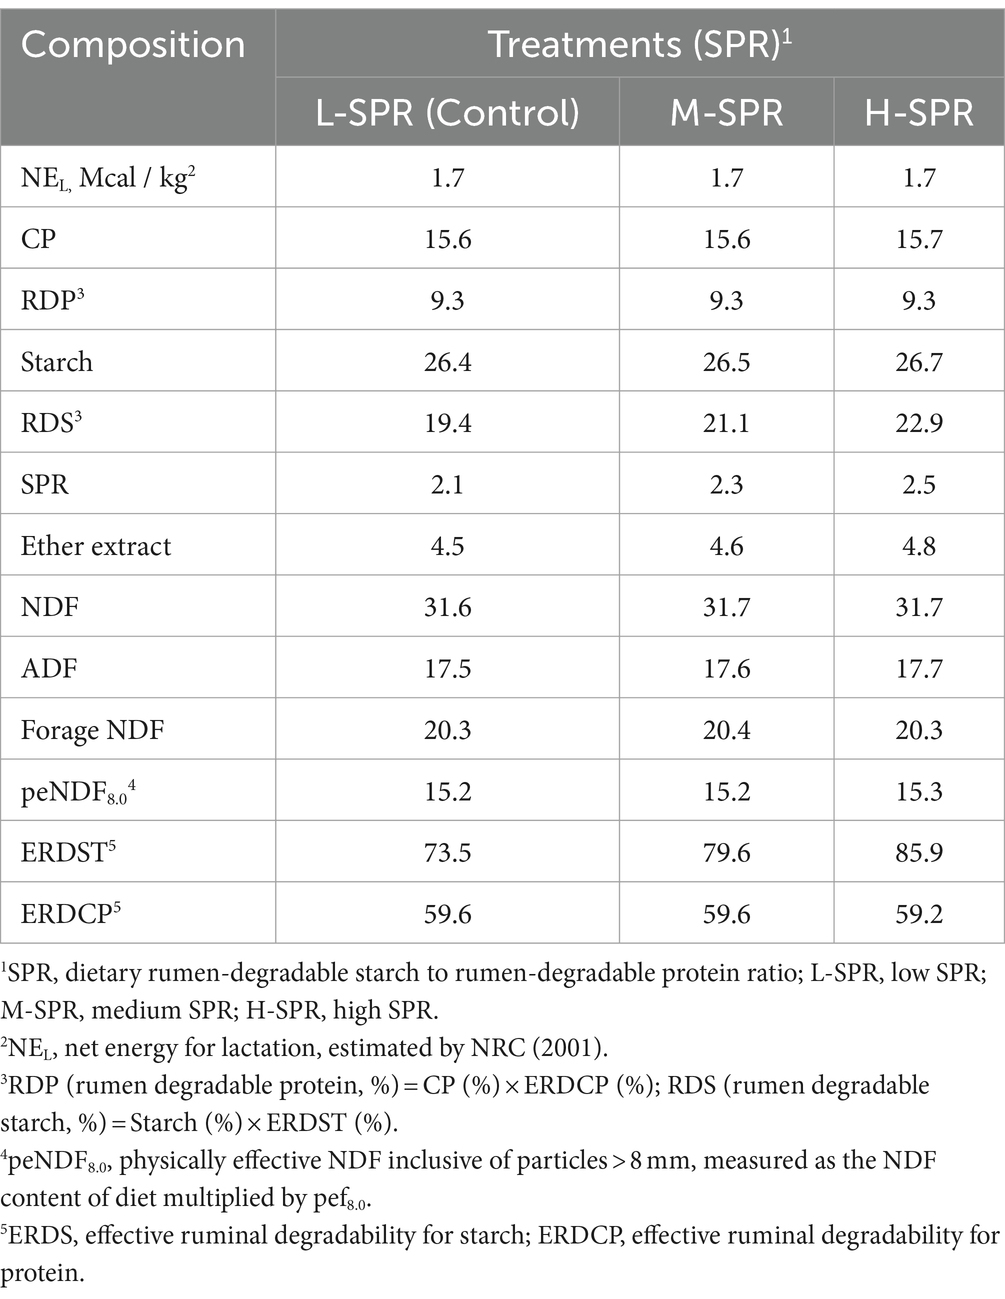
Table 2. Chemical composition of experimental diet fed as a TMR (% of DM, unless noted).
The dietary SPR was calculated as the ratio of dietary RDS to RDP. The dietary RDS or RDP content was calculated based on the actual measured values of the ingredients applied in the formulation, as determined by Equations (1,2) (21):
Where n is the number of ingredients containing starch or CP in the diet; PSTi represents the dietary starch proportion of feed i in the diet; PCPi represents the dietary CP proportion of feed i in the diet, ERDSTi represents the effective rumen starch degradability of feed i; ERDCPi represents the effective rumen CP degradability of feed i.
The ERDST and ERDCP in the feed ingredients employed in this study were assessed through the in situ nylon bags technique. The nylon bags with a pore size of 50 μm were used, and the rumen outflow rate was set at 0.06/h according to Offner et al. (6). A detailed method of in situ ruminal degradation was referred to Li et al. (22). Degradation parameters and effective ruminal degradability (ERD) were determined using Equations (3,4) from Ørskov and McDonald (23):
where Yt = disappearance proportion at time t; a = rapidly degradable fraction; b = slowly degradable fraction; k = constant rate of degradation of fraction b; t = time of incubation (h); kp = passage rate, the rumen outflow rate was set at 0.06/h. The nutrient content, ERDCP, and ERDST of the primary ingredients used in this study are listed in Supplementary Table S1.
2.4 Sampling and data collection
2.4.1 Collection of feed samples
Feed offered and refused were recorded daily. The TMR, feed ingredients, and feed refusals were collected weekly. The collected samples were immediately oven-dried at 55°C for 48 h to measure DM content. Subsequently, the samples were ground using a 1-mm screen (stand model 4 Wiley Mill, Arthur H. Thomas, Philadelphia, PA, United States) for chemical analyses. Daily DMI was calculated by subtracting the DM refusals from the DM offered. Weekly averages of DMI data were used for statistical analysis (24).
2.4.2 Collection of milk samples
Milk yield was recorded daily using the DeLaval milking system at milking time, and those records were used to calculate weekly averages for each cow for statistical analysis. Milk samples were obtained on d 1 weekly by mixing proportional aliquots from each milking and immediately transported to the laboratory for analysis. According to International Dairy Federation (25), the fat- and protein-corrected milk (FPCM) yield was computed as milk yield (kg/d) × (0.1226 × fat % + 0.0776 × protein % + 0.2534). Feed efficiency was determined as FPCM yield divided by DMI. The NUE was calculated as milk N divided by N intake.
2.4.3 Collection of feces and urine samples
Due to animal welfare, eight cows from each treatment (balanced for parity, milk production, and days in milk) were selected for feces, urine, rumen fluid, and blood sampling. Spot feces and urine samples were collected from each cow during weeks 0, 4, and 8. The samples cover 3 days (0200, 1100, and 2000 h on d 2; 0500, 1400, and 2300 h on d 3; 0800 and 1700 h on d 4 of each sampling week), representing 3, 6, 9, 12, 15, 18, 21, and 24 h after morning feeding. Approximately 100 g of fresh feces were collected from the rectum, pooled by each cow, dried at 55°C for 48 h, and ground through a 1-mm screen (stand model 4 Wiley Mill; Arthur H. Thomas, Philadelphia, PA, United States). Urine was collected by stimulating the vulva. Subsequently, the urine samples were acidified using a 4:1 volumetric ratio of 0.072 mol/L H2SO4 to urine. The acidified samples were then frozen at −20°C for further analysis.
2.4.4 Collection of rumen fluid samples
Rumen fluid samples were collected using an oral stomach tube during week 0, 4, and 8 (26). Five sampling times over 3 d were selected (1100 and 2000 h on d 5; 0800 and 1700 h on d 6; 1400 h on d 7 of each sampling week), representing 0, 3, 6, 9, and 12 h after morning feeding. To secure representative rumen samples, the oral stomach tube was inserted approximately 200 cm deep, reaching the central rumen. Additionally, to mitigate the influence of extraneous factors, rumen fluid sampling was consistently carried out by a single individual. The initial 100 mL of rumen fluid was discarded to prevent contamination from saliva or mucus. Subsequently, another 100 mL of rumen fluid was collected and filtered through four layers of cheesecloth. The rumen liquid pH was immediately measured using a portable pH meter (DENVER UB-7, Denver Instrument, Denver, United States). Two subsamples (5 mL) of rumen fluid were, respectively, preserved with 1 mL of 25% (wt/vol) HPO3 and 1 mL of 1% (wt/vol) H2SO4 and stored at −20°C until the determination of VFAs and ammonia N (NH3-N).
2.4.5 Collection of blood samples
Blood samples were collected from the coccygeal vein before morning feeding on d 7 of week 0, 4, and 8. Approximately 20 mL of blood samples were collected into two 10 mL vacuum tubes (Vacutainer, Becton Dickinson, Franklin Lakes, NJ, United States) with no additives. Then, according to Shen et al. (27), serum samples were prepared and stored at −20°C for later analyses.
2.4.6 Measurement of body weight
Cows were weighed before morning feeding on the last day of week 0, 4, 8. Body weights were adjusted by subtracting the morning milking weights to accurately represent the cows’ actual weight.
2.5 Samples analysis
2.5.1 Analysis of feed and fecal samples
The DM (method 930.15), ash (method 942.05), CP (method 968.06), ether extract (EE, method 920.39), and starch (method 996.11) contents in TMR, feed refusals, and feces were determined according to AOAC (28). The organic matter (OM) content was calculated as the difference between 100% and ash content. The content of NDF and ADF in TMR, feed refusals, and feces were analyzed using heat-stable α-amylase and sodium sulfite (29) and were expressed inclusive of residual ash (30). Acid detergent insoluble ash (ADIA) content in TMR, feed refusals, and feces was determined as outlined in Keulen and Young (31). The ADIA was used for calculating the apparent total-tract digestibility of nutrients (32), and the equation was:100 − (100 × (%ADIA in DM consumed/%ADIA in feces) × (%nutrient in feces/%nutrient in consumed DM)).
2.5.2 Analysis of urine samples
The weight of cows and the concentration of creatinine in urine were used to estimate total urine production. The estimation formula is as follows: Urine volume (L/d) = (Body weight (kg) × Creatinine excretion rate (mg/kg)) / Urine creatinine concentration (mg/L). The creatinine excretion rate referred to the amount of creatinine excreted per kilogram of body weight per day by cows, with a value of 29 mg/kg (33). The urinary allantoin and uric acid excretions were calculated by multiplying the concentrations by the respective daily urine volume. Daily urinary purine derivatives (PD) excretion was the sum of allantoin and uric acid excretion. The PD was used as an indicator of MCP synthesis based on the relationship derived by Chen and Gomes (34). Urinary urea-N, creatinine, allantoin, and uric acid concentrations were determined using commercial kits from Nanjing Jiancheng Bioengineering Institute, Nanjing, China. The inter-assay coefficients of variation were less than 10%, and the intra-assay coefficients of variation were less than 12%. Allantoin in urine was determined by the colorimetric method (34). Urinary N was determined according to AOAC (method 968.06) (28).
2.5.3 Analysis of milk samples
The percentage of milk fat, milk protein, lactose, milk urea nitrogen concentration (MUN), and somatic cell count (SCC) were determined using FOSS Milko Scan and Fossomatic FC (FOSS Food Technology Corp., Hillerød, Denmark). Yield of milk components was calculated by multiplying the daily milk yield by the percentage of a given milk component.
2.5.4 Analysis of rumen fluid samples
The concentration of rumen VFA was determined using gas chromatography (Agilent, 7890A, a fused silica column, 30 m × 0.32 mm × 0.25 mm; column temperature, 150°C; injector temperature, 200°C; and detector temperature, 250°C) as described by Shen et al. (35). The rumen fluid concentration of NH3-N was measured using a phenol-hypochlorite assay (36).
2.5.5 Analysis of blood samples
Commercial kits (Jiancheng Bioengineering Inc., Nanjing, China) were used to determine the concentration of blood urea nitrogen (BUN) and glucose, as well as the activities of aspartate aminotransferase (AST) and alanine aminotransferase (ALT). Commercial ELISA kits (Huayuechang Biotechnology Co., Ltd., Beijing, China) were used to determine the total antioxidant capacity (T-AOC, kit no: DRE98021, detection range: 0–8 U/mL), insulin capacity (kit no: DRE98105, detection range: 0.8–30 mU/L), the insulin-like growth factor-1 concentration (IGF-1, kit no: DRE98016, detection range: 10–300 μg/L) and the nonesterified fatty acid concentration (NEFA, kit no: DRE98327, detection range: 20–560 μmol/L). The inter-assay coefficients of variation were lower than 10%, and the intra-assay coefficients of variation were lower than 12%.
2.6 Calculations and statistical analysis
Before analyses, all data were tested for normality using the Shapiro–Wilk test, and any parameter that was not normally distributed was normalized by Box-Cox transformation. The data were analyzed using the PROC MIXED procedure of SAS 9.4 (SAS Inst. Inc., Cary, NC). The statistical model was as follows:
where Yijk is the dependent variable; μ is the overall mean; i is the SPR treatment, j is the cow; Ti is the effect of ith SPR treatment; Dj (i) is the random effect of the jth cow within SPR treatment; Covj is the covariate effect, the data from week 0 were used for the covariate analysis; Eijk is the residual error.
The model included diet as fixed effects, cow within SPR treatment, and residual error as random effects. The repeated measures analysis of results was subjected to five models (AR, UN, CS, SP, and VC). The weeks of data collection served as repeated measurements for DMI, milk production, milk composition, and feed efficiency. The days of sample collection function as repeated measurements for apparent nutrient digestibility, rumen fermentation parameters, nitrogen partitioning indicators, and blood indicators. The covariance structure with the smallest Schwarz-Bayesian criterion was used owing to the most desirable and reliable analysis (37). The PDIFF option of SAS was used to calculate and separate the least squares means. Orthogonal contrasts were conducted to determine linear and quadratic dose of dietary SPR responses. Treatment effects were declared significant at p < 0.05.
3 Results
3.1 Dry matter intake and milk performance
With increasing dietary SPR, there was a linear decrease in DMI (p = 0.01; Figure 1). The H-SPR group was reduced by 0.8 kg/d compared to the L-SPR group (control) and by 0.7 kg/d compared to the M-SPR group. Milk yield (p = 0.01), FPCM yield (p = 0.01), and feed efficiency (p = 0.02) exhibited a quadratic increase, with the M-SPR group demonstrating a 4.19% increase in milk yield, 4.63% in FPCM production, and 4.67% in feed efficiency compared to the L-SPR group (control). The SCC demonstrated a quadratic decrease as the dietary SPR increased (p = 0.02), with the M-SPR group showing a decrease of 31.04% compared to the L-SPR group (control). Different dietary SPRs did not influence the concentrations of milk fat, protein, and lactose, but the production of these milk components exhibited a quadratic increase (p < 0.05). Furthermore, in comparison to the L-SPR group (control), the concentrations of MUN in the M-SPR and H-SPR groups showed a linear decrease (p < 0.05), decreasing by 24.4 and 26.9%, respectively.
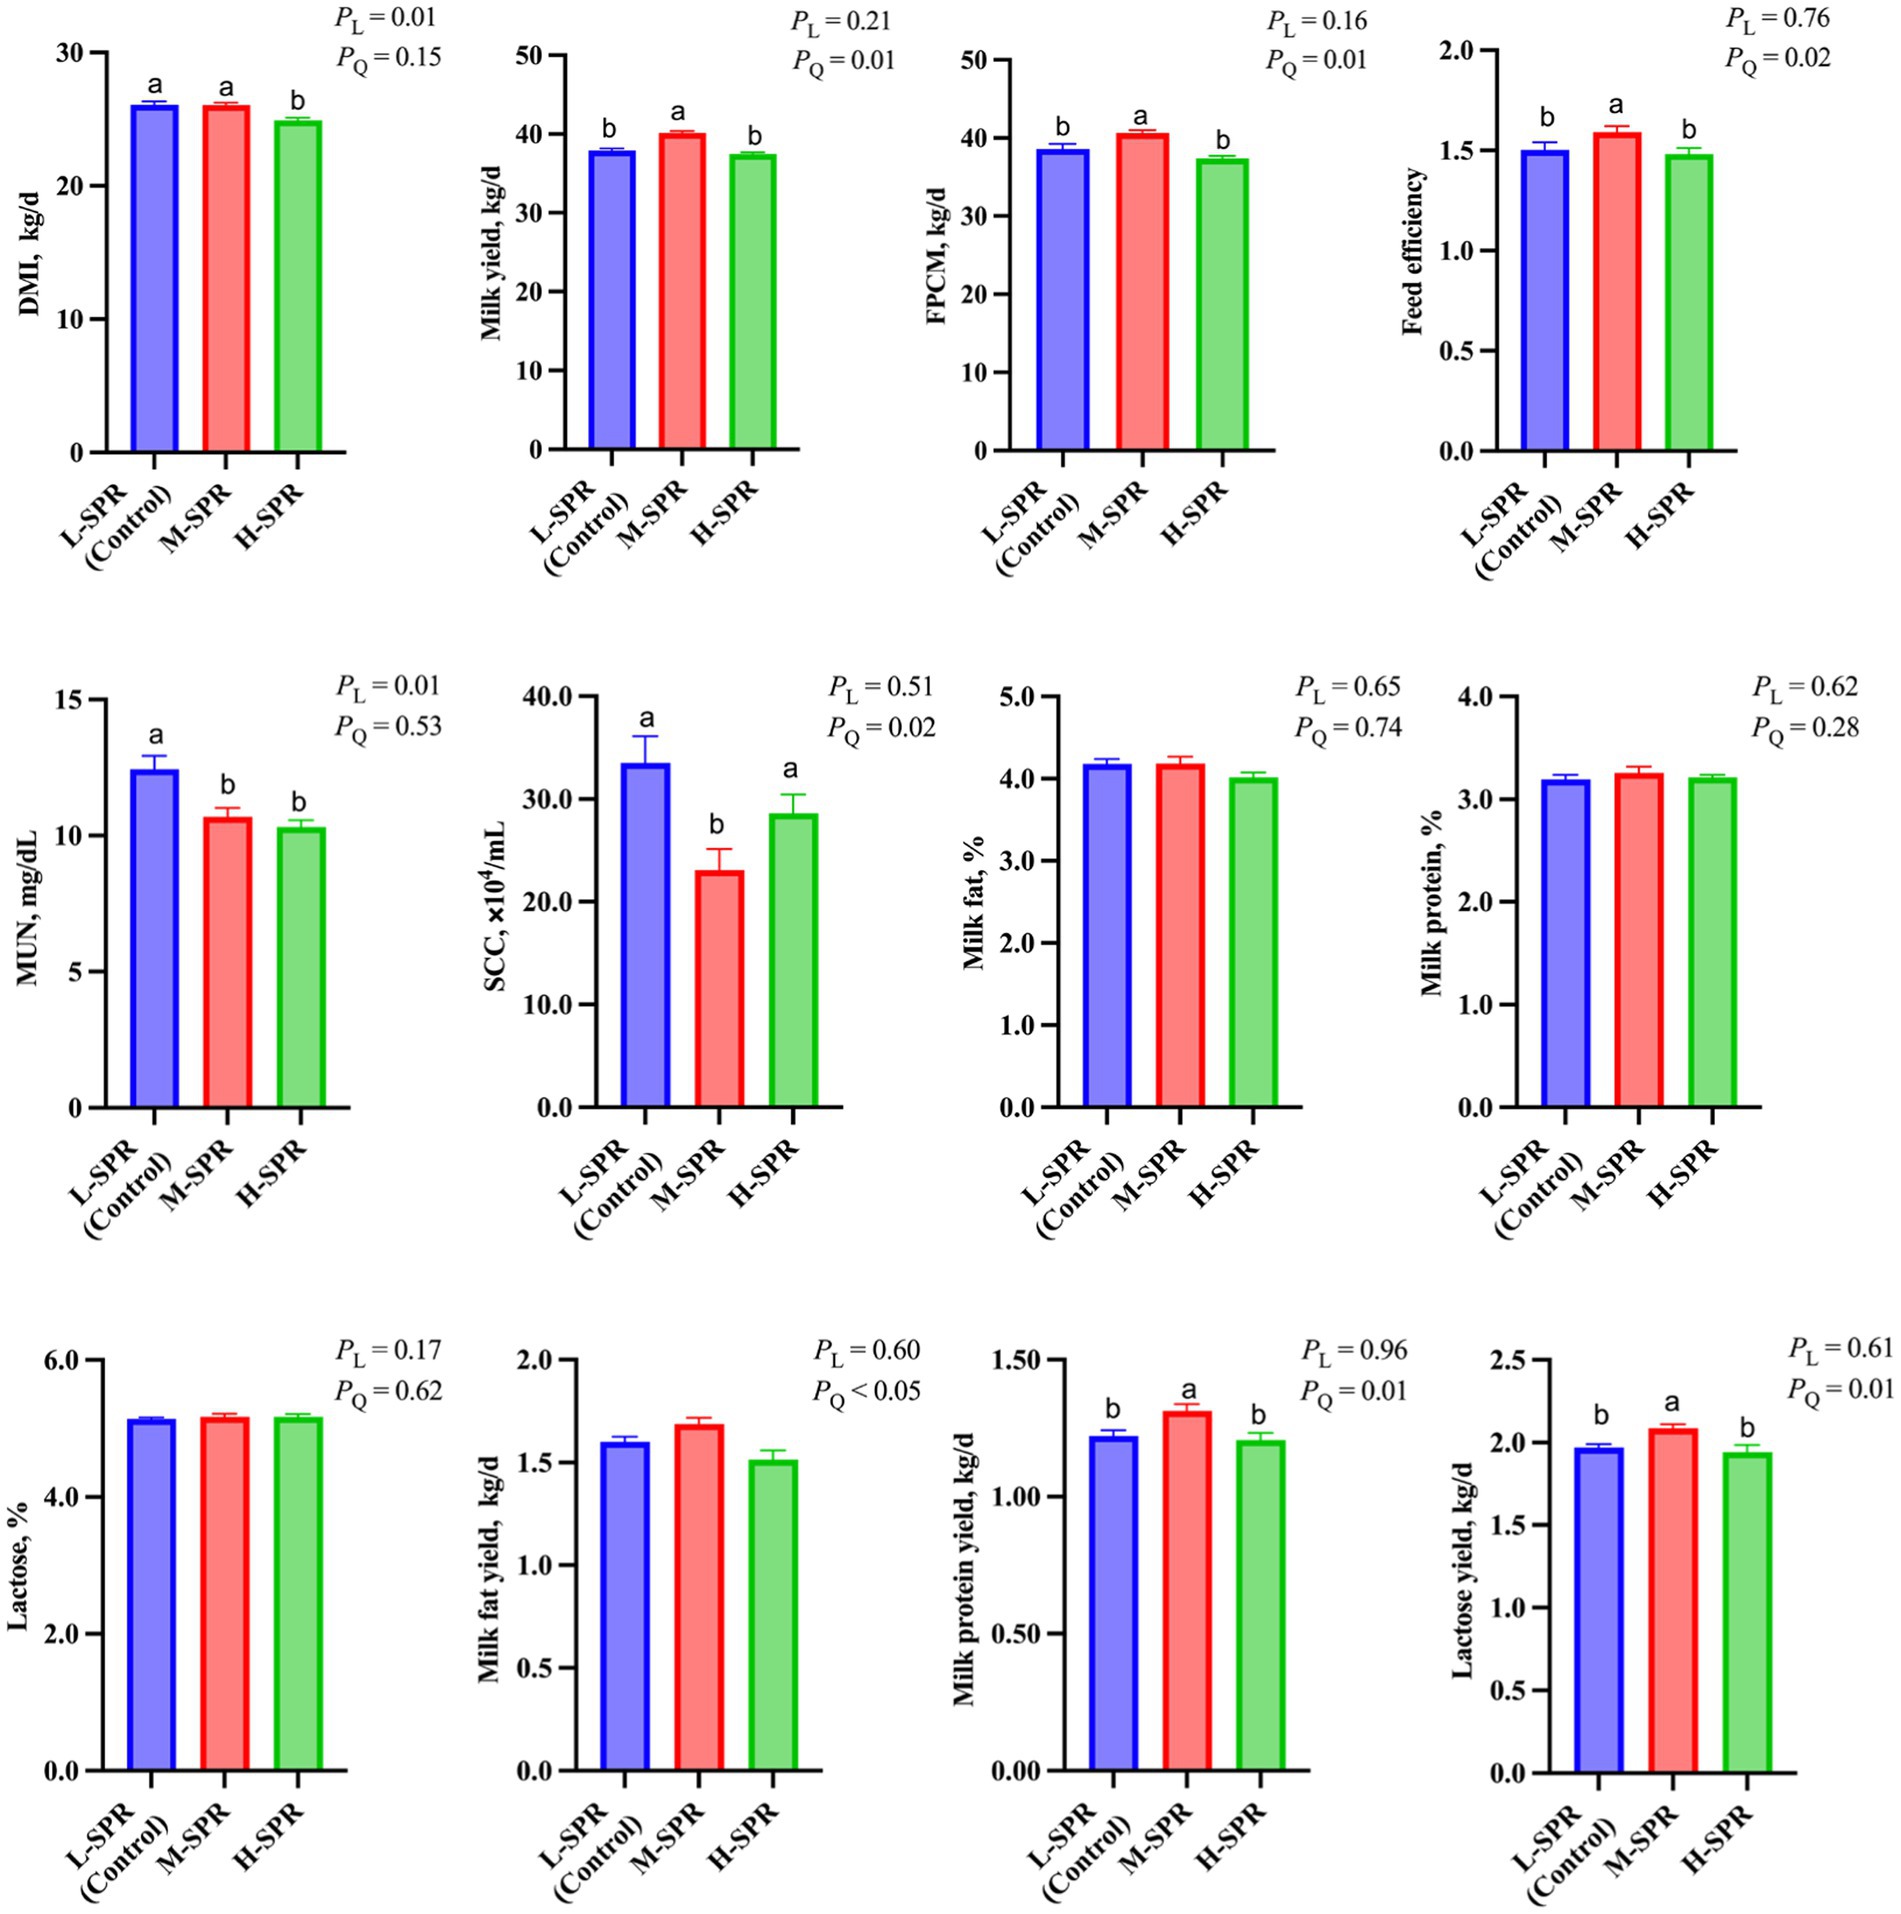
Figure 1. Effect of dietary rumen-degradable starch to rumen-degradable protein ratio (SPR) on dry matter intake and lactation performance in mid-lactating Holstein cows. Error bars indicate measure of variation within the dietary SPRs. Different letters (a–b) indicate statistically significant difference (p < 0.05). L is linear, and Q is quadratic effects for diet SPR; DMI, dry matter intake; MUN, milk urea nitrogen; FPCM, Fat- and protein-corrected milk; Feed efficiency, FPCM/DMI.
3.2 Total-tract apparent nutrient digestibility
As shown in Figure 2, the digestibility of DM (p = 0.01), OM (p = 0.01), CP (p = 0.03), EE (p = 0.03), starch (p = 0.03), NDF (p = 0.03), and ADF (p = 0.02) exhibited a quadratic increase with increasing dietary SPR, peaking in the M-SPR group. Compared to the L-SPR group (control), the M-SPR group showed significant improvements in DM (4.81%), OM (5.64%), NDF (4.29%), and ADF (6.14%) digestibility.
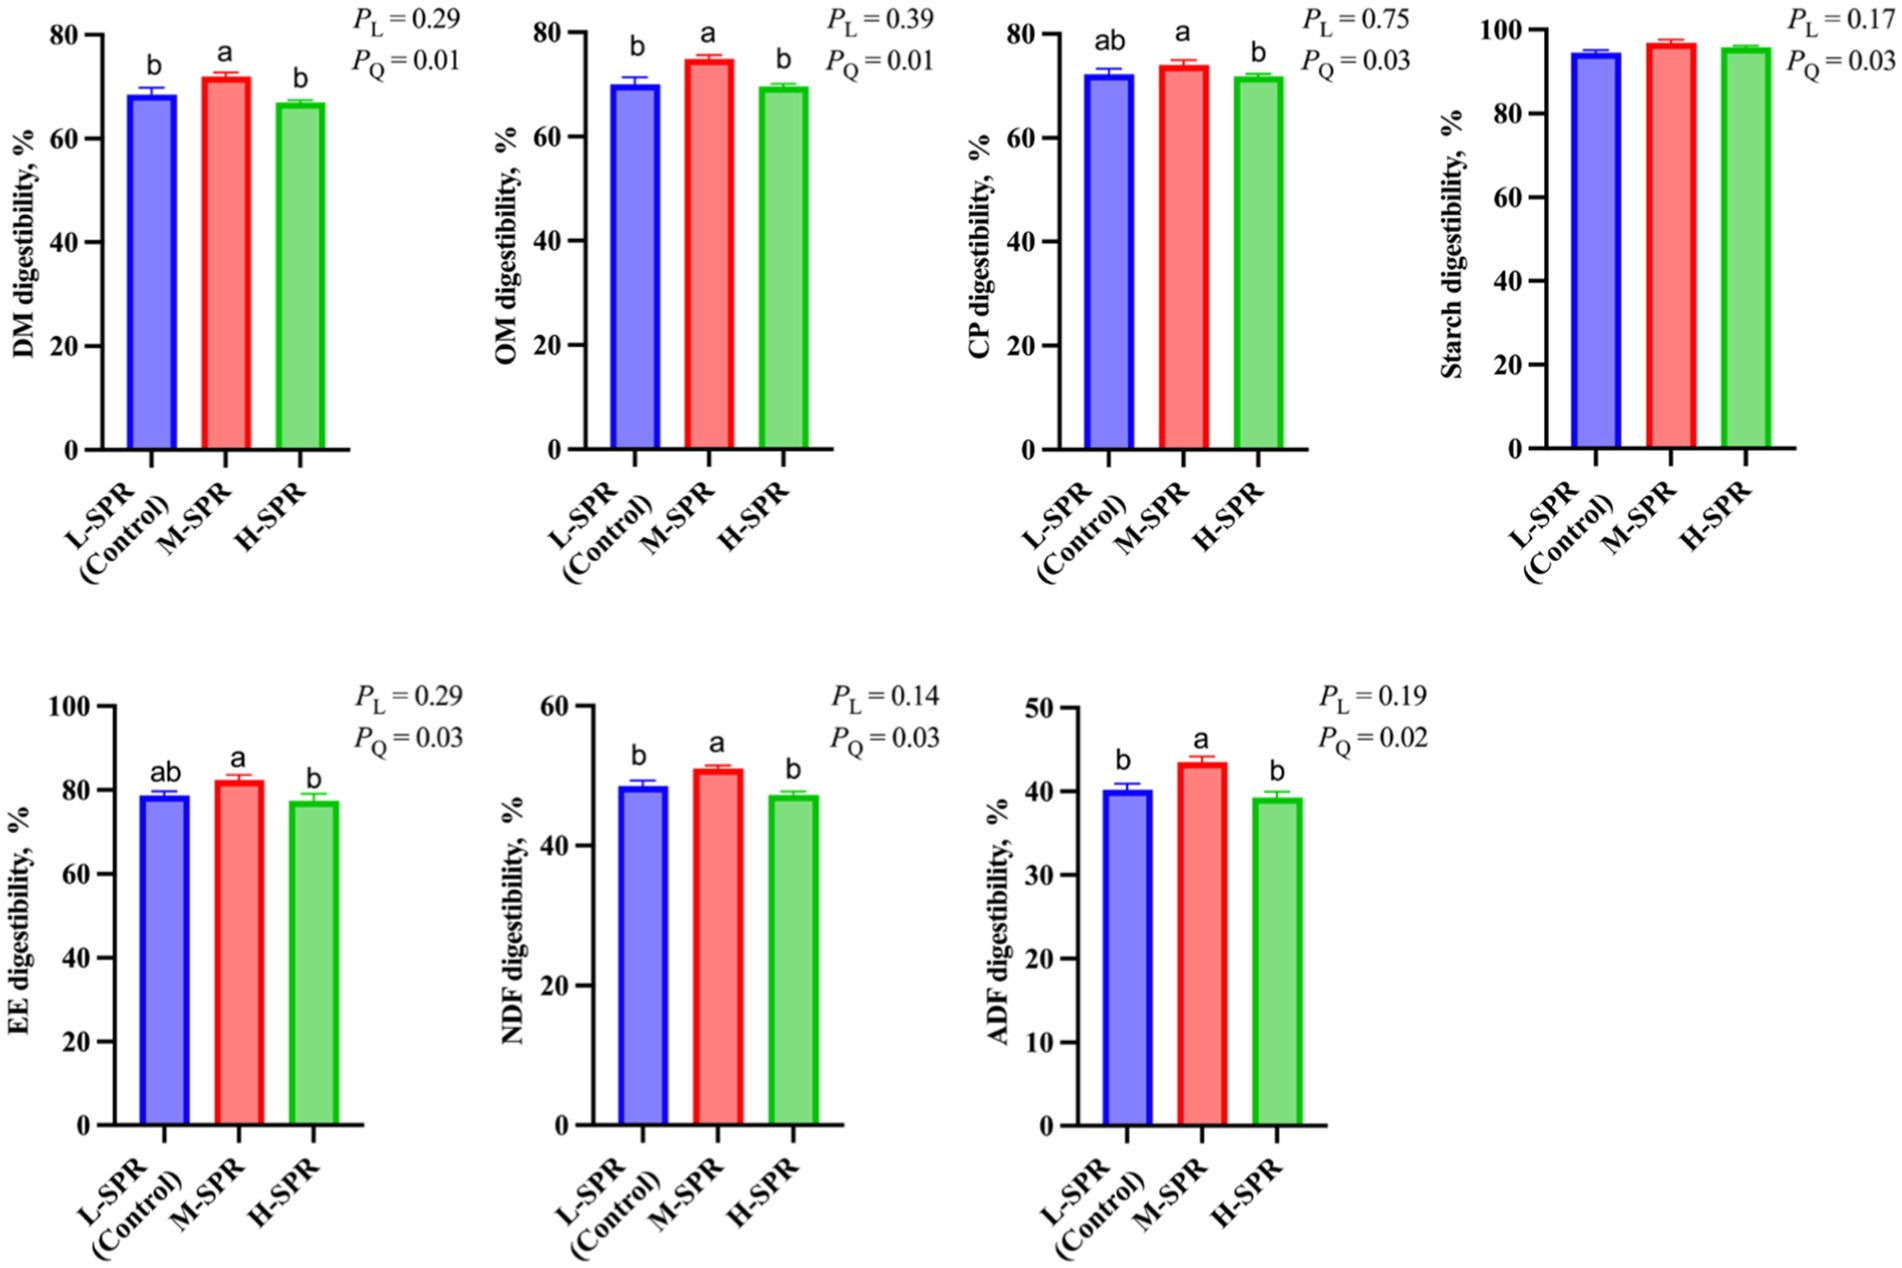
Figure 2. Effect of dietary rumen-degradable starch to rumen-degradable protein ratio (SPR) on nutrient apparent digestibility in mid-lactating Holstein cows. Error bars indicate measure of variation within the dietary SPRs. Different letters (a–b) indicate statistically significant difference (p < 0.05). L is linear, and Q is quadratic effects for diet SPR; DM, dry matter; OM, organic matter; CP, crude protein; EE, ether extract; NDF, neutral detergent fiber; ADF, acid detergent fiber.
3.3 Rumen fermentation patterns
According to Figure 3, the dietary SPR did not affect rumen pH. However, as the dietary SPR increased, there was a quadratic increase in TVFA concentration (p = 0.01), with the M-SPR group showing a 5.36% rise compared to the L-SPR group (control). Although the molar proportion of acetate was not affected by dietary SPR, the molar proportion of propionate linearly increased (p = 0.01), and the ratio of acetate to propionate linearly decreased (p = 0.01) with increasing dietary SPR. Additionally, in comparison to the L-SPR group (control), the concentrations of NH3-N in the M-SPR and H-SPR groups showed a linear decrease (p = 0.01), decreasing by 17.5 and 27.7%, respectively.
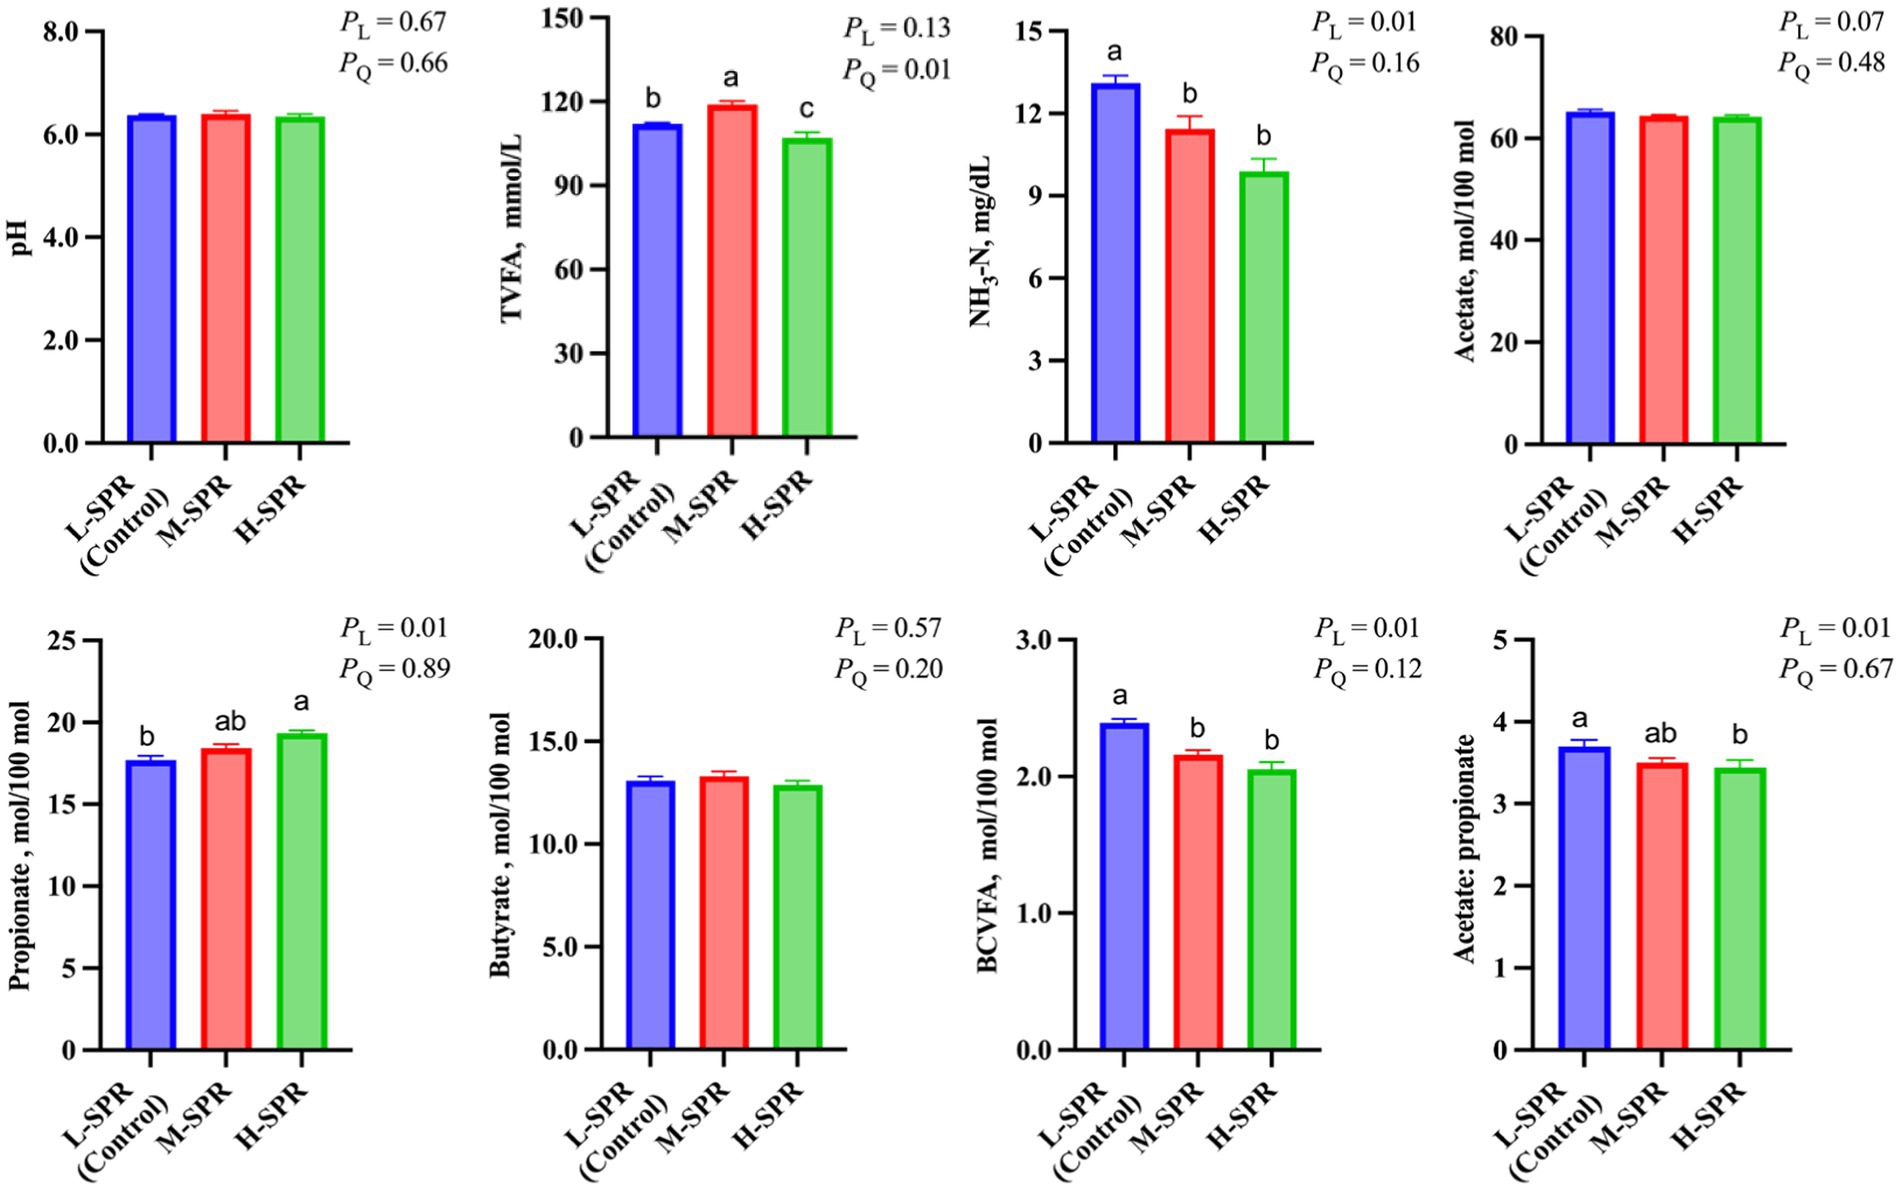
Figure 3. Effect of dietary SPR on rumen fermentation patterns in mid-lactating Holstein cows. Error bars indicate measure of variation within the dietary SPRs. Different letters (a–c) indicate statistically significant difference (p < 0.05). L is linear, and Q is quadratic effects for diet SPR. TVFA, total volatile fatty acid; Branched-chain volatile fatty acid = isobutyrate + isovalerate; NH3-N, ammonia nitrogen.
3.4 Microbial crude protein synthesis
In Figure 4, there was a quadratic response in the uric acid (p = 0.03), allantoin (p = 0.01), and total PD (p = 0.01) excretion, as dietary SPR increased, with the greatest amount reached at the M-SPR group. Accordingly, a quadratic increase (p < 0.05) was observed in MCP synthesis (g/d; g/kg of DMI; g/kg of digestible CP intake) with increasing dietary SPR. Compared to the L-SPR group (control), the M-SPR group exhibited a 9.16% increase in MCP (g/d), a 10.56% increase in MCP (g/kg of DMI), and a 9.02% increase in MCP (g/kg of digestible CP intake).
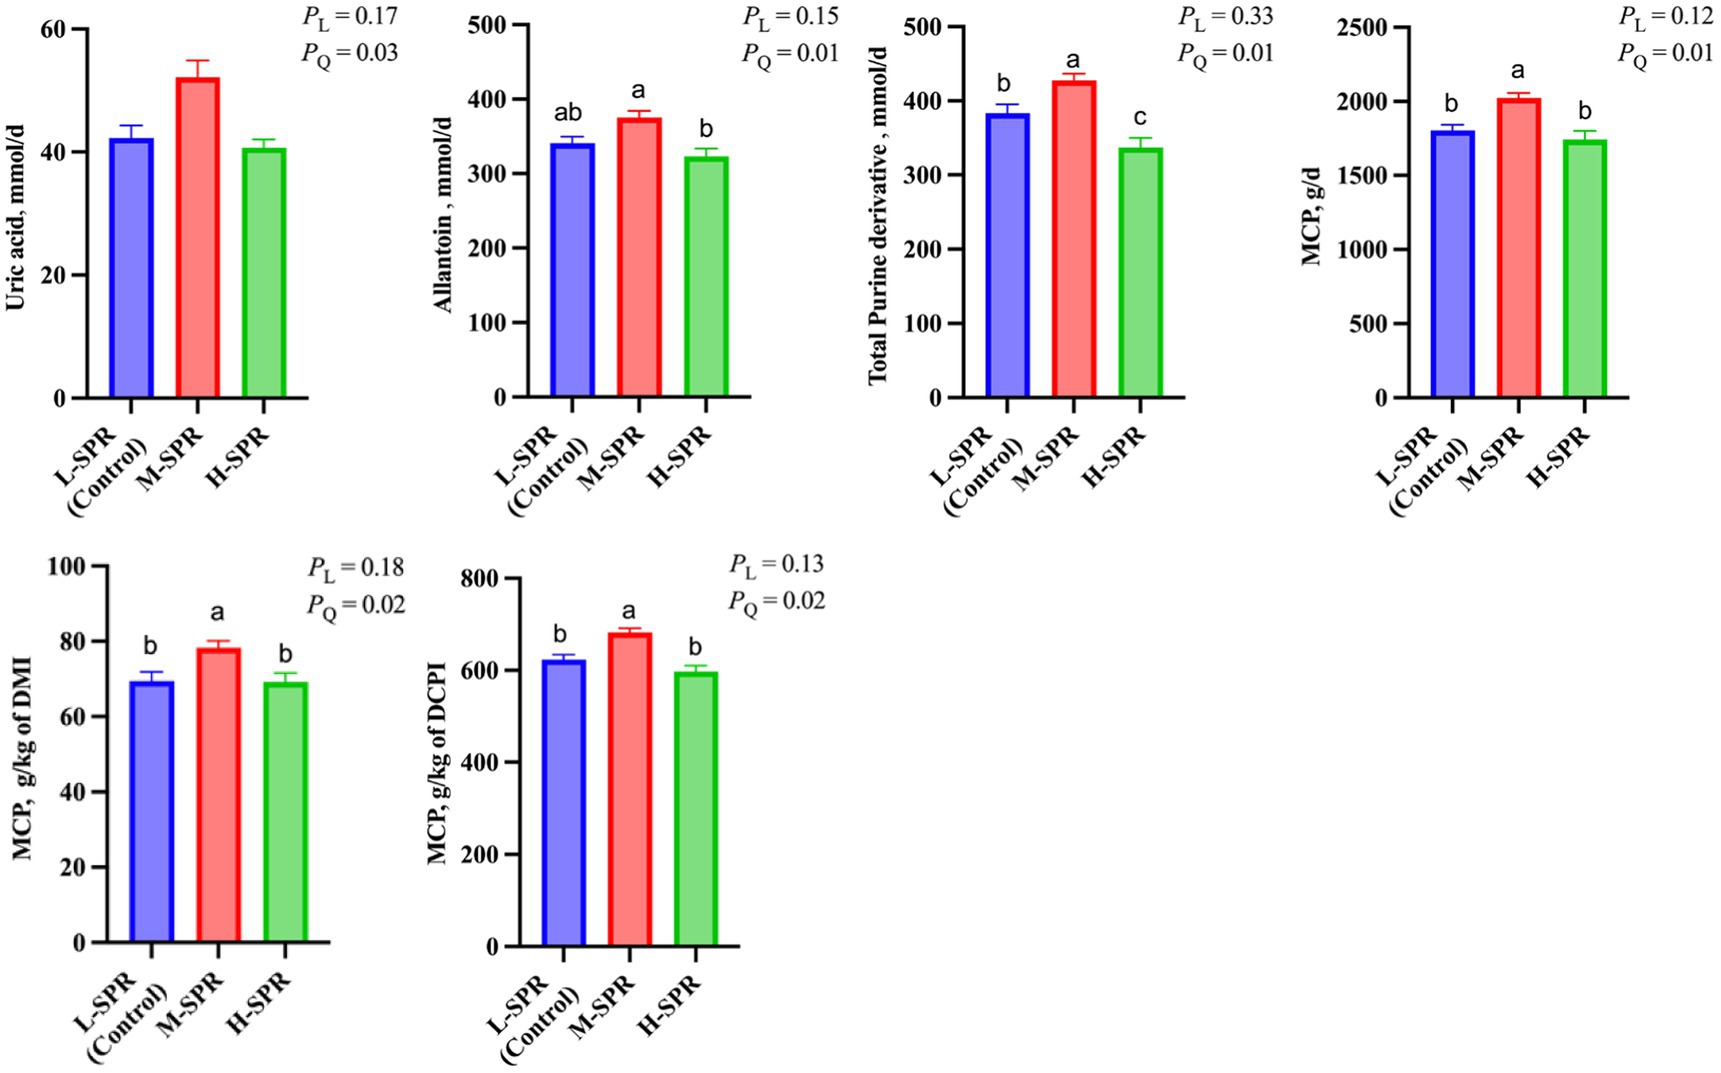
Figure 4. Effect of dietary rumen-degradable starch to rumen-degradable protein ratio (SPR) on urinary purine derivatives excretion in mid-lactating Holstein cows. Error bars indicate measure of variation within the dietary SPRs. Different letters (a–c) indicate statistically significant difference (p < 0.05). L is linear, and Q is quadratic effects for diet SPR. MCP, microbial crude protein; DMI, dry matter intake; DCPI, digestible CP intake.
3.5 Blood indicators
As depicted in Figure 5, increasing the dietary SPR led to a quadratic rise in GLU concentration (p = 0.01), with the M-SPR group showing a significant 9.55% increase compared to the L-SPR group (control). The concentration of BUN displayed a linear decrease (p < 0.05), with reductions of 13.56 and 15.37% in the M-SPR and H-SPR groups, respectively, as compared to the L-SPR group (control). The T-AOC activity showed a quadratic rise with the increase of dietary SPR (p = 0.04), and the M-SPR group showed a notable 6.79% improvement compared to the L-SPR group (control). Furthermore, there were no significant differences among the three groups in the activity of AST, ALT, and insulin, as well as the concentration of NEFA and IGF-1.
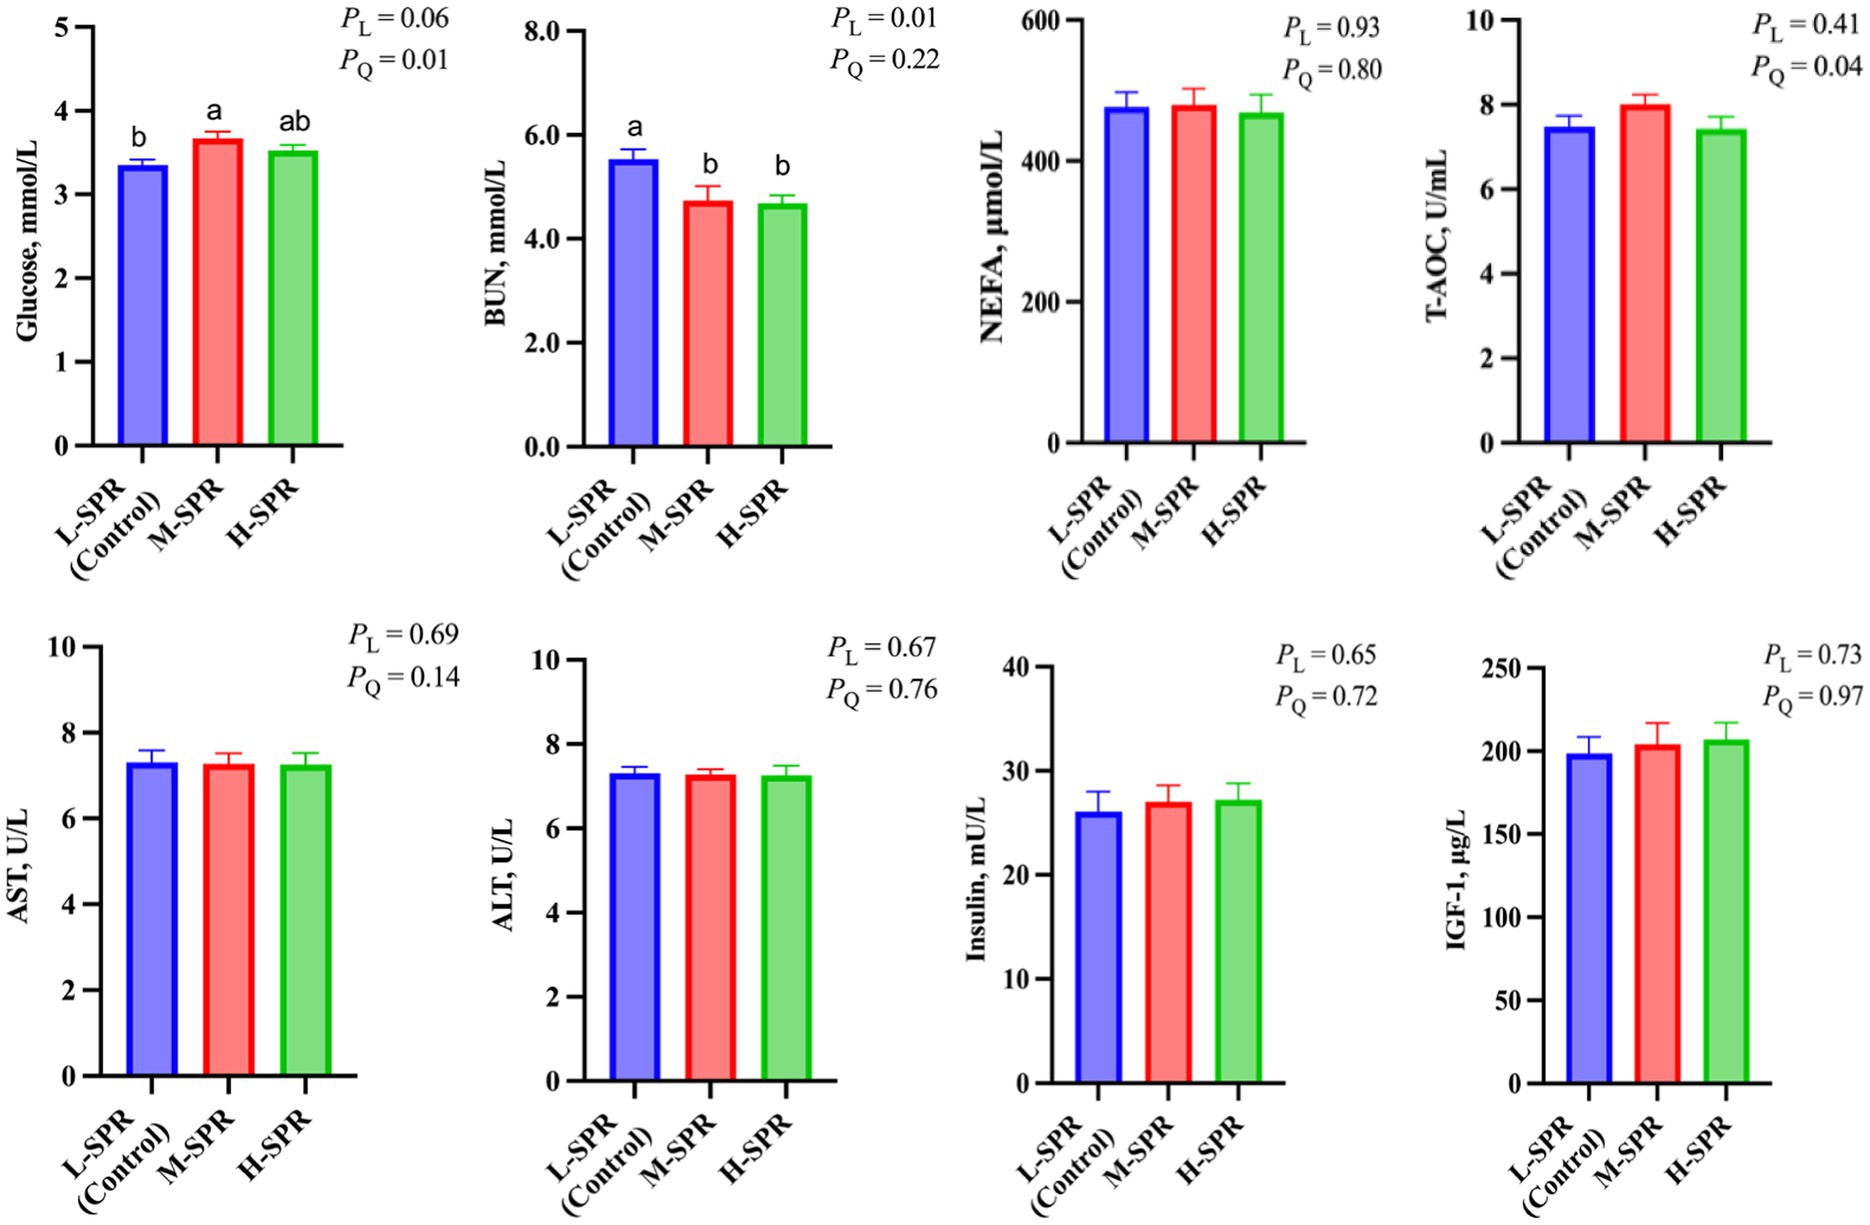
Figure 5. Effect of dietary rumen-degradable starch to rumen-degradable protein ratio (SPR) on blood indicators in mid-lactating Holstein cows. Error bars indicate measure of variation within the dietary SPRs. Different letters (a–b) indicate statistically significant difference (p < 0.05). L is linear, and Q is quadratic effects for diet SPR; BUN, blood urea nitrogen; NEFA, nonesterified fatty acid; T-AOC, total antioxidant capacity; AST, aspartate aminotransferase; ALT, alanine aminotransferase; IGF-1, insulin-like growth factor-1.
3.6 Nitrogen partitioning
Although the N intake linearly decreased (p = 0.01; Figure 6), the milk N secretion (p = 0.01) and the proportion of milk N to N intake (p = 0.01) quadratically increased with increasing dietary SPR. Compared to the L-SPR group (control), the M-SPR group demonstrated a 6.47% increase in milk N secretion and a 7.00% increase in the proportion of milk N to N intake. With increasing dietary SPR, the proportion of fecal N to N intake exhibited a quadratic decrease (p < 0.05). Additionally, urinary N excretion (p = 0.01) and the proportion of urinary N to N intake (p < 0.05) showed a linear decrease. The N retention (p = 0.03) and the proportion of N retention to N intake (p < 0.05) displayed a linear increase. Total excretion N exhibited a quadratic decrease with the increase in dietary SPR (p < 0.05), resulting in a 6.15% reduction in the M-SPR group compared to the L-SPR group (control).
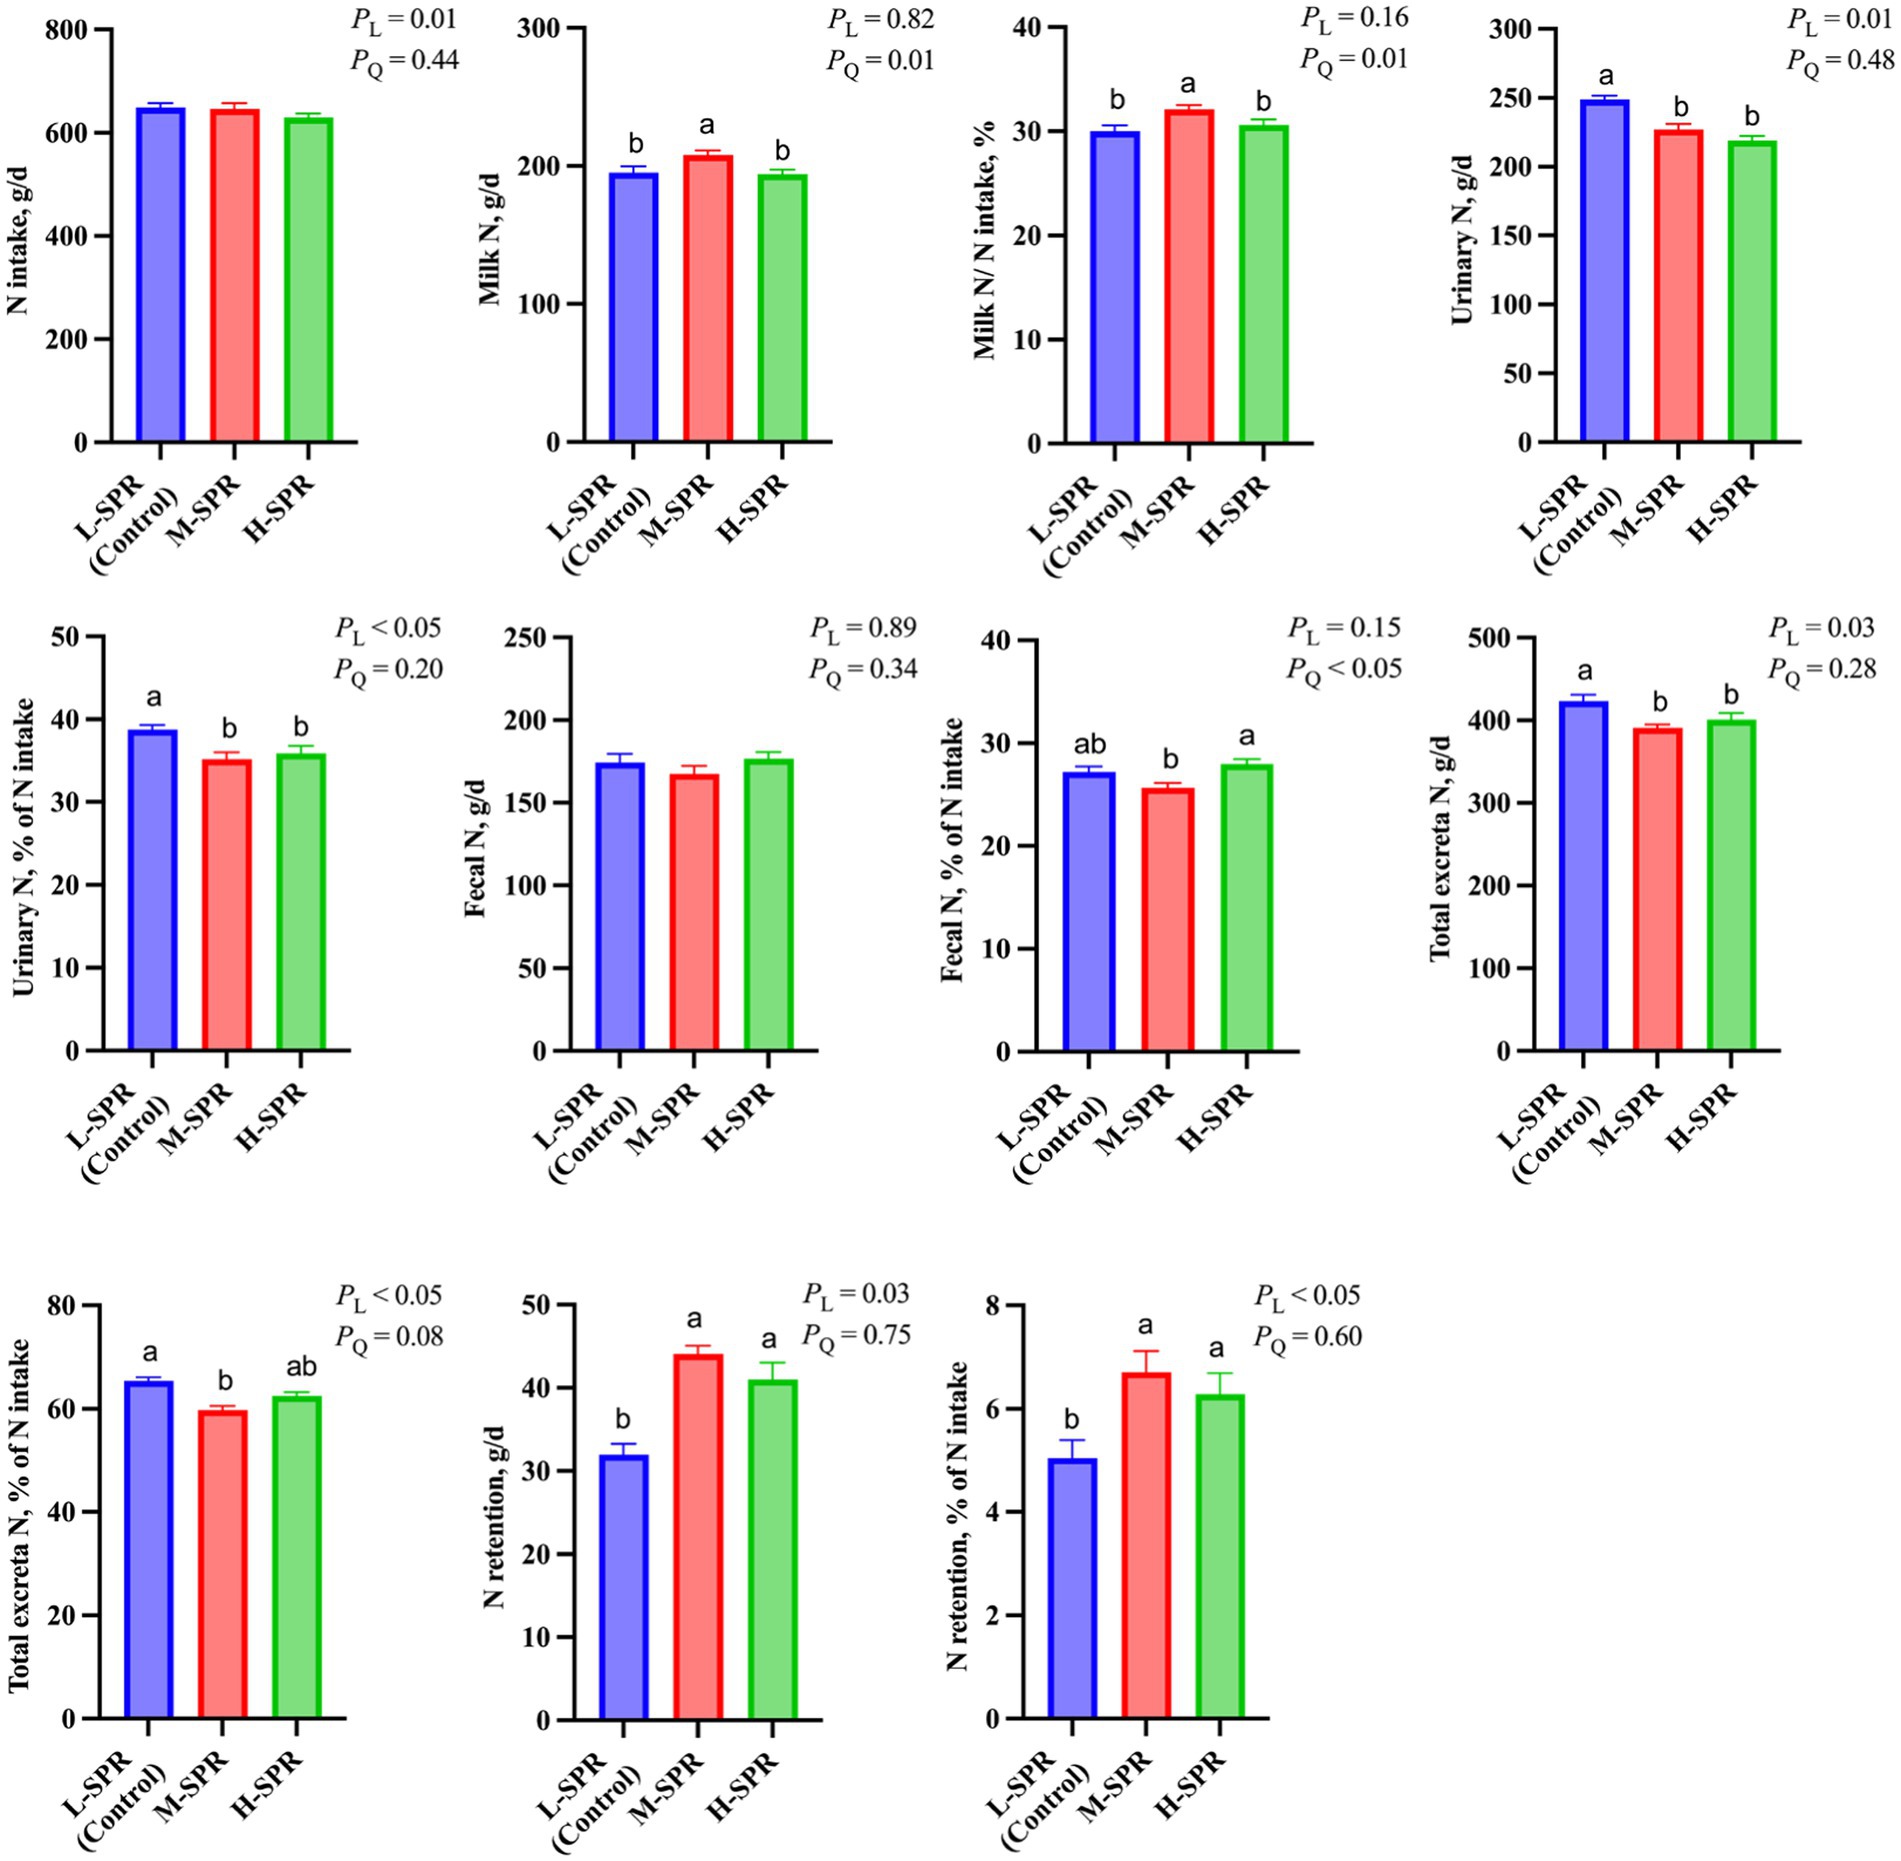
Figure 6. Effect of dietary rumen-degradable starch to rumen-degradable protein ratio (SPR) on nitrogen partitioning in mid-lactating Holstein cows. Error bars indicate measure of variation within the dietary SPRs. Different letters (a–b) indicate statistically significant difference (p < 0.05). L is linear, and Q is quadratic effects for diet SPR; Milk N, milk crude protein ÷ 6.25; Total N excretion, fecal N + urinary N; N retention, N intake – milk N – urinary N – fecal N.
4 Discussion
In the previous in vitro experiment, dietary SPR had been established as an effective indicator for regulating rumen fermentation and MCP synthesis (16). Analyses of diets and milk from large-scale farms revealed a notable increase in MUN content when the dietary SPR fell below 2.1, which corresponded to the SPR value designated for the control group in this study. This increase in MUN was likely due to the surplus NH3-N in the rumen, stemming from deficiencies in fermentable carbohydrates or excessive protein degradation (38). Therefore, optimizing dietary SPR by adjusting RDS or RDP levels could reduce rumen NH3-N wastage, ultimately enhancing lactation performance. While current feeding standards recommend dietary RDP levels, less attention has been given to dietary RDS levels, which influence rumen energy and carbon skeleton supply (9, 10). This study maintained a consistent dietary RDP level while adjusting dietary SPR by altering RDS levels.
Although the diets were designed to have similar forage NDF and energy content, our study observed a linear decrease in DMI with increasing dietary SPR. Allen et al. (39) point out that the regulation of DMI is primarily achieved through metabolic signals rather than rumen fill effects. Miyaji et al. (40) and Savari et al. (41) reported that increasing RDS level could increase propionate production, leading to a lower DMI, which was consistent with our study. In the present study, the dietary RDS level elevated with increasing dietary SPR, which support more starch to be fermented in the rumen for more propionate release. In the liver, propionate is utilized for gluconeogenesis while also stimulating the oxidation of acetyl-CoA (42). In this process, acetyl-CoA is used for energy supply to increase ATP production, enhancing satiety, and stopping feed intake. Thus, the linear decrease in DMI might be explained by the linear increase in propionate proportion.
Cows in the M-SPR group produced 1.6 kg more milk compared to those in the L-SPR group (control), despite similar numerical values for DMI, which aligns with findings by Santos et al. (43). The improved digestibility of OM in the M-SPR group might elevate glucose concentration, potentially resulting in higher lactose yield. Lactose plays a pivotal role in regulating milk osmotic pressure and production (44). Therefore, the enhancement of lactose yield might positively influence milk production. Moreover, the M-SPR group exhibited enhanced serum T-AOC capacity and decreased milk SCC, indicating improved antioxidant capacity and reduced milk losses (45). Hence, the enhancement in antioxidant status is another factor contributing to the increase in milk production.
Milk fat is a critical indicator for assessing the production performance of dairy cows. Zheng et al. (17) discovered that elevating dietary RDS level in goat led to a reduction in de novo fatty acid synthesis and milk fat production. In our study, the M-SPR group exhibited a significant improvement in the digestibility of NDF and ADF, potentially providing more acetate as precursors for milk fat synthesis. Additionally, the M-SPR group had a higher apparent digestibility of EE, allowing them to acquire more exogenous fatty acids, which is another reason for the increased milk fat yield. A meta-analysis by Ferraretto et al. (46) observed that a one-unit increase in RDS resulted in a corresponding 0.02-unit increase in milk protein content. Zhong et al. (47) reported a quadratic relationship in milk protein content and yields with the increasing proportion of rumen-fermentable carbohydrates. The MCP, comprising over half of the metabolizable protein in dairy cows, has a similar essential amino acid composition to milk (3). The elevated milk protein yield and milk N secretion within the M-SPR group might be partly attributed to its increased MCP synthesis. Furthermore, the heightened glucose concentration in the M-SPR group might diminish the necessity for certain amino acids in gluconeogenesis. Consequently, this elevated glucose concentration might also account for the increased milk protein yield in the M-SPR group.
In our study, the higher MUN and BUN concentration in the L-SPR group (control) indicated a lower degree of synchronization in energy and N supply within their rumen (48). The increased proportion of BCVFA in the L-SPR group (control) suggested that more amino acids were degraded to provide energy, leading to a subsequent rise in NH3-N concentration. Since the diets were designed to be similar RDP level in our study, the increased proportion of urinary nitrogen to N intake in L-SPR group (control) was likely due to inadequate ruminal energy supply stemming from a lower dietary RDS level. Therefore, the lower NUE in L-SPR group (control) was attributed to the increased proportion of urinary nitrogen to N intake. Similar results were also reported by Kand and Dickhoefer (49). Furthermore, despite having the highest RDS levels, the H-SPR group did not exhibit a high NUE as the M-SPR group. This might be due to the higher proportion of fecal N to N intake in this group. The H-SPR group had a diet with a higher level of HSBM, which had lower intestinal digestibility (50), consequently increasing fecal N excretion.
Although an increase in TVFA concentration was observed in our study, the dietary SPR did not impact rumen pH. This might be attributed to the adequate dietary forage NDF and peNDF among treatments (8, 51). Within the normal range of rumen pH, a moderate dietary RDS level was observed to enhance the proliferation of cellulolytic and amylolytic bacteria compared to diets with low or high RDS levels (52). Moreover, Zhang et al. (53) reported a positive association between the MCP synthesis and the relative abundance of cellulolytic and amylolytic bacteria. Consequently, the increased synthesis of MCP in the M-SPR group might enhance the abundance of cellulolytic and amylolytic bacteria in the rumen. This, in turn, could lead to improved digestibility of starch and fiber for dairy cows, accompanied by a corresponding increase in ruminal TVFA concentration.
5 Conclusion
The dietary SPR emerges as a novel indicator, offering insights into the availability of energy and nitrogen within the rumen. A lower dietary SPR correlated with an increase in the proportion of urinary nitrogen excretion, while a higher dietary SPR was associated with a reduction in dry matter intake. Balancing dietary SPR could boost lactation performance and nitrogen utilization efficiency by improving MCP synthesis and nutrient digestibility. Considering the economic benefits and environmental protection, this study recommends a medium dietary SPR (with SPR = 2.3) for mid-lactating Holstein dairy cows. Nevertheless, further investigations on rumen microbial composition and metabolites are required to elucidate the underlying mechanisms responsible for the observed effects.
Data availability statement
The original contributions presented in the study are included in the article/supplementary material, further inquiries can be directed to the corresponding authors.
Ethics statement
The animal study was approved by the Institutional of Animal Care and Use Committee at Hebei Agricultural University. The study was conducted in accordance with the local legislation and institutional requirements.
Author contributions
PC: Data curation, Methodology, Software, Writing – original draft. YL: Methodology, Writing – review & editing. MW: Data curation, Writing – review & editing. YS: Formal analysis, Funding acquisition, Writing – review & editing. ML: Writing – review & editing. HX: Writing – review & editing. NM: Writing – review & editing. YC: Writing – review & editing. QL: Writing – review & editing. MA: Writing – review & editing. ZW: Validation, Writing – review & editing. ZH: Visualization, Writing – review & editing. SR: Visualization, Writing – review & editing. LH: Methodology, Writing – review & editing. JL: Software, Writing – review & editing. YG: Funding acquisition, Methodology, Software, Supervision, Writing – review & editing. JgL: Funding acquisition, Investigation, Project administration, Resources, Supervision, Writing – review & editing.
Funding
The author(s) declare financial support was received for the research, authorship, and/or publication of this article. This research was financially supported by the earmarked fund for CARS (CARS-36-20, Beijing, China), the Top Talent Project of Hebei Province (6012018, Shijiazhuang, China), Hebei Dairy Cattle Innovation Team of Modern Agro-industry Technology Research System (HBCT2023180207, Shijiazhuang, China), the Key Research and Development Project of Hebei (20326606D, Shijiazhuang, China) and Precision Animal Husbandry Discipline Group Construction Project of Hebei Agricultural University (1090064, Baoding, China).
Acknowledgments
The authors thank all the staff of Hongda Commercial Dairy Farm (Baoding, China) for their assistance in animal care and members of the Key Laboratory of Healthy Breeding in Dairy Cattle for their help in sample collections.
Conflict of interest
The authors declare that the research was conducted in the absence of any commercial or financial relationships that could be construed as a potential conflict of interest.
Publisher’s note
All claims expressed in this article are solely those of the authors and do not necessarily represent those of their affiliated organizations, or those of the publisher, the editors and the reviewers. Any product that may be evaluated in this article, or claim that may be made by its manufacturer, is not guaranteed or endorsed by the publisher.
Supplementary material
The Supplementary material for this article can be found online at: https://www.frontiersin.org/articles/10.3389/fvets.2024.1330876/full#supplementary-material
References
1. Matthews, C, Crispie, F, Lewis, E, Reid, M, O'Toole, PW, and Cotter, PD. The rumen microbiome: a crucial consideration when Optimising Milk and meat production and nitrogen utilisation efficiency. Gut Microbes. (2019) 10:115–32. doi: 10.1080/19490976.2018.1505176
2. Scharen, M, Frahm, J, Kersten, S, Meyer, U, Hummel, J, Breves, G, et al. Interrelations between the rumen microbiota and production, behavioral, rumen fermentation, metabolic, and immunological attributes of dairy cows. J Dairy Sci. (2018) 101:4615–37. doi: 10.3168/jds.2017-13736
3. Schwab, CG, and Broderick, GA. A 100-year review: protein and amino acid nutrition in dairy cows. J Dairy Sci. (2017) 100:10094–112. doi: 10.3168/jds.2017-13320
4. Clark, JH, Klusmeyer, TH, and Cameron, MR. Microbial protein synthesis and flows of nitrogen fractions to the duodenum of dairy cows. J Dairy Sci. (1992) 75:2304–23. doi: 10.3168/jds.S0022-0302(92)77992-2
5. Hall, MB, and Huntington, GB. Nutrient synchrony: sound in theory, elusive in practice. J Anim Sci. (2008) 86:E287–92. doi: 10.2527/jas.2007-0516
6. Offner, A, Bach, A, and Sauvant, D. Quantitative review of in situ starch degradation in the rumen. Anim Feed Sci Technol. (2003) 106:81–93. doi: 10.1016/s0377-8401(03)00038-5
7. Nocek, JE, and Russell, JB. Protein and energy as an integrated system. Relationship of ruminal protein and carbohydrate availability to microbial synthesis and Milk production. J Dairy Sci. (1988) 71:2070–107. doi: 10.3168/jds.S0022-0302(88)79782-9
8. National Academies of Sciences Engineering, Medicine. Nutrient requirements of dairy cattle. Eighth Revised ed. Washington, DC: The National Academies Press (2021). 502 p.
9. White, RR, Roman-Garcia, Y, and Firkins, JL. Meta-analysis of Postruminal microbial nitrogen flows in dairy cattle. Ii. Approaches to and implications of more mechanistic prediction. J Dairy Sci. (2016) 99:7932–44. doi: 10.3168/jds.2015-10662
10. Hall, MB, and Herejk, C. Differences in yields of microbial crude protein from in vitro fermentation of carbohydrates. J Dairy Sci. (2001) 84:2486–93. doi: 10.3168/jds.S0022-0302(01)74699-1
11. Hall, MB, Larson, CC, and Wilcox, CJ. Carbohydrate source and protein degradability Alter lactation, ruminal, and blood measures. J Dairy Sci. (2010) 93:311–22. doi: 10.3168/jds.2009-2552
12. Belanche, A, Doreau, M, Edwards, JE, Moorby, JM, Pinloche, E, and Newbold, CJ. Shifts in the rumen microbiota due to the type of carbohydrate and level of protein ingested by dairy cattle are associated with changes in rumen fermentation. J Nutr. (2012) 142:1684–92. doi: 10.3945/jn.112.159574
13. Reynal, SM, and Broderick, GA. Effect of dietary level of rumen-degraded protein on production and nitrogen metabolism in lactating dairy cows. J Dairy Sci. (2005) 88:4045–64. doi: 10.3168/jds.S0022-0302(05)73090-3
14. Davies, KL, McKinnon, JJ, and Mutsvangwa, T. Effects of dietary Ruminally degradable starch and Ruminally degradable protein levels on urea recycling, microbial protein production, nitrogen balance, and duodenal nutrient flow in beef heifers fed low crude protein diets. Can J Anim Sci. (2013) 93:123–36. doi: 10.4141/cjas2012-062
15. Martins, C, Fonseca, DCM, Alves, BG, Arcari, MA, Ferreira, GC, Welter, KC, et al. Effect of dietary crude protein degradability and corn processing on lactation performance and Milk protein composition and stability. J Dairy Sci. (2019) 102:4165–78. doi: 10.3168/jds.2018-15553
16. Chen, P, Li, Y, Shen, Y, Cao, Y, Li, Q, Wang, M, et al. Effect of dietary rumen-degradable starch to rumen-degradable protein ratio on in vitro rumen fermentation characteristics and microbial protein synthesis. Animals (Basel). (2022) 12:2633. doi: 10.3390/ani12192633
17. Zheng, L, Wu, S, Shen, J, Han, X, Jin, C, Chen, X, et al. High rumen degradable starch decreased goat Milk fat via Trans-10, Cis-12 conjugated linoleic acid-mediated downregulation of lipogenesis genes, particularly, Insig1. J Anim Sci Biotechnol. (2020) 11:30. doi: 10.1186/s40104-020-00436-3
18. National Research Council. Nutrient requirements of dairy cattle. Washington, DC, USA: National Academies Press (2001).
19. ASAE. Method of determining and expressing fineness of feed materials by sieving. St. Joseph, MI, USA: American Society of Agricultural and Biological Engineers (2003).
20. Calsamiglia, S, and Stern, MD. A three-step in vitro procedure for estimating intestinal digestion of protein in ruminants. J Anim Sci. (1995) 73:1459–65. doi: 10.2527/1995.7351459x
21. Zebeli, Q, Dijkstra, J, Tafaj, M, Steingass, H, Ametaj, BN, and Drochner, W. Modeling the adequacy of dietary Fiber in dairy cows based on the responses of ruminal Ph and Milk fat production to composition of the diet. J Dairy Sci. (2008) 91:2046–66. doi: 10.3168/jds.2007-0572
22. Li, Z, Liu, N, Cao, Y, Jin, C, Li, F, Cai, C, et al. Effects of Fumaric acid supplementation on methane production and rumen fermentation in goats fed diets varying in forage and concentrate particle size. J Anim Sci Biotechnol. (2018) 9:21. doi: 10.1186/s40104-018-0235-3
23. Ørskov, ER, and McDonald, I. The estimation of protein degradability in the rumen from incubation measurements weighted according to rate of passage. J Agric Sci. (1979) 92:499–503. doi: 10.1017/s0021859600063048
24. Li, Y, Shen, Y, Niu, J, Guo, Y, Pauline, M, Zhao, X, et al. Effect of active dry yeast on lactation performance, methane production, and ruminal fermentation patterns in early-lactating Holstein cows. J Dairy Sci. (2021) 104:381–90. doi: 10.3168/jds.2020-18594
25. International Dairy Federation. A common carbon footprint approach for the dairy sector. The Idf guide to standard life cycle assessment methodology. Brussels, Belgium: IDF (2015).
26. Shen, JS, Chai, Z, Song, LJ, Liu, JX, and Wu, YM. Insertion depth of Oral stomach tubes may affect the fermentation parameters of ruminal fluid collected in dairy cows. J Dairy Sci. (2012) 95:5978–84. doi: 10.3168/jds.2012-5499
27. Shen, Y, Davedow, T, Ran, T, Saleem, AM, Yoon, I, Narvaez, C, et al. Ruminally protected and unprotected Saccharomyces Cerevisiae fermentation products as alternatives to antibiotics in finishing beef Steers1. J Anim Sci. (2019) 97:4323–33. doi: 10.1093/jas/skz270
28. AOAC. Official methods of analysis of Aoac international. 17th ed. Gaithersburg, MD, USA: Association of Official Analytical Chemists (2005).
29. Van Soest, PJ, Robertson, JB, and Lewis, BA. Methods for dietary Fiber, neutral detergent Fiber, and nonstarch polysaccharides in relation to animal nutrition. J Dairy Sci. (1991) 74:3583–97. doi: 10.3168/jds.S0022-0302(91)78551-2
30. Mertens, DR. Gravimetric determination of amylase-treated neutral detergent Fiber in feeds with refluxing in beakers or crucibles: collaborative study. J AOAC Int. (2002) 85:1217–40.
31. Van Keulen, J, and Young, BA. Evaluation of acid-insoluble ash as a natural marker in ruminant digestibility studies. J Anim Sci. (1977) 44:282–7. doi: 10.2527/jas1977.442282x
32. Rice, EM, Aragona, KM, Moreland, SC, and Erickson, PS. Supplementation of sodium butyrate to Postweaned heifer diets: effects on growth performance, nutrient digestibility, and health. J Dairy Sci. (2019) 102:3121–30. doi: 10.3168/jds.2018-15525
33. Valadares, RF, Broderick, GA, Valadares Filho, SC, and Clayton, MK. Effect of replacing alfalfa silage with high moisture corn on ruminal protein synthesis estimated from excretion of Total purine derivatives. J Dairy Sci. (1999) 82:2686–96. doi: 10.3168/jds.s0022-0302(99)75525-6
34. Chen, XB, and Gomes, MJ. Estimation of microbial protein supply to sheep and cattle based on urinary excretion of purine derivatives—An overview of the technical details. Aberdeen, UK: International Feed Resources Unit, Rowett Research Institute (1992).
35. Shen, YZ, Ding, LY, Chen, LM, Xu, JH, Zhao, R, Yang, WZ, et al. Feeding corn grain steeped in citric acid modulates rumen fermentation and inflammatory responses in dairy goats. Animal. (2019) 13:301–8. doi: 10.1017/S1751731118001064
36. Broderick, GA, and Kang, JH. Automated simultaneous determination of Ammonia and Total amino acids in ruminal fluid and in vitro media. J Dairy Sci. (1980) 63:64–75. doi: 10.3168/jds.S0022-0302(80)82888-8
37. Littell, RC, Henry, PR, and Ammerman, CB. Statistical analysis of repeated measures data using Sas procedures. J Anim Sci. (1998) 76:1216–31. doi: 10.2527/1998.7641216x
38. Hartinger, T, Gresner, N, and Sudekum, KH. Does intra-ruminal nitrogen recycling waste valuable resources? A review of major players and their manipulation. J Anim Sci Biotechnol. (2018) 9:33. doi: 10.1186/s40104-018-0249-x
39. Allen, MS, Bradford, BJ, and Oba, M. Board invited review: the hepatic oxidation theory of the control of feed intake and its application to ruminants. J Anim Sci. (2009) 87:3317–34. doi: 10.2527/jas.2009-1779
40. Miyaji, M, Matsuyama, H, and Hosoda, K. Effect of substituting Brown Rice for corn on lactation and digestion in dairy cows fed diets with a high proportion of grain. J Dairy Sci. (2014) 97:952–60. doi: 10.3168/jds.2013-7046
41. Savari, M, Khorvash, M, Amanlou, H, Ghorbani, GR, Ghasemi, E, and Mirzaei, M. Effects of rumen-degradable protein:rumen-Undegradable protein ratio and corn processing on production performance, nitrogen efficiency, and feeding behavior of Holstein dairy cows. J Dairy Sci. (2018) 101:1111–22. doi: 10.3168/jds.2017-12776
42. Allen, MS. Effects of diet on short-term regulation of feed intake by lactating dairy cattle. J Dairy Sci. (2000) 83:1598–624. doi: 10.3168/jds.S0022-0302(00)75030-2
43. Santos, JEP, Huber, JT, Theurer, CB, Nussio, LG, Tarazon, M, and Santos, FAP. Response of lactating dairy cows to steam-flaked Sorghum, steam-flaked corn, or steam-rolled corn and protein sources of differing degradability. J Dairy Sci. (1999) 82:728–37. doi: 10.3168/jds.S0022-0302(99)75290-2
44. Cant, JP, Trout, DR, Qiao, F, and Purdie, NG. Milk synthetic response of the bovine mammary gland to an increase in the local concentration of arterial glucose. J Dairy Sci. (2002) 85:494–503. doi: 10.3168/jds.S0022-0302(02)74100-3
45. Hadrich, JC, Wolf, CA, Lombard, J, and Dolak, TM. Estimating Milk yield and value losses from increased somatic cell count on us dairy farms. J Dairy Sci. (2018) 101:3588–96. doi: 10.3168/jds.2017-13840
46. Ferraretto, LF, Crump, PM, and Shaver, RD. Effect of cereal grain type and corn grain harvesting and processing methods on intake, digestion, and Milk production by dairy cows through a Meta-analysis. J Dairy Sci. (2013) 96:533–50. doi: 10.3168/jds.2012-5932
47. Zhong, RZ, Li, JG, Gao, YX, Tan, ZL, and Ren, GP. Effects of substitution of different levels of steam-flaked corn for finely ground corn on lactation and digestion in early lactation dairy cows. J Dairy Sci. (2008) 91:3931–7. doi: 10.3168/jds.2007-0957
48. Beatson, PR, Meier, S, Cullen, NG, and Eding, H. Genetic variation in Milk urea nitrogen concentration of dairy cattle and its implications for reducing urinary nitrogen excretion. Animal. (2019) 13:2164–71. doi: 10.1017/S1751731119000235
49. Kand, D, and Dickhoefer, U. The effects of rumen nitrogen balance on nutrient intake, nitrogen partitioning, and microbial protein synthesis in lactating dairy cows offered different dietary protein sources. J Dairy Sci. (2021) 104:4223–35. doi: 10.3168/jds.2019-18005
50. Huhtanen, P, and Hristov, AN. A Meta-analysis of the effects of dietary protein concentration and degradability on Milk protein yield and Milk N efficiency in dairy cows. J Dairy Sci. (2009) 92:3222–32. doi: 10.3168/jds.2008-1352
51. Khorrami, B, Khiaosa-Ard, R, and Zebeli, Q. Models to predict the risk of subacute ruminal acidosis in dairy cows based on dietary and cow factors: a Meta-analysis. J Dairy Sci. (2021) 104:7761–80. doi: 10.3168/jds.2020-19890
52. Li, F, Yang, XJ, Cao, YC, Li, SX, Yao, JH, Li, ZJ, et al. Effects of dietary effective Fiber to rumen degradable starch ratios on the risk of sub-acute ruminal acidosis and rumen content fatty acids composition in dairy goat. Anim Feed Sci Technol. (2014) 189:54–62. doi: 10.1016/j.anifeedsci.2013.12.011
Keywords: rumen-degradable starch, rumen-degradable protein, lactation performance, nitrogen utilization efficiency, Holstein dairy cows
Citation: Chen PL, Li Y, Wang MM, Shen YZ, Liu MC, Xu HJ, Ma N, Cao YF, Li QF, Abdelsattar MM, Wang ZY, Huo ZH, Ren S, Hu LQ, Liu J, Gao YX and Li JG (2024) Optimizing dietary rumen-degradable starch to rumen-degradable protein ratio improves lactation performance and nitrogen utilization efficiency in mid-lactating Holstein dairy cows. Front. Vet. Sci. 11:1330876. doi: 10.3389/fvets.2024.1330876
Edited by:
Rui Hu, Sichuan Agricultural University, ChinaReviewed by:
Peng Sun, Institute of Animal Sciences (CAAS), ChinaAli Mujtaba Shah, Shaheed Benazir Bhutto University of Veterinary & Animal Sciences, Pakistan
Xianwen Dong, Chongqing Academy of Animal Science, China
Copyright © 2024 Chen, Li, Wang, Shen, Liu, Xu, Ma, Cao, Li, Abdelsattar, Wang, Huo, Ren, Hu, Liu, Gao and Li. This is an open-access article distributed under the terms of the Creative Commons Attribution License (CC BY). The use, distribution or reproduction in other forums is permitted, provided the original author(s) and the copyright owner(s) are credited and that the original publication in this journal is cited, in accordance with accepted academic practice. No use, distribution or reproduction is permitted which does not comply with these terms.
*Correspondence: Yanxia Gao, eWFueGlhLmdhb0BoZWJhdS5lZHUuY24=; Jianguo Li, amdsaUBoZWJhdS5lZHUuY24=
†These authors have contributed equally to this work