 Shuyuan Luo
 Ying Bai2†
 Xinpeng Li
- 1College of Animal Science and Technology, Yunnan Agricultural University, Kunming, China
- 2School of Life Sciences and Food Engineering, Hebei University of Engineering, Handan, Hebei, China
Since the number of muscle fibers in pigs is largely fixed after birth, the formation of muscle fibers during the embryonic stage plays a crucial role in determining postnatal growth performance and meat production potential. In this study, we used large Diqing Tibetan pigs (LTP) and small Diqing Tibetan pigs (STP), which show significant differences in postnatal growth rate and meat yield, as research models. We employed RNA-seq for transcriptome sequencing and applied differential expression analysis combined with weighted gene co-expression network analysis (WGCNA) to compare their gene expression profiles and identify potential regulatory differences during key stages of embryonic muscle development. Longissimus dorsi muscle samples were collected from both groups at three critical developmental stages—embryonic day 55 (E55), embryonic day 75 (E75), and at birth (D0)—for transcriptome sequencing. Differential expression analysis revealed that the higher meat yield observed in LTP compared with STP may be attributed to a stronger capacity for secondary muscle fiber formation during the embryonic stage. Furthermore, WGCNA identified candidate genes that may specifically regulate muscle development in LTP across the three key developmental stages. These findings provide valuable insights into the molecular regulatory networks underlying muscle development and growth potential in Diqing Tibetan pigs.
1 Introduction
Skeletal muscle development is a complex process involving the formation of muscle fibers during embryonic development and hypertrophy after birth (1). Myofibers originate from myoblasts that proliferate and fuse to form myotubes, which then differentiate into mature myofibers. In pigs, the formation of skeletal muscle during embryonic development involves two key phases: the establishment of primary myofibers and the emergence of secondary myofibers. The formation of primary myofiber occurs during early gestation (from day 35 to day 55), when precursor myogenic cells fuse to form myotubes (2). Following the formation of primary fibers, secondary fiber development occurs from day 55 to day 90, during which myogenic cells rapidly proliferate and differentiate, utilizing the primary fibers as a scaffold for the formation of secondary fibers (3). Following birth, the number of muscle fibers in pigs remains stable, with the primary change being an increase in fiber size (4). Consequently, the embryonic stage of skeletal muscle development is vital. Elucidating the genetic mechanisms that regulate this process, particularly during early development, is essential for improving pork production efficiency.
The Diqing Tibetan pig is an excellent local breed primarily distributed in the Diqing Tibetan Autonomous Prefecture of Yunnan Province, China. As a typical plateau breed, Diqing pigs exhibit low oxygen tolerance (5–8) and possess outstanding meat quality traits (9–13). Based on body size differences, Diqing Tibetan pigs can be categorized into large, medium, and small types. Adult large pigs can weigh between 70 and 150 kg, with an average daily gain of 200–250 grams during the fattening period; small pigs typically weigh between 45 and 55 kg, gaining 100–120 grams daily during the same phase (14–16). These body size differences not only affect the growth rate and meat quality characteristics of the pigs but also provide important material for analyzing the functional genes involved in variations in muscle fiber development within the breed. Currently, research on Diqing Tibetan pigs mainly focuses on various aspects, including origin and domestication (17), genetic diversity (18–20), hybrid utilization (21, 22), growth characteristics (23, 24), high-altitude adaptation (25), fat deposition (26–29), and postnatal muscle development (30–32). Despite the existing studies covering multiple areas, research on the differential expression of genes involved in muscle development during the embryonic stages of large and small Diqing Tibetan pigs is still limited. In this study, we utilized both large and small Diqing Tibetan Pigs, which exhibit marked differences in growth rate, and lean meat percentage. Our objective was to identify key genes that influence muscle fiber development at various stages across different body types. These findings will provide a valuable foundation for genetic improvement and effective breeding strategies.
2 Materials and methods
2.1 Ethical statement
All experimental procedures in this study received approval from The Ethics Committee of Life Sciences, Yunnan Agricultural University (approval number: 202207003).
2.2 Sample collection
The experimental subjects included large Diqing Tibetan pigs (LTP) and small Diqing Tibetan pigs (STP), all housed and fed under uniform conditions at the Lvyuan Agricultural Professional Cooperative in Shangri-La City, Yunnan Province, China. Our research team previously established two distinct lineages characterized by large and small body types through a long-term selective breeding program focused on growth rate and adult body weight differences. At 6 months of age, large Diqing Tibetan pigs had an average weight of 59.33 ± 5.77 kg, while small Diqing Tibetan pigs averaged 28.00 ± 2.00 kg. Purebred sows from each breed were synchronized in estrus and mated with purebred boars of the same breed. Three embryos or piglets at the identical developmental stage were all derived from the same maternal sow: embryonic day 55 (E55), embryonic day 75 (E75), and immediately after birth (D0), designated as LTP-E55, LTP-E75, LTP-D0 (and similarly for STP). Three fetuses or piglets from every group were randomly chosen for longissimus dorsi (LD) muscle sampling, subsequently flash-frozen in liquid nitrogen and preserved at −80 °C in the laboratory.
2.3 Tissue total RNA extraction and sequencing
Total RNA extraction from tissue samples was performed using the Trizol method, and nucleic acid integrity was verified via agarose gel electrophoresis. The optical density (OD) values of the nucleic acids were measured using a NanoDrop spectrophotometer to assess their purity. RNA integrity number (RIN) assessment was performed using the Agilent 2100 Bioanalyzer to evaluate quality. Following quality control, the RNA samples were submitted to Genedenovo Biotechnology Co., Ltd. (Guangzhou, China) for paired-end sequencing. The cDNA library was sequenced on the Illumina NovaSeq 6000 platform with 6 Gb of raw reads per biological replicate.
2.4 Raw data quality control and alignment
Raw sequencing data (Raw reads) were first processed with the FASTP tool (version 0.23.4) (33) for quality control. In this step, reads with adapters or poly-N sequences, over 10% unknown nucleotides, and more than 50% low-quality bases (Q ≤ 10) were eliminated. This quality control procedure produced high-quality reads (Clean reads), ensuring accuracy in subsequent analyses. The Clean reads were aligned to the reference genome of the pig (Sscrofa11.1) with HISAT2 (version 2.2.1) (34), and alignment rates were subsequently calculated. Finally, transcripts were assembled and quantified using STRINGTIE (version 2.2.3) (35), producing a raw expression matrix (Counts) for each gene in each sample.
2.5 Identification of differentially expressed genes and functional enrichment analysis
To account for sequencing depth and adjust for gene length effects, raw read counts were normalized to gene length corrected trimmed mean of M-values (GeTMM) (36) for all genes in each sample. The GeTMM normalized matrix encompassing all genes across all samples was subjected to principal component analysis (PCA) using the FactoMineR package (version 2.11) (37).
Following PCA confirmation of high-quality sequencing data and reliable sample grouping, the analysis was performed using the edgeR package (version 3.40.2) (38), differentially expressed genes (DEGs) were identified based on the GeTMM of genes, with statistically significant DEGs defined by dual thresholds of absolute log2 (Fold Change) > 1.0 and adjusted p-value (FDR) < 0.05. Enrichment analysis for Gene Ontology (GO) was performed on genes from significantly correlated modules by KOBAS online database1 (39).
2.6 Weighted gene co-expression network analysis
Using the GeTMM values of each gene across all samples, we performed weighted gene co-expression network analysis (WGCNA) in R using the WGCNA package (version 1.73) (40). The weighted adjacency matrix was constructed using the soft-thresholding power (β) of 9 to attain scale-free topology. The adjacency was transformed into a topological overlap matrix (TOM), and the corresponding dissimilarity (1-TOM) is calculated. The modules were identified by dynamic tree cutting and with a minimum module size of 50. A correlation of 70% (equivalent to a distance metric threshold of 0.3 in analytical pipelines) was used to merge similar modules. We conducted a correlation analysis between each module and the three developmental stages of different body types to identify relevant modules highly associated with LTP across these stages. Visualization was achieved through heatmaps, and modules with p-value < 0.05 were designated as significantly correlated modules for further analysis. A significance threshold of p-value < 0.05 was applied for enrichment analysis. We calculated kernel module eigengenes (KME) by assessing gene significance (GS) and module membership (MM) to identify hub genes within the modules.
2.7 Construction of the differentially expressed gene interaction network
We compared the identified DEGs with protein entries in the STRING database2 (41). Based on homology protein–protein interaction data, we created an interaction network for the identified DEGs, which was subsequently visualized using Cytoscape (version 3.10.1) (42). Nodes with the most neighbors were designated as key genes.
2.8 Validation by real-time quantitative PCR
The porcine GAPDH gene (43, 44) was employed as the internal reference. The total RNA for qPCR was derived from the RNA used in the RNA-seq experiments. The design of primers was conducted with Primer-BLAST,3 with the sequences provided in Table 1. Shenggong Biological Engineering (Shanghai) Co., Ltd., Kunming Branch (Kunming, China) synthesized all primers. In accordance with the manufacturer’s guidelines, qPCR was conducted using a SYBR Green qPCR kit (TIANGEN, China, FP205) on an FQD-96A real-time PCR detection system (Bioer, Hangzhou, Zhejiang, China). The reaction system had a total volume of 20 μL, which included 10 μL of 2 × SuperRreMixPlus, 0.6 μL of each forward and reverse primer (10 μM), 1 μL of cDNA, 0.5 μL of 50 × ROX Reference Dye, and 7.3 μL of RNase-free distilled water were added. The reaction program comprised an initial activation step at 95 °C for 15 min, followed by 40 cycles of denaturation at 95 °C for 10 s and annealing/extension at 60 °C for 20 s. A melting curve analysis was executed by incrementally increasing the temperature from 60 °C to 95 °C, with each sample evaluated in triplicate. Gene expression levels were normalized to GAPDH, and The 2^−ΔΔCt method was utilized to assess relative expression levels.
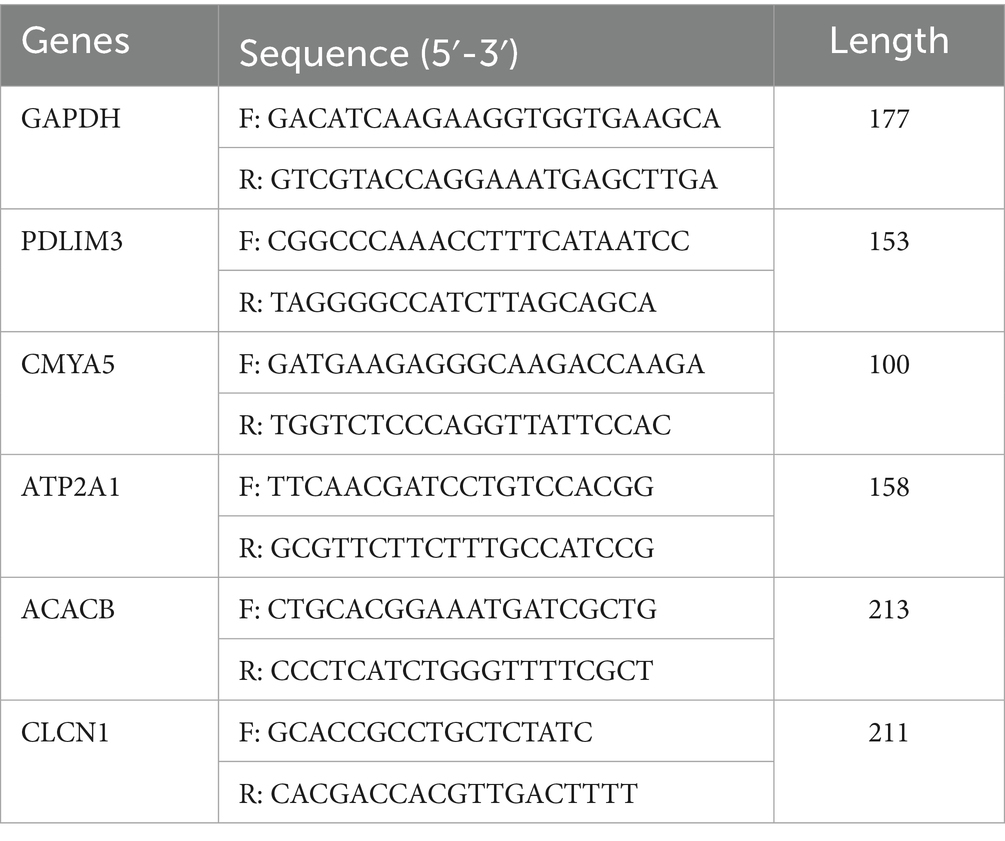
Table 1. Primers for real-time quantitative PCR.
3 Results
3.1 RNA-seq data quality assessment of LD muscle samples
The RNA-seq data showed that the LTP groups at three developmental stages generated an average of 38.37 M, 41.39 M, and 46.46 M raw reads, respectively. The STP groups produced an average of 38.21 M, 38.49 M, and 36.77 M raw reads. Following quality control, the clean read rate surpassed 98%, with over 95% of reads mapping to the porcine reference genome (Sscrofa 11.1), indicating high-quality alignment (Supplementary Table S1). Subsequently, PCA (Figure 1) demonstrated that biological replicates within each group clustered tightly, while clear separation was observed among different groups, occupying distinct positions. This confirms the high quality of the data and the reliability of sample grouping, supporting their suitability for downstream analysis.
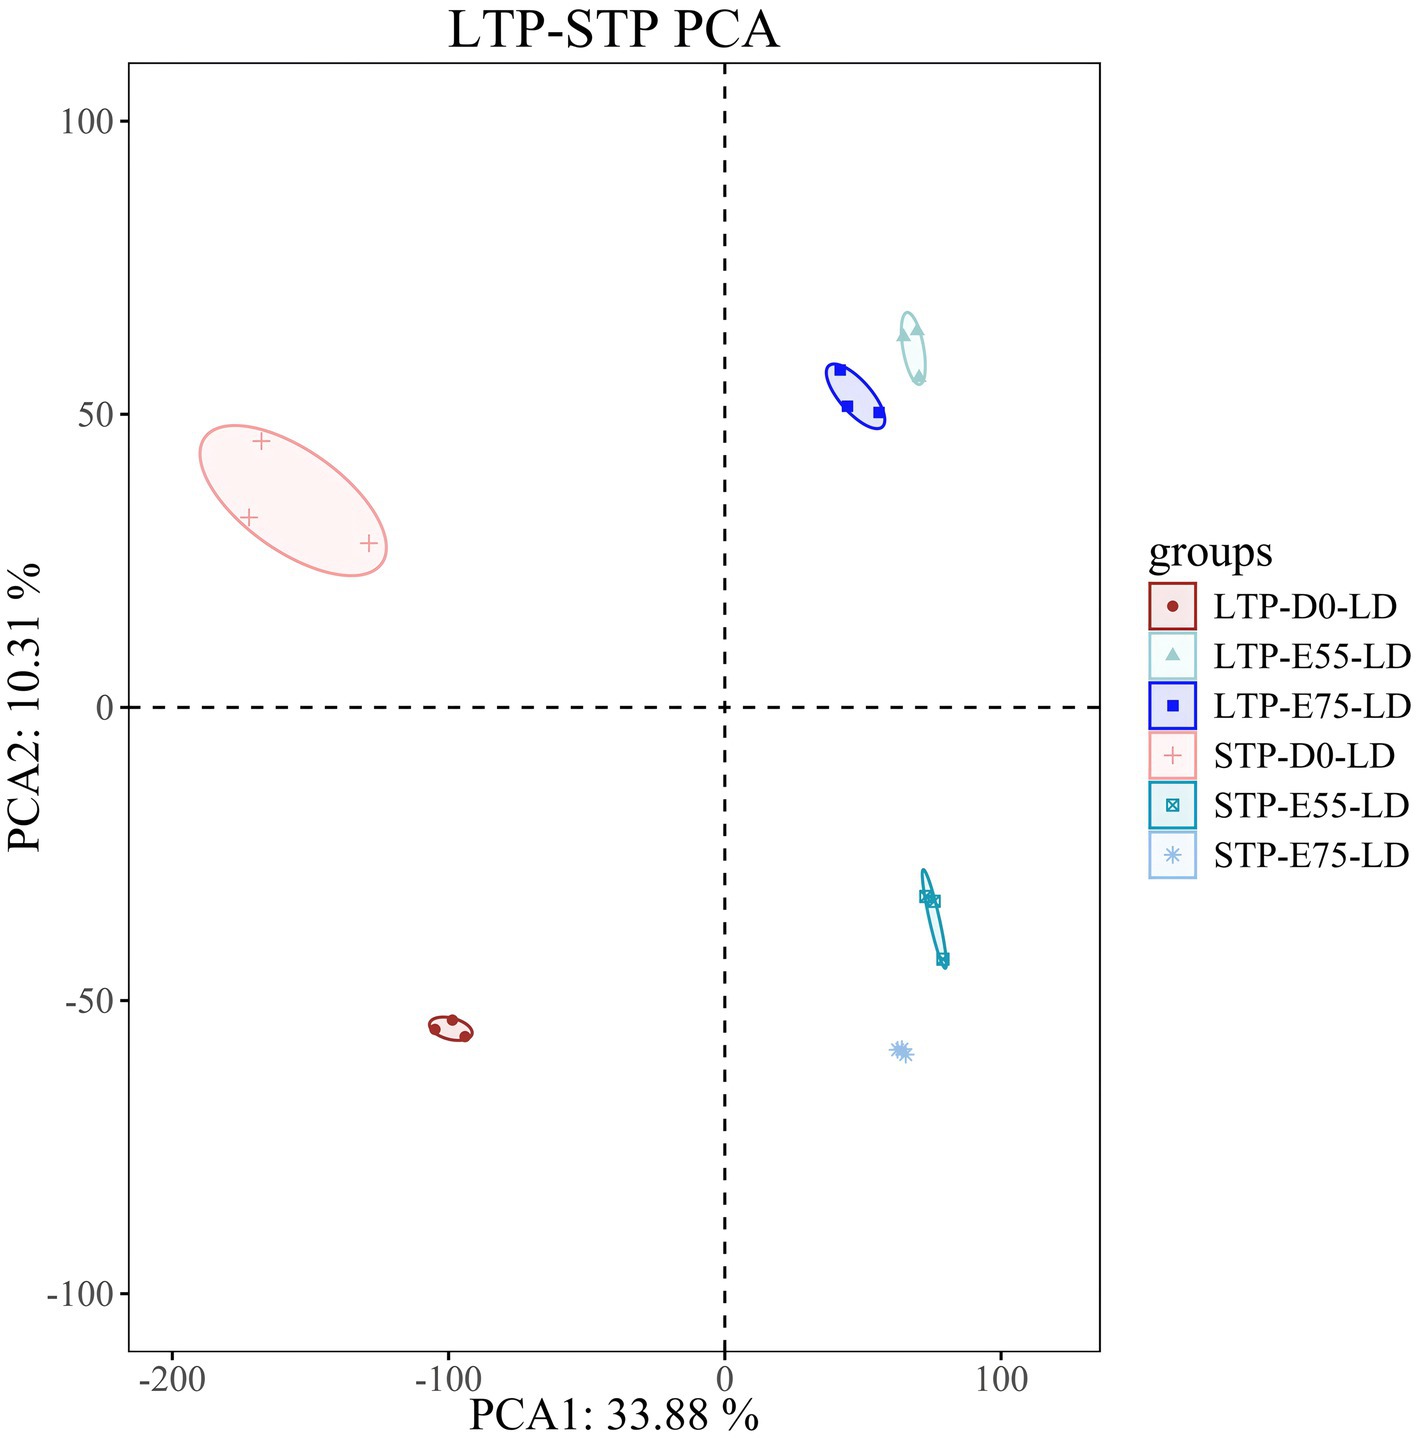
Figure 1. PCA plot of LTP and STP. Each dot color represents a different time point and each dot represents an individual pig.
3.2 DEGs regulating the LD muscle development
During the critical developmental window from E55 to D0, the number of secondary myofibers formed in pigs directly determines postnatal meat yield. To identify functional genes regulating secondary myofiber formation and development, we performed longitudinal analysis of DEGs across developmental stages and identified consistently dynamically expressed candidates with relevant biological functions. In the LD muscle of LTP, across the different age groups, we identified 53 DEGs in the comparison of E75 vs. E55, 3,302 DEGs in D0 vs. E75, and 3,896 DEGs in D0 vs. E55 comparison (Figures 2A–C). A total of 21 DEGs were identified as shared among these three comparisons (Figure 2D; Supplementary Table S2). GO enrichment analysis revealed that these genes are significantly involved in key biological processes related to muscle growth and development (Figure 3A), including regulation of cytoskeleton organization (CAPN6, STMN1), troponin complex (TNNT1), and regulation of muscle contraction (ATP2A1). As shown in Figure 3B, the expression patterns of these genes across developmental stages exhibited distinct temporal dynamics: ATP2A1 expression gradually increased over time, whereas STMN1 and CAPN6 showed progressive downregulation throughout development. In contrast, TNNT1 expression displayed a biphasic trend, initially decreasing followed by a subsequent increase.
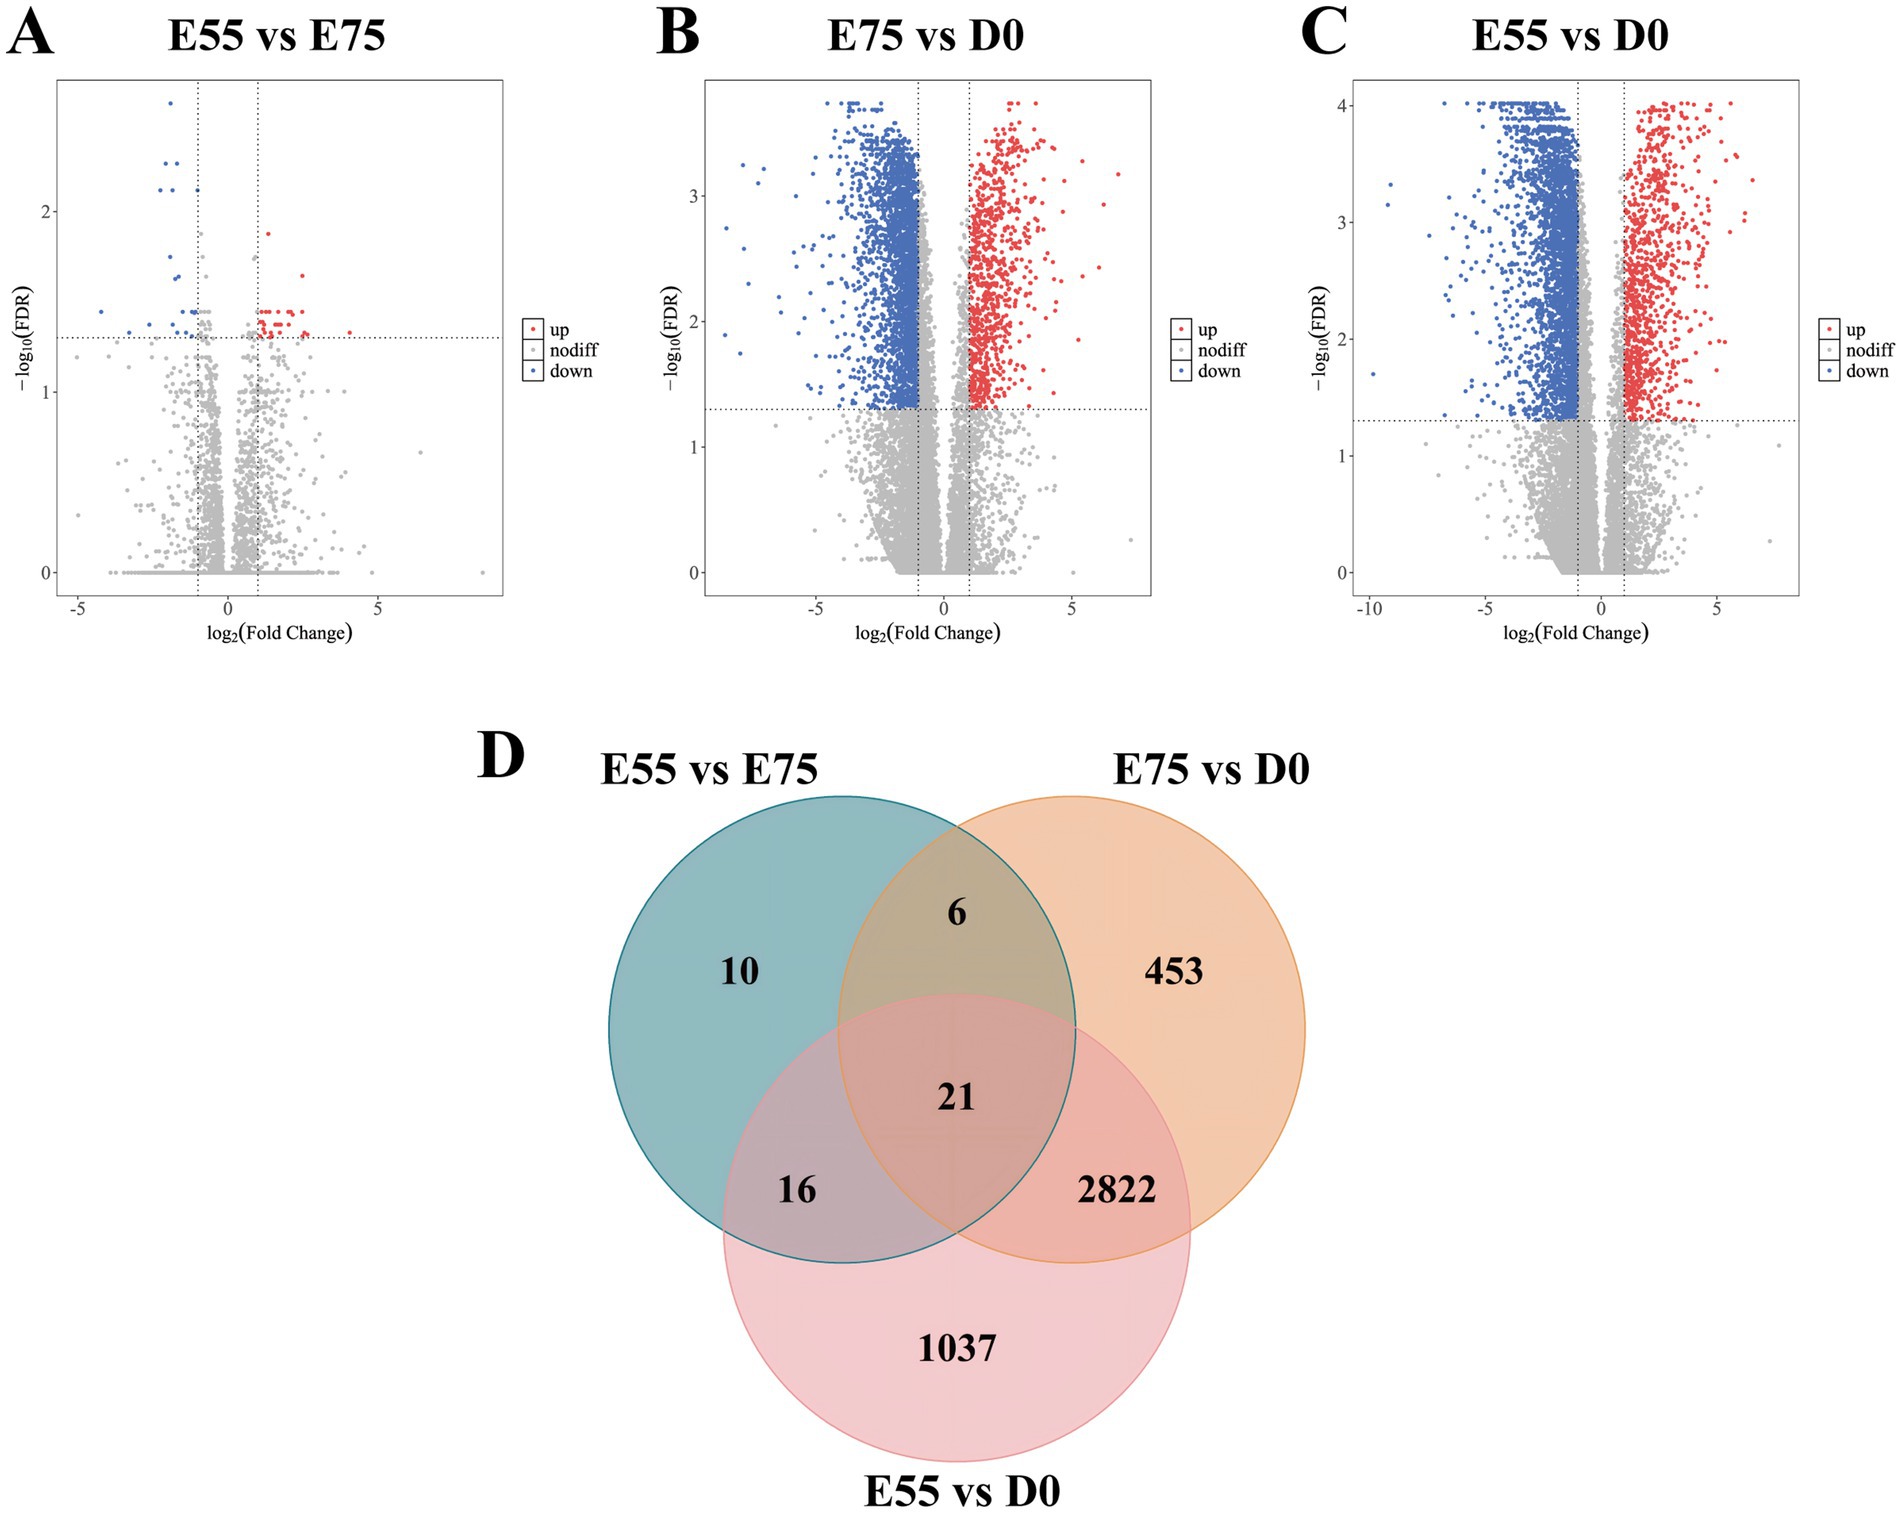
Figure 2. DEGs at three different developmental stages in LTP. (A) Volcano map of DEGs between E55 and E75. (B) Volcano map of DEGs between E75 and D0. (C) Volcano map of DEGs between E55 and D0. (D) Venn maps of DEGs at three different developmental stages in LTP. Each dot represents a gene, red dots represent genes up-regulated, blue dots represent genes down-regulated, and gray dots represent genes with non-significant differences. The sum of the numbers in each large circle represents the total number of DEGs expressed in the group, and the overlapping parts of the circles represent DEGs shared between groups.
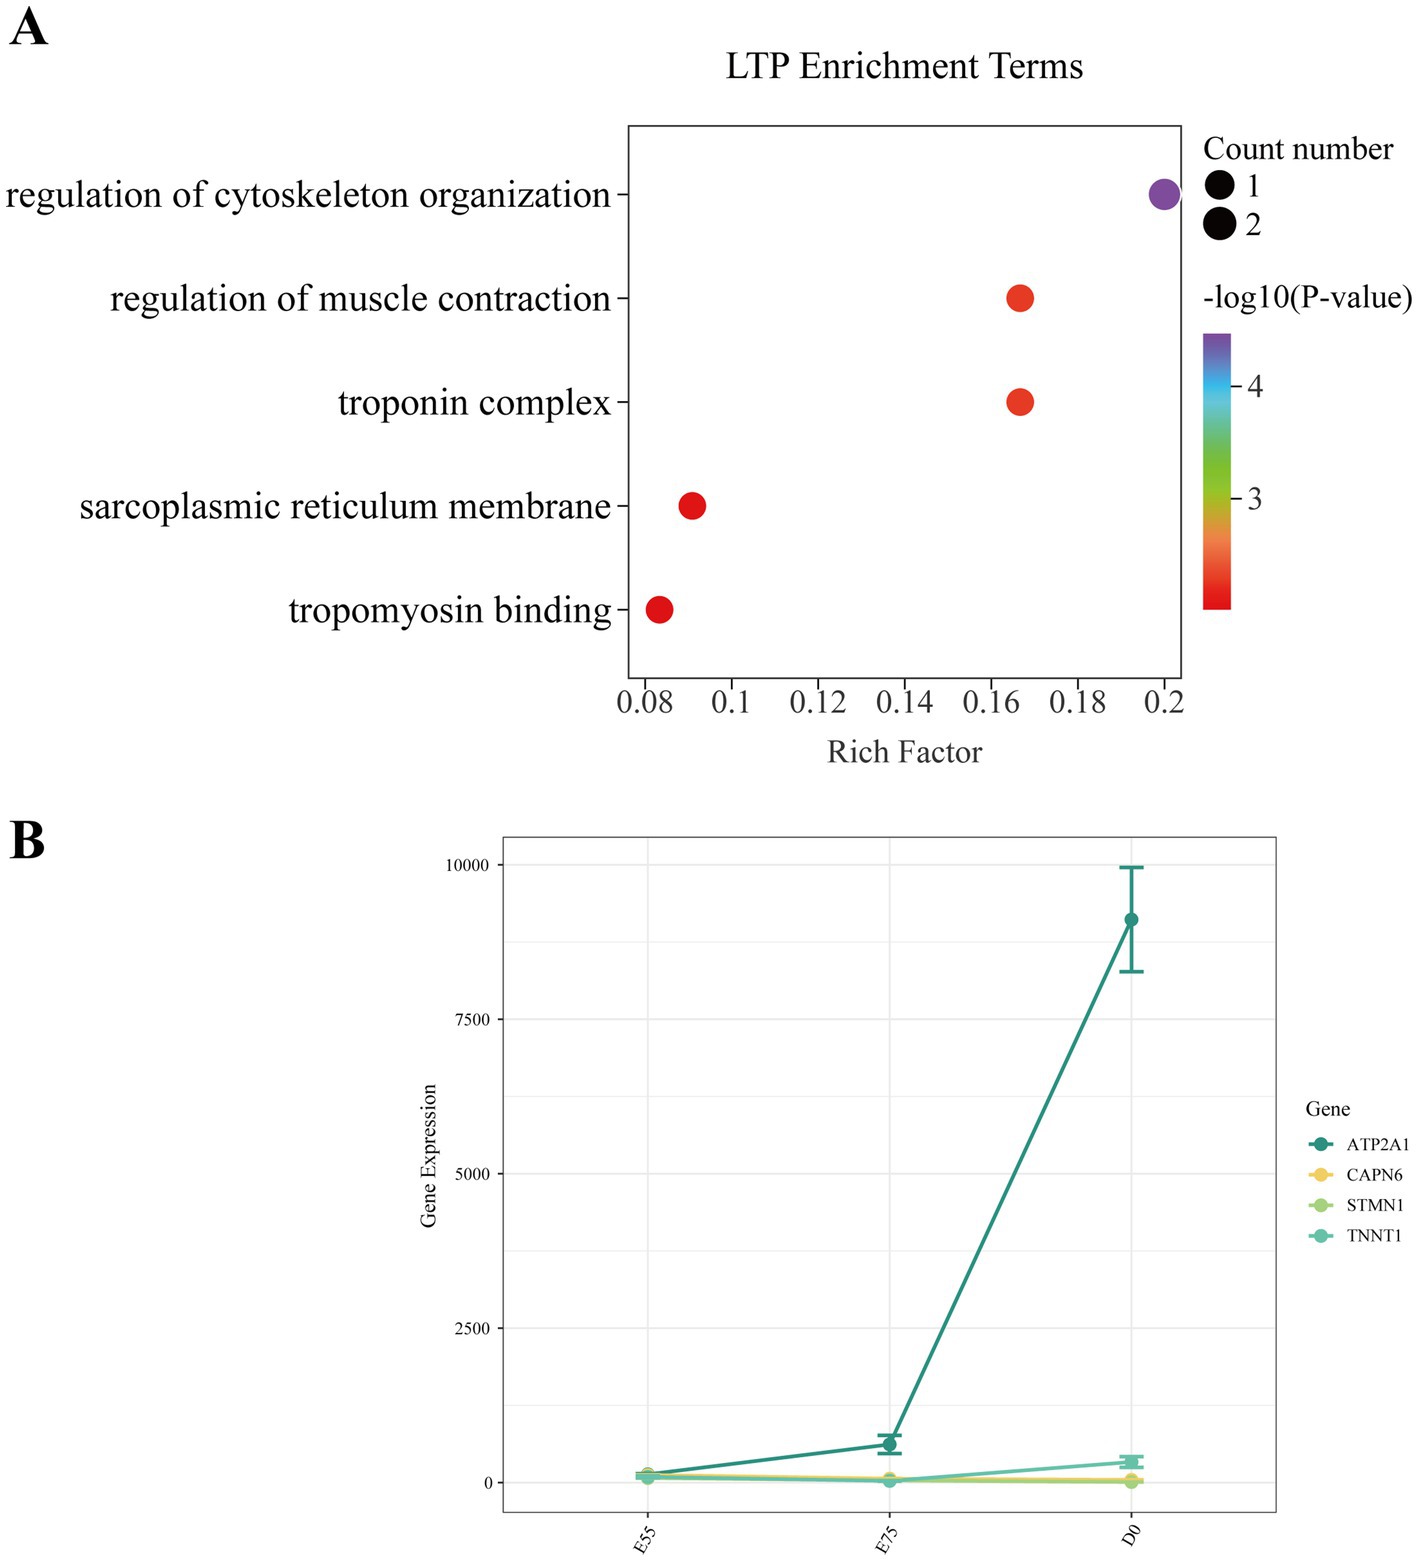
Figure 3. Expression changes of key pathway genes in LTP during development. (A) GO enrichment analysis of DEGs shared among the three comparisons. (B) Expression changes of key pathway genes during development.
In STP, we identified 365 DEGs in the comparison of E75 vs. E55, 5,401 DEGs in D0 vs. E75, and 5,583 DEGs in D0 vs. E55 comparison (Figures 4A–C). A total of 155 DEGs were identified as shared among these three comparisons (Figure 4D; Supplementary Table S2). GO enrichment analysis revealed that these genes are significantly involved in key biological processes related to cell division, including the mitotic spindle (CDK1, SKA3, ESPL1, KIF11, GEM, and KIFC1), mitotic cytokinesis (STMN1, ANLN, KIF4A, CIT, CKAP2, and KIF20A), and mitotic cell cycle checkpoint (ZWINT, WEE1, and CHEK1) (Figure 5A). Expression profiling across developmental stages demonstrated distinct temporal dynamics for these genes (Figure 5B): while GEM exhibited a biphasic expression pattern characterized by an initial increase followed by a decrease, all other DEGs showed progressive downregulation throughout development. In addition to these genes, we observed a gradual decrease in MYF5 expression, whereas MEF2C and TNNT1 displayed progressive upregulation over time (Figure 5C).
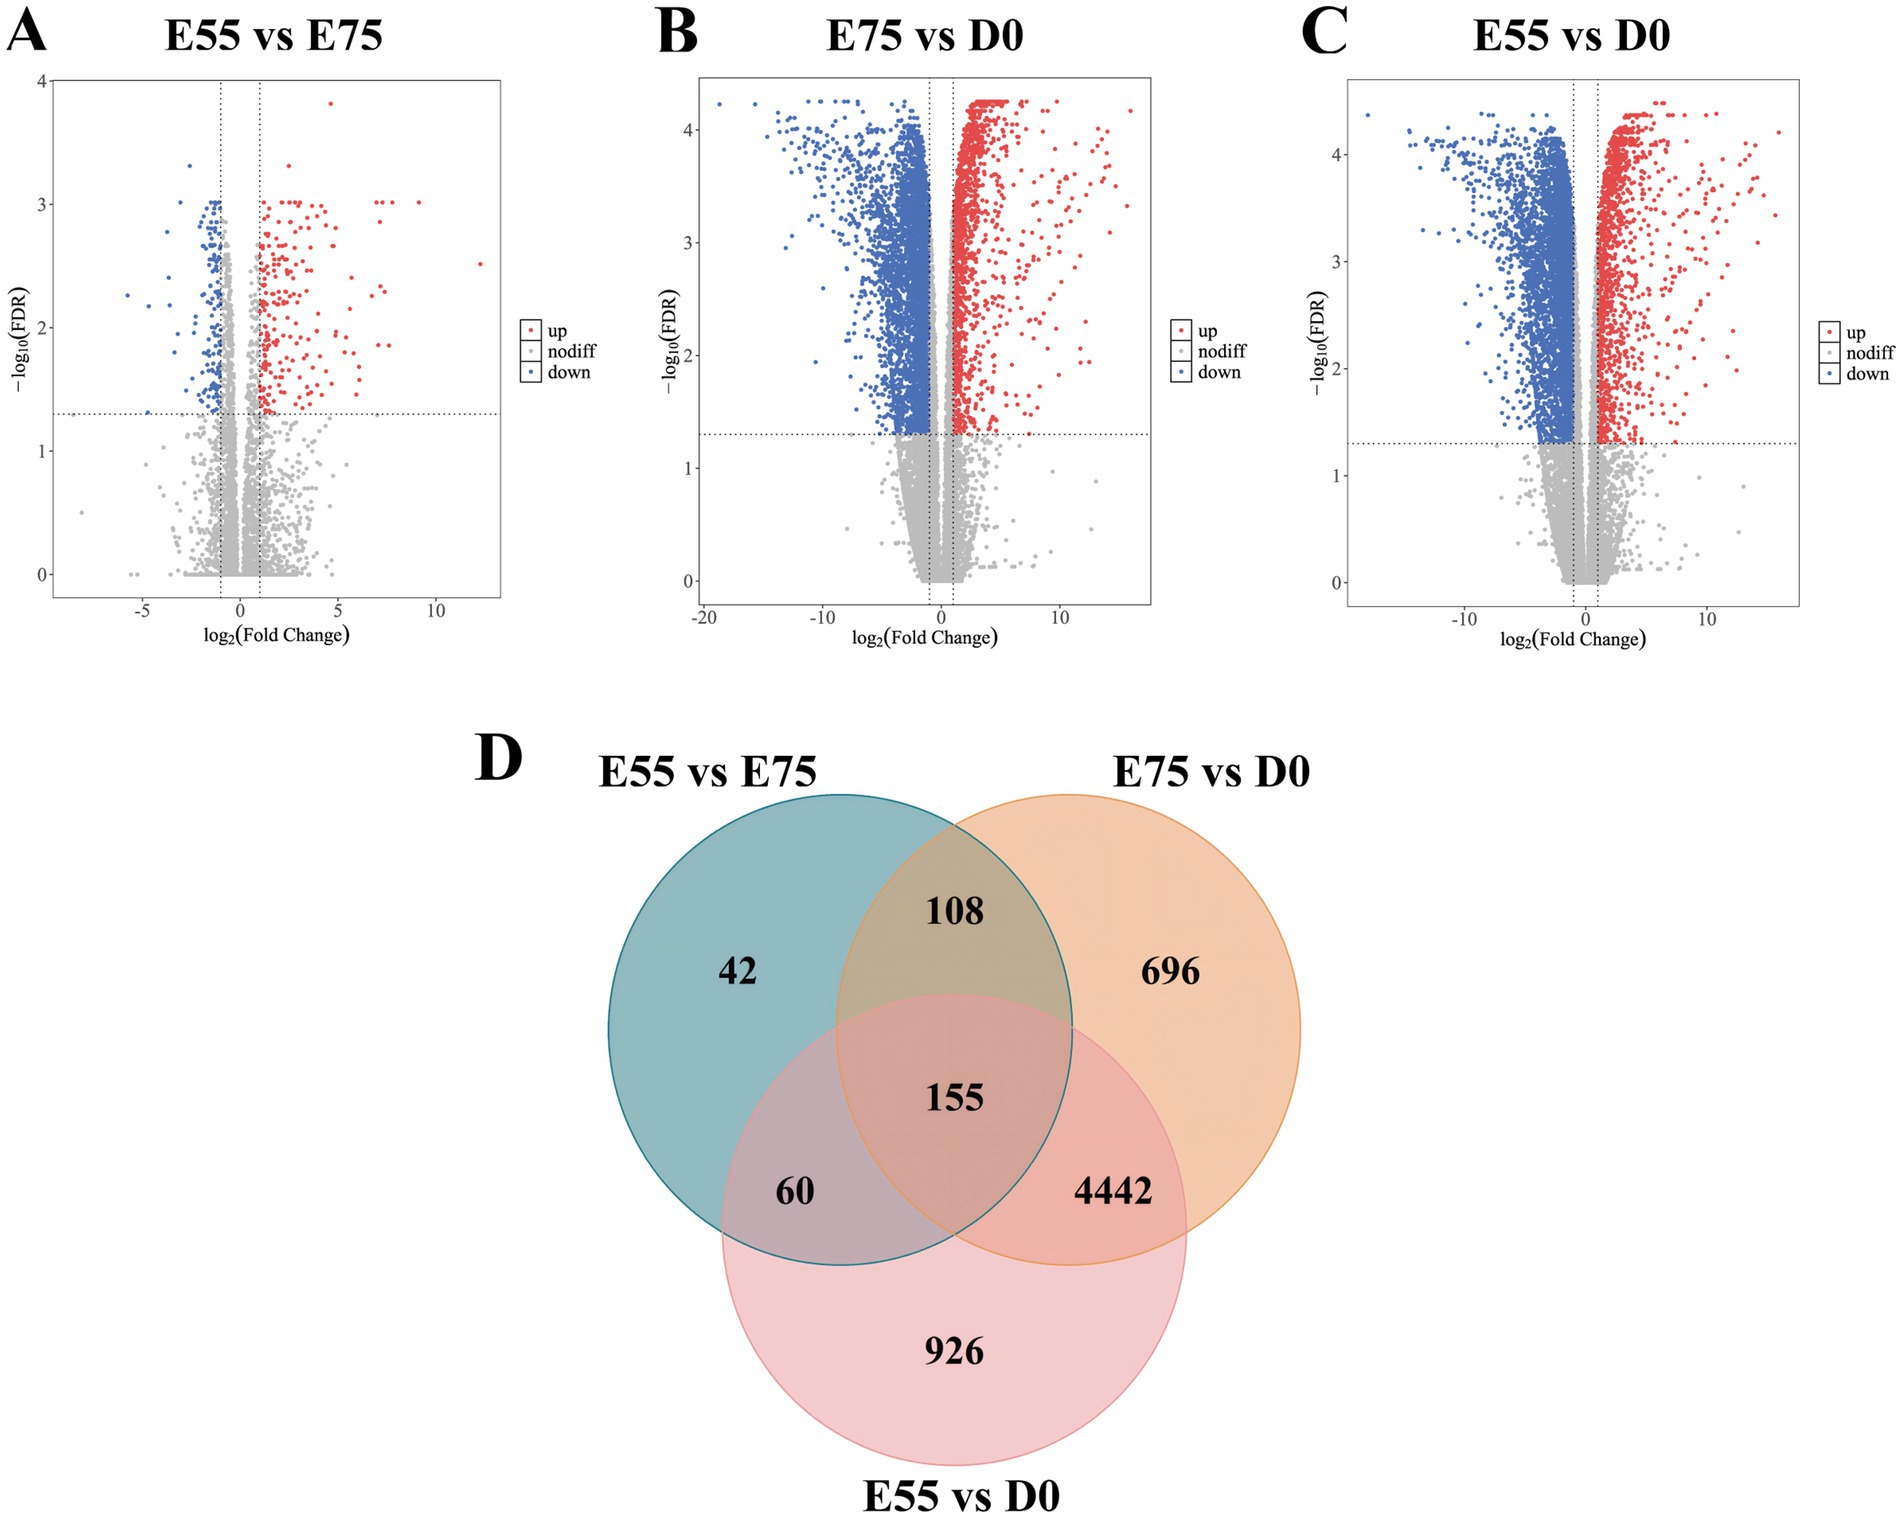
Figure 4. DEGs at three different developmental stages in STP. (A) Volcano map of DEGs between E55 and E75. (B) Volcano map of DEGs between E75 and D0. (C) Volcano map of DEGs between E55 and D0. (D) Venn maps of the number of DEGs at three different developmental stages in STP.
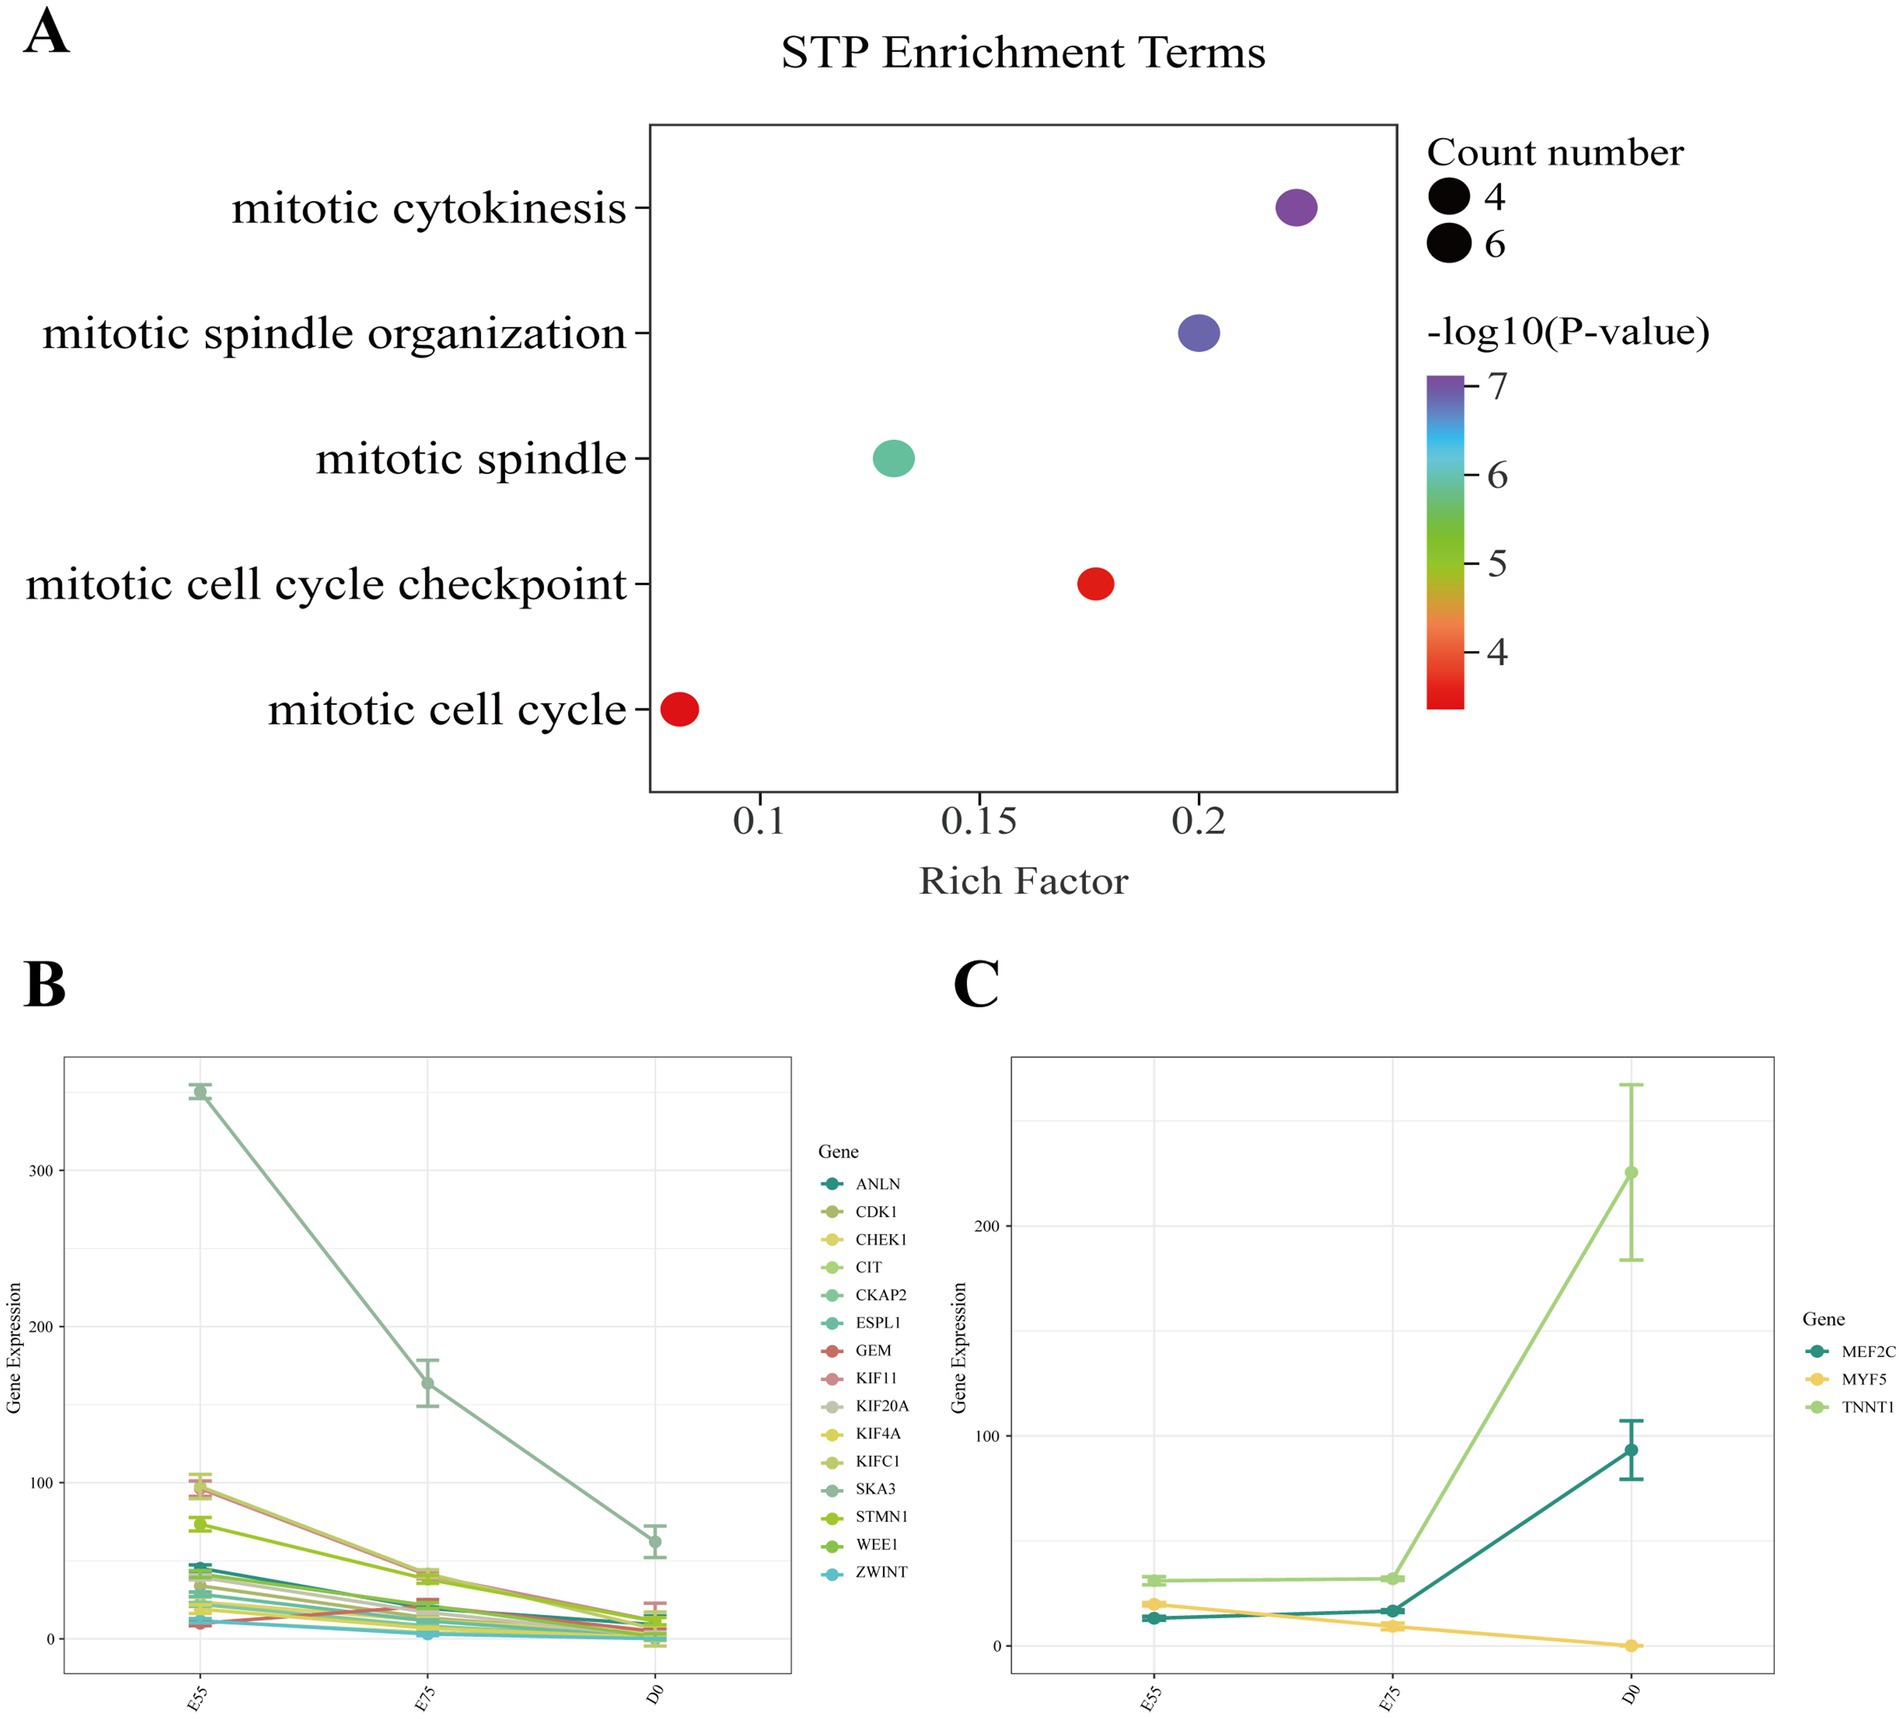
Figure 5. Expression changes of key pathway genes in STP during development. (A) GO enrichment analysis of DEGs shared among the three comparisons. (B) Expression changes of key pathway genes during development. (C) Expression changes of other key genes during development.
3.3 Gene co-expression networks across three developmental stages in LTP
3.3.1 Co-expression modules associations with three developmental stages of LTP
Compared to STP, LTP demonstrated significantly enhanced postnatal growth rates and superior meat production. To identify genes strongly associated with the three key developmental stages in LTP, we conducted WGCNA we performed WGCNA using both breed and developmental time as phenotypic traits. Based on the gene expression data from the LD muscle across three developmental stages of LTP and STP, a filtered gene expression matrix comprising 8,958 genes was obtained. As illustrated in Figure 6A, the optimal soft-thresholding power (β = 9) was selected to construct an approximately scale-free topological overlap matrix. As shown in Figure 6B, the genes were clustered into 23 distinct co-expression modules. Among these, the darkred module contained the largest number of genes (961 genes), while the orange module had the fewest (55 genes) (Supplementary Table S3).
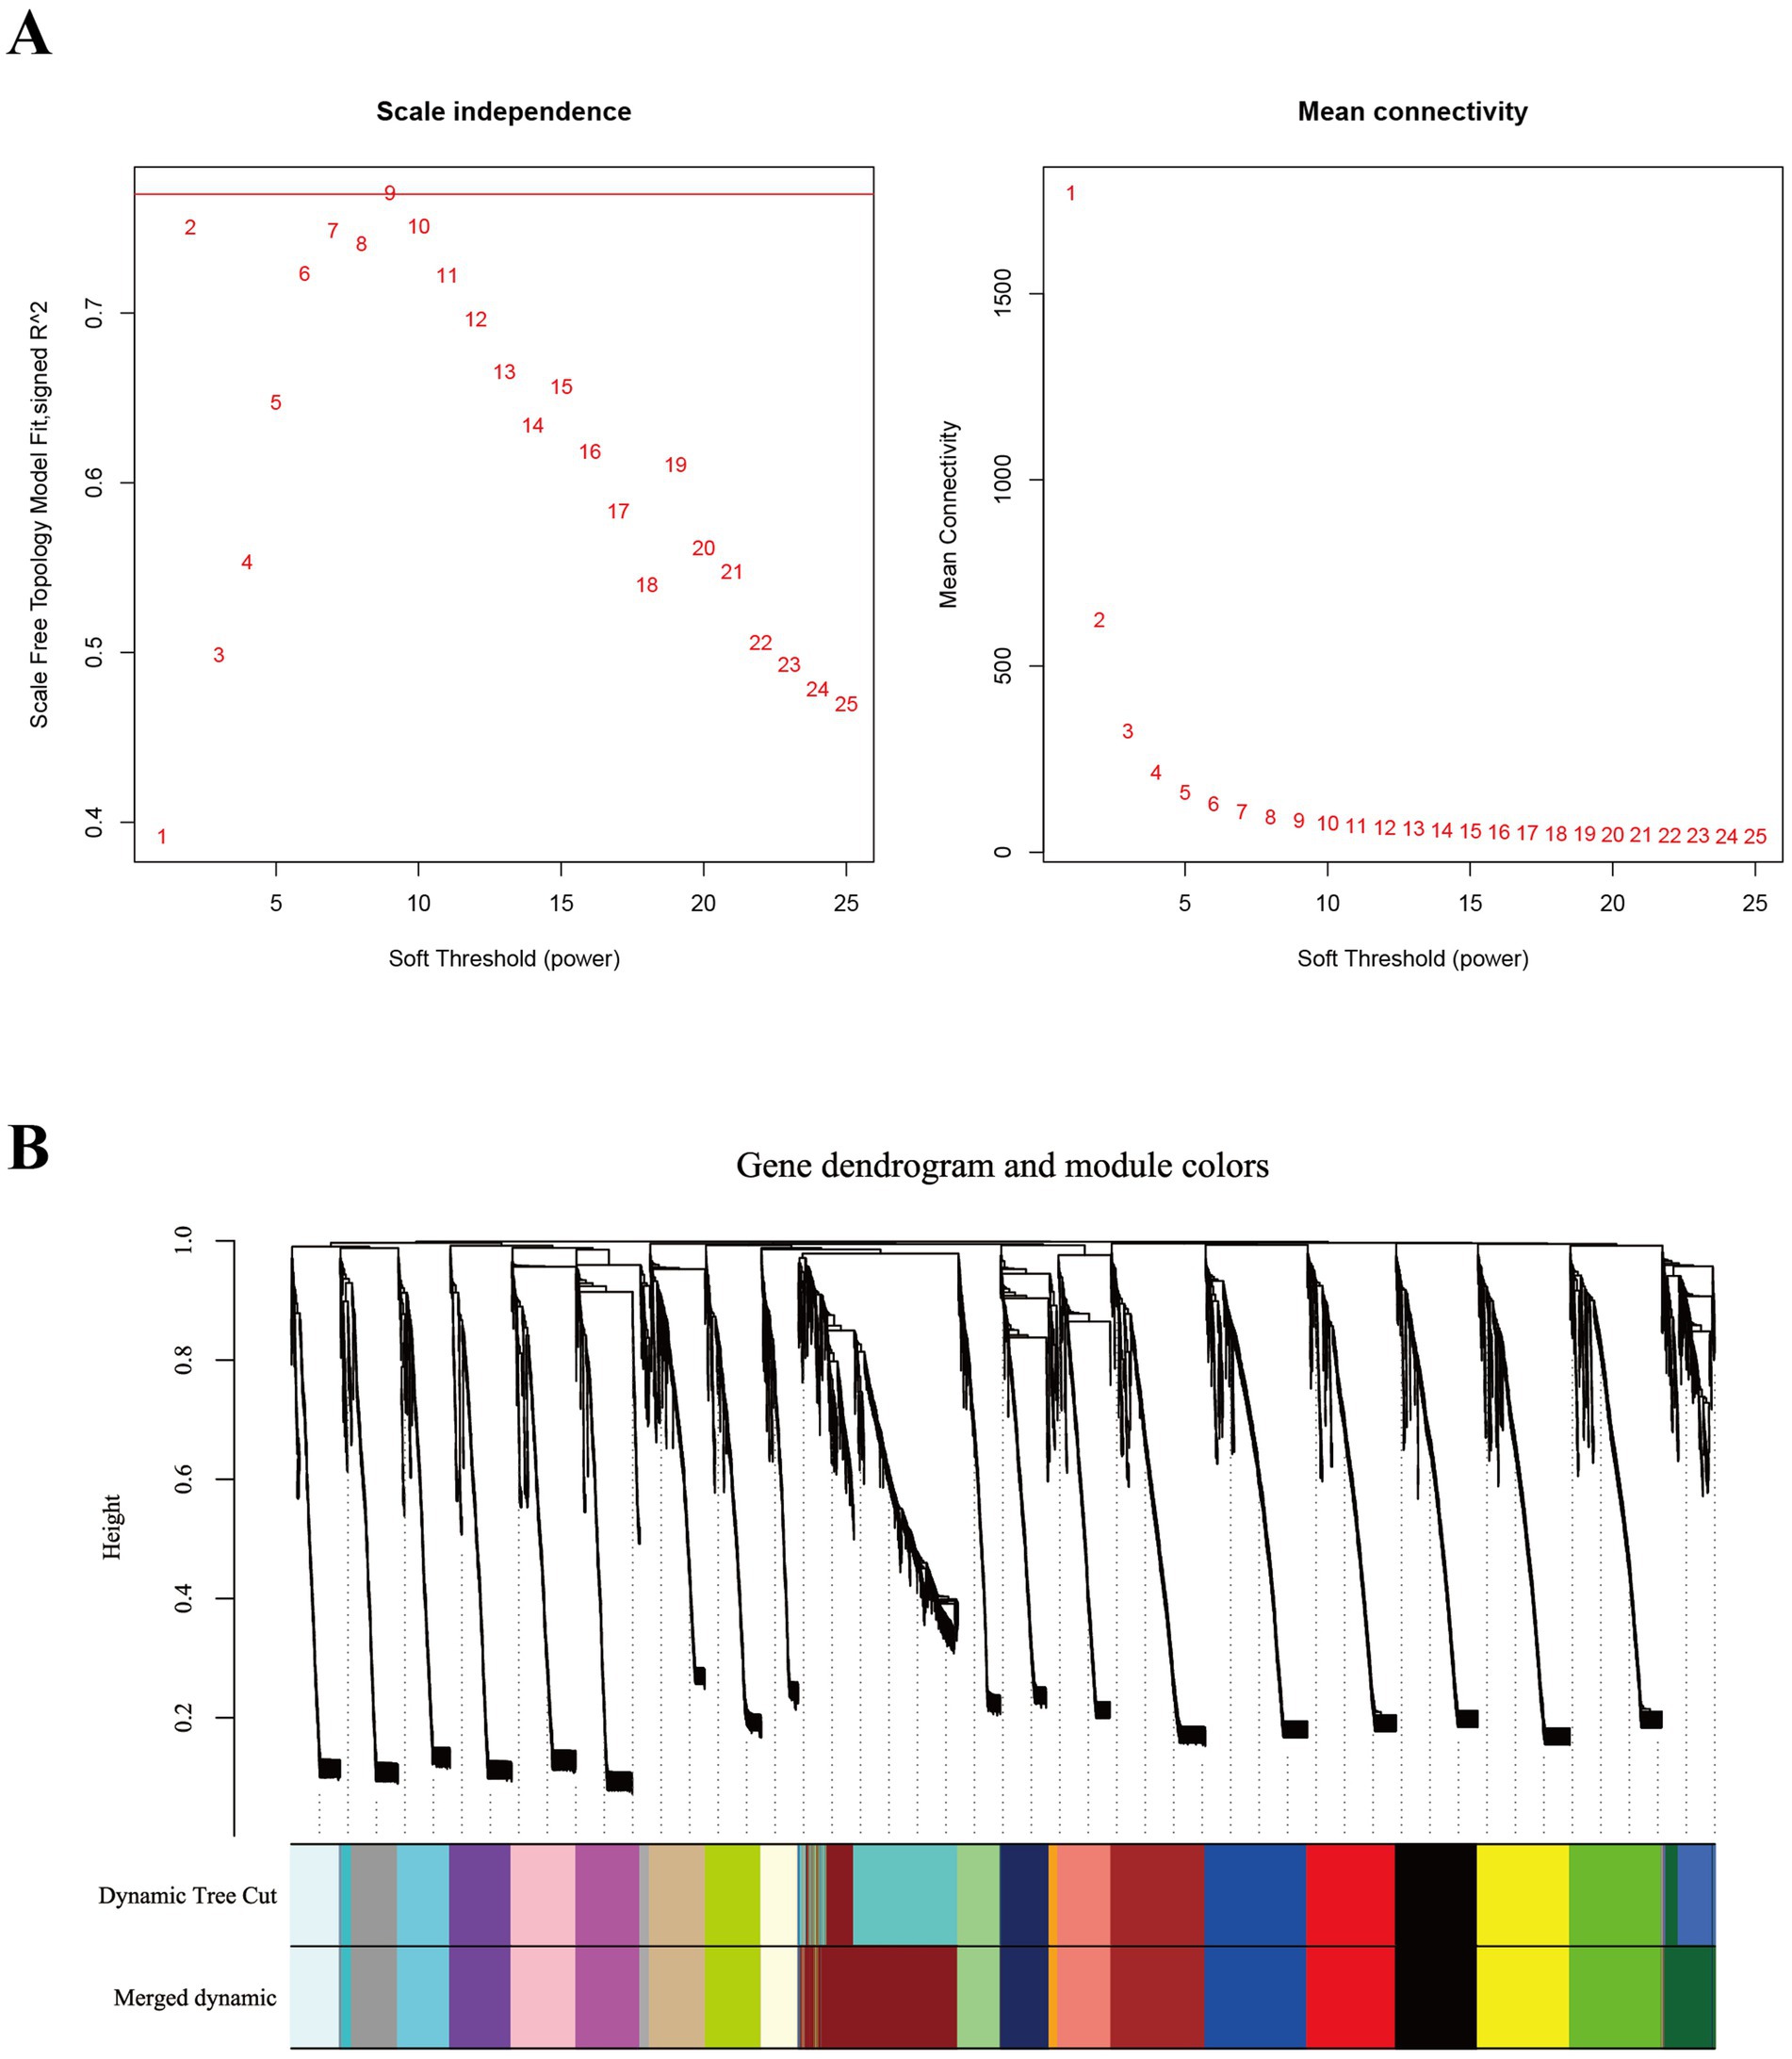
Figure 6. Identification of co-expression modules by WGCNA. (A) The determination of soft thresholding power. (B) The gene clustering dendrogram was obtained according to hierarchic clustering of adjacency based dissimilarity. Each module contains a different gene cluster and is marked with a different color.
As depicted in Figure 7, the module-trait relationships analysis identified four co-expression modules (brown, darkgreen, blue, and red) significantly associated with LTP-E55, encompassing a total of 2,124 genes; four co-expression modules (yellow, black, darkgreen, and green) were found to be significantly correlated with LTP-E75, comprising 1,994 genes; five co-expression modules (tan, salmon, midnightblue, orange, and darkred) showed significant associations with LTP-D0, containing 2,017 genes. All these significant modules exhibited positive correlations with their respective traits, suggesting that the genes within these modules may play crucial roles in muscle development during the E55, E75, and D0 stages of LTP.
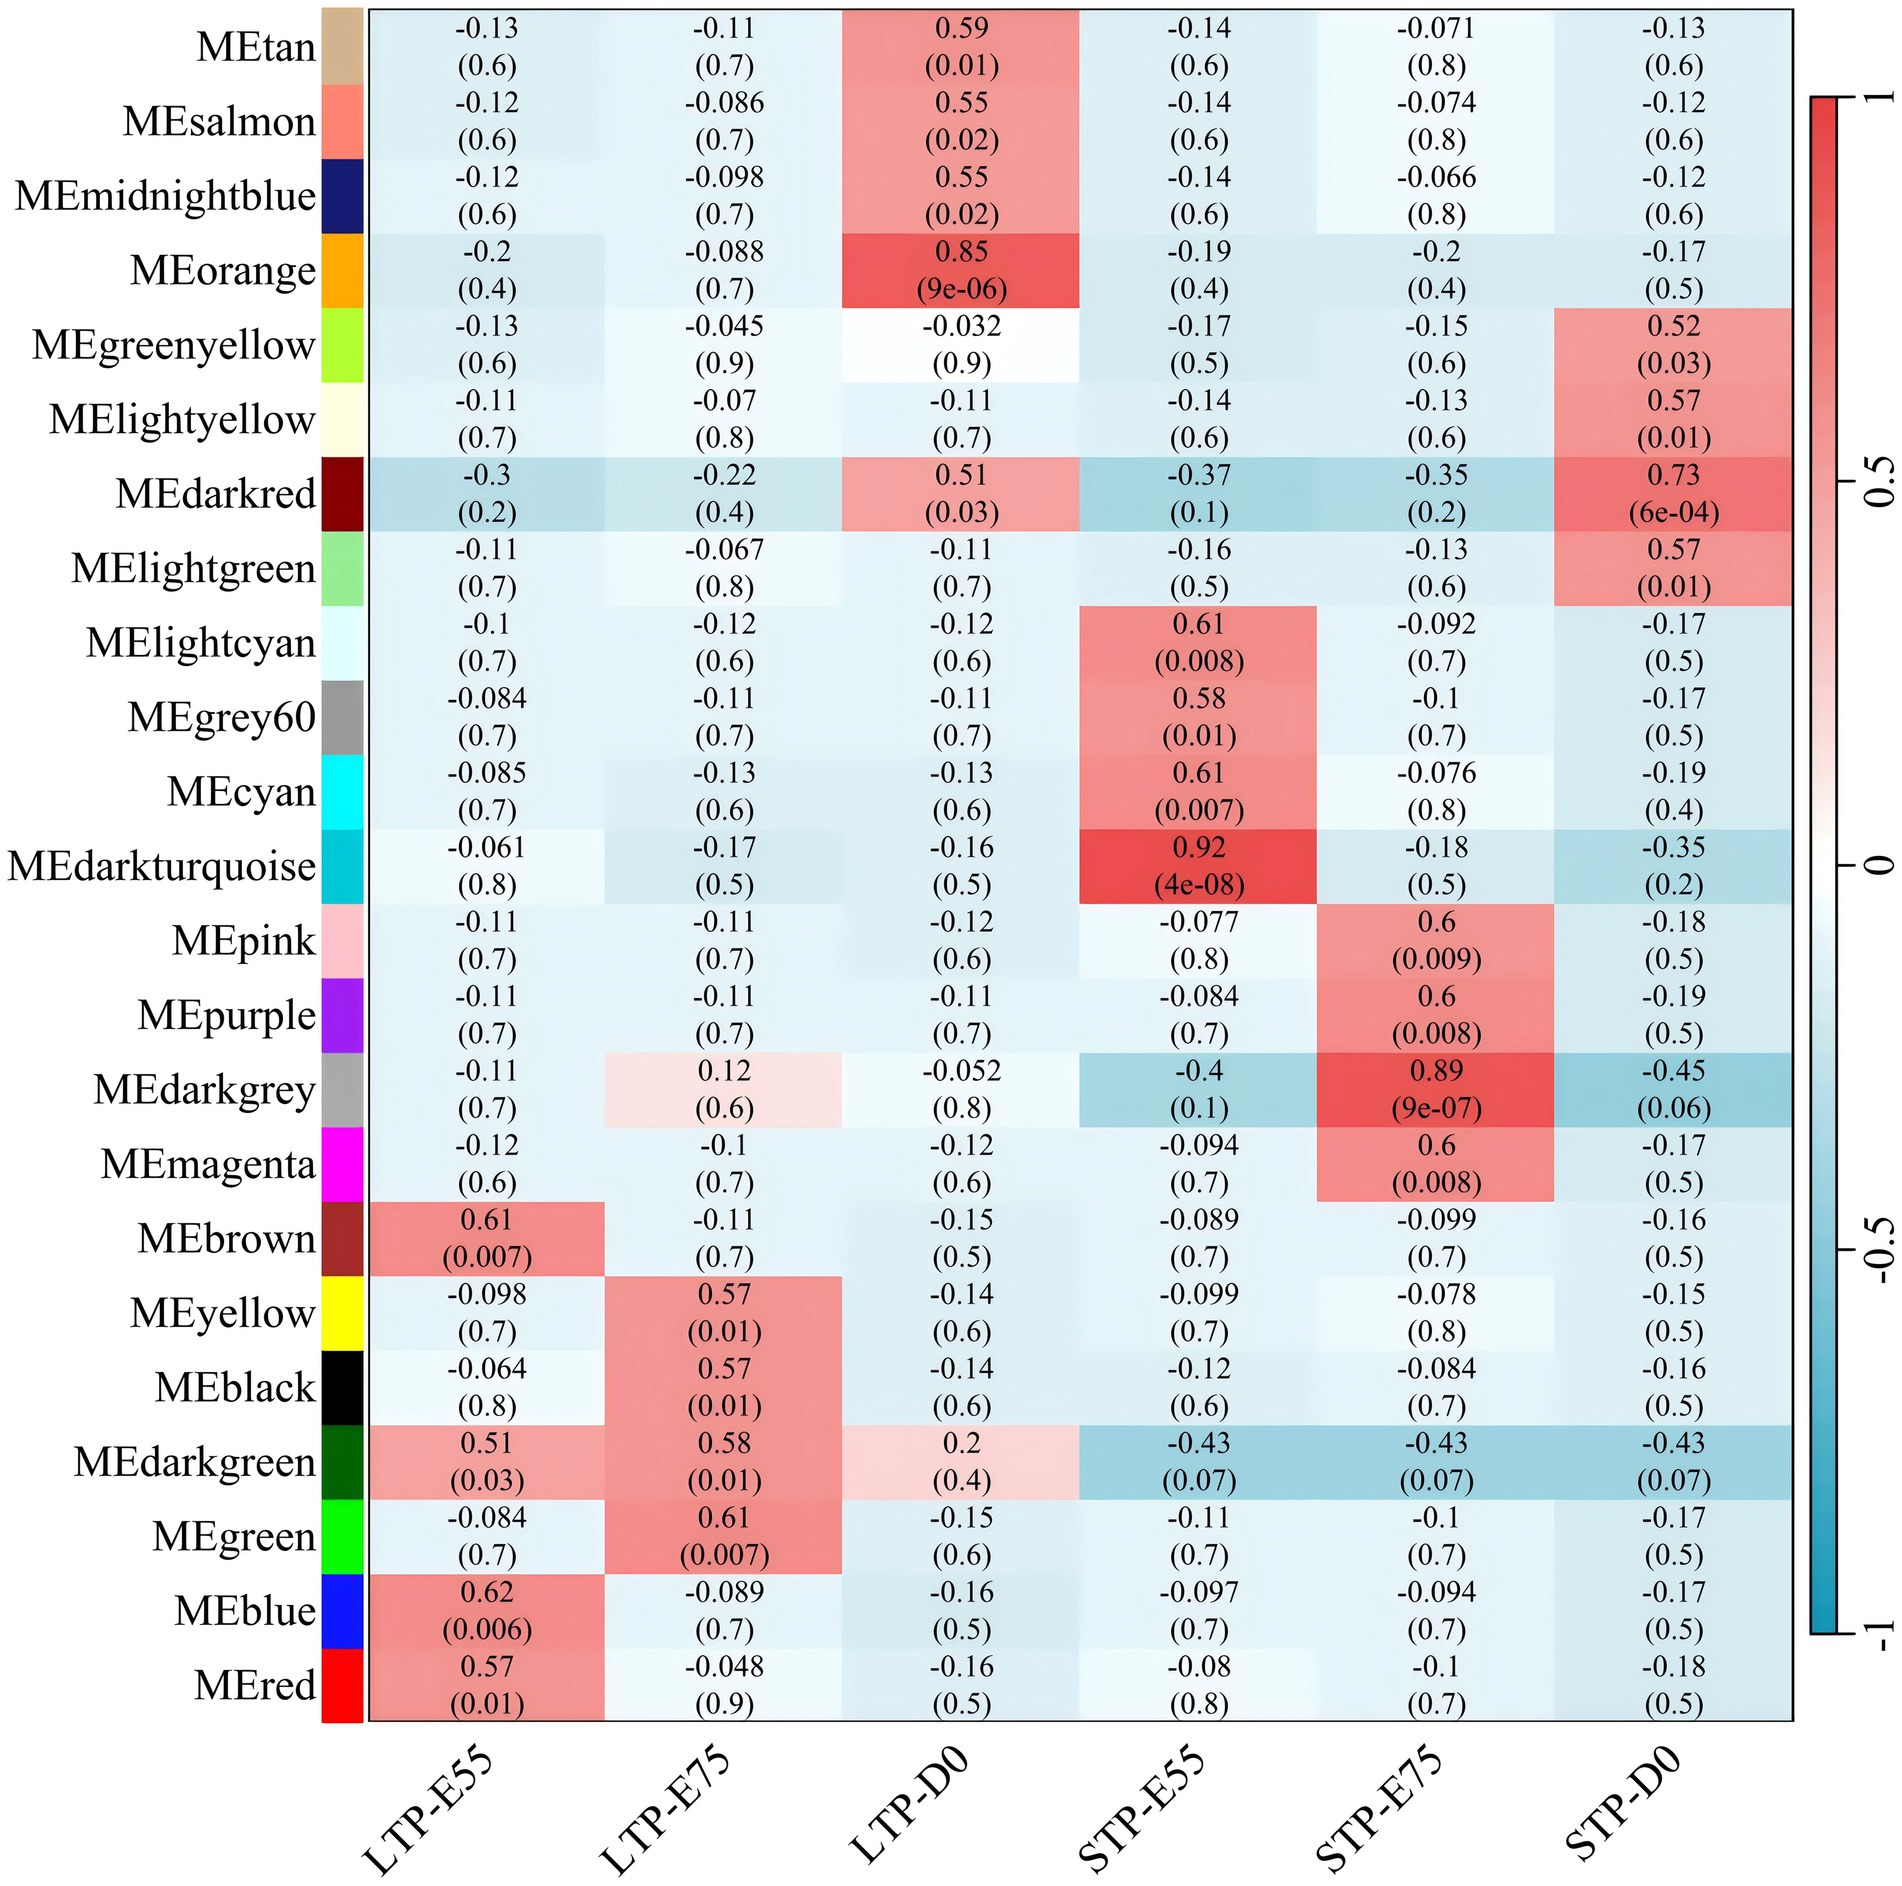
Figure 7. Module-trait relationships in large and small Diqing Tibetan pigs across three developmental stages (E55, E75, and D0). Abscissa is the trait, the ordinate is the module, the number of each grid represents the correlation between the module and the trait, and the number in parentheses represents p-value, red represents positive correlation and green represents negative correlation.
3.3.2 Hub genes significantly positively correlated with three developmental stages of LTP
Higher KME values indicate a stronger gene-module relationship (Supplementary Table S4). A total of 1,103 genes with KME values greater than 0.8 were identified from the modules significantly positively correlated with LTP-E55, with core genes including INS, KNG1, SST, and ACAN. From the modules significantly positively correlated with LTP-E75, 1,047 genes were identified, featuring core genes such as GNAT2, PAX6, and FABP6. Additionally, 1,181 genes were identified from the modules significantly positively correlated with LTP-D0, including core genes like CYC1, UQCRFS1, COX5A, NDUFV1, NDUFA9, NDUFS3, and UQCRC1 (Figures 8A–C).
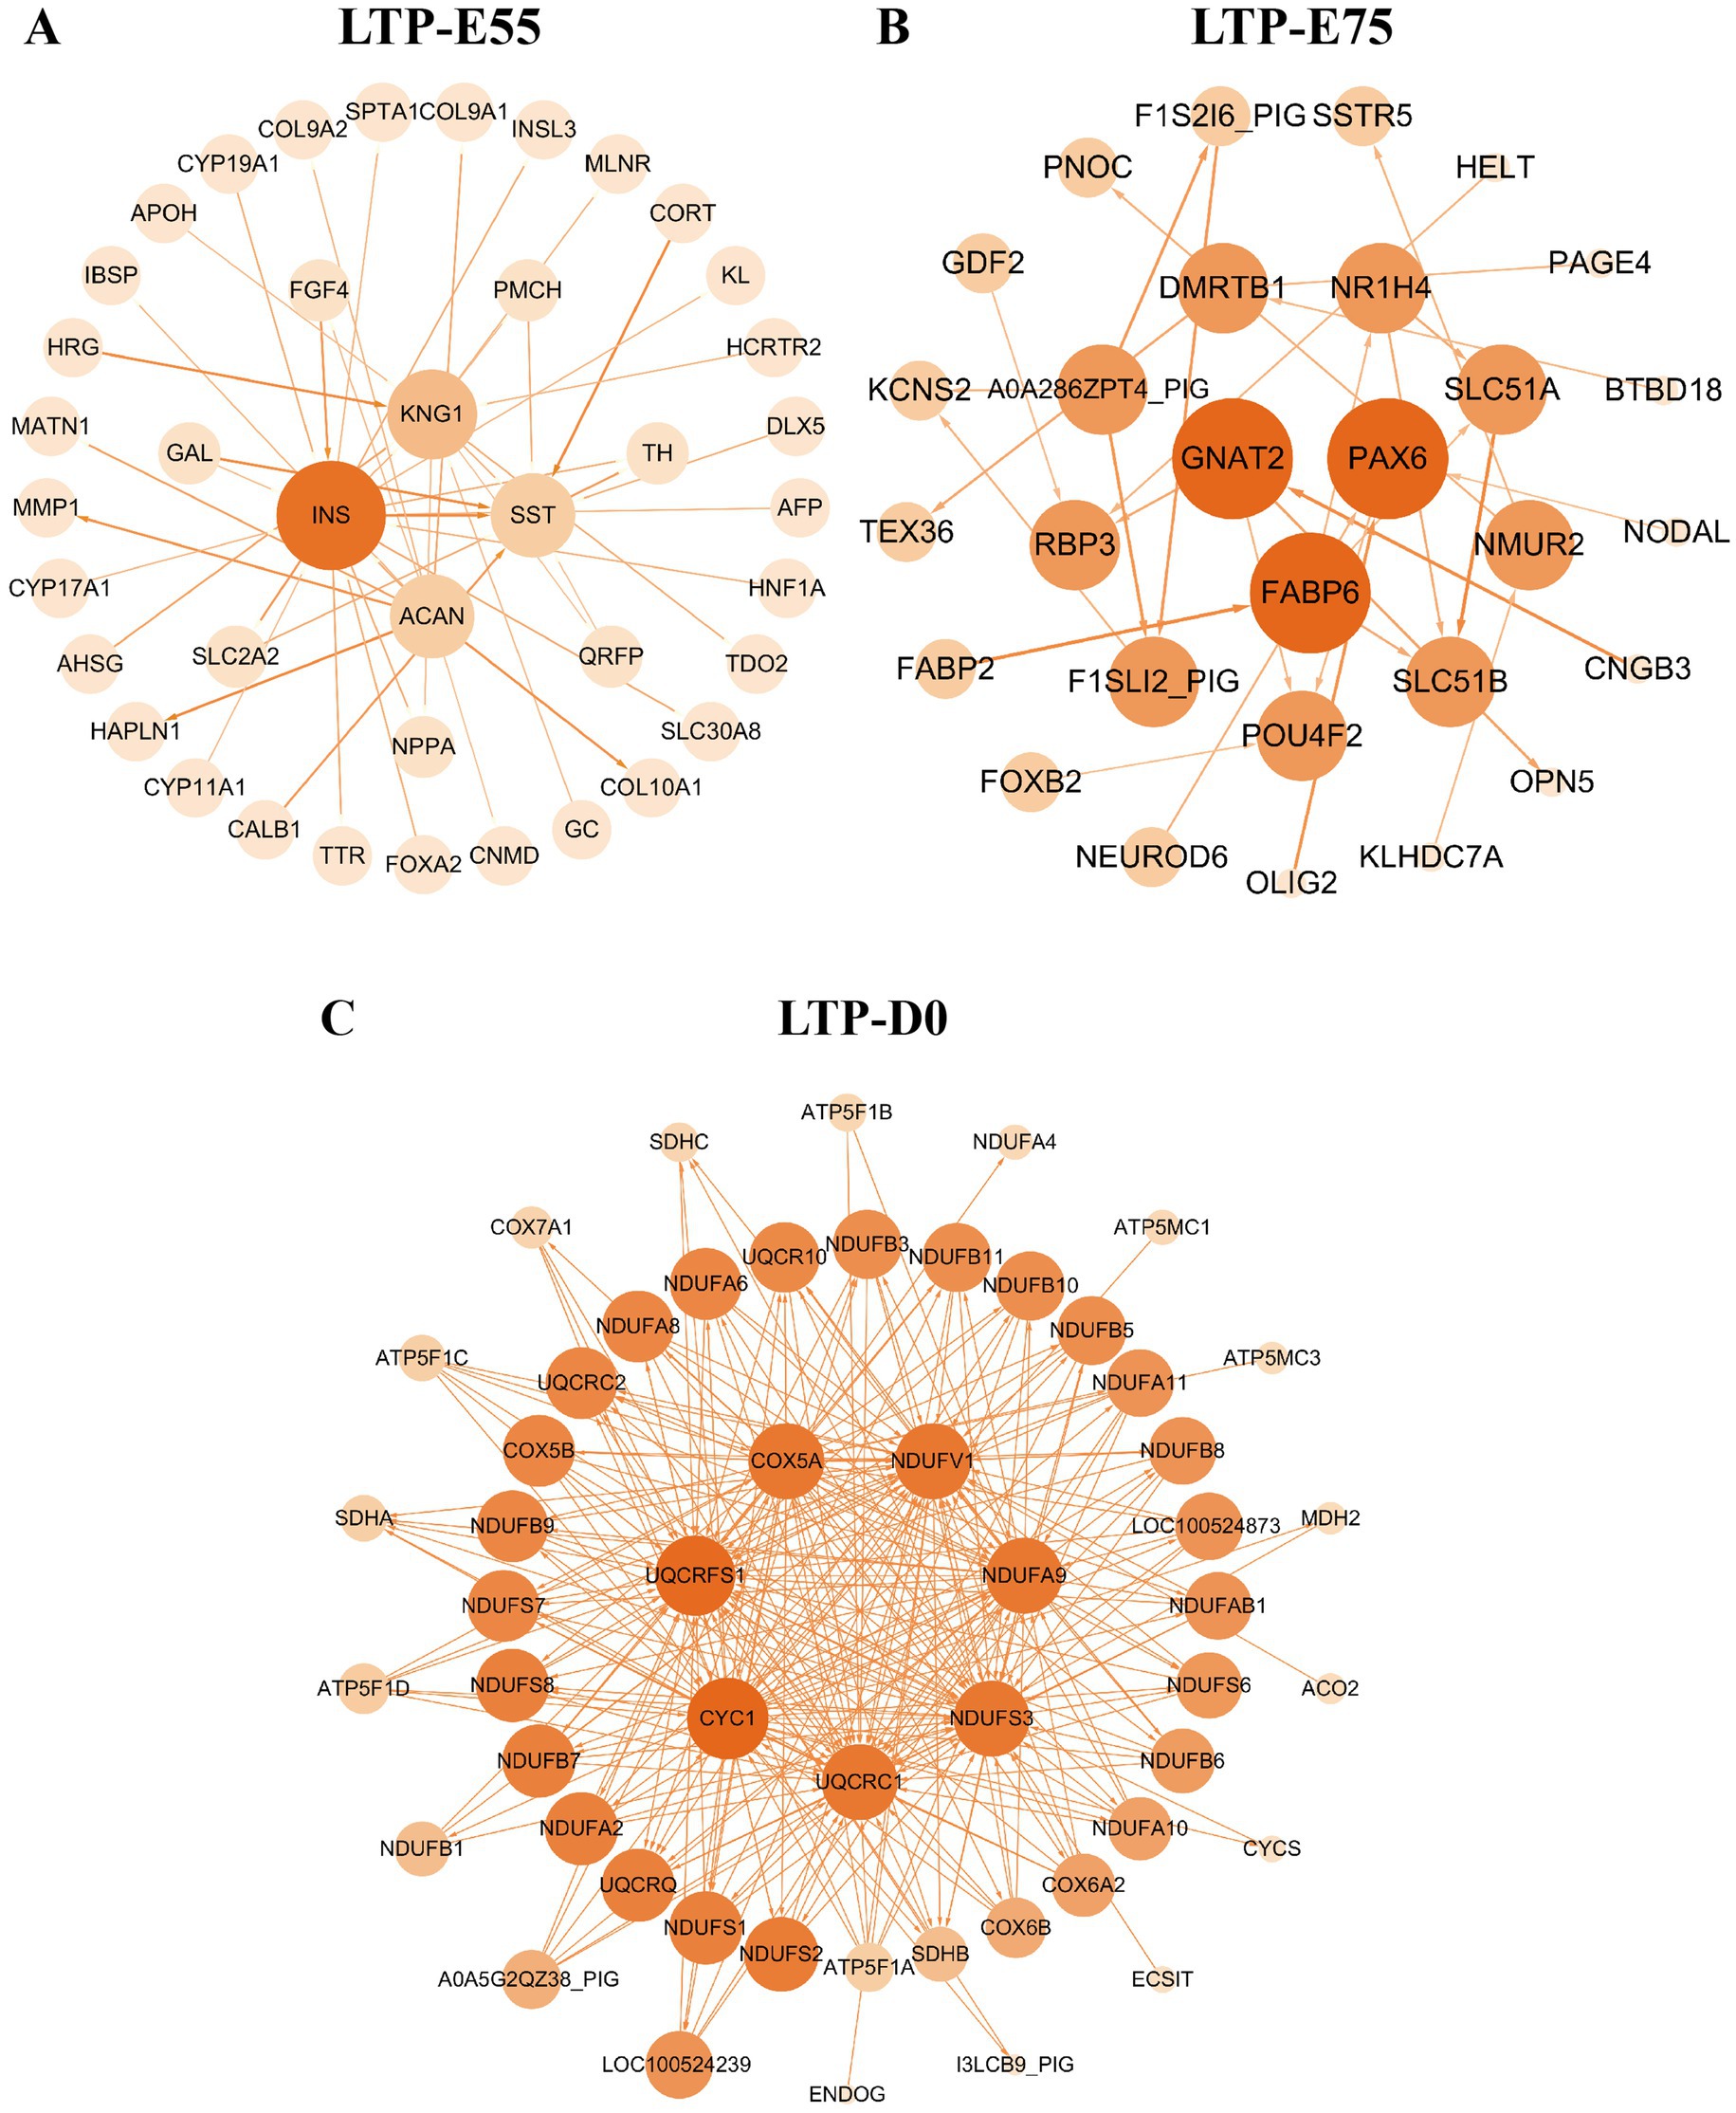
Figure 8. The interaction network of co-expression module genes significantly associated with three developmental stages of large Diqing Tibetan pigs. (A) The interaction network of LTP-E55. (B) The interaction network of LTP-E75. (C) The interaction network of LTP-D0. The intensity of the color corresponds to the degree of regulation.
3.4 Verification of DEGs by real-time quantitative PCR
To validate the RNA-seq results, qPCR was conducted on PDLIM3, CMYA5, ATP2A1, ACACB and CLCN1. As illustrated in Figure 9, the qPCR results displayed trends aligned with the RNA-seq data, thereby confirming the accuracy and reliability of the RNA-seq findings.
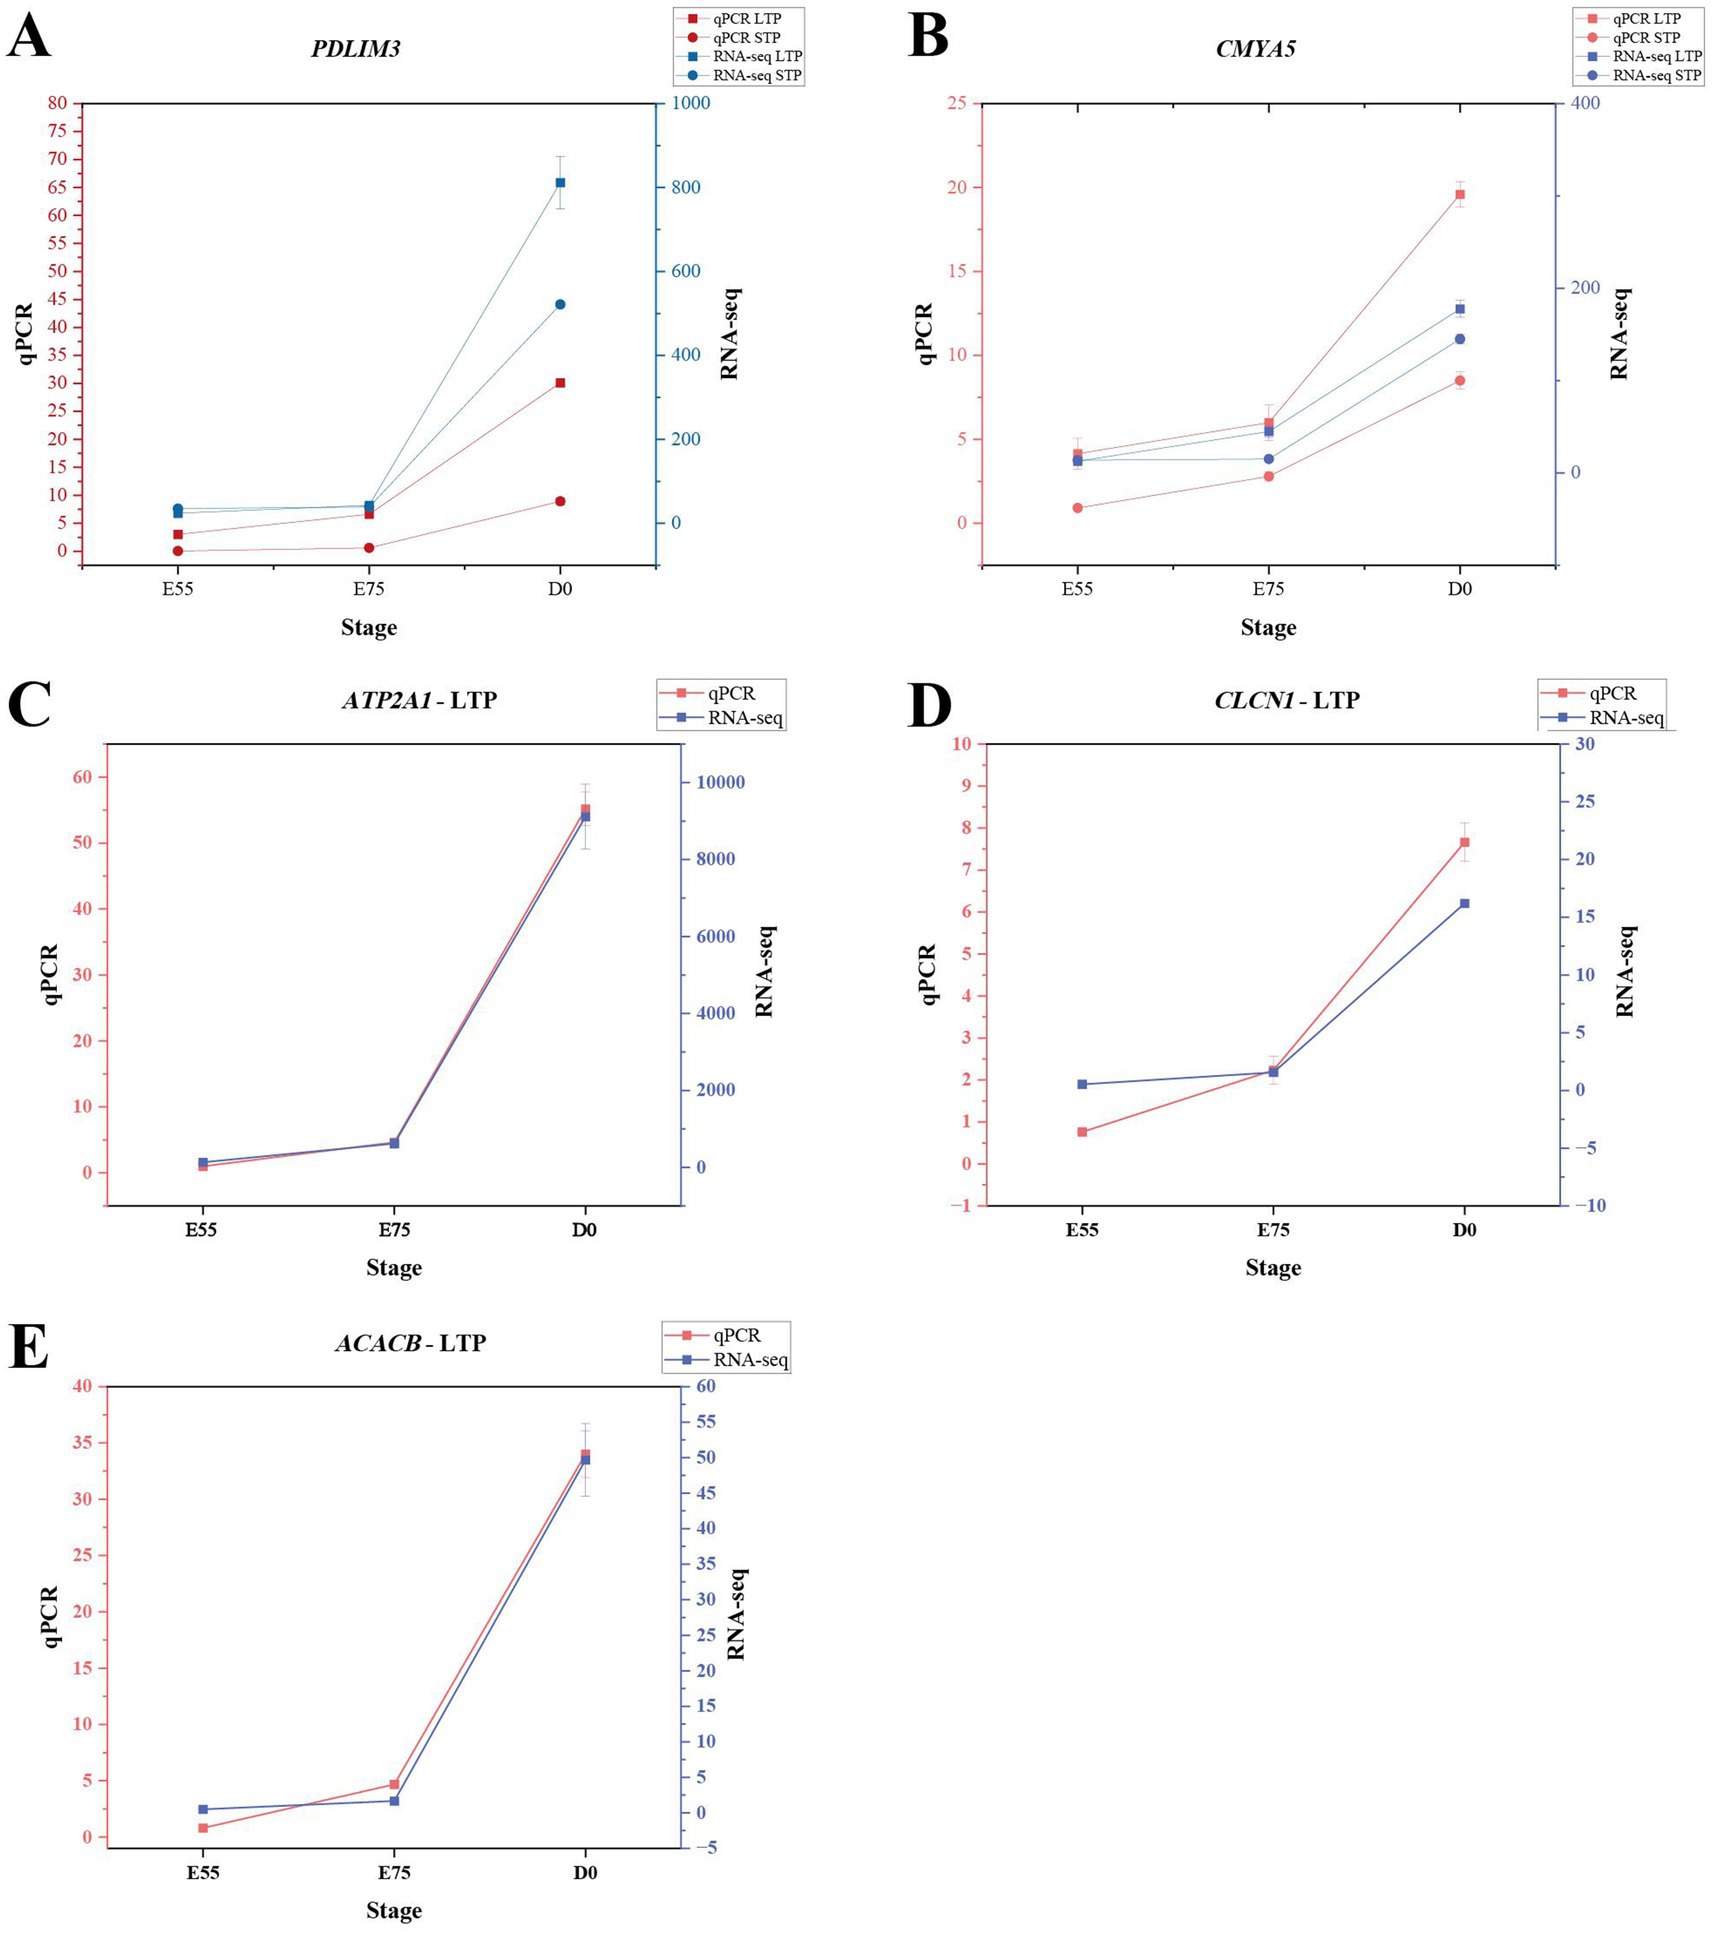
Figure 9. qPCR results of DEGs. (A) qPCR validation of PDLIM3 expression. (B) qPCR validation of CMYA5 expression. (C) qPCR validation of ATP2A1 expression in LTP. (D) qPCR validation of CLCN1 expression in LTP. (E) qPCR validation of ACACB expression in LTP.
4 Discussion
4.1 A coordinated program of CAPN6, STMN1, and ATP2A1 expression enhances secondary myofiber formation in LTP
In myoblasts, overexpression of CAPN6 (Calpain 6) suppresses autophagy and inhibits myoblast differentiation and regeneration by sustaining mTOR signaling pathway activity (45). During secondary myofiber formation in LTP, numerous myoblasts fuse adjacent to primary myofibers to form new myotubes. The observed downregulation of CAPN6 expression (Figure 3B) may therefore enhance secondary myofiber formation by promoting myoblast differentiation. STMN1 (Stathmin 1), a microtubule-destabilizing protein, has been shown in multiple studies to promote cell proliferation (46, 47). We propose that decreased STMN1 expression (Figure 3B) may drive LTP secondary myofiber formation by reducing myoblast proliferative capacity and facilitating the transition toward differentiation. ATP2A1 (ATPase sarcoplasmic/endoplasmic reticulum Ca2+ transporting 1) is predominantly highly expressed in fast-twitch fibers (Figure 3B) (48, 49). Given that secondary myofibers exhibit fast-twitch characteristics (50), the progressively increasing expression of ATP2A1 in LTP muscle suggests a potential correlation with the expanding population of secondary myofibers.
CDK1 (Cyclin-dependent kinase 1), a core regulator of the cell cycle, promotes myoblast proliferation when highly expressed (51, 52). SKA3 (Spindle and kinetochore-associated complex subunit 3) is a microtubule-binding component of the outer kinetochore and plays a critical role in cell division; studies indicate that SKA3 expression drives cellular proliferation (53, 54). ESPL1 (Extra spindle pole bodies like 1) functions primarily in initiating the final separation of sister chromatids, thereby sustaining cell cycle progression (55). KIF11 (Kinesin family member 11), a motor protein involved in spindle formation and chromosome segregation (56), has been widely reported to promote cell proliferation (57, 58). KIFC1 (Kinesin family member C1) contributes to centrosome integrity (59), and its knockdown has been shown to suppress cancer cell proliferation (60). ANLN (Anillin) encodes a key regulator of cytokinesis that acts as a scaffold protein to facilitate RhoA pathway activation and contractile ring assembly, ensuring successful cell division (61, 62); ANLN overexpression promotes proliferation in cancer cells (63). KIF4A (Kinesin family member 4A) is essential for proper chromosome segregation (64), and multiple studies demonstrate that its overexpression significantly enhances cell proliferation (65, 66). CIT (Citron rho-interacting serine/threonine kinase) regulates critical steps in cytokinesis, and its overexpression promotes cancer cell proliferation (67). Under physiological conditions, loss of CIT leads to cytokinesis failure and impaired proliferation (68). Upregulation of CKAP2 (Cytoskeleton-associated protein 2) has been shown to directly stimulate cell proliferation in multiple cancer types (69, 70). KIF20A (Kinesin family member 20A), a kinesin superfamily protein, functions primarily during mitosis by participating in cell cycle regulation, microtubule dynamics, and cytokinesis; its overexpression enhances tumor cell proliferation (71, 72). ZWINT (ZW10 interacting kinetochore protein) plays an essential role in maintaining genomic stability, and its suppression significantly reduces proliferative capacity (73). WEE1 (WEE1 G2 checkpoint kinase) expression facilitates cell cycle progression, while its inhibition suppresses cancer cell proliferation both in vitro and in vivo (74, 75). CHEK1 (Checkpoint kinase 1) encodes a checkpoint kinase involved in DNA damage response, cell cycle control, and cell survival pathways. Its overexpression, primarily studied in cancer models, significantly promotes cell proliferation (76). During myofiber formation in STP, the progressive downregulation of the aforementioned genes (Figure 5B) suggests a potential shift in myoblasts from a proliferation-dominant state toward a differentiation phase, a trend consistent with observations in LTP. During embryonic muscle development in pigs, the early stage is primarily characterized by cell proliferation, followed by a transition to differentiation and fiber formation (77, 78). Thus, from E55 to D0, skeletal muscle development in both STP and LTP likely exits the rapid myoblast proliferation stage and enters a differentiation-dominant phase.
In STP, we also found that the expression level of MYF5 gradually decreased with developmental time, while the expression levels of MEF2C and TNNT1 continued to increase. MYF5 (Myogenic factor 5) regulates the differentiation process of myogenic cells, and its enhanced expression promotes myogenic differentiation and functional improvement (79). The decreased expression of MYF5 (Figure 5C) during myofiber formation in STP may consequently impair the capacity for secondary myofiber formation. MEF2C (Myocyte enhancer factor 2C) plays a pivotal role in regulating the formation and function of oxidative muscle fibers, facilitating the transition from glycolytic to oxidative fiber types (80, 81). TNNT1 (Troponin T1, slow skeletal type) is a key regulatory factor in slow-twitch fiber development, involved in myofibril assembly, determination of contractile properties, and regulation of energy metabolism (82). During the embryonic period, primary myofibers are structurally predisposed to express slow-twitch-specific proteins (83), the continuous upregulation of MEF2C and TNNT1 (Figure 5C) suggests a gradual enhancement in primary myofiber formation capability and an increasing abundance of primary myofibers in STP. These gene expression trends indicate that from E55 to D0, muscle development in STP appears to be primarily oriented toward the generation of primary myofibers. Primary myofibers form during the early embryonic stages, while secondary myofibers develop at a later phase; the combined number of both determines the total myofiber count in postnatal individuals (84). Secondary myofibers serve as the main source of muscle mass increase, and a higher proportion of secondary myofibers is associated with greater meat yield (85–87). Integrating these findings with previous results from LTP, we propose that LTP likely possesses a stronger capacity for secondary myofiber generation compared to STP, which may contribute to its higher postnatal meat yield.
4.2 Developmental stage-specific gene expression profiles underlie enhanced myogenesis in LTP
INS promotes skeletal muscle protein synthesis by activating the PI3K/AKT/mTOR signaling pathway (88) and can also upregulate the activity of glucose transporters in muscle cells enhancing glucose uptake efficiency to support energy metabolism (89). KNG1 is known to inhibit the proliferation of gliomas (90) and mediates pro-inflammatory responses apoptosis and the generation of reactive oxygen species by activating the bradykinin system thereby influencing oxidative stress levels in livestock and poultry (91). ACAN as a core proteoglycan in cartilage regulates skeletal growth (92, 93) and may indirectly affect muscle development through the growth hormone signaling pathway (94). SST plays a crucial role in growth regulation and metabolism with maternal gene knockout leading to metabolic disorders and obesity in offspring (95). The expression of the aforementioned genes shows a significant positive correlation with LTP-E55, indicating that LTP at E55 may undergo enhanced energy metabolism to meet the energy requirements for rapid muscle development.
PAX6 may promote the growth and differentiation of LTP muscle cells by participating in the regulation of the MAPK signaling pathway (96). FABP6 interacts with the KLF5 transcription factor, which may regulate muscle energy metabolism and cell proliferation by influencing cellular proliferation and lipid storage and utilization in muscle cells (97). GNAT2 is primarily associated with light signal transduction in retinal cone cells (98), and currently, no studies have been found that directly investigate the relationship between GNAT2 and skeletal muscle development. The significant positive correlation between the expression of PAX6, FABP6, and KLF5 with LTP-E75 indicates that LTP at the E75 stage may undergo enhanced myocyte proliferation and differentiation.
CYC1, UQCRFS1, and NDUFS3 are critical components of the mitochondrial electron transport chain and energy metabolism (96, 99–101). Their significant positive correlation with LTP-D0 indicates that LTP at the D0 stage may undergo enhanced energy metabolism to meet the energy demands required for rapid muscle development in LTP.
5 Conclusion
Through transcriptomic analysis of embryonic muscle tissue from Diqing Tibetan pigs exhibiting significant size variation within the same breed, we discovered that the higher postnatal meat yield in larger individuals may be attributed to their enhanced secondary myofiber formation capacity during embryonic development. Specifically, the developmental downregulation of CAPN6 and STMN1 expression promoted myoblast differentiation, while the concurrent upregulation of ATP2A1 expression further facilitated secondary myofiber formation, collectively enhancing the secondary myofiber generative potential in large Diqing Tibetan pigs. Collectively, our findings provide a substantial theoretical foundation for genetic improvement and strategic utilization of local pig breeds.
Data availability statement
The original contributions presented in the study are publicly available. This data can be found here: National Center for Biotechnology Information (NCBI) BioProject, https://www.ncbi.nlm.nih.gov/bioproject/, PRJNA1228663.
Ethics statement
The animal study was approved by The Ethics Committee of Life Sciences, Yunnan Agricultural University (approval number: 202207003). The study was conducted in accordance with the local legislation and institutional requirements.
Author contributions
SL: Data curation, Methodology, Validation, Writing – original draft, Writing – review & editing. YB: Data curation, Methodology, Validation, Writing – original draft, Writing – review & editing. XL: Data curation, Methodology, Writing – review & editing. SJ: Data curation, Writing – review & editing. DY: Data curation, Funding acquisition, Project administration, Resources, Writing – review & editing. XD: Data curation, Funding acquisition, Methodology, Project administration, Resources, Supervision, Writing – review & editing.
Funding
The author(s) declare that financial support was received for the research and/or publication of this article. This study was supported by the Yunnan Provincial Major Science and Technology Special Project (202302AE090015), the Yunnan Provincial Agricultural Joint Project (2021BD070001-103), and the Yunnan Provincial Major Science and Technology Special Project (202202AE090005).
Conflict of interest
The authors declare that the research was conducted in the absence of any commercial or financial relationships that could be construed as a potential conflict of interest.
Generative AI statement
The authors declare that no Gen AI was used in the creation of this manuscript.
Any alternative text (alt text) provided alongside figures in this article has been generated by Frontiers with the support of artificial intelligence and reasonable efforts have been made to ensure accuracy, including review by the authors wherever possible. If you identify any issues, please contact us.
Publisher’s note
All claims expressed in this article are solely those of the authors and do not necessarily represent those of their affiliated organizations, or those of the publisher, the editors and the reviewers. Any product that may be evaluated in this article, or claim that may be made by its manufacturer, is not guaranteed or endorsed by the publisher.
Supplementary material
The Supplementary material for this article can be found online at: https://www.frontiersin.org/articles/10.3389/fvets.2025.1584236/full#supplementary-material
Footnotes
References
1. Bentzinger, CF, Wang, YX, and Rudnicki, MA. Building muscle: molecular regulation of myogenesis. Cold Spring Harb Perspect Biol. (2012) 4:a008342. doi: 10.1101/cshperspect.a008342
2. Foxcroft, GR, Dixon, WT, Novak, S, Putman, CT, Town, SC, and Vinsky, MD. The biological basis for prenatal programming of postnatal performance in pigs. J Anim Sci. (2006) 84:E105–12. doi: 10.2527/2006.8413_supple105x
3. Rehfeldt, C, Kuhn, G, Vanselow, J, Fürbass, R, Fiedler, I, Nürnberg, G, et al. Maternal treatment with somatotropin during early gestation affects basic events of myogenesis in pigs. Cell Tissue Res. (2001) 306:429–40. doi: 10.1007/s00441-001-0475-x
4. Wigmore, PM, and Stickland, NC. Muscle development in large and small pig fetuses. J Anat. (1983) 137:235–45.
5. Jia, C, Kong, X, Koltes, JE, Gou, X, Yang, S, Yan, D, et al. Gene co-expression network analysis unraveling transcriptional regulation of high-altitude adaptation of Tibetan pig. PLoS One. (2016) 11:e0168161. doi: 10.1371/journal.pone.0168161
6. Kong, X, Dong, X, Yang, S, Qian, J, Yang, J, Jiang, Q, et al. Natural selection on TMPRSS6 associated with the blunted erythropoiesis and improved blood viscosity in Tibetan pigs. Comp Biochem Physiol B Biochem Mol Biol. (2019) 233:11–22. doi: 10.1016/j.cbpb.2019.03.003
7. Wu, DD, Yang, CP, Wang, MS, Dong, KZ, Yan, DW, Hao, ZQ, et al. Convergent genomic signatures of high-altitude adaptation among domestic mammals. Natl Sci Rev. (2020) 7:952–63. doi: 10.1093/nsr/nwz213
8. Li, C, Li, X, Xiao, J, Liu, J, Fan, X, Fan, F, et al. Study on hypoxic adaptation-related sites and expression levels of the EPAS1 gene in Tibetan pigs. J Anim Ecol. (2020) 41:19–24. doi: 10.1093/molbev/msw280
9. Yan, D, Zhao, G, Gou, X, Wang, T, Du, Y, Li, G, et al. Study on the meat quality characteristics of Diqing Tibetan pigs. J Yunnan Agricult Univ. (2007) 1:86–91. doi: 10.16211/j.issn.1004-390x(n).2007.01.020
10. Shang, P, Qiang, B, Zhang, B, Wang, Z, Ban, D, Zhang, H, et al. Analysis of slaughter performance and meat quality of the Tibetan pig breeding group. Heilongjiang Anim Husb Vet Med. (2015) 2:30–2. doi: 10.13881/j.cnki.hljxmsy.2015.0092
11. Ma, L, Zhang, B, Lu, S, Zhang, H, Wang, X, Nie, J, et al. Comparison of the free amino acid profiles in large Diqing Tibetan pigs and wild Tibetan hybrid pigs. J Jiangxi Agricult Univ. (2020) 42:941–52. doi: 10.13836/j.jjau.2020106
12. Ma, L, Nie, J, Lu, S, Liu, S, Wang, L, Li, J, et al. Comparison of the taste intensity values of free amino acids in meat from Diqing Tibetan pigs and wild hybrid Tibetan pigs. Chinese J Anim Husb Vet Med. (2021) 48:1275–83. doi: 10.16431/j.cnki.1671-7236.2021.04.014
13. Nie, J, Ma, L, Lu, S, Deng, J, Li, J, Wang, L, et al. Comparison of growth, carcass, and meat quality performance between Diqing Tibetan pigs and wild boar × Diqing Tibetan pigs. J Yunnan Agricult Univ Nat Sci. (2021) 36:805–10. Available at: https://link.cnki.net/urlid/53.1044.S.20211019.0921.004
14. Yan, D, Gou, X, Li, G, Qian, J, Lian, L, Wang, T, et al. Study on the genetic characteristics of Diqing Tibetan pigs. In: Chinese Association of Animal Husbandry, Haikou Municipal Government, editors. Proceedings of the 2006 China swine industry development conference. Animal Science College, Yunnan Agricultural University; Yunnan Provincial Agriculture Department, Animal Husbandry Bureau; Yunnan Agricultural Vocational and Technical College; Diqing Animal Husbandry and Veterinary Station; (2006), 239–245.
15. Zhang, L, Zhu, L, Wang, J, Ma, L, Li, M, Lu, S, et al. Comparison of genetic performance of local pig breeds in Yunnan. Heilongjiang Anim Husb Vet Med. (2016) 13:92–6. doi: 10.13881/j.cnki.hljxmsy.2016.1176
16. Yunnan Animal Genetic Resources Committee. Yunnan animal genetic resources compendium. Kunming: Yunnan Science and Technology Press (2015).
17. Yang, S, Zhang, H, Mao, H, Yan, D, Lu, S, Lian, L, et al. The local origin of the Tibetan pig and additional insights into the origin of Asian pigs. PLoS One. (2011) 6:e28215. doi: 10.1371/journal.pone.0028215
18. Li, X, Ren, Z, and Chang, H. Study on genetic diversity of Diqing Tibetan pigs. Biodiversity. (2000) 8:253–6.
19. Li, X, and Chang, H. Polymorphism of serum transferrin among cooperative pigs, Diqing Tibetan pigs, and Chenghua pigs. J Gansu Agric Univ. (2000) 35:194–6. doi: 10.13432/j.cnki.jgsau.2000.02.015
20. Fang, C, Hu, R, Yang, M, Zhang, B, Liu, S, Guo, F, et al. Analysis of genetic variation in the FUT1 gene of Diqing Tibetan pigs. Chinese J Anim Husb. (2020) 56:29–35. doi: 10.19556/j.0258-7033.20200206-01
21. Liu, S, Zhang, B, Xiang, D, Yang, R, Zhao, Z, Sha, Q, et al. Comparative study on growth performance and slaughter traits of Diqing Tibetan pig hybrids. Jiangsu Agricult Sci. (2020) 48:181–4. doi: 10.15889/j.issn.1002-1302.2020.19.040
22. Ge, Q, Gao, C, Cai, Y, Jiao, T, Quan, J, Guo, Y, et al. Evaluating genetic diversity and identifying priority conservation for seven Tibetan pig populations in China based on the mtDNA D-loop. Asian Australas J Anim Sci. (2020) 33:1905–11. doi: 10.5713/ajas.19.0752
23. Zhou, X, Ma, L, Li, M, Lu, S, Lyv, M, Nie, J, et al. Effects of fattening methods on the meat performance and meat quality of Diqing Tibetan pigs. J Yunnan Agricult Univ (Nat Sci). (2020) 35:977. doi: 10.12101/j.issn.1004-390X(n).202002006
24. Gong, X, Duan, M, Zhang, J, Li, Y, Zhang, F, Zhao, X, et al. Polymorphism and expression differences of the CKM gene in Tibetan pigs and Yorkshire pigs. Southwest Agricult J. (2021) 34:197–201. doi: 10.16213/j.cnki.scjas.2021.1.029
25. Zhang, B, Chamba, Y, Shang, P, Wang, Z, Ma, J, Wang, L, et al. Comparative transcriptomic and proteomic analyses provide insights into the key genes involved in high-altitude adaptation in the Tibetan pig. Sci Rep. (2017) 7:3654. doi: 10.1038/s41598-017-03976-3
26. Wang, L, Ma, L, Zhang, B, Deng, J, Zhang, H, Ouyang, X, et al. Analysis of differential genes and regulatory networks of back fat and abdominal fat lipid metabolism at different growth stages in large Diqing Tibetan pigs. J Anim Sci Vet Med. (2023) 54:520–33. Available at: https://link.cnki.net/urlid/11.1985.S.20221125.1237.012
27. Wang, L, Yan, D, Ma, L, Zhang, B, Wang, L, Zhang, H, et al. Analysis of differential genes and regulatory pathways of back fat deposition at different growth stages in large Diqing Tibetan pigs. Southwest Agricult J. (2023) 36:845–53. doi: 10.16213/j.cnki.scjas.2023.4.021
28. Dong, X, Wang, L, Liu, J, Yan, D, Zhang, B, Deng, J, et al. Screening of metabolic function genes of abdominal fat at different growth stages in large Diqing Tibetan pigs and their regulatory network analysis. J Yunnan Agricult Univ (Nat Sci). (2023) 38:61–70. doi: 10.12101/j.issn.1004-390X(n).202204047
29. Nie, J, Ma, L, Yan, D, Deng, J, Zhang, H, Zhang, B, et al. Analysis of differentially expressed genes and regulatory pathways of intramuscular fat deposition during different growth stages in large Diqing Tibetan pigs. Chinese J Anim Husb Vet Med. (2022) 49:2855–68. doi: 10.16431/j.cnki.1671-7236.2022.08.002
30. Nie, J, Zhang, B, Ma, L, Zhang, H, Li, G, Yan, D, et al. Analysis of differential genes and regulatory pathways related to muscle growth at different growth stages in large Diqing Tibetan pigs. J China Agricult Univ. (2022) 27:132–44.
31. Lu, J. Analysis of muscle fiber composition and transcriptomics in Diqing Tibetan Pigs during the growth period [Master’s thesis]. Kunming, China: Yunnan Agricultural University (2022). doi: 10.27458/d.cnki.gynyu.2022.000167
32. Nie, J, Zhang, B, Ma, L, Yan, D, Zhang, H, Bai, Y, et al. Comparative transcriptomic and proteomic analyses provide insights into the key genes involved in muscle growth in the large Diqing Tibetan pig. Can J Anim Sci. (2023) 103:373–87. doi: 10.1139/cjas-2022-0073
33. Chen, S, Zhou, Y, Chen, Y, and Gu, J. Fastp: an ultra-fast all-in-one FASTQ preprocessor. Bioinformatics. (2018) 34:i884–90. doi: 10.1093/bioinformatics/bty560
34. Kim, D, Langmead, B, and Salzberg, S. HISAT: a fast spliced aligner for transcriptome and genome sequencing. Nat Methods. (2015) 12:357–60. doi: 10.1038/nmeth.3317
35. Pertea, M, Pertea, GM, Antonescu, CM, Chong, Z, and Couger, MB. Stringtie enables improved reconstruction of a transcriptome from RNA-seq reads. Nat Biotechnol. (2015) 33:290–5. doi: 10.1038/nbt.3122
36. Smid, M, Coebergh van den Braak, RRJ, van de Werken, HJG, van Riet, J, van Galen, A, de Weerd, V, et al. Gene length corrected trimmed mean of M-values (GeTMM) processing of RNA-seq data performs similarly in intersample analyses while improving intrasample comparisons. BMC Bioinformatics. (2018) 19:236. doi: 10.1186/s12859-018-2246-7
37. Husson, F, Josse, J, and Le, S. FactoMineR: an R package for multivariate analysis. J Stat Softw. (2010) 25:1–18. doi: 10.18637/jss.v025.i01
38. Robinson, MD, McCarthy, DJ, and Smyth, GK. edgeR: a bioconductor package for differential expression analysis of digital gene expression data. Bioinformatics. (2010) 26:139–40. doi: 10.1093/bioinformatics/btp616
39. Xie, C, Huang, J, Ding, Y, Wu, J, and Zheng, H. KOBAS 2.0: a web server for functional enrichment analysis and candidate gene identification. Nucleic Acids Res. (2011) 39:W316–22. doi: 10.1093/nar/gkr483
40. Langfelder, P, and Horvath, S. WGCNA: an R package for weighted correlation network analysis. BMC Bioinformatics. (2008) 9:559. doi: 10.1186/1471-2105-9-559
41. Szklarczyk, D, Franceschini, A, Wyder, S, Forslund, K, Heller, D, Huerta-Cepas, J, et al. STRING v10: protein-protein interaction networks, integrated over the tree of life. Nucleic Acids Res. (2015) 43:D447–52. doi: 10.1093/nar/gku1003
42. Shannon, P, Markiel, A, Ozier, O, Baliga, NS, Wang, JT, Ramage, D, et al. Cytoscape: a software environment for integrated models of biomolecular interaction networks. Genome Res. (2003) 13:2498–504. doi: 10.1101/gr.1239303
43. Feng, X, Xiong, Y, Qian, H, Lei, M, Xu, D, and Ren, Z. Selection of reference genes for gene expression studies in porcine skeletal muscle using SYBR green qPCR. J Biotechnol. (2010) 150:288–93. doi: 10.1016/j.jbiotec.2010.09.949
44. Nygard, AB, Jørgensen, CB, Cirera, S, and Fredholm, M. Selection of reference genes for gene expression studies in pig tissues using SYBR green qPCR. BMC Mol Biol. (2007) 8:67. doi: 10.1186/1471-2199-8-67
45. Zhang, YY, Gu, LJ, Zhu, N, Wang, L, Cai, M, Jia, J, et al. Calpain 6 inhibits autophagy in inflammatory environments: a preliminary study on myoblasts and a chronic kidney disease rat model. Int J Mol Med. (2021) 48:194. doi: 10.3892/ijmm.2021.5027
46. Vicari, HP, Coelho-Silva, JL, Pereira-Martins, DA, Lucena-Araujo, AR, Lima, K, Lipreri da Silva, JC, et al. STMN1 is highly expressed and contributes to clonogenicity in acute promyelocytic leukemia cells. Investig New Drugs. (2022) 40:438–52. doi: 10.1007/s10637-021-01197-0
47. Wang, L, Cao, J, Tao, J, and Liang, Y. STMN1 promotes cell malignancy and bortezomib resistance of multiple myeloma cell lines via PI3K/AKT signaling. Expert Opin Drug Saf. (2024) 23:277–86. doi: 10.1080/14740338.2023.2251384
48. Zhang, J, Sheng, H, Pan, C, Wang, S, Yang, M, Hu, C, et al. Identification of key genes in bovine muscle development by co-expression analysis. PeerJ. (2023) 11:e15093. doi: 10.7717/peerj.15093
49. Kanazawa, Y, Takahashi, T, Nagano, M, Koinuma, S, and Shigeyoshi, Y. The effects of aging on sarcoplasmic reticulum-related factors in the skeletal muscle of mice. Int J Mol Sci. (2024) 25:2148. doi: 10.3390/ijms25042148
50. Li, X, Su, Y, Chen, Q, Pu, Y, He, X, Jiang, L, et al. Spatiotemporal coordination of 3D chromatin architecture and gene expression dynamics during ovine embryonic myogenesis. Int J Biol Macromol. (2025) 328:147662. doi: 10.1016/j.ijbiomac.2025.147662
51. Jiang, C, Zhang, J, Song, Y, Song, X, Wu, H, Jiao, R, et al. FOXO1 regulates bovine skeletal muscle cells differentiation by targeting MYH3. Int J Biol Macromol. (2024) 260:129643. doi: 10.1016/j.ijbiomac.2024.129643
52. Yang, Y, Zhu, X, Jia, X, Hou, W, Zhou, G, Ma, Z, et al. Phosphorylation of Msx1 promotes cell proliferation through the Fgf9/18-MAPK signaling pathway during embryonic limb development. Nucleic Acids Res. (2020) 48:11452–67. doi: 10.1093/nar/gkaa905
53. Chen, Y, Xu, X, Wang, Y, Zhang, Y, Zhou, T, Jiang, W, et al. Hypoxia-induced SKA3 promoted cholangiocarcinoma progression and chemoresistance by enhancing fatty acid synthesis via the regulation of PAR-dependent HIF-1a deubiquitylation. J Exp Clin Cancer Res. (2023) 42:265. doi: 10.1186/s13046-023-02842-7
54. Feng, D, Zhu, W, Shi, X, Xiong, Q, Li, D, Wei, W, et al. Spindle and kinetochore-associated complex subunit 3 could serve as a prognostic biomarker for prostate cancer. Exp Hematol Oncol. (2022) 11:76. doi: 10.1186/s40164-022-00337-3
55. Zhong, Y, Zheng, C, Zhang, W, Wu, H, Wang, M, Zhang, Q, et al. Pan-Cancer analysis and experimental validation identify the oncogenic nature of ESPL1: potential therapeutic target in colorectal cancer. Front Immunol. (2023) 14:1138077. doi: 10.3389/fimmu.2023.1138077
56. Guo, X, Zhou, L, Wu, Y, and Li, J. KIF11 as a potential Pan-Cancer immunological biomarker encompassing the disease staging, prognoses, tumor microenvironment, and therapeutic responses. Oxidative Med Cell Longev. (2022) 2022:2764940. doi: 10.1155/2022/2764940
57. Shi, S, Guo, D, Ye, L, Li, T, Fei, Q, Lin, M, et al. Knockdown of TACC3 inhibits tumor cell proliferation and increases chemosensitivity in pancreatic cancer. Cell Death Dis. (2023) 14:778. doi: 10.1038/s41419-023-06313-x
58. Wei, D, Rui, B, Qingquan, F, Chen, C, ping, HY, Xiaoling, S, et al. KIF11 promotes cell proliferation via ERBB2/PI3K/AKT signaling pathway in gallbladder cancer. Int J Biol Sci. (2021) 17:514–26. doi: 10.7150/ijbs.54074
59. Zhou, K, He, Y, Lin, X, Zhou, H, Xu, X, and Xu, J. KIFC1 depends on TRIM37-mediated ubiquitination of PLK4 to promote centrosome amplification in endometrial cancer. Cell Death Discov. (2024) 10:419. doi: 10.1038/s41420-024-02190-1
60. Garlapati, C, Joshi, S, Yang, C, Chandrashekar, DS, Rida, P, and Aneja, R. A novel role for KIFC1-MYH9 interaction in triple-negative breast cancer aggressiveness and racial disparity. Cell Commun Signal. (2024) 22:312. doi: 10.1186/s12964-024-01664-0
61. Chen, J, Li, Z, Jia, X, Song, W, Wu, H, Zhu, H, et al. Targeting anillin inhibits tumorigenesis and tumor growth in hepatocellular carcinoma via impairing cytokinesis fidelity. Oncogene. (2022) 41:3118–30. doi: 10.1038/s41388-022-02274-1
62. Cao, YF, Wang, H, Sun, Y, Tong, BB, Shi, WQ, Peng, L, et al. Nuclear ANLN regulates transcription initiation related pol II clustering and target gene expression. Nat Commun. (2025) 16:1271. doi: 10.1038/s41467-025-56645-9
63. Liu, J, Wang, S, Zhang, C, Wei, Z, Han, D, Song, Y, et al. Anillin contributes to prostate cancer progression through the regulation of IGF2BP1 to promote c-Myc and MAPK signaling. Am J Cancer Res. (2024) 14:490–506. doi: 10.62347/UYQH7683
64. Neahring, L, Cho, NH, He, Y, Liu, G, Fernandes, J, Rux, CJ, et al. Torques within and outside the human spindle balance twist at anaphase. J Cell Biol. (2024) 223:e202312046. doi: 10.1083/jcb.202312046
65. Zheng, P, Wu, K, Gao, Z, Li, H, Li, W, Wang, X, et al. KIF4A promotes the development of bladder cancer by transcriptionally activating the expression of CDCA3. Int J Mol Med. (2021) 47:99. doi: 10.3892/ijmm.2021.4932
66. Correia, PD, de Sousa, BM, Chato-Astrain, J, de Faria, JP, Estrada, V, Relvas, JB, et al. Injury-induced KIF4A neural expression and its role in Schwann cell proliferation suggest a dual function for this kinesin in neural regeneration. Neural Regen Res. (2026) 21:1607–20. doi: 10.4103/NRR.NRR-D-24-00232
67. Rawat, C, Ben-Salem, S, Singh, N, Chauhan, G, Rabljenovic, A, Vaghela, V, et al. Prostate Cancer progression relies on the mitotic kinase citron kinase. Cancer Res. (2023) 83:4142–60. doi: 10.1158/0008-5472.CAN-23-0883
68. Iegiani, G, Pallavicini, G, Pezzotta, A, Brix, A, Ferraro, A, Gai, M, et al. CITK modulates BRCA1 recruitment at DNA double strand breaks sites through HDAC6. Cell Death Dis. (2025) 16:320. doi: 10.1038/s41419-025-07655-4
69. Ma, HN, Chen, HJ, Liu, JQ, and Li, WT. Long non-coding RNA DLEU1 promotes malignancy of breast cancer by acting as an indispensable coactivator for HIF-1α-induced transcription of CKAP2. Cell Death Dis. (2022) 13:625. doi: 10.1038/s41419-022-04880-z
70. Zheng, Q, Lan, Y, Chen, J, and Lin, L. Identification and validation of CKAP2 as a novel biomarker in the development and progression of rheumatoid arthritis. Front Immunol. (2025) 16:1606201. doi: 10.3389/fimmu.2025.1606201
71. Chen, S, Zhao, L, Liu, J, Han, P, Jiang, W, Liu, Y, et al. Inhibition of KIF20A enhances the immunotherapeutic effect of hepatocellular carcinoma by enhancing c-Myc ubiquitination. Cancer Lett. (2024) 598:217105. doi: 10.1016/j.canlet.2024.217105
72. Su, Z, Zhong, Y, He, Y, You, L, Xin, F, Wang, L, et al. Bulk- and single cell-RNA sequencing reveal KIF20A as a key driver of hepatocellular carcinoma progression and immune evasion. Front Immunol. (2024) 15:1469827. doi: 10.3389/fimmu.2024.1469827
73. Shu, Y, Pang, X, Li, H, and Deng, C. A multidimensional analysis of ZW10 interacting kinetochore protein in human tumors. Am J Cancer Res. (2024) 14:390–402. doi: 10.62347/MDPI5698
74. Esposito, E, Marra, G, Catalano, R, Maioli, S, Nozza, E, Barbieri, AM, et al. Therapeutic potential of targeting the FLNA-regulated Wee1 kinase in adrenocortical carcinomas. Int J Cancer. (2025) 156:1256–71. doi: 10.1002/ijc.35239
75. Yan, J, Zhuang, L, Wang, Y, Jiang, Y, Tu, Z, Dong, C, et al. Inhibitors of cell cycle checkpoint target Wee1 kinase - a patent review (2003-2022). Expert Opin Ther Pat. (2022) 32:1217–44. doi: 10.1080/13543776.2022.2166827
76. Li, F, Lo, TY, Miles, L, Wang, Q, Noristani, HN, Li, D, et al. The Atr-Chek1 pathway inhibits axon regeneration in response to piezo-dependent mechanosensation. Nat Commun. (2021) 12:3845. doi: 10.1038/s41467-021-24131-7
77. Yue, J, Hou, X, Liu, X, Wang, L, Gao, H, Zhao, F, et al. The landscape of chromatin accessibility in skeletal muscle during embryonic development in pigs. J Anim Sci Biotechnol. (2021) 12:56. doi: 10.1186/s40104-021-00577-z
78. Yang, Y, Fan, X, Yan, J, Chen, M, Zhu, M, Tang, Y, et al. A comprehensive epigenome atlas reveals DNA methylation regulating skeletal muscle development. Nucleic Acids Res. (2021) 49:1313–29. doi: 10.1093/nar/gkaa1203
79. Jiang, X, Ji, S, Yuan, F, Li, T, Cui, S, Wang, W, et al. Pyruvate dehydrogenase B regulates myogenic differentiation via the FoxP1-Arih2 axis. J Cachexia Sarcopenia Muscle. (2023) 14:606–21. doi: 10.1002/jcsm.13166
80. Akhmetshina, A, Bianco, V, Bradić, I, Korbelius, M, Pirchheim, A, Kuentzel, KB, et al. Loss of lysosomal acid lipase results in mitochondrial dysfunction and fiber switch in skeletal muscles of mice. Mol Metab. (2024) 79:101869. doi: 10.1016/j.molmet.2023.101869
81. Wang, T, Sun, X, Zhang, Y, Wang, Q, Cheng, W, Gao, Y, et al. Baicalin promotes skeletal muscle Fiber Remodeling by activating the p38MAPK/PGC-1α Signaling pathway. J Agric Food Chem. (2025) 73:6878–89. doi: 10.1021/acs.jafc.5c00300
82. Wei, F, Wu, X, Wang, H, Zhang, Y, and Xie, L. Methimazole disrupted skeletal ossification and muscle fiber transition in Bufo gargarizans larvae. Ecotoxicol Environ Saf. (2025) 289:117684. doi: 10.1016/j.ecoenv.2025.117684
83. Sahinyan, K, Blackburn, DM, Simon, MM, Lazure, F, Kwan, T, Bourque, G, et al. Application of ATAC-Seq for genome-wide analysis of the chromatin state at single myofiber resolution. eLife. (2022) 11:e72792. doi: 10.7554/eLife.72792
84. Zuo, H, Jiang, W, Gao, J, Ma, Z, Li, C, Peng, Y, et al. SYISL knockout promotes embryonic muscle development of offspring by modulating maternal gut microbiota and Fetal myogenic cell dynamics. Adv Sci. (2025) 12:e2410953. doi: 10.1002/advs.202410953
85. Liao, T, Gan, M, Zhu, Y, Lei, Y, Yang, Y, Zheng, Q, et al. Carcass and meat quality characteristics and changes of lean and fat pigs after the growth turning point. Foods. (2025) 14:2719. doi: 10.3390/foods14152719
86. Lee, SH, Kim, S, and Kim, JM. Genetic correlation between biopsied and post-mortem muscle fibre characteristics and meat quality traits in swine. Meat Sci. (2022) 186:108735. doi: 10.1016/j.meatsci.2022.108735
87. Gao, K, Luo, Z, Han, S, Li, Z, Choe, HM, Paek, HJ, et al. Analysis of meat color, meat tenderness and fatty acid composition of meat in second filial hybrid offspring of MSTN mutant pigs. Meat Sci. (2022) 193:108929. doi: 10.1016/j.meatsci.2022.108929
88. Kimball, SR, and Jefferson, LS. Signaling pathways and molecular mechanisms through which branched-chain amino acids mediate translational control of protein synthesis. J Nutr. (2006) 136:227S–31S. doi: 10.1093/jn/136.1.227S
89. Saltiel, AR, and Kahn, CR. Insulin signalling and the regulation of glucose and lipid metabolism. Nature. (2001) 414:799–806. doi: 10.1038/414799a
90. Xu, J, Wang, J, Zhao, M, Li, C, Hong, S, and Zhang, J. LncRNA LINC01018/miR-942-5p/KNG1 axis regulates the malignant development of glioma in vitro and in vivo. CNS Neurosci Ther. (2023) 29:691–711. doi: 10.1111/cns.14053
91. Cheng, X, Liu, D, Song, H, Tian, X, Yan, C, and Han, Y. Overexpression of kininogen-1 aggravates oxidative stress and mitochondrial dysfunction in DOX-induced cardiotoxicity. Biochem Biophys Res Commun. (2021) 550:142–50. doi: 10.1016/j.bbrc.2021.02.104
92. Sentchordi-Montané, L, Díaz-Gonzalez, F, Modamio-Høybjør, S, Nevado, J, Machado-Fernandes, F, Carcavilla, A, et al. Moderate to severe short stature and joint involvement in individuals with ACAN deletions. Clin Endocrinol. (2025) 103:177–84. doi: 10.1111/cen.15237
93. Lu, S, and Fang, C. Isosakuranetin inhibits subchondral osteoclastogenesis for attenuating osteoarthritis via suppressing the NF-κB/CXCL2 axis. Int Immunopharmacol. (2024) 143:113321. doi: 10.1016/j.intimp.2024.113321
94. Wu, H, Wang, C, Yu, S, Ye, X, Jiang, Y, He, P, et al. Downregulation of ACAN is associated with the growth hormone pathway and induces short stature. J Clin Lab Anal. (2023) 37:e24830. doi: 10.1002/jcla.24830
95. Yang, Z, Kirschke, CP, and Huang, L. Lack of maternal exposure to somatostatin leads to diet-induced insulin and leptin resistance in mouse male offspring. J Mol Endocrinol. (2025) 74:e240102. doi: 10.1530/JME-24-0102
96. Zhu, H, Li, X, Wang, J, Wang, H, Zhao, S, Tian, Y, et al. Transcriptomic analysis reveals differentially expressed genes associated with meat quality in Chinese Dagu chicken and AA+ broiler roosters. BMC Genomics. (2024) 25:1002. doi: 10.1186/s12864-024-10927-6
97. Herring, JA, Crabtree, JE, Hill, JT, and Tessem, JS. Loss of glucose-stimulated β-cell Nr4a1 expression impairs insulin secretion and glucose homeostasis. Am J Physiol Cell Physiol. (2024) 327:C1111–24. doi: 10.1152/ajpcell.00315.2024
98. Bai, J, Koos, DS, Stepanian, K, Fouladian, Z, Shayler, DWH, Aparicio, JG, et al. Episodic live imaging of cone photoreceptor maturation in GNAT2-EGFP retinal organoids. Dis Model Mech. (2023) 16:dmm050193. doi: 10.1242/dmm.050193
99. Giannos, P, Prokopidis, K, Raleigh, SM, Kelaiditi, E, and Hill, M. Altered mitochondrial microenvironment at the spotlight of musculoskeletal aging and Alzheimer's disease. Sci Rep. (2022) 12:11290. doi: 10.1038/s41598-022-15578-9
100. Xiang, G, Wen, X, Wang, W, Peng, T, Wang, J, Li, Q, et al. Protective role of AMPK against PINK1B9 flies' neurodegeneration with improved mitochondrial function. Parkinson's Dis. (2023) 2023:4422484. doi: 10.1155/2023/4422484
Keywords: Diqing Tibetan pig, myofiber development, embryonic stages, transcriptome analysis, functional genes
Citation: Luo S, Bai Y, Li X, Jin S, Yan D and Dong X (2025) Analysis of the differential transcriptome expression profiles during prenatal muscle tissue development in Diqing Tibetan pigs. Front. Vet. Sci. 12:1584236. doi: 10.3389/fvets.2025.1584236
Edited by:
Demin Cai, Yangzhou University, ChinaCopyright © 2025 Luo, Bai, Li, Jin, Yan and Dong. This is an open-access article distributed under the terms of the Creative Commons Attribution License (CC BY). The use, distribution or reproduction in other forums is permitted, provided the original author(s) and the copyright owner(s) are credited and that the original publication in this journal is cited, in accordance with accepted academic practice. No use, distribution or reproduction is permitted which does not comply with these terms.
*Correspondence: Dawei Yan, MTk5NTAyN0B5bmF1LmVkdS5jbg==; Xinxing Dong, MjAxMjA0NUB5bmF1LmVkdS5jbg==
†These authors have contributed equally to this work and share first authorship