- 1Xinjiang Key Laboratory of Herbivore Nutrition for Meat and Milk, College of Animal Science, Xinjiang Agricultural University, Urumqi, China
- 2Xinjiang Tiankang Feed Co., Ltd., Urumqi, China
Introduction: Aspergillus oryzae culture (AOC) is widely used as a feed additive to enhance ruminant productivity and rumen function. However, the underlying mechanisms at the microbiome-metabolome interface remain poorly understood. This study aimed to elucidate how dietary AOC supplementation influences sheep production performance, rumen fermentation, microbial communities, and metabolomic profiles.
Methods: Twelve rumen-fistulated sheep were randomly assigned to a control group (basal diet) and a trial group (basal diet + 1% AOC). The experiment lasted 30 days, during which production performance, nutrient digestibility, ruminal pH, volatile fatty acids (VFA), ammonia nitrogen, microbial diversity (16S rDNA sequencing), and metabolomic profiles (LC-MS) were systematically assessed.
Results: AOC supplementation significantly increased average daily gain (ADG) and neutral detergent fiber (NDF) digestibility by 7.00% (p < 0.05), and improved nitrogen retention. Total VFA and acetate concentrations were elevated, with a stable ruminal pH. Microbiome analysis revealed an increased relative abundance of Succiniclasticum and beneficial fiber-degrading taxa. Metabolomic profiling identified upregulation of antioxidant metabolites (e.g., ginsenoside Rg3, lipoamide) and activation of key pathways such as phenylalanine metabolism and the TCA cycle, alongside downregulation of inflammatory markers.
Discussion: AOC enhances sheep productivity and rumen health by modulating fibrolytic microbiota, promoting VFA synthesis, and activating antioxidant and energy metabolism pathways. These findings provide a theoretical basis for the use of AOC as a sustainable feed additive to improve ruminant production efficiency and welfare.
1 Introduction
Aspergillus oryzae (A. oryzae) is one of the most extensively studied edible fila-mentous fungi, and its commercial applications are widely utilized in the production of soy sauce, sake, and miso (1). A. oryzae is also commonly added to animal feed as a direct-fed microbial (DFM), and its fermentation extract Amaferm® has been widely adopted in agricultural applications (2, 3). Research has demonstrated that A. oryzae possesses a robust enzymatic system capable of secreting diverse enzymes, such as α-amylase, β-amylase, protease, and cellulase, which enable the breakdown and utilization of various substrates (4). Studies have shown that supplementing ruminant feed with A. oryzae enhances feed intake (5), improves fiber and dry matter digestibility (6), and increases the population of fibrolytic bacteria in the rumen. These effects collectively improve rumen digestive function, elevate the concentration of volatile fatty acids (VFAs) as a metabolizable energy source, and enhance milk production efficiency (7). You et al. found that dietary supplementation with 50 g/ (head·d) of A. oryzae culture enhanced the apparent digestibility of DM, NDF, and ADF in beef cattle (8). Schingoethe further revealed that adding Aspergillus oryzae culture (AOC) not only increases total dry matter intake but also elevates the concentrations of total volatile fatty acids (TVFA) and propionate, while reducing the acetate-to-propionate ratio (9). The mechanisms underlying these benefits are multifaceted, involving not only the exogenous enzymes provided by AOC but also its prebiotic components (e.g., oligosaccharides) and bioactive metabolites that stimulate the host’s endogenous enzyme secretion and gut barrier function (49). Furthermore, the antioxidant properties of AOC’s metabolites, such as kojic acid and various polyphenols, contribute to mitigating oxidative stress and supporting overall animal health and immune status (10, 11). The cumulative evidence underscores AOC’s potential as a sustainable strategy to enhance animal production by synergistically improving digestive efficiency and the microbial ecosystem.
Current research on AOC has primarily focused on their effects on production performance and rumen microbiota, while mechanistic insights at the metabolome-microbiome interface remain largely unexplored. To address this gap, the present study utilizes fistulated sheep as experimental animals, supplementing their diet with AOC. The purpose of this study was to elucidate the mechanism of AOC in sheep by systematically analyzing sheep production parameters, rumen fermentation characteristics, rumen microbial composition and rumen fluid metabolome.
2 Materials and methods
2.1 Ethical considerations
The experimental procedures, management, and animal husbandry followed the regulations and instructions of the Animal Welfare and Ethics Committee of Xinjiang Agricultural University, Urumqi, Xinjiang, China (Approval number 2020022).
2.2 Animals and experimental design
The experiment selected 12 sheep with similar body conditions (39.07 ± 1.78 kg), uniform gender (male), and approximately 8 months of age as experimental animals. Permanent ruminal fistulas were surgically installed in the sheep. The 12 fistulated sheep were randomly divided into two groups: the control group and the trial group, with 6 sheep in each group. The control group was fed a basal diet, while the trial group received a diet supplemented with 1% AOC (provided by Xinjiang Tiankang Feed Co., Ltd., China, AOC contained 1 × 10⁹ CFU/g of A. oryzae spores, the enzymatic activity of neutral protease is 3,245.3 IU/g, GB/T23527-2009). After a 7-day adaptation period, the 30-day formal trial commenced. A digestion and metabolism trial involving total fecal and urine collection was conducted from days 25 to 29 of the experiment. AOC material was supplemented as an additional ingredient at 1% of the basal diet and fed to fistulated sheep. During the trial, the management conditions were consistent between the two groups of fistulated sheep. The initial daily feeding amount was set at 1.2 kg per sheep (resulting in a daily intake of A. oryzae spores at 1.2 × 10⁶ CFU/g per sheep). Feeding was conducted twice daily at 09:00 and 18:00, with 0.6 kg provided per sheep at each feeding. The concentrate and corn straw were mixed prior to feeding. The feeding amount was adjusted based on leftover feed: if leftovers exceeded 10% of the offered feed or there were no leftovers for two consecutive days, the amount was modified on the third day. Throughout the experiment, the sheep had free access to water.
2.3 Data and sample collection and analysis
2.3.1 Production performance
Daily feed offered was recorded for each sheep, and residual feed from the pre-vious day was collected and weighed before the morning feeding. Body weights were measured on days 0 and 30 of the formal trial period prior to morning feeding.
Calculation Formulas: Average Daily Gain (ADG) = (Final Body Weight – Initial Body Weight)/Trial Duration (days); Dry Matter Intake (DMI) = (Feed Offered – Residual Feed) × Dietary Dry Matter Content (%); Feed-to-Gain Ratio (F:G) = DMI/ADG.
2.3.2 Collection and analysis of feed, fecal, and urine samples
The digestion and metabolism trial was conducted from days 25 to 29 of the experiment. Approximately 200 g of forage samples were collected using the five-point sampling method. During the trial period, residual feed from each experimental sheep was collected daily, weighed, air-dried, and then ground through a 40-mesh sieve. The total fecal collection method was employed by fitting custom-made fecal collection bags to the tail of each sheep. Fecal samples were collected every 4 h from all sheep, with fresh weight recorded continuously for 3 days. The daily collected samples were thoroughly mixed, and 10% of the total was preserved. For total urine collection, custom-made urine collection devices were attached to the urination site of the sheep prior to the digestion trial. Urine was collected every 4 h from all animals. The urine samples from each sheep during the trial period were homogenized, with 10% of the total volume preserved using 10% concentrated sulfuric acid for nitrogen fixation.
The moisture and crude protein contents in the feed and feces were determined according to the Chinese National Standards GB/T 6435-2014 and GB/T 6432-2018, respectively. The neutral detergent fiber and acid detergent fiber were analyzed using a fully automated fiber analyzer (ANKOM A2000i). Specific results are presented in Appendix 1.
2.3.3 Rumen fluid sample collection and analysis
Rumen fluid samples were collected via ruminal fistula at 0 h (pre-feeding), 2 h, 4 h, 6 h, 8 h, and 10 h post-morning feeding on days 0, 10, 20, and 30 of the trial. The samples were immediately filtered through four layers of gauze and analyzed using a pH meter. Additional rumen fluid samples (~200 mL) were collected on day 0 (pre-feeding) and day 30 (at 0 h, 2 h, 4 h, 6 h, 8 h, and 10 h post-feeding), filtered similarly, and processed for further analysis. Volatile fatty acids (VFA) were quantified using a Shimadzu GC-2010 gas chromatograph equipped with a Stabilwax column (30 m × 0.25 mm × 0.25 μm), with 4-methylvaleric acid as the internal standard. Ammonia nitrogen (NH3-N) concentrations in rumen fluid collected on days 0 and 30 were determined according to the method described in reference (12).
2.3.4 Rumen microbial diversity
On day 30 of the experiment, rumen fluid was collected via ruminal fistula, snap-frozen in liquid nitrogen, and subsequently subjected to 16S rDNA high-throughput sequencing. The specific methods are described in Appendix 2.
2.3.5 Rumen fluid metabolomics profiling and analysis
On day 30 of the experiment, rumen fluid was collected via ruminal fistula, snap-frozen in liquid nitrogen, and subsequently subjected to metabolomic analysis. For methodological details, please refer to Appendix 3.
2.4 Statistical analysis
GraphPad 9.5.1 and Origin 2024 was used for figures. Statistical analyses were performed using SPSS 26 software. For all parameters, data between groups were compared using independent samples t-tests with p < 0.05 as the significance level.
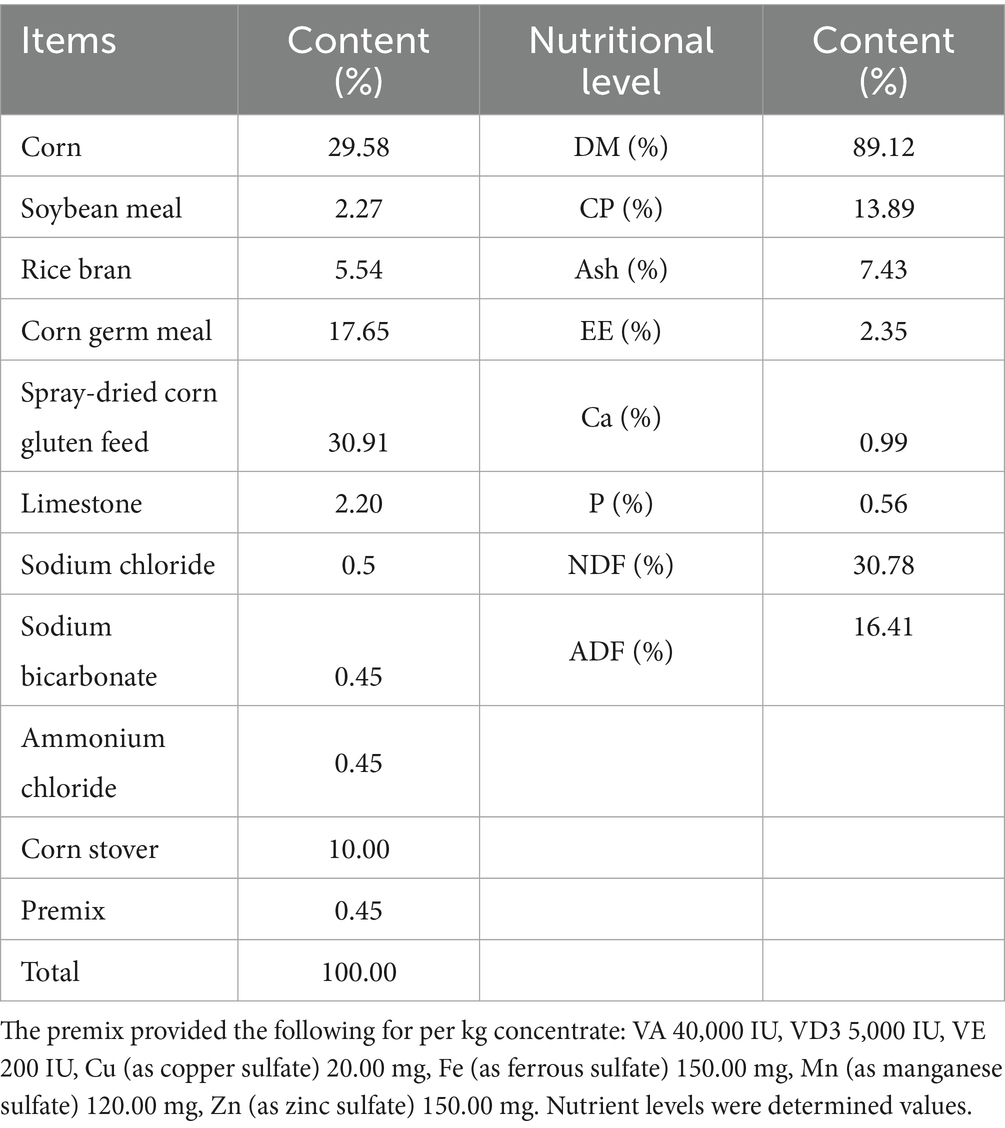
Metabolites were annotated using the KEGG, HMDB, and LIPIDMaps databases. Differential metabolites were screened with the criteria of VIP > 1, p < 0.05, and fold change (FC) ≥ 2 or FC ≤ 0.5. PCA and PLS-DA were performed using metaX. Volcano plots were generated with ggplot2, and clustering heatmaps were plotted using the Pheatmap package with z-score normalized data. Correlation analysis between metabolites was conducted using the cor() function (Pearson method), with significance calculated by cor.mtest() and results visualized via the corrplot package. Pearson correlation analysis was performed between differentially abundant bacterial genera (identified from 16S rDNA sequencing) and differential metabolites (identified from metabolomics). Results were visualized in heatmaps. The correlation coefficient r = cov(X,Y)/(σX*σY), where |r| values closer to 1 indicate stronger correlations, with r > 0 representing positive correlations and r < 0 indicating negative correlations (Table 1).
3 Results
3.1 Production performance and diet digestibility in sheep
The results regarding the effects of dietary supplementation with AOC on the production performance of fistulated sheep are presented in Table 2. As shown in the table, the average daily gain (ADG) of the trial group was significantly higher than that of the control group (p < 0.05). The feed intake showed an increasing trend and the feed conversion ratio (FCR) a decreasing trend in the trial group, though these differences were not statistically significant (p > 0.05). In terms of apparent digestibility, AOC supplementation significantly improved the digestibility of neutral detergent fiber (NDF) by 7.00% (p < 0.05), but had no significant effects on the digestibility of dry matter (DM), crude protein (CP), or acid detergent fiber (ADF) (p > 0.05). There was no significant difference in nitrogen intake between the two groups (p > 0.05), however, nitrogen retention was significantly higher in the trial group compared to the control group (p < 0.05).
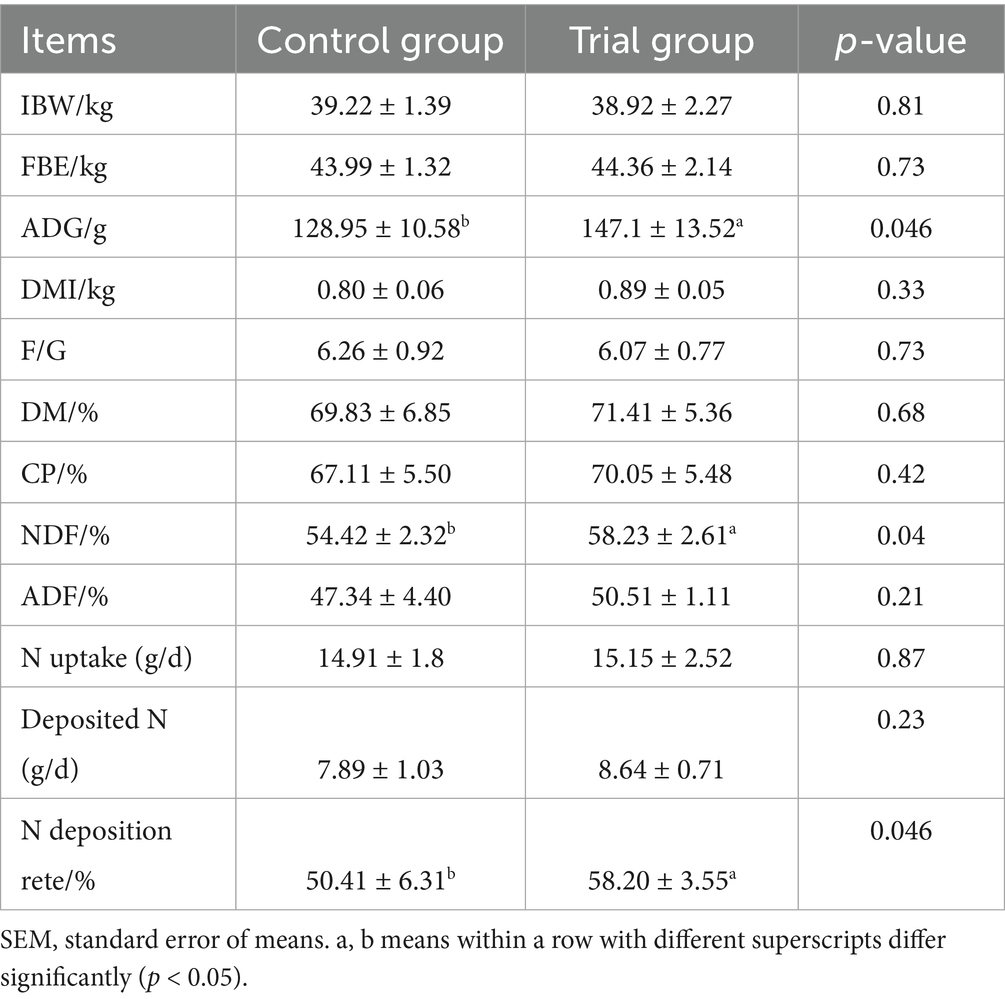
Table 2. Effects of dietary supplementation with AOC on production performance and diet digestibility in sheep.
3.2 Rumen fermentation
3.2.1 Rumen pH
Following AOC supplementation, the ruminal pH dynamics in sheep showed an initial decrease followed by a gradual increase (Figure 1A). The ruminal pH values in the trial group were higher than those in the control group at 2 h, 4 h, and 6 h post-feeding, indicating a trend toward increased ruminal pH with AOC supplementation.
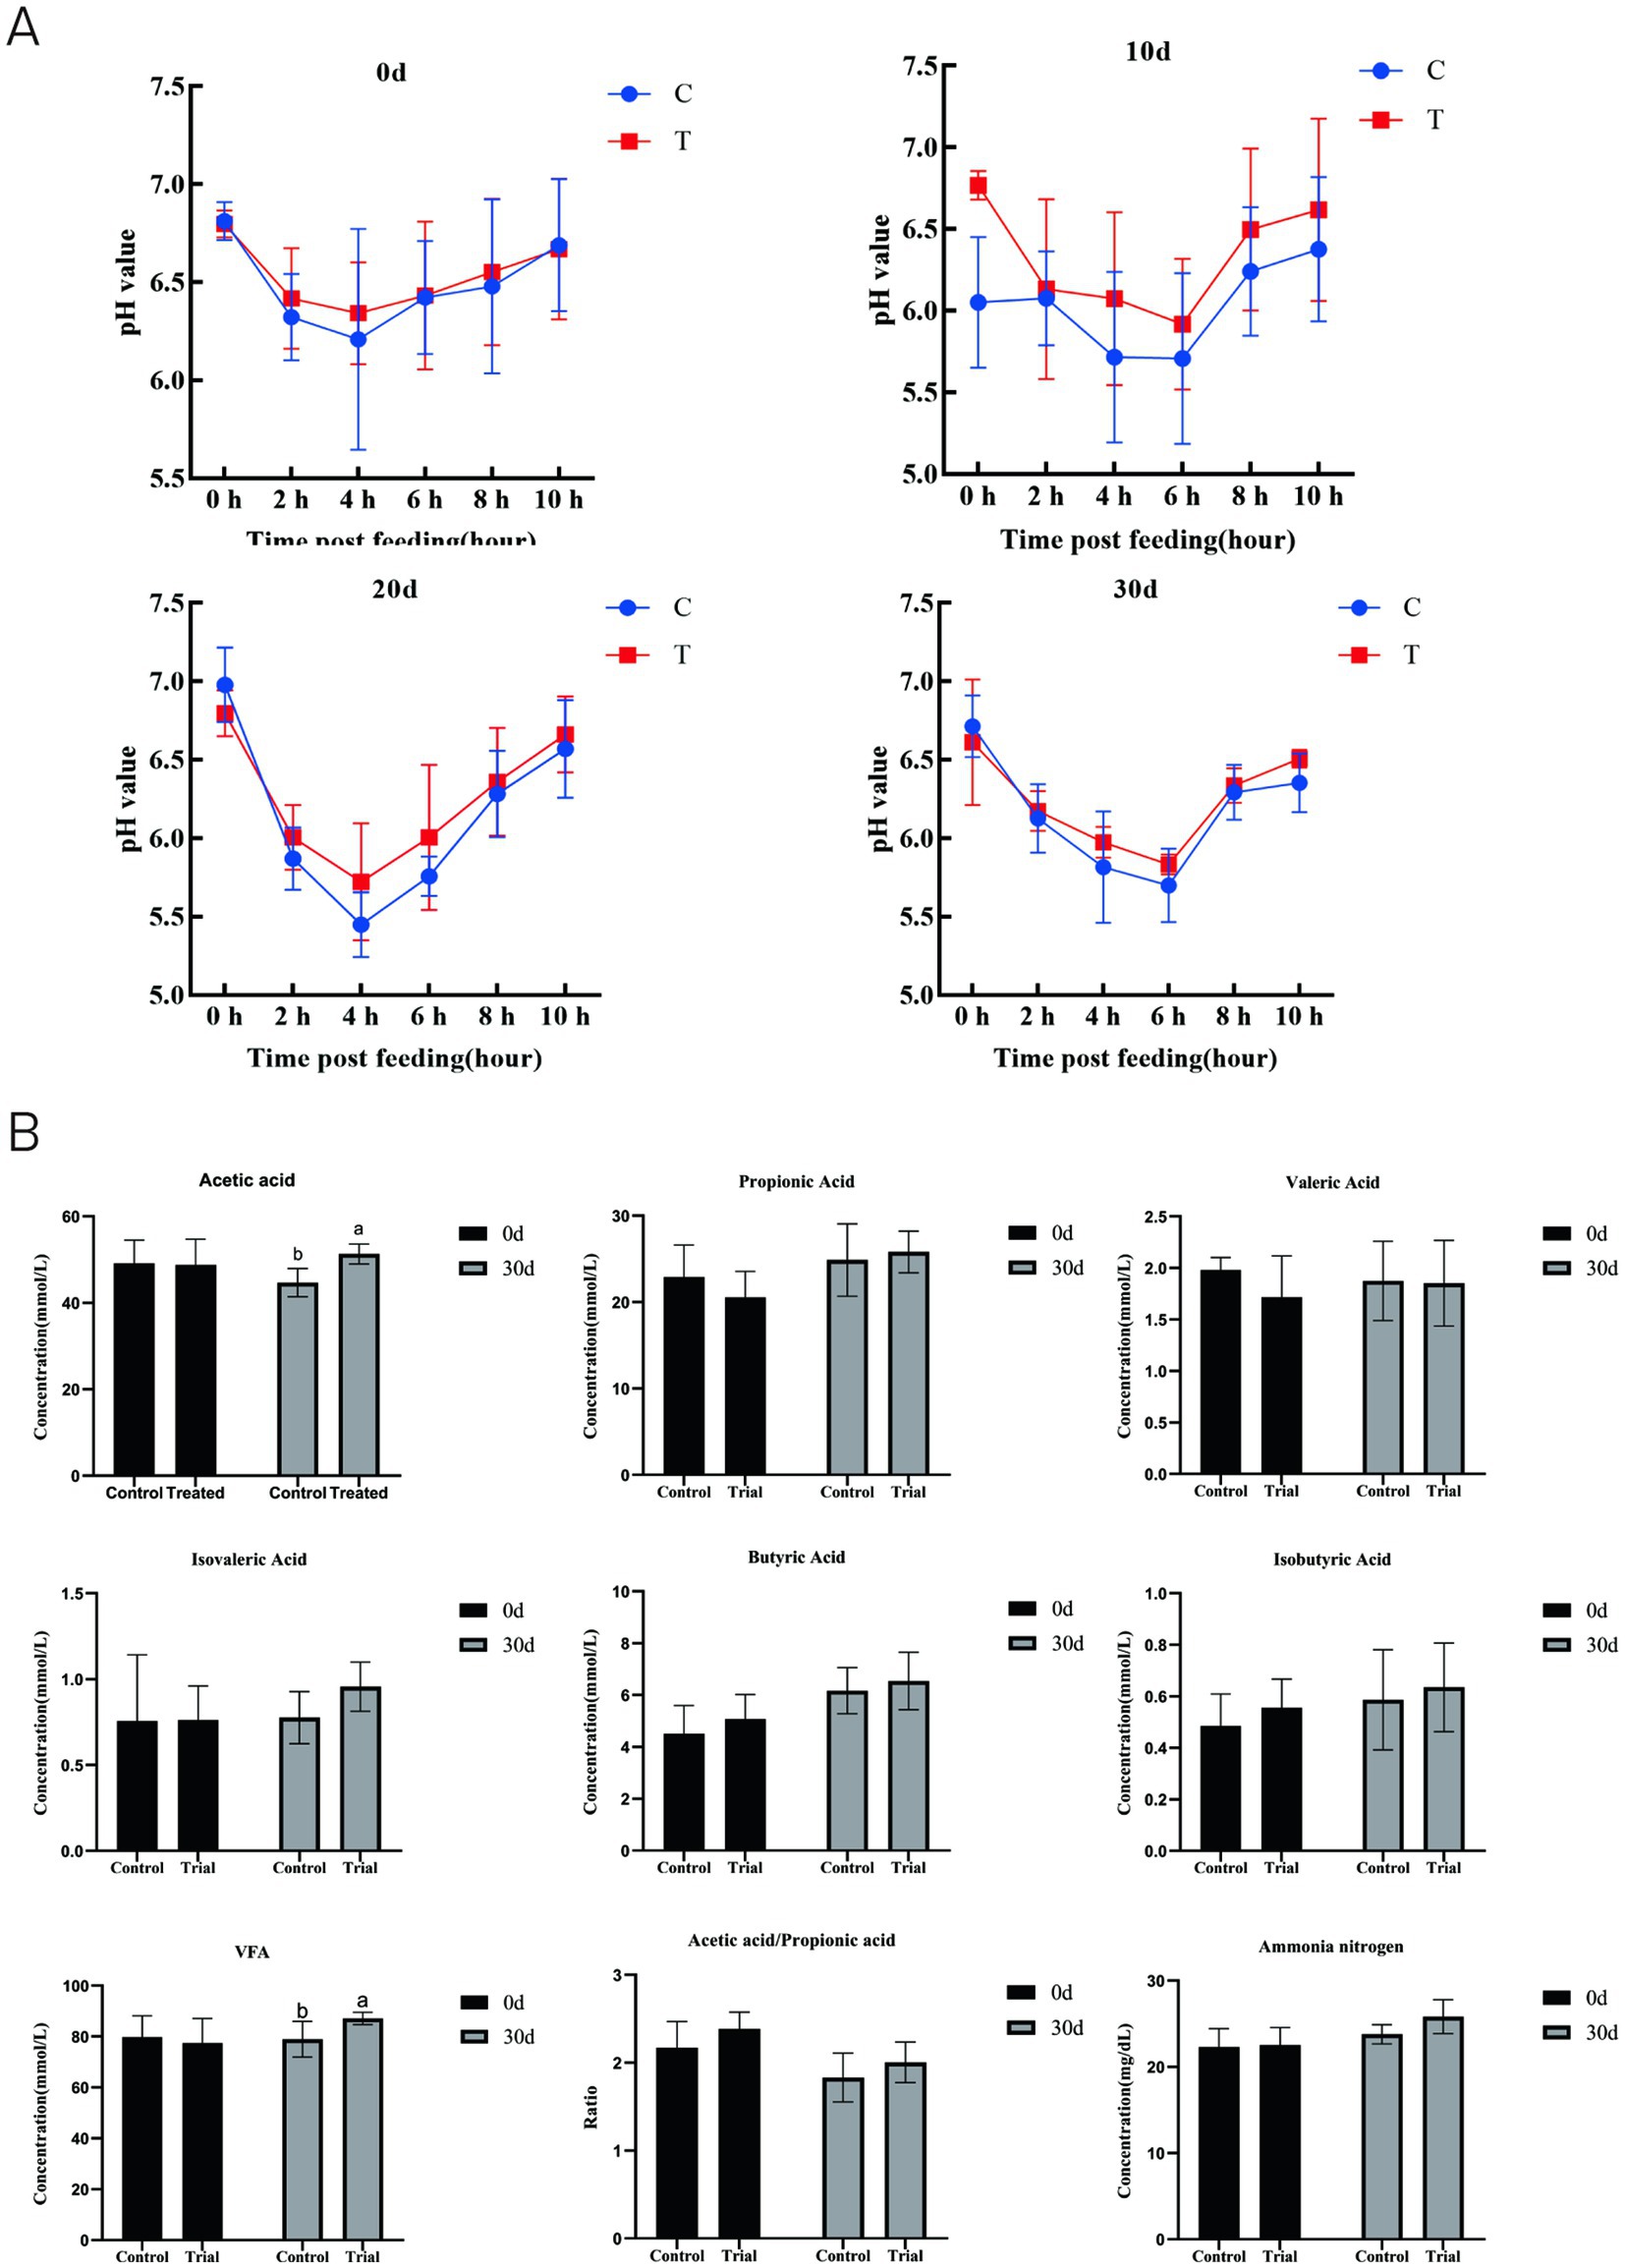
Figure 1. Dynamic changes in ruminal pH at different time points (A) and effects on ruminal VFA and ammonia nitrogen concentrations (B). a, b means within a figure with different superscripts differ significantly (p < 0.05).
3.2.2 Rumen VFA and ammonia nitrogen
On day 0, there were no significant differences in volatile fatty acid (VFA) or NH3–N concentrations between the two groups (p > 0.05, Figure 1B). By day 30, the acetate and total VFA concentrations in the trial group were significantly higher than those in the control group (p < 0.05), while the NH3–N level was 8.59% higher than that of the control, though this difference was not statistically significant (p > 0.05).
The postprandial ruminal VFA concentrations at different time points are shown in Figure 2. The acetate and total VFA concentrations in the trial group were significantly elevated at multiple time points (acetate: 0 h, 4 h, 8 h; total VFA: 0 h, 2 h, 4 h, 8 h) (p < 0.05). The acetate-to-propionate ratio was also significantly higher in the trial group (p < 0.05). Concentrations of other VFAs (propionate, butyrate, isobutyrate, valerate, isovalerate) showed an increasing trend, but the differences were not significant.
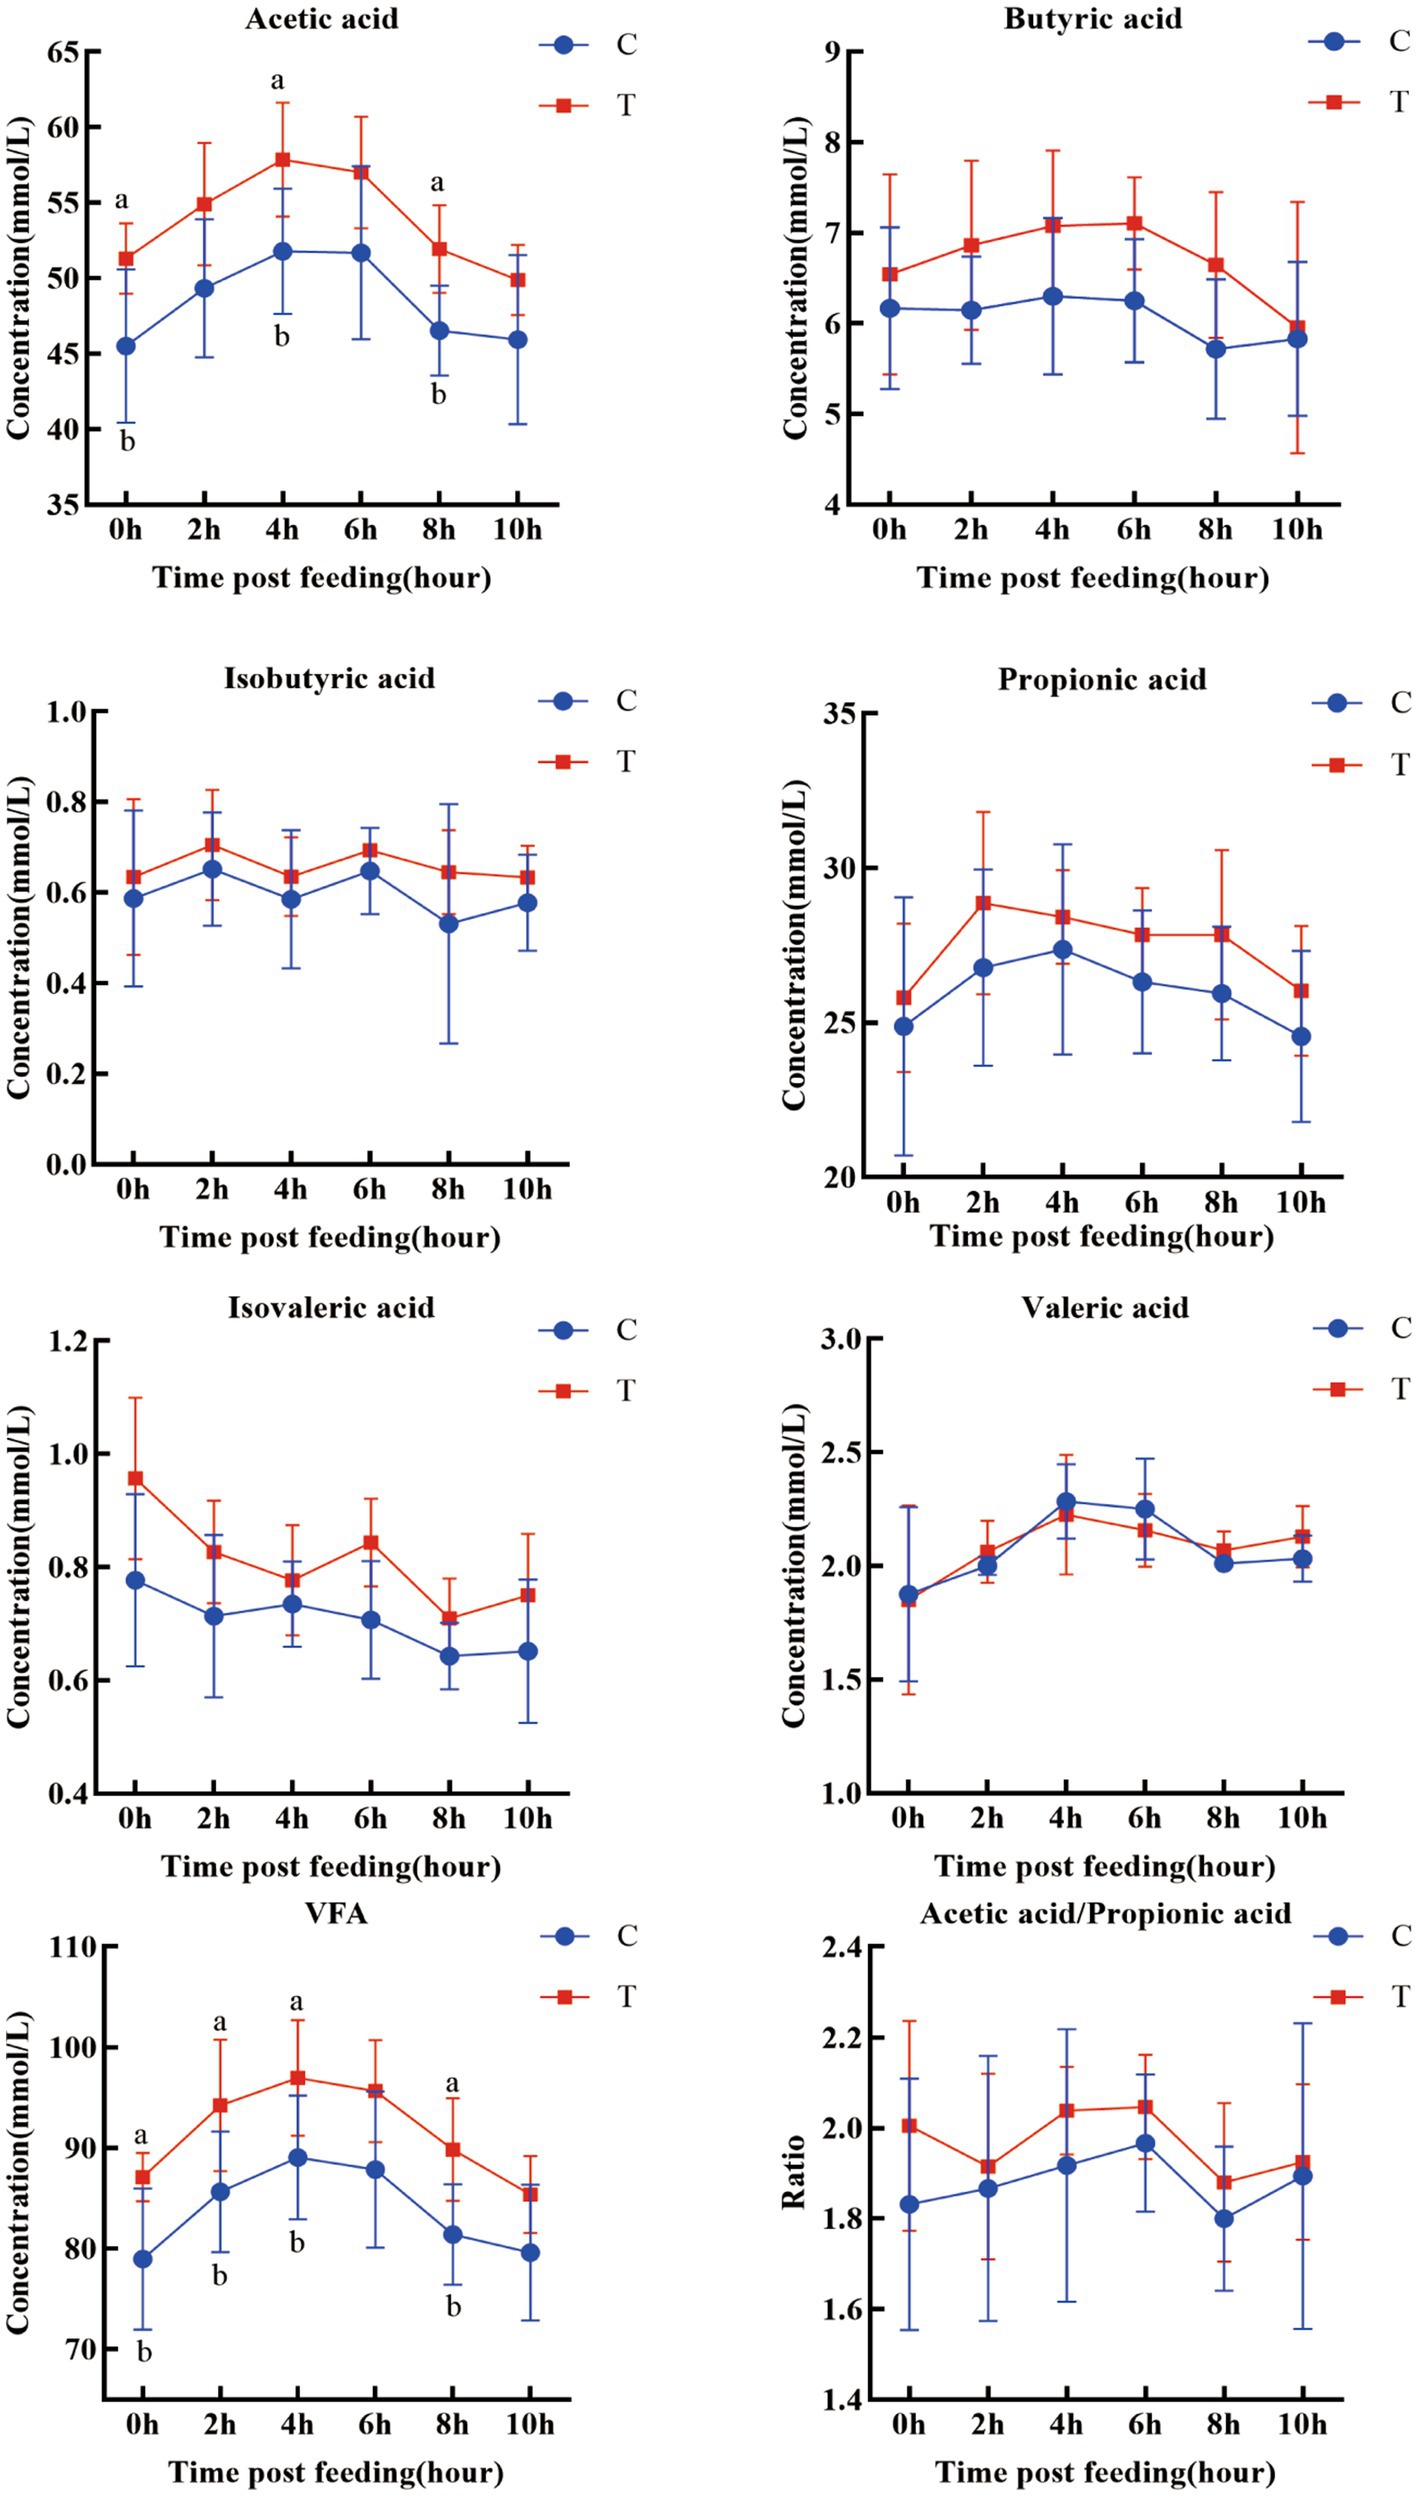
Figure 2. Temporal variations in ruminal VFAs at different time points. a, b means within a figure with different superscripts differ significantly (p < 0.05).
3.3 Rumen microbial communities
3.3.1 Alpha diversity of bacterial communities in rumen content
The alpha diversity of ruminal microbiota is illustrated in Figure 3. The sequencing coverage of all samples exceeded 99%, indicating sufficient sequencing depth (Figure 3B). The rarefaction curves plateaued, confirming adequate sequencing volume (Figure 3A). Venn diagram analysis revealed that the number of unique OTUs in the trial group (1,363) was greater than that in the control group (1,311), suggesting a potential increase in species richness (Figure 3C). However, no significant differences were observed in the alpha diversity indices (Chao1, Shannon, Simpson) between groups (p > 0.05), indicating that overall microbial diversity and evenness remained unchanged.
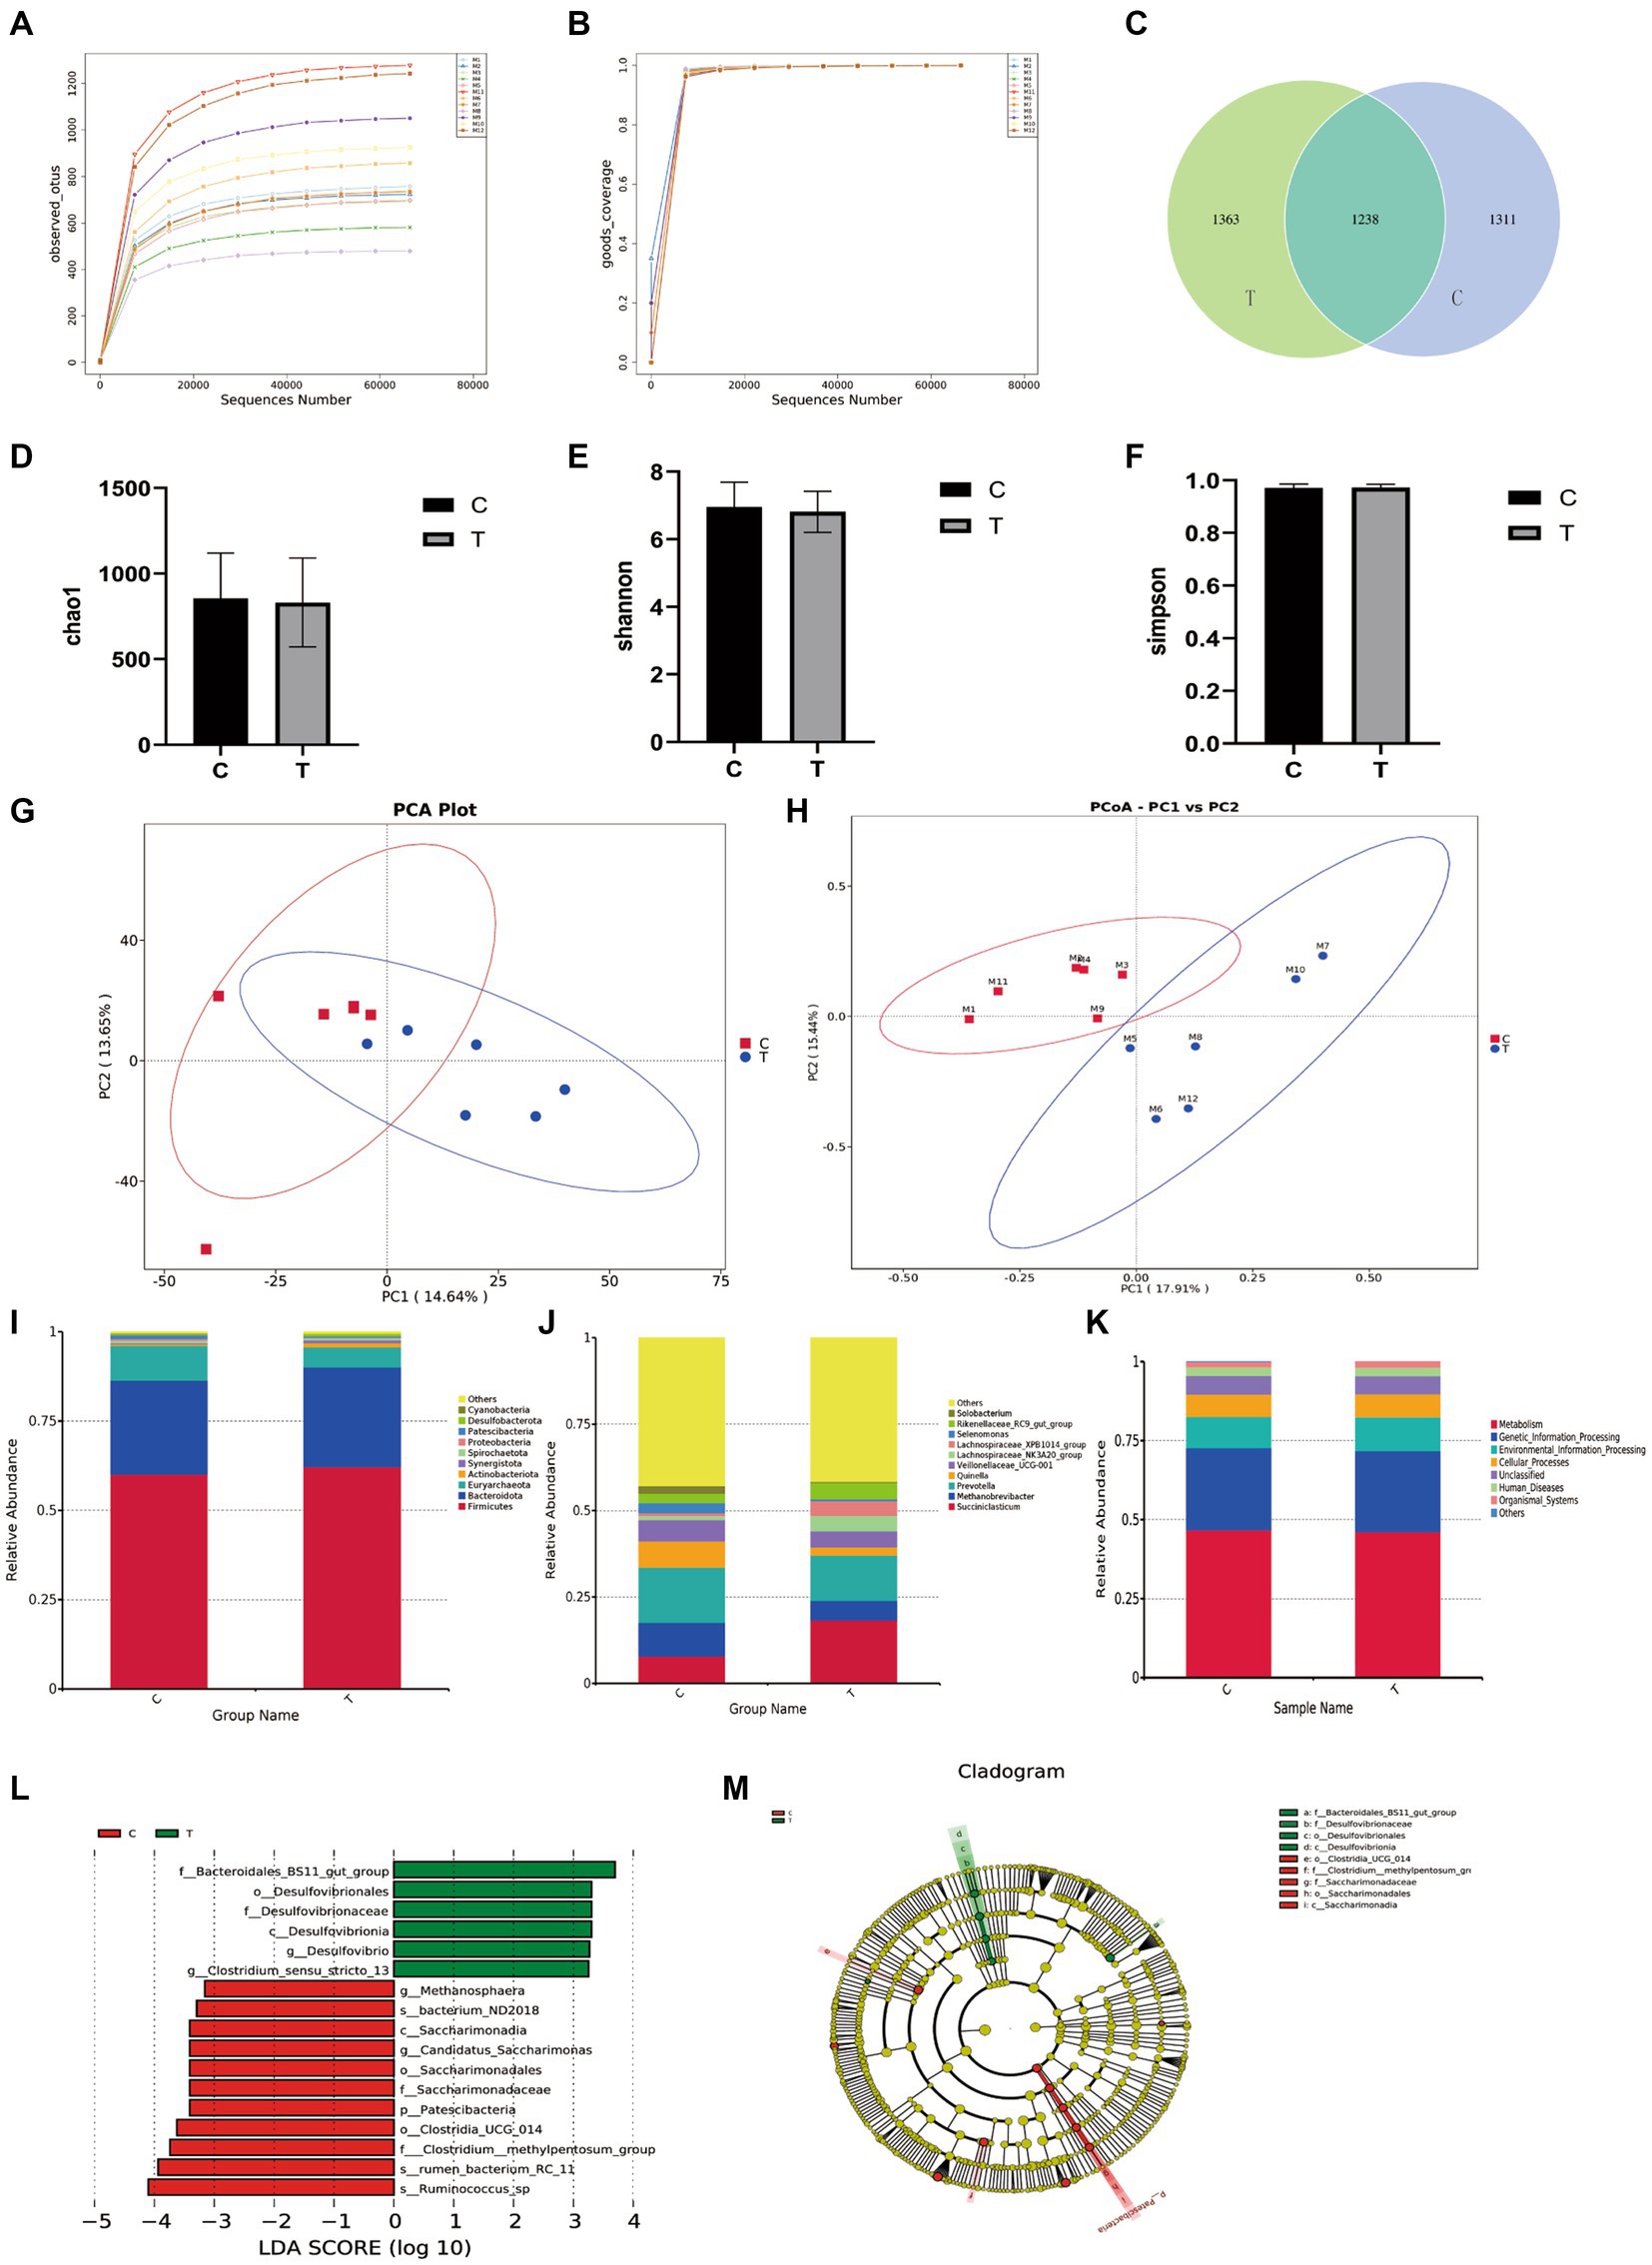
Figure 3. Rumen microbiota results. (A) Rarefaction curves of observed species; (B) Coverage; (C) Venn diagram; (D) Chao1 richness estimator; (E) Shannon index; (F) Simpson index; (G) Principal component analysis (PCA); (H) Principal coordinate analysis (PCoA); (I) Phylum level; (J) Genus level; (K) Functional prediction analysis; (L,M) LEfSe cladogram.
3.3.2 Relative abundance of rumen microbiota
At the genus level, detectable taxa in the rumen microbiota included Succiniclasticum, Methanobrevibacter, Prevotella, Quinella, Veillonellaceae_UCG-001, Lachnospiraceae_NK3A20_group, Lachnospiraceae_XPB1014_group, Selenomonas, Rikenellaceae_RC9_gut_group, Solobacterium, with other genera present at low abundance. Compared to the control group, the trial group exhibited: Significantly increased relative abundance of Succiniclasticum (p < 0.05). Non-significant increasing trends (p > 0.05) in Lachnospiraceae_NK3A20_group, Lachnospiraceae_XPB1014_group, and Rikenellaceae_RC9_gut_group. Nonsignificant decreasing trends (p > 0.05) in Methanobrevibacter, Prevotella, Veillonellaceae_UCG-001, Selenomonas, and Solobacterium.
At the phylum level, bacterial phyla detected in the rumen content of sheep included Firmicutes, Bacteroidota, Euryarchaeota, Actinobacteriota, Synergistota, Spirochaetota, Proteobacteria, Patescibacteria, Desulfobacterota, and Cyanobacteria, among others. Compared to the control group, the trial group exhibited a significantly lower relative abundance of Patescibacteria (p < 0.05). Changes in the relative abundances of the other phyla were not statistically significant.
At the genus level, detectable genera in the rumen microbiota included Succiniclasticum, Methanobrevibacter, Prevotella, and others. Compared to the control group, the trial group showed a significantly increased relative abundance of Succiniclasticum (p < 0.05). Non-significant trends of increase or decrease were observed for other genera such as those within Lachnospiraceae.
3.3.3 LEfSe analysis of bacterial communities in rumen content
The LEfSe analysis of bacterial communities in sheep rumen contents revealed significant dominant taxa in the trial group (Figure 3). The LDA scores indicated that the trial group exhibited notable enrichment in the following taxa at specific classification levels: Bacteroidales_BS11_gut_group, Desulfovibrionales, Desulfovibrionaceae, Desulfovibrionia, Clostridium_sensu_stricto_13, and Desulfovibrio. Additionally, the trial group showed dominance in bacterium_ND2018, Saccharimonadia, Candidatus_Saccharimonas, Saccharimonadales, Saccharimonadaceae, Patescibacteria, Clostridia_UCG_014 (class), Clostridium__methylpentosum_group, RC-11rumen_bacterium_RC_11, and Ruminococcus_sp.
Tax4Fun functional prediction indicated that metabolic pathways represented the most abundant functional category, followed by other categories including genetic information processing and environmental information processing. However, no significant differences were observed between the experimental and control groups in these functional categories (p > 0.05).
3.4 Rumen metabolome
3.4.1 LC–MS-based quality analysis of metabolite samples
The quality control (QC) chart for the metabolite sample quality analysis is presented in Figure 4. The correlations of QC samples exceeded 0.99 in both positive and negative ion modes. These results indicate high stability of the metabolite detection process and superior data quality, fulfilling the prerequisites for subsequent research data analysis.
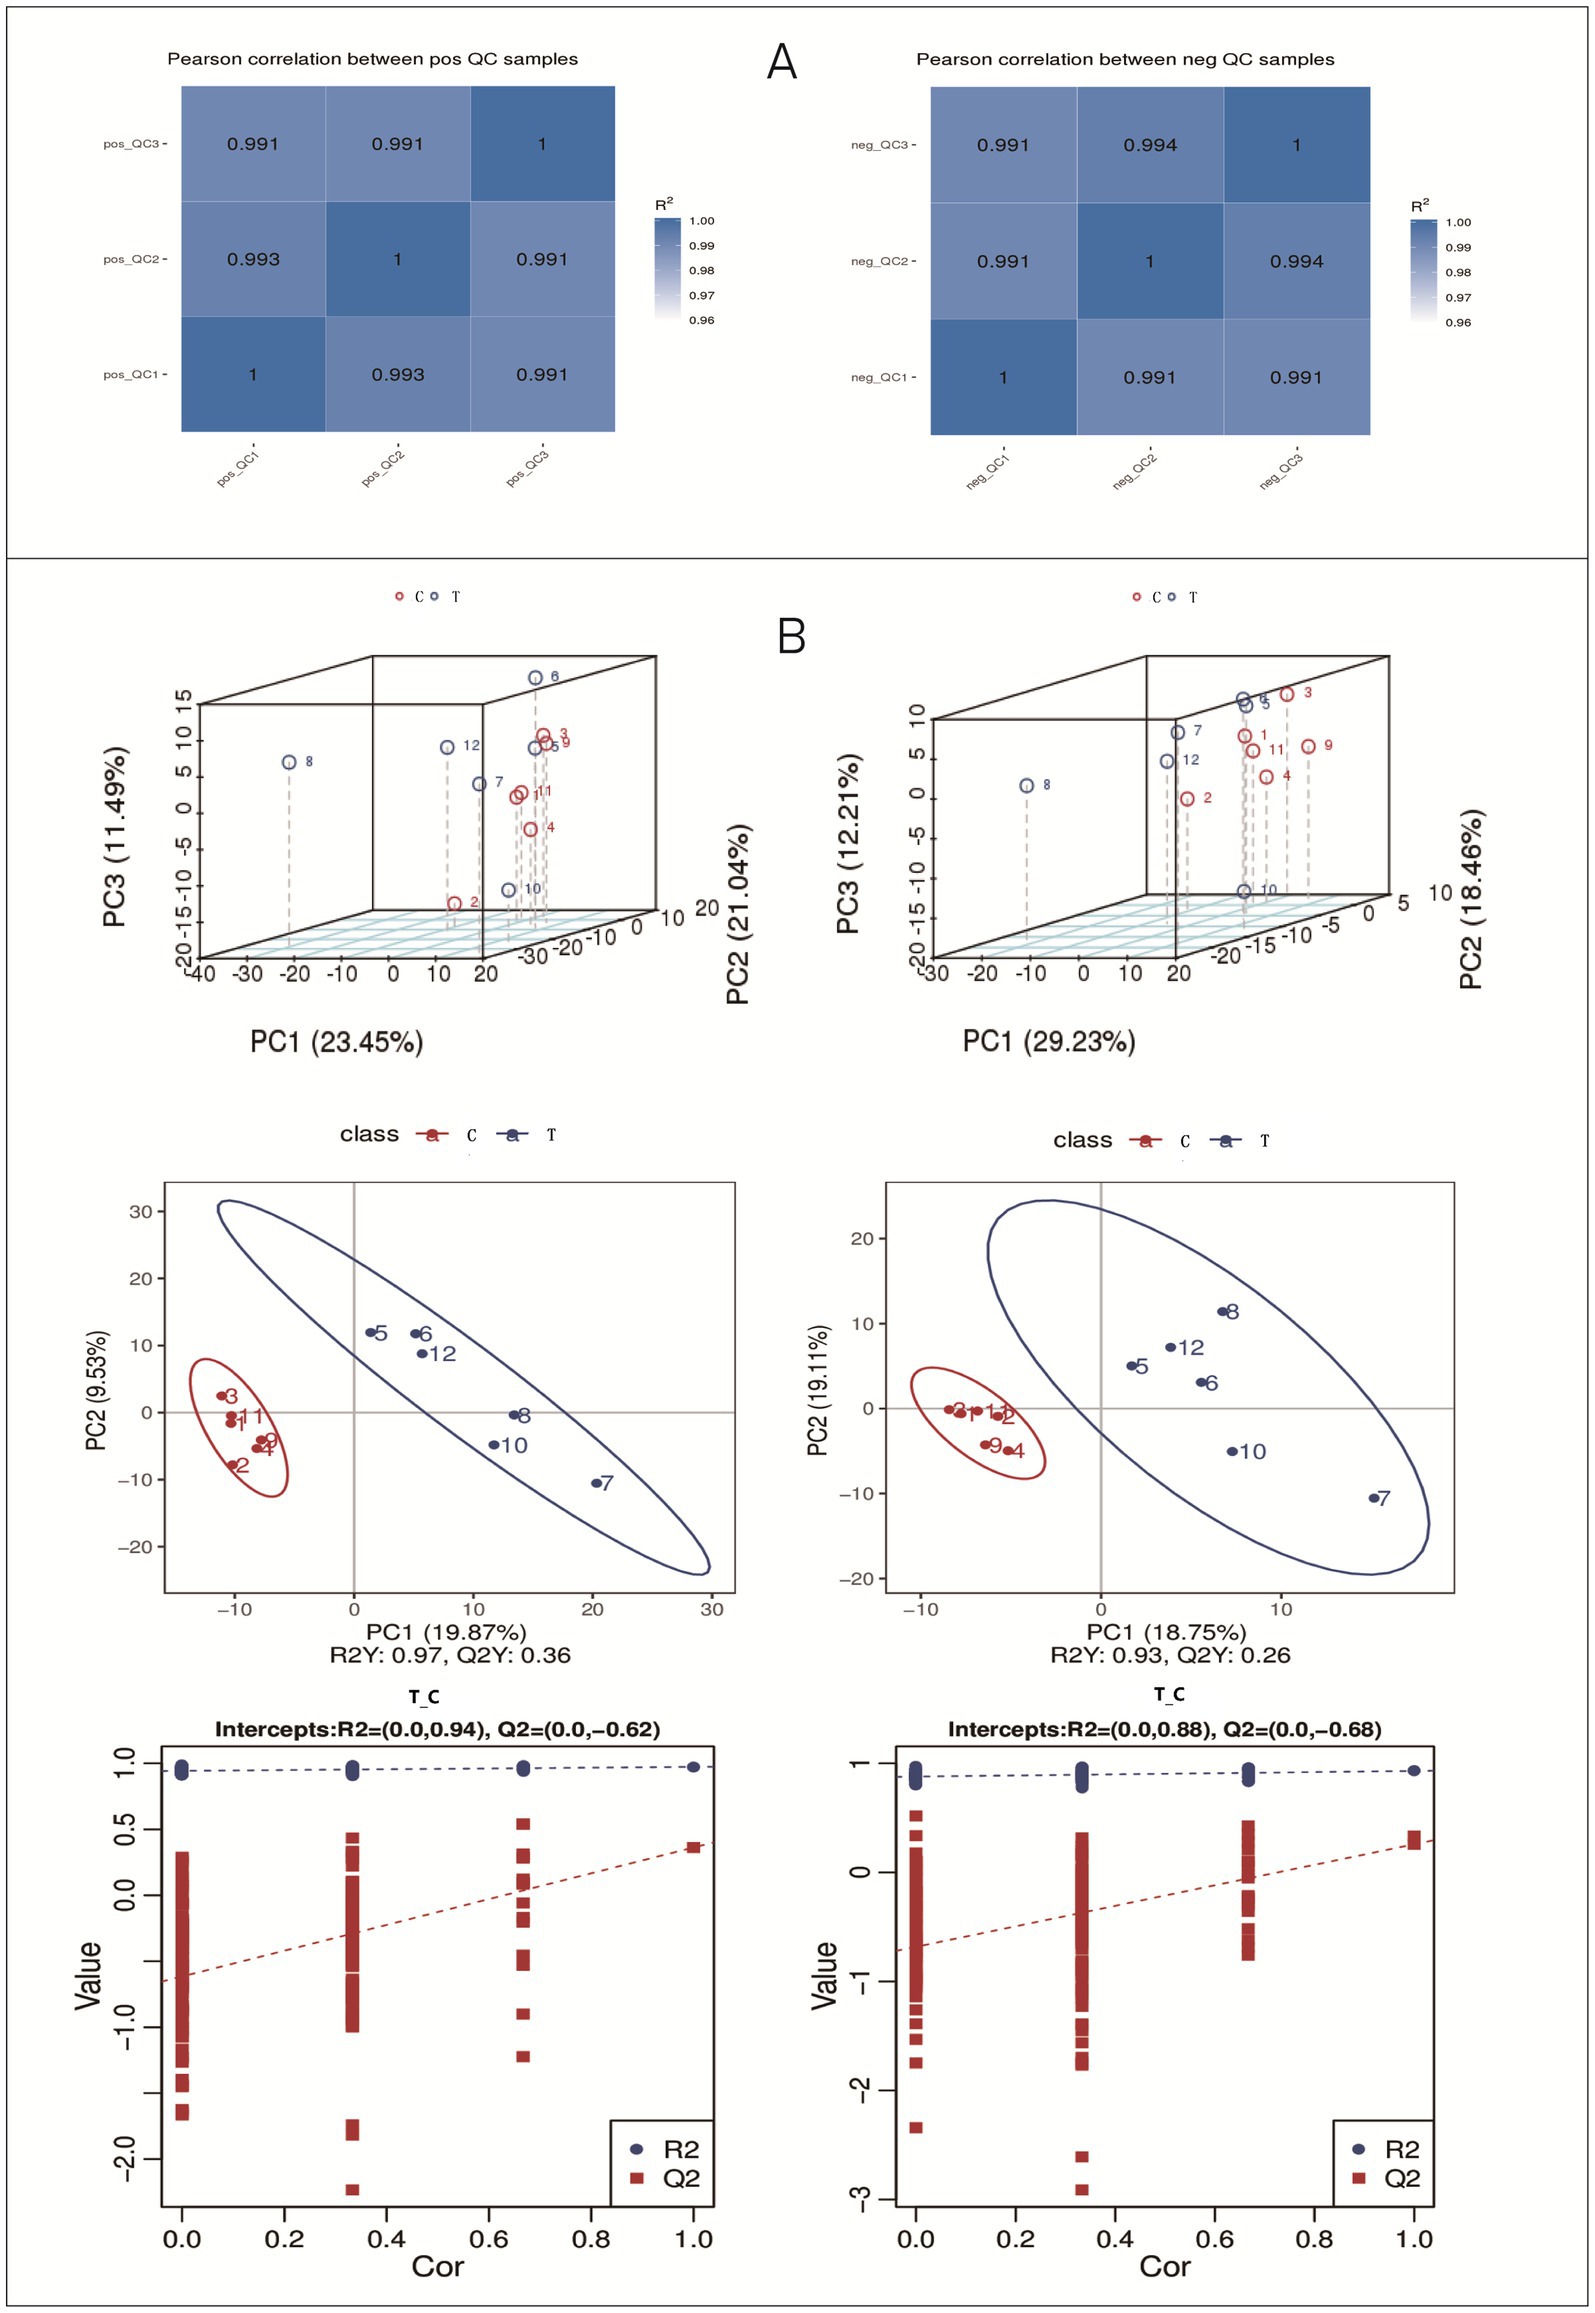
Figure 4. Results of QC sample correlation and PCA analysis. (A) Positive ion mode; (B) Negative ion mode.
3.4.2 Multivariate analysis of rumen metabolome
The PCA results (Figure 4.) of the total samples revealed that in the positive ion mode, the contribution rates of PC1, PC2, and PC3 were 23.45, 21.04, and 11.49%, respectively. In the negative ion mode, the contribution rates of PC1, PC2, and PC3 were 29.23, 18.46, and 12.21%, respectively.
As shown in Figure 4, the PLS-DA model clearly distinguished the metabolomic profiles between the two groups, with high model validity (R2Y and Q2 values; intercept of the Q2 regression line < 0), indicating that the model is reliable and not overfitted.
3.4.3 Composition of metabolites
The classification of rumen metabolites in positive (A) and negative (B) ion modes is shown in Figure 5. In positive ion mode, 10 categories were identified, dominated by lipids and lipid-like molecules (34.59%), organic acids and derivatives (23.53%), and heterocyclic compounds (16.71%). In negative ion mode, 8 categories were identified, primarily lipids and lipid-like molecules (38.87%), organic acids and derivatives (18.94%), and heterocyclic compounds (10.63%).
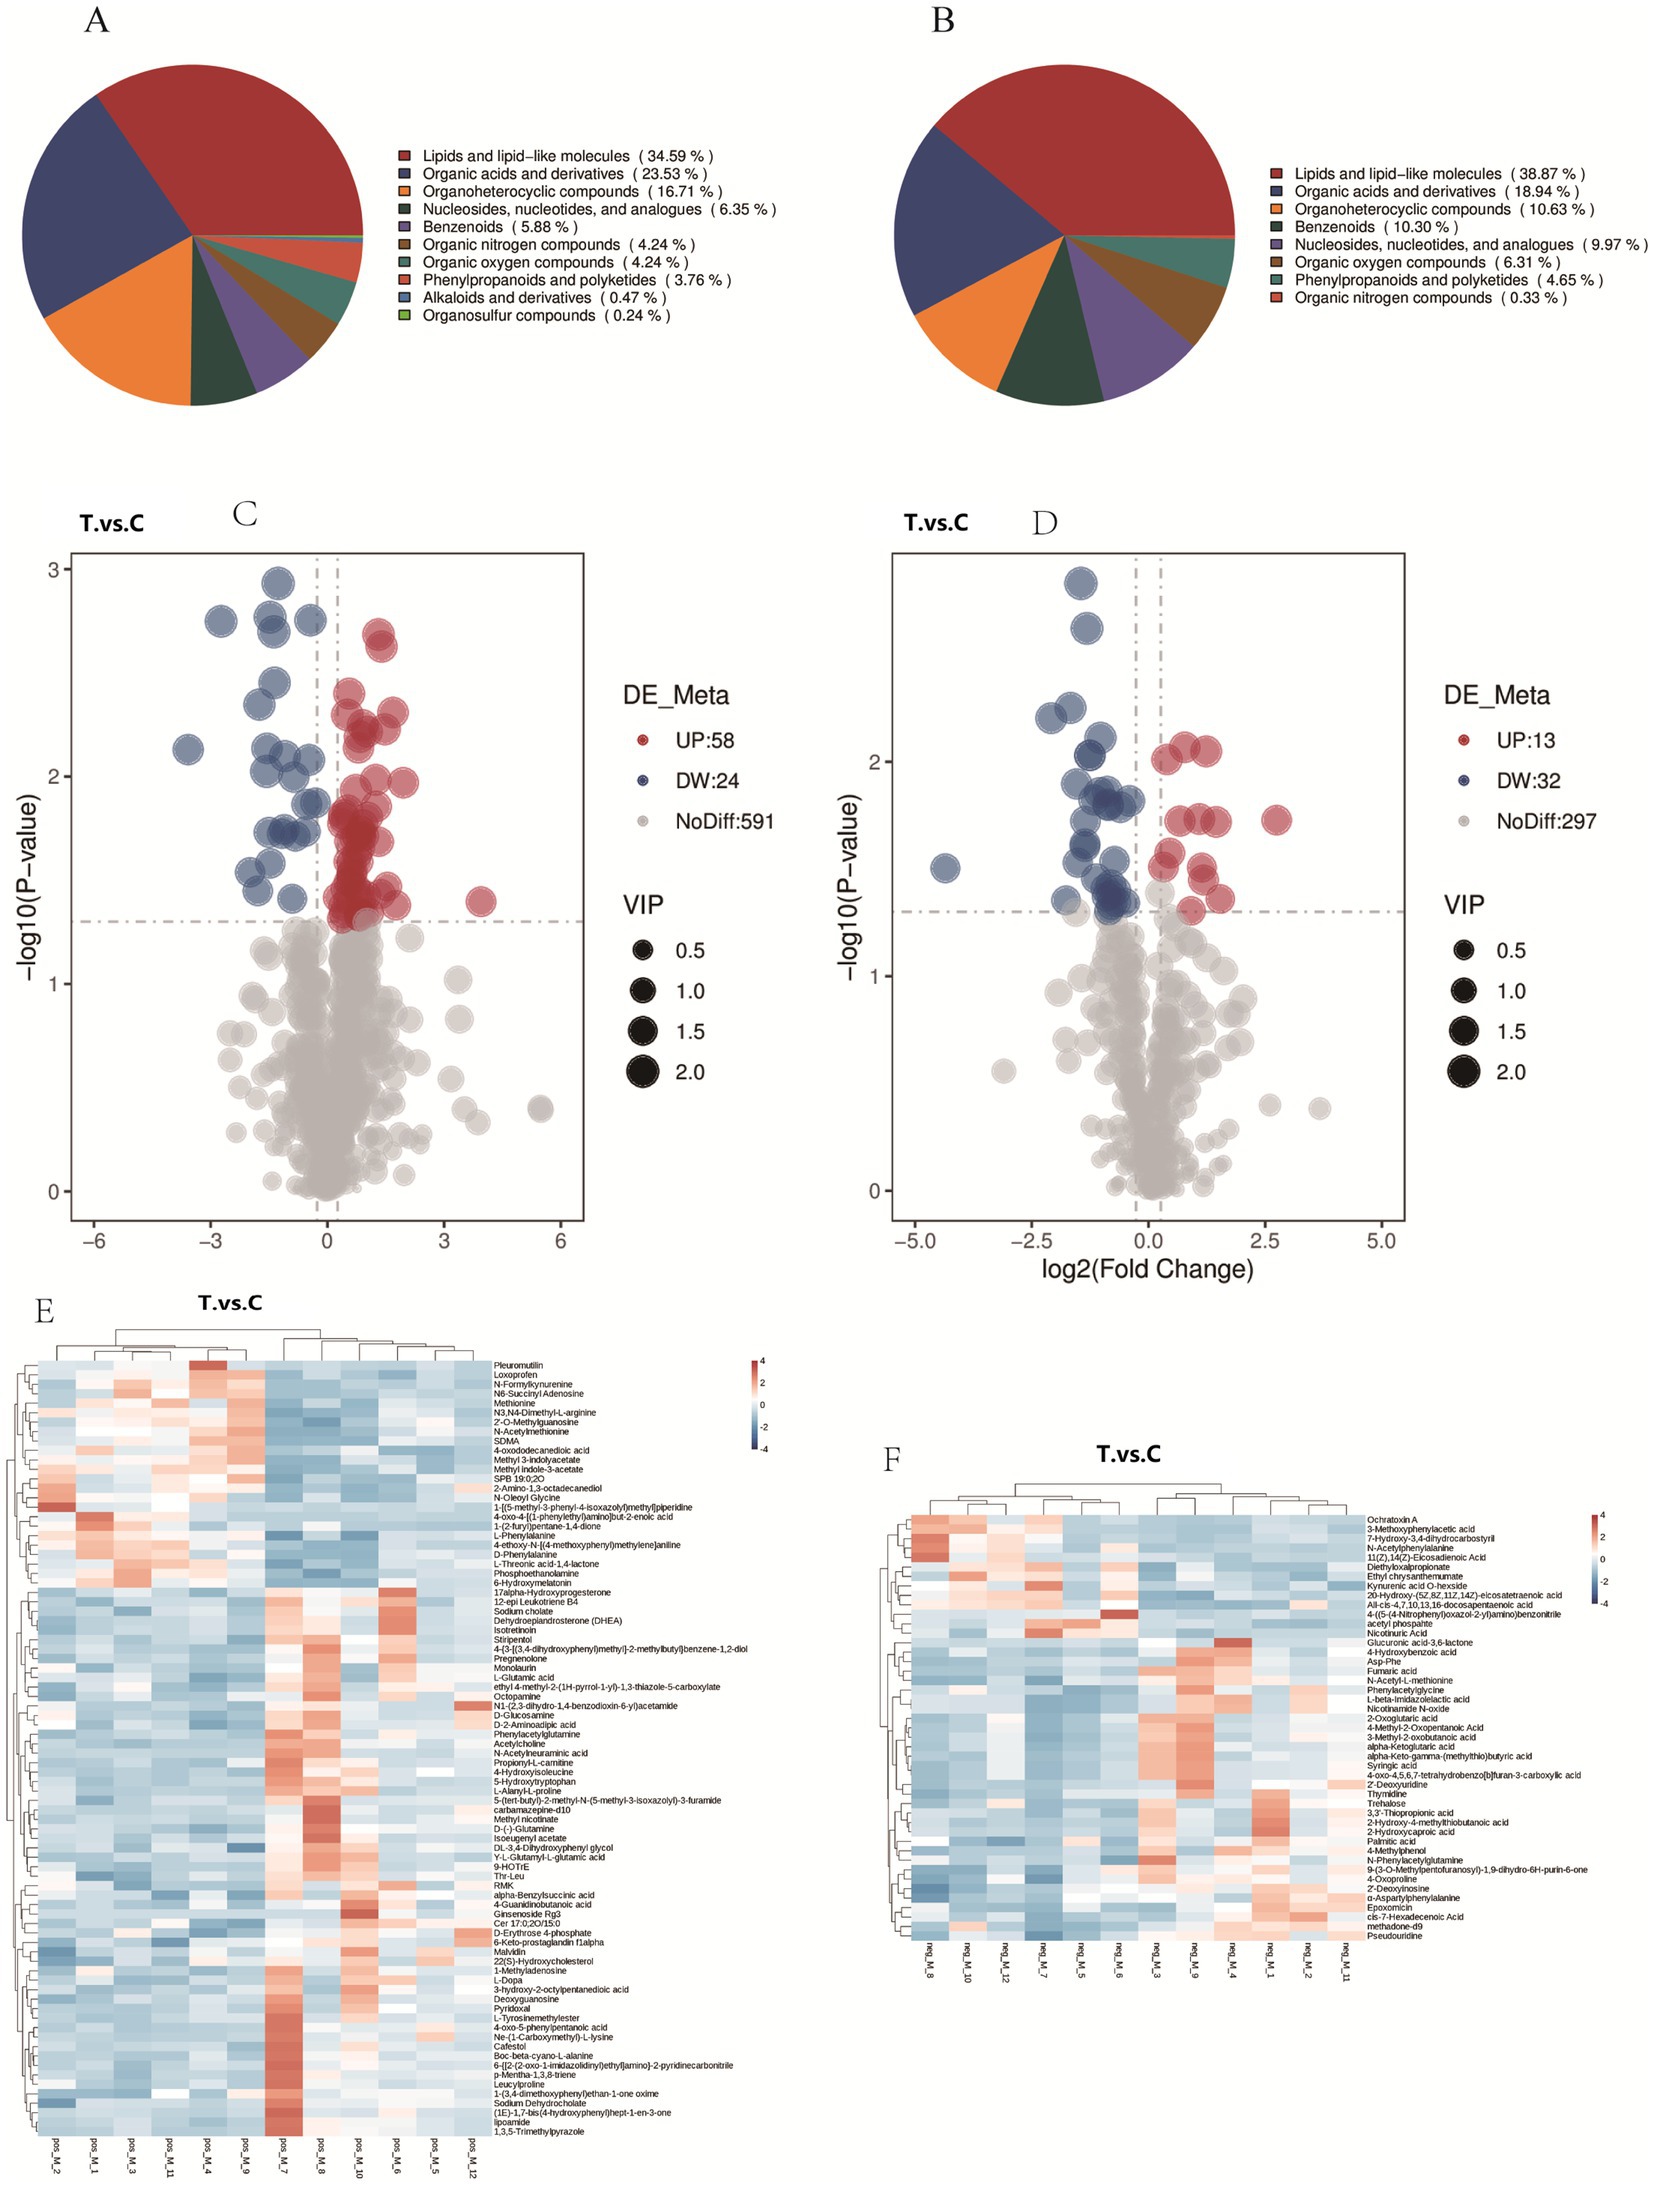
Figure 5. Analysis of rumen metabolites in positive and negative ion modes: proportional distribution (A,B), Metabolite profiles (C,D), and Cluster analysis (E,F).
3.4.4 Screening of differential metabolites
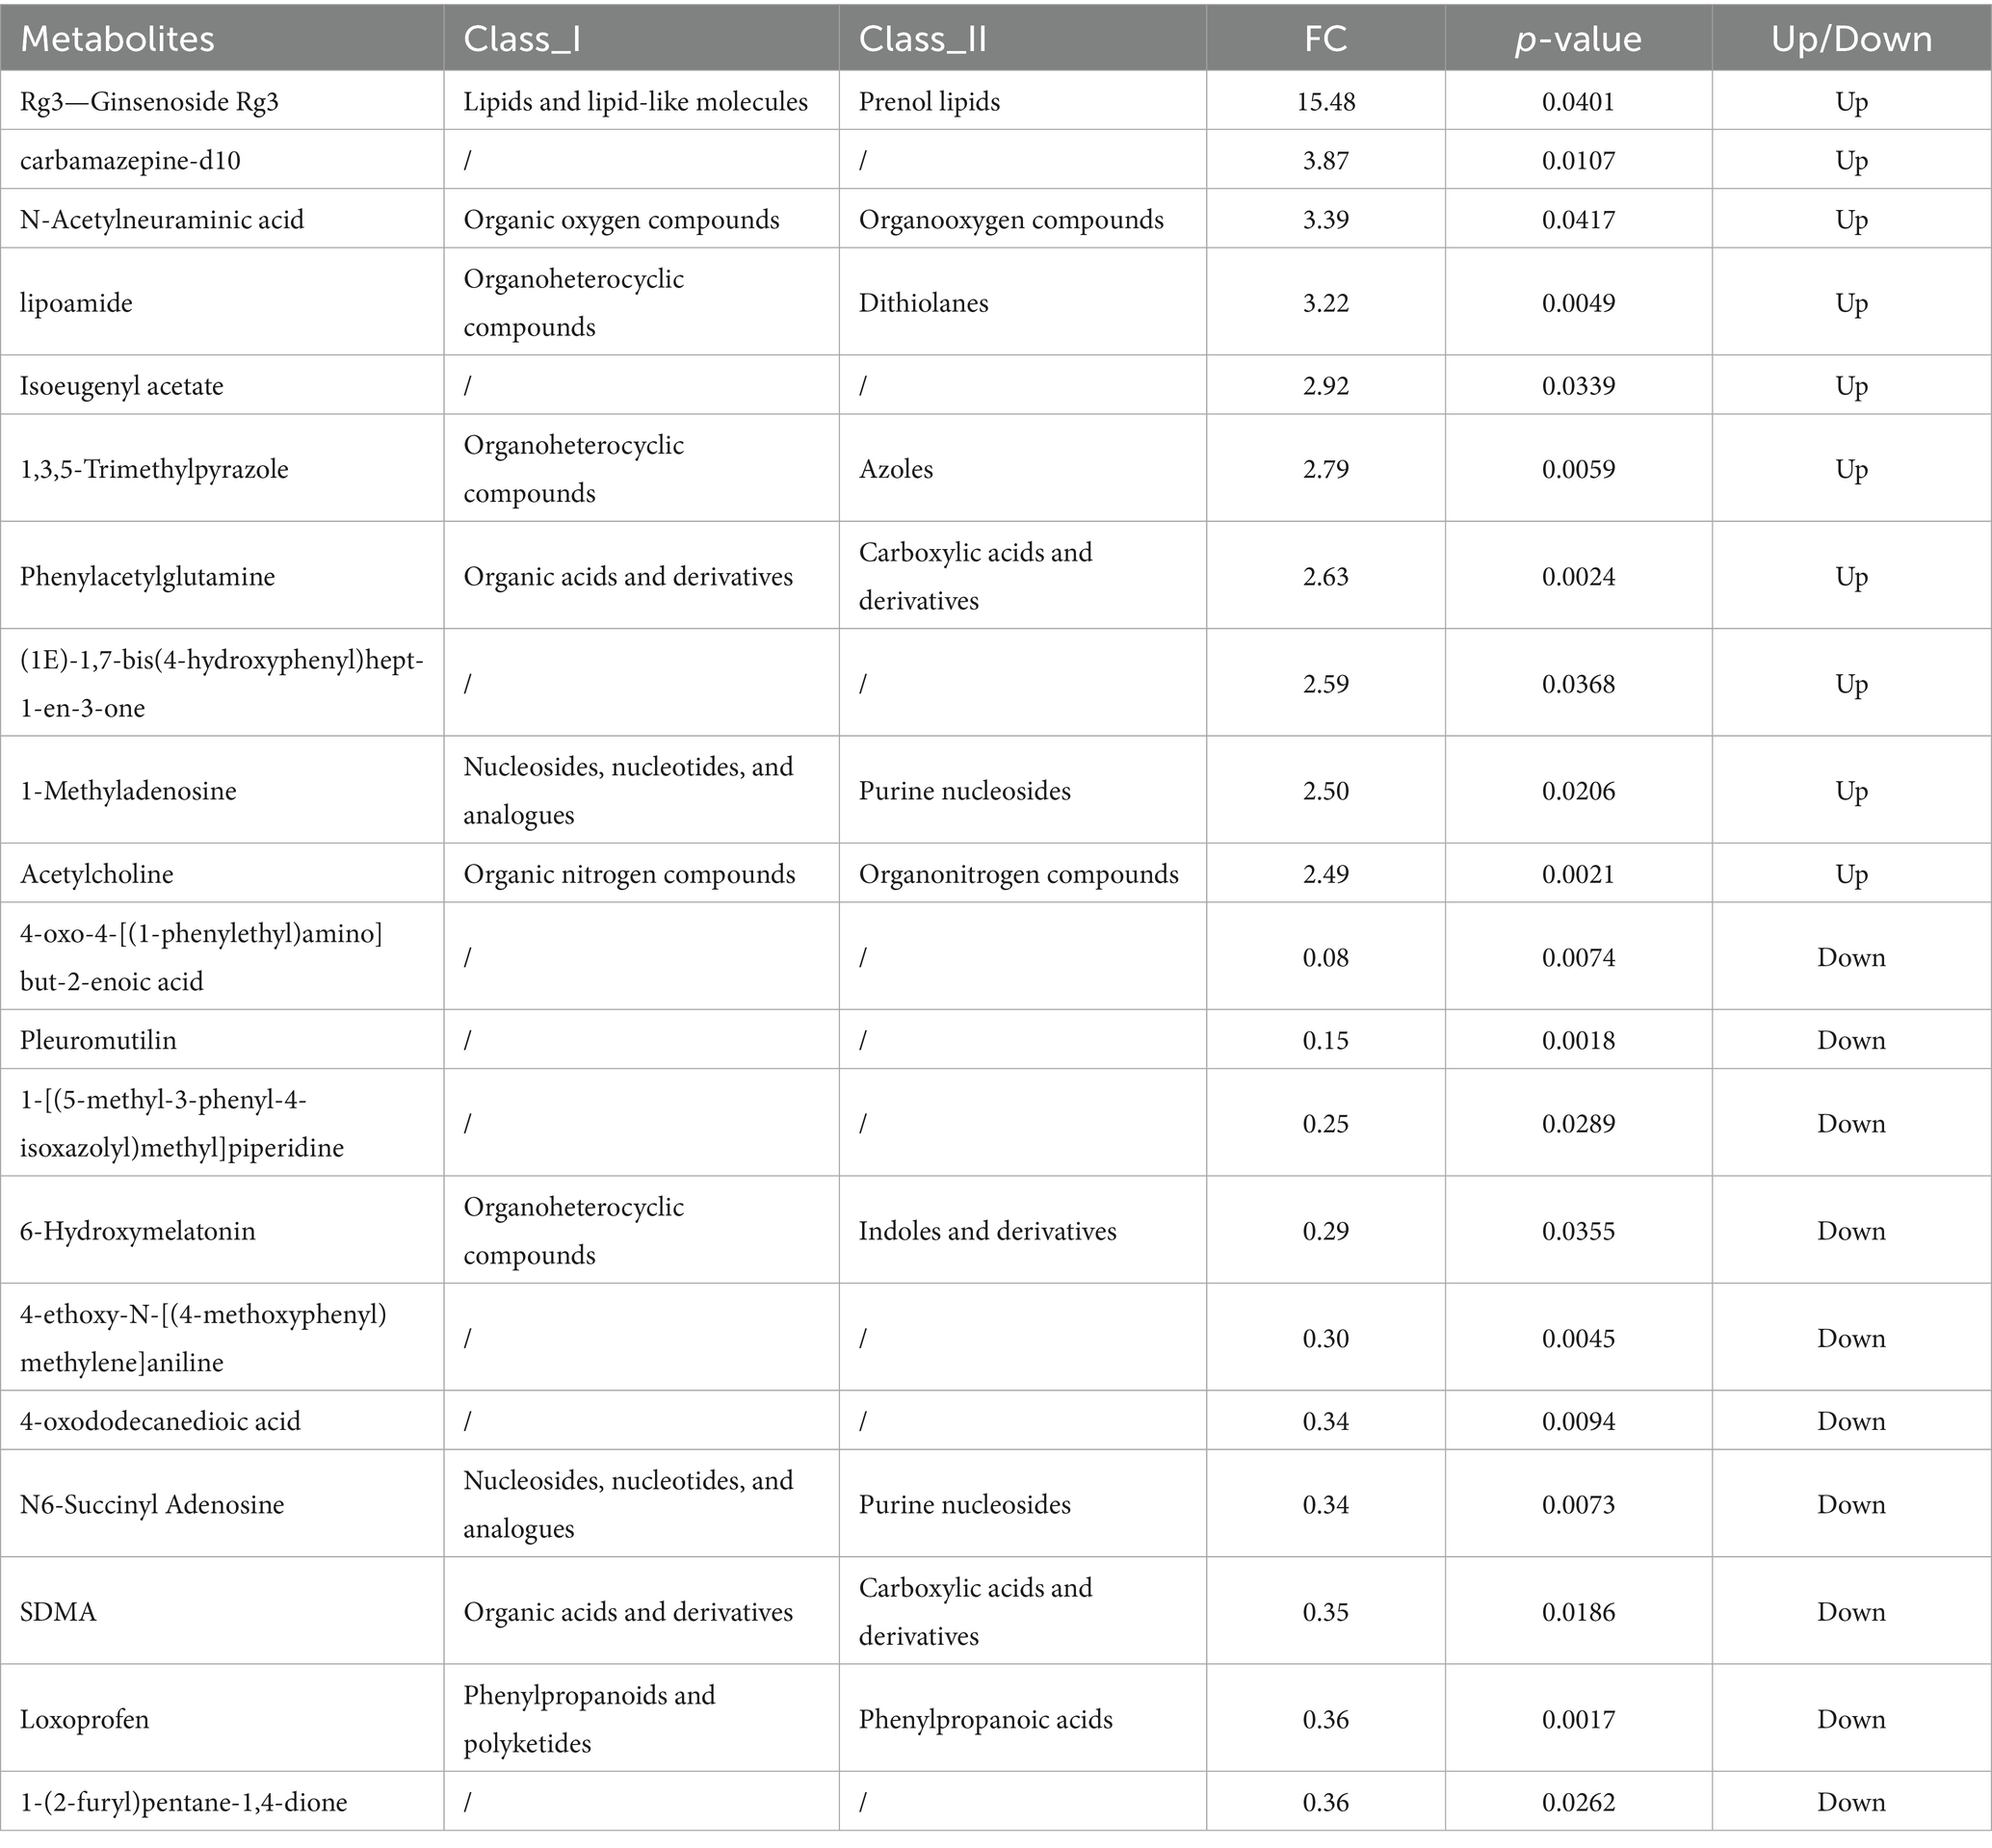
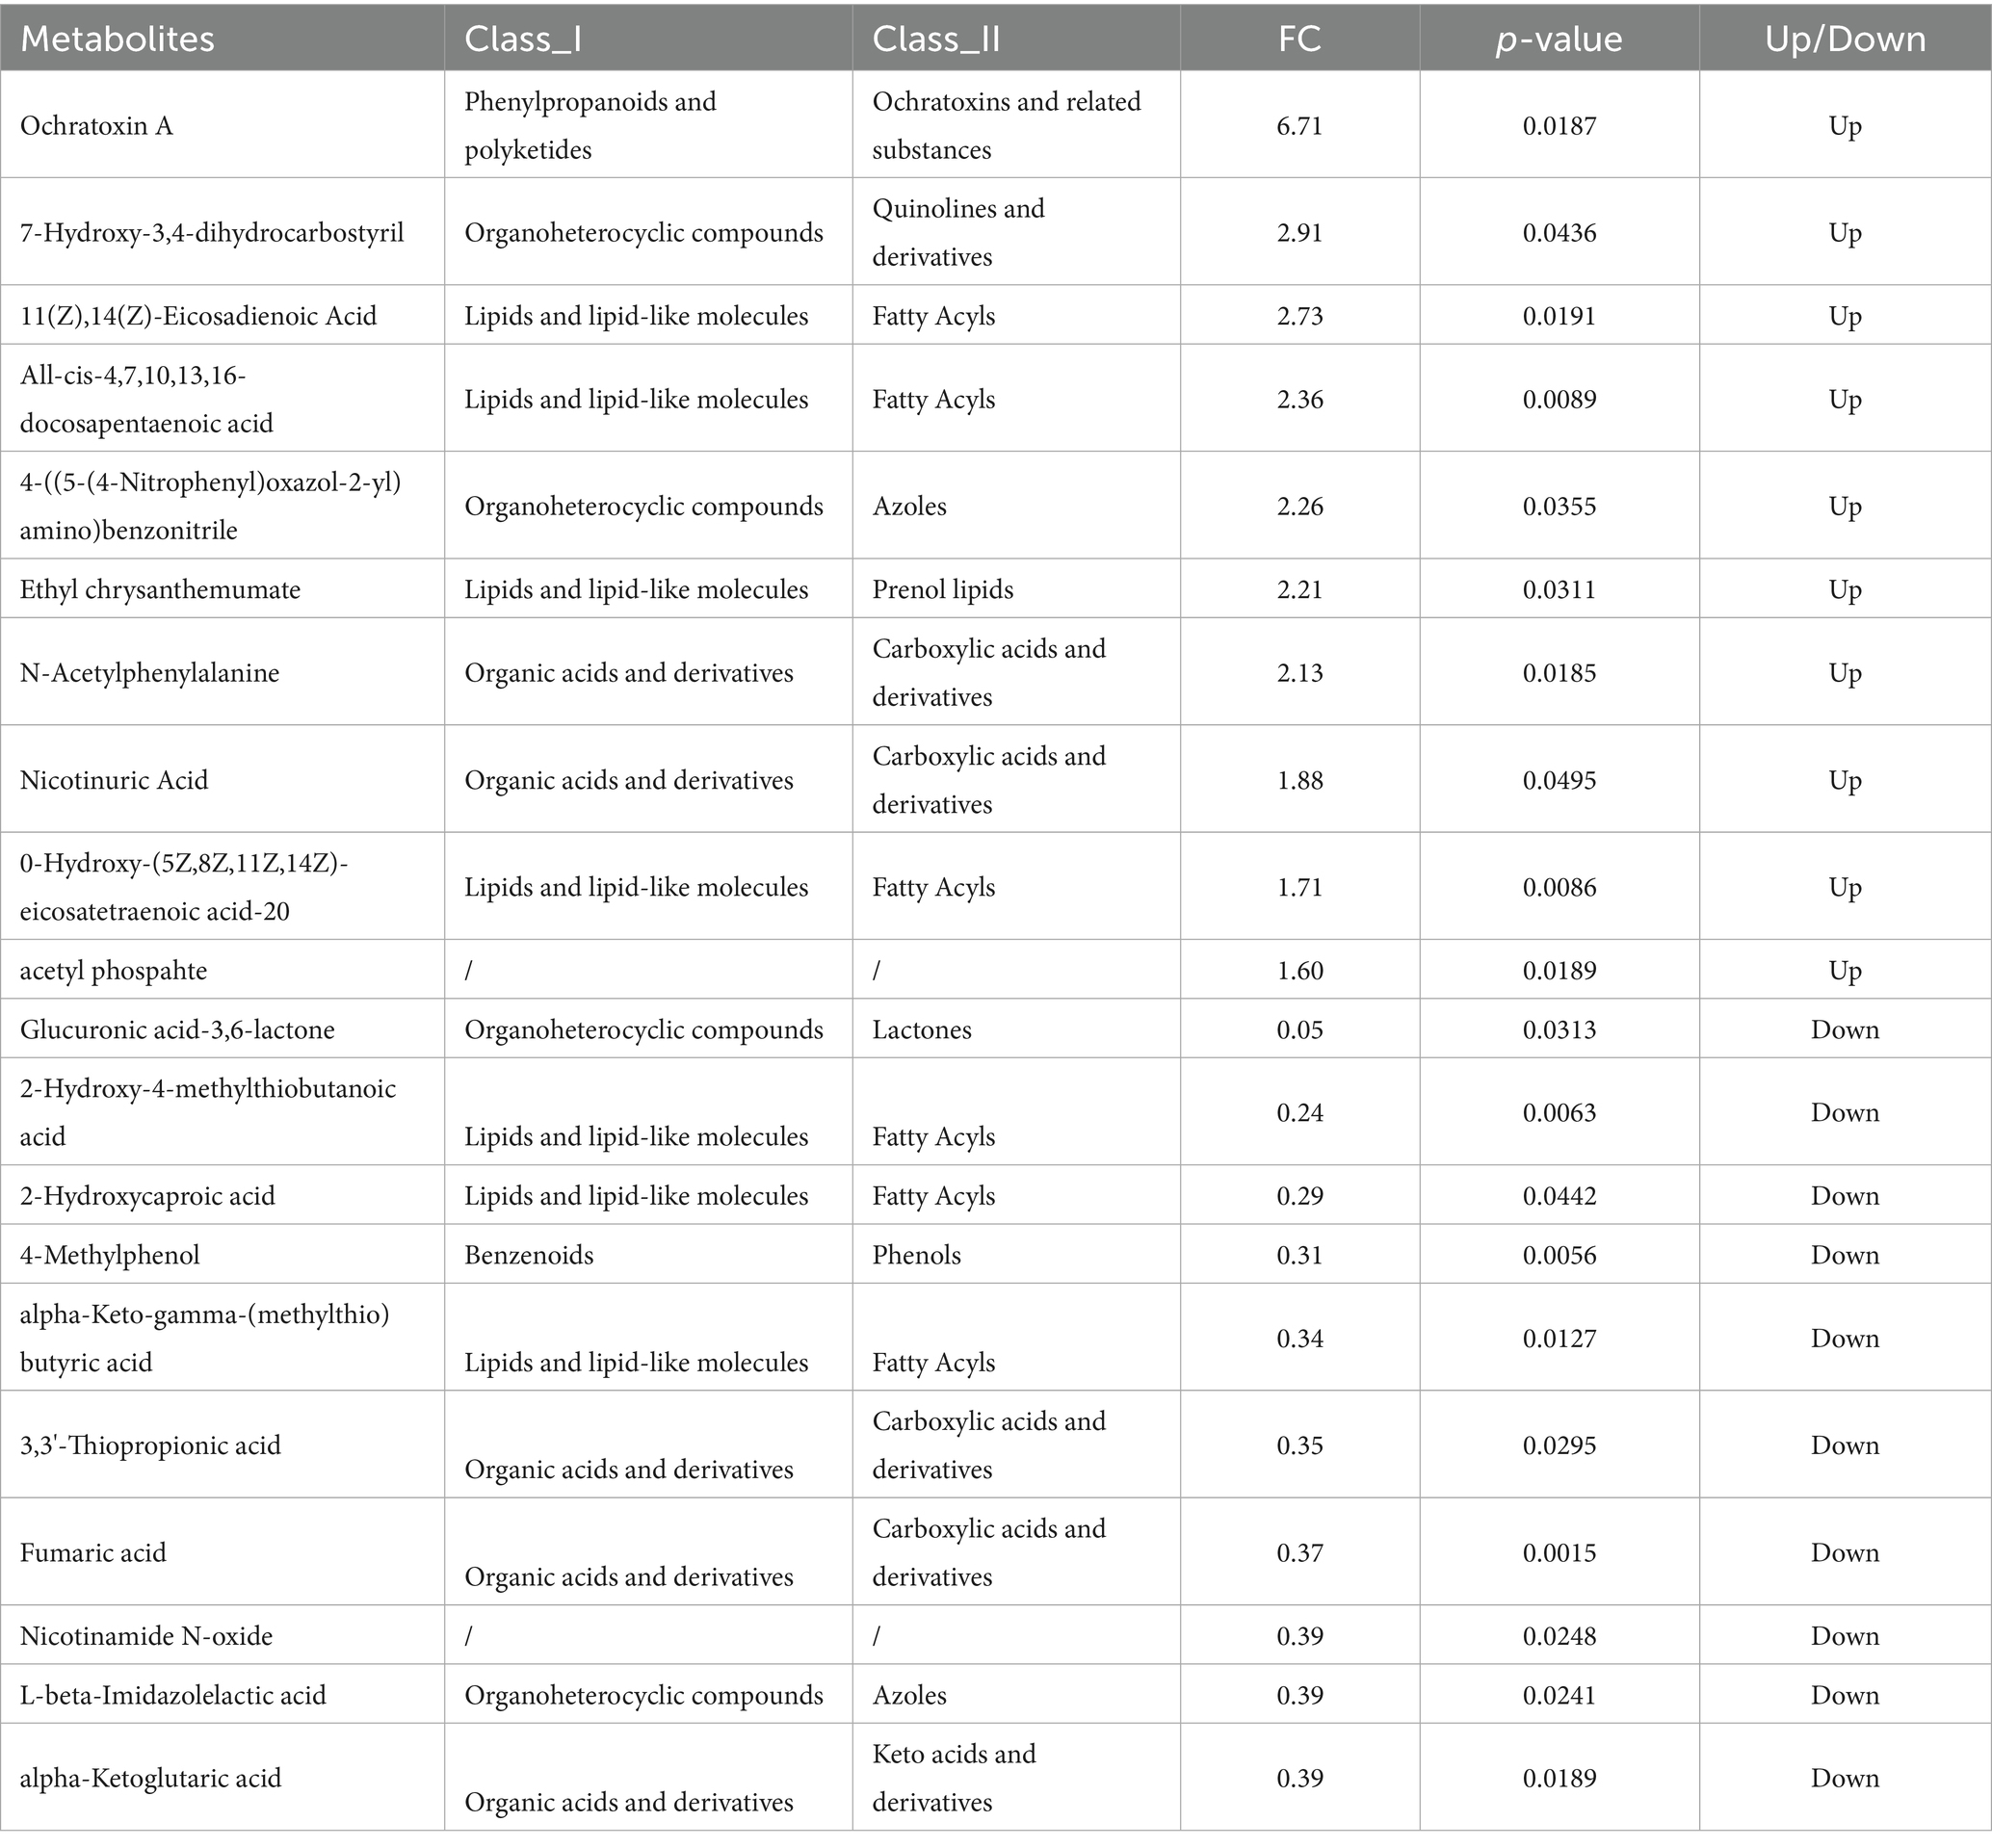
Figure 5 shows the volcano plots of differential metabolites in positive (C) and negative (D) ion modes. Differential metabolites were screened based on the criteria of VIP > 1.0, FC > 1.2 or FC < 1/1.2, and p-value < 0.05. A total of 673 metabolites were identified in positive ion mode, among which 82 showed significant differences (58 up-regulated and 23 down-regulated). In negative ion mode, 342 metabolites were identified, with 45 being significantly different (12 up-regulated and 32 down-regulated).
The top 20 upregulated and downregulated differential metabolites were ranked by FC. As shown in Table 3, under positive ion mode: Upregulated metabolites were predominantly saponins, amino acids and derivatives, esters, sugars, heterocyclic compounds, phenolic compounds, and neurotransmitters. Downregulated metabolites included amino acids and derivatives, heterocyclic compounds, hormones and their metabolites, antibiotics, aromatic amines, fatty acids and derivatives, and non-steroidal anti-inflammatory drugs (NSAIDs).
From Table 4, under negative ion mode, the upregulated metabolites were predominantly coumarins and derivatives, fatty acids and derivatives, heterocyclic compounds, esters, amino acids and derivatives, and nucleotides and their metabolites. Conversely, the downregulated metabolites primarily included sugars and derivatives, amino acids and derivatives, phenolic compounds, organic acids, and nucleotide derivatives.
3.4.5 Analysis of differential metabolites
The cluster analysis of differential metabolites is presented in Figure 6. Color intensity correlates with metabolite abundance, where darker hues indicate higher expression levels and lighter hues represent lower expression levels. The results demonstrated that dietary supplementation with AOC significantly altered rumen microbial metabolites in sheep.
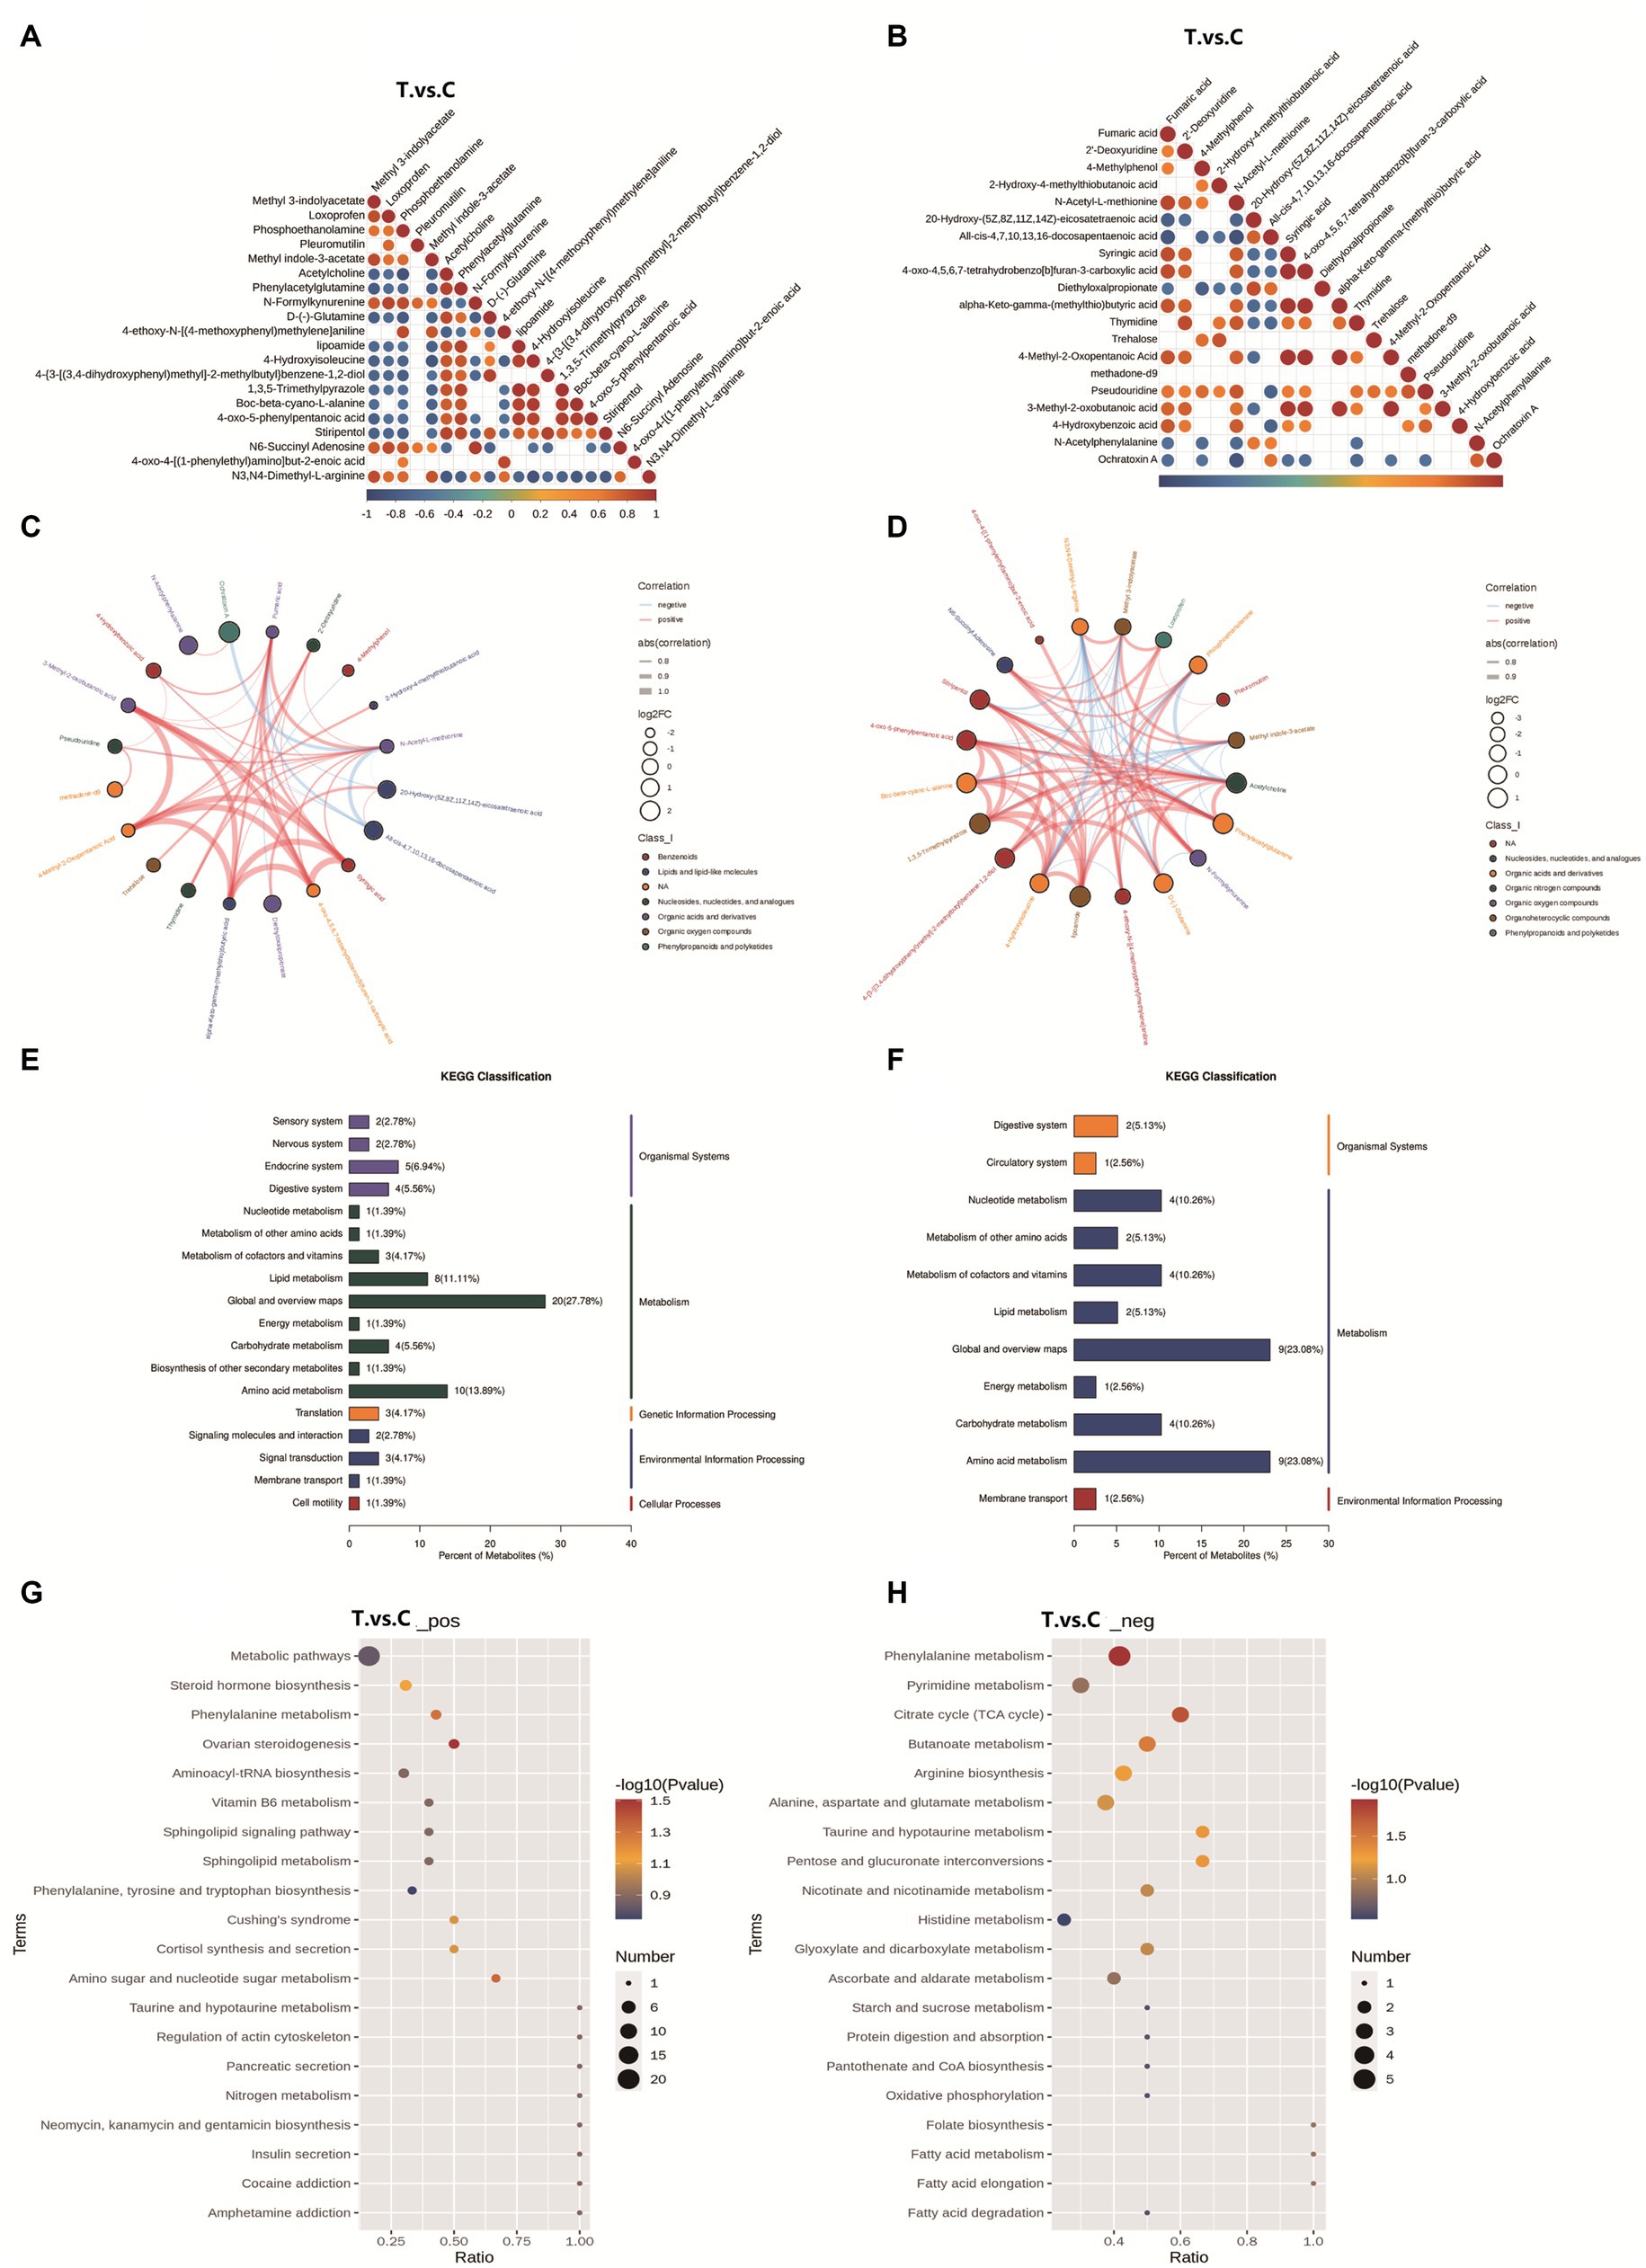
Figure 6. Analysis of differential metabolites: correlation, KEGG classification, and pathway enrichment. (A,C) Positive ion mode correlation; (B,D) Negative ion mode correlation; The color gradient ranges from red (perfect positive correlation, coefficient = 1) to blue (perfect negative correlation, coefficient = −1), with uncolored regions indicating nonsignificant correlations (p-value > 0.05). The top 20 differential metabolites, ranked by ascending p-value, are displayed in the chord diagrams. (E) KEGG classification in positive mode; (F) KEGG classification in negative mode; the horizontal axis represents the percentage of metabolites annotated to a specific KEGG pathway relative to all annotated metabolites. The vertical axis on the right indicates the primary KEGG Pathway categories, while the left side lists the secondary subcategories. (G) Pathway enrichment in positive mode; (H) Pathway enrichment. The horizontal axis represents the ratio of differential metabolites to total metabolites identified in the corresponding pathway (*x*/*y*). A higher ratio indicates stronger enrichment of differential metabolites in the pathway. The color gradient of the bubbles corresponds to the p-value from the hypergeometric test (darker hues denote lower p-values, reflecting greater statistical significance). The bubble size correlates with the number of differential metabolites in the pathway (larger bubbles indicate more metabolites).
The correlation analysis plots (A/C: positive ion mode; B/D: negative ion mode) and chord diagrams of differential metabolites are shown in Figure 6. In the positive ion mode, metabolites with significant correlations included methyl 3-indolyacetate, methyl indole-3-acetate, loxoprofen, pleuromutilin, phosphoethanolamine, D-(−)-glutamine, and 4-ethoxy-N-[(4-methoxyphenyl)methylene]aniline. In the negative ion mode, significantly correlated metabolites were primarily N-acetyl-L-methionine, ochratoxin A, thymidine, pseudouridine, all-cis-4,7,10,13,16-docosapentaenoic acid, tréhalose, and methadone-d9.
3.4.6 KEGG analysis of differential metabolites
Based on the metabolite classification information provided by the KEGG database, statistical visualization of annotated differential metabolites was performed Figure 6. In positive ion mode, the differential metabolites were widely involved in multiple biological layers, including Organismal Systems (e.g., endocrine and digestive systems), Metabolism (e.g., lipid and amino acid metabolism), Genetic Information Processing, and Environmental Information Processing. Among these, Global and Overview Maps accounted for the highest proportion (27.78%), followed by Amino acid metabolism (13.89%) and Lipid metabolism (11.11%), indicating that these broad metabolic processes were significantly influenced. In negative ion mode, the differential metabolites were more concentrated in the domain of Metabolism, particularly in Amino acid metabolism (23.08%), Nucleotide metabolism (10.26%), and Carbohydrate metabolism (10.26%).
KEGG pathway enrichment analysis was performed to identify the primary biological functions of differential metabolites. Based on the enrichment results, bubble plots of the enriched KEGG pathways were generated Figure 6. In the positive ion mode, differential metabolites were predominantly enriched in metabolic pathways, steroid hormone biosynthesis, phenylalanine metabolism, ovarian steroidogenesis, and aminoacyl-tRNA biosynthesis pathways among the top 20 KEGG pathways. Under negative ion mode, significant enrichment was observed in phenylalanine metabolism, pyrimidine metabolism, citrate cycle (tricarboxylic acid cycle, TCA cycle), butanoate metabolism, arginine biosynthesis, and alanine, aspartate, and glutamate metabolism pathways. These findings highlight critical roles in steroidogenesis, amino acid and nucleotide metabolism, and energy homeostasis, aligning with the observed metabolic shifts in the trial group.
3.4.7 Correlation analysis between key differential metabolites and microbial taxa
Pearson correlation analysis was performed between differential bacterial genera at the genus level and differential metabolites (Figure 7). In positive ion mode (Figure A), Candidatus Saccharimona showed a significant positive correlation with anti-inflammatory agents such as loxoprofen. Clostridium_sensu_stricto_13 was positively correlated with the neurotransmitter acetylcholine, but negatively correlated with metabolites including methyl indole-3-acetate. In negative ion mode, Clostridium_sensu_stricto_13 demonstrated positive correlations with multiple fatty acids (e.g., eicosatetraenoic acid and docosapentaenoic acid), and a negative correlation with 4-methylphenol.
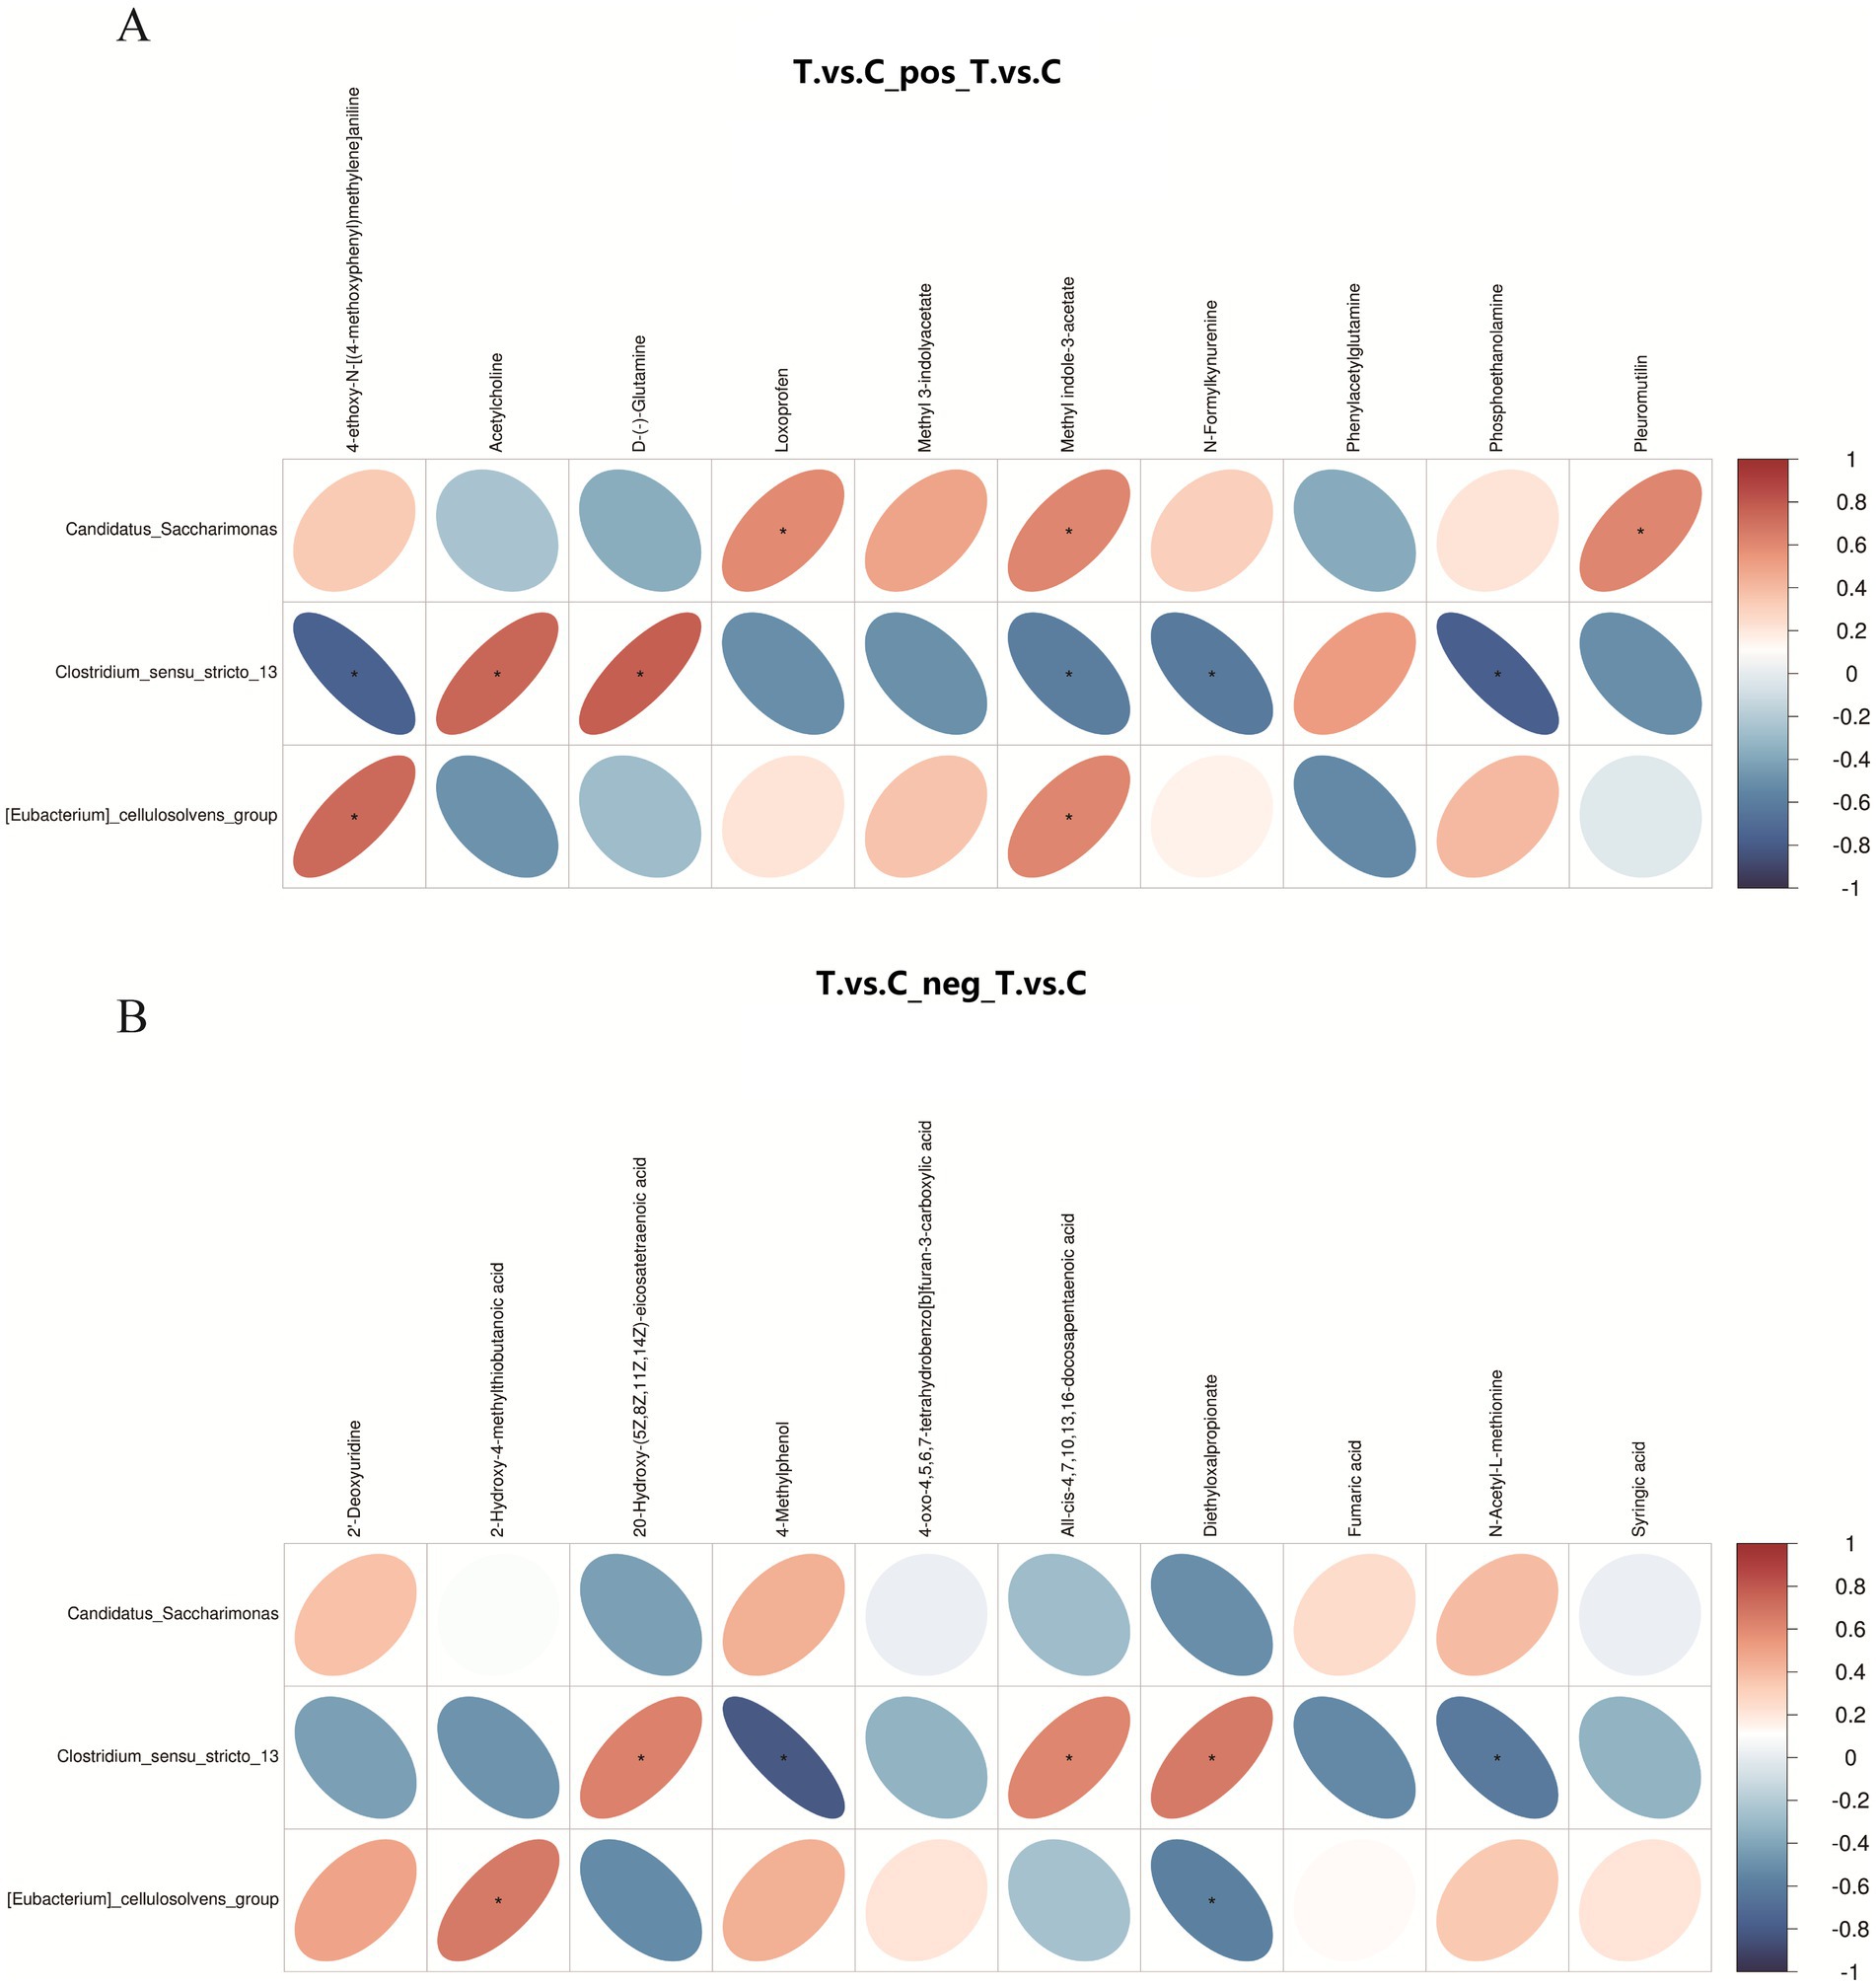
Figure 7. Correlation heatmap between ruminal microbiota and differential metabolites in positive ion (A) and negative ion (B) modes. The heatmap displays genus-level differential microbiota and significantly altered metabolites, with the color legend indicating Pearson correlation coefficients: red for positive correlations, blue for negative correlations, and asterisks (*) marking statistically significant associations (p < 0.05).
4 Discussion
The results of this study demonstrate that although dietary supplementation with AOC did not significantly affect feed intake in sheep, it significantly increased the average daily gain and reduced the feed-to-gain ratio. These findings are consistent with those reported by Tricarico et al. (13) in beef cattle, further confirming the positive role of A. oryzae in improving growth performance in ruminants.
The growth-promoting effect of AOC is closely related to its ability to improve nutrient digestibility. The trial group showed significantly increased neutral detergent fiber (NDF) digestibility, along with upward trends in dry matter, crude protein, and acid detergent fiber (ADF) digestibility. This improvement is primarily attributed to the degradation of fibrous and protein matrices by exogenous enzymes such as cellulases and proteases secreted by AOC (10, 14), a finding that aligns with reports by Hymes-Fecht et al. (6) and Rakhmani et al. (15). Additionally, AOC optimized nitrogen metabolism, as evidenced by reduced fecal and urinary nitrogen excretion and significantly increased nitrogen retention rate, indicating enhanced conversion of dietary nitrogen into microbial protein (16), thereby providing crucial support for the observed improvements in growth performance.
In terms of ruminal fermentation, AOC demonstrates dual benefits of stabilizing the fermentation environment and enhancing energy supply. In modern high-concentrate finishing systems, acidosis seriously compromises animal growth performance (17). In this trial, although the pH values in the trial group showed a tendency to be higher than those in the control group, the difference was not statistically significant. This result is consistent with the findings of Yohe et al. (18) and Chiquette et al. (19), suggesting that supplementation with A. oryzae culture may help stabilize ruminal pH under high-concentrate diet conditions. Furthermore, during ruminal fermentation, fibrous feeds are primarily metabolized into VFAs, methane, and carbon dioxide (20). The results of this trial showed that the ruminal acetate concentration and total VFA content in the trial group were significantly higher than those in the control group, with other VFAs such as propionate also exhibiting an increasing trend. These findings are consistent with reports by Zhang et al. (21) and Cantet et al. (22), indicating that supplementation with A. oryzae culture significantly enhances ruminal fermentation efficiency. Combined with the improved NDF digestibility, it can be inferred that A. oryzae promotes VFA production by enhancing fiber degradation and microbial fermentation activity. The resulting increase in VFA generation provides more metabolizable energy to the host (23, 24), which aligns well with the observed improvement in average daily gain.
Analysis of the ruminal microbial community using high-throughput sequencing revealed that the trial group exhibited a higher OTU count than the control group following supplementation with A. oryzae culture. However, no significant differences were observed in the Chao1, Shannon, or Simpson indices between the groups, indicating that AOC supplementation did not significantly alter microbial community diversity.
Previous studies have demonstrated that that supplementing sheep diets with 2 g/d of A. oryzae fermented extract significantly increased the total bacterial number and the number of cellulolytic bacteria in the rumen fluid by 34 and 90%, respectively Newbold et al. (25). Further supporting this, Sun et al. (26) confirmed that adding AOC to the diet of cannulated dairy cows significantly increased the abundances of Ruminococcus albus and Ruminococcus flavefaciens. The results of this trial showed an increasing trend in the abundances of the phyla Firmicutes and Bacteroidetes in the trial group compared to the control group, which is consistent with the findings of Zhang Duihong et al. (21), indicating that AOC promotes these two dominant phyla in the sheep rumen (48). At the genus level, the trial group exhibited increasing trends in Succiniclasticum abundance compared to the control group. Succiniclasticum, a key propionate-producing genus, participates in hemicellulose degradation and converts succinate to propionate (27), aligning with the observed rise in propionate proportion within ruminal volatile fatty acids. Additionally, Lachnospiraceae_NK3A20_group and Lachnospiraceae_XPB1014_group were enriched in the trial group, consistent with Piao et al. (28), who reported similar trends in sheep supplemented with A. oryzae culture. These taxa are implicated in lignocellulose breakdown (50), suggesting that A. oryzae enhances fibrolytic microbial populations (29, 47).
Notably, the trial group showed significantly lower abundance of Patescibacteria—a phylum often associated with dysbiosis (30). A reduced trend in Proteobacteria, which is linked to gut microbial instability (31). These shifts suggest that A. oryzae supplementation enhances rumen microbial homeostasis by enriching beneficial taxa (e.g., fiber degraders) while suppressing potential pathobionts. The trial group also showed a rising trend in Rikenellaceae_RC9_gut_group, a dominant gut microbiota phylotype associated with mucin metabolism (32), negative correlation with obesity (33), carbohydrate digestion (34), and anti-inflammatory effects via suppression of pro-inflammatory cytokines (35). This group enhances mucosal barrier integrity by elevating butyrate levels, a critical regulator of intestinal health (36), indicating that A. oryzae supplementation may improve rumen epithelial function through microbiota modulation. The synergistic effect between the enrichment of beneficial microbes (such as Rikenellaceae_RC9_gut_group) and the upregulation of anti-inflammatory metabolites (such as EPA) aligns with the “microbiota-immunity-barrier” axis regulation mechanism proposed by Su et al. (37). Their study indicates that functional additives, by modulating the gut microbiota, not only promote the production of beneficial metabolites like short-chain fatty acids but also directly enhance intestinal epithelial barrier integrity and regulate the host immune system. This provides robust theoretical support and a mechanistic explanation for the hypothesis that AOC improves rumen health through “microbiota-metabolite” interactions. LEfSe analysis further identified Bacteroidales_BS11_gut_group and Desulfovibrio as discriminant taxa in the trial group. Bacteroidales_BS11_gut_group is linked to sulfur metabolism and anti-inflammatory activity, potentially explaining the upregulation of antioxidant metabolites like lipoic acid in metabolomic profiles. Desulfovibrio, a sulfate-reducing genus, may contribute to sulfur cycling, synergizing with enhanced antioxidant pathways to bolster rumen health.
Non-targeted metabolomics elucidated the mechanism of AOC action at the molecular level. Differential metabolites were primarily enriched in pathways such as phenylalanine metabolism, the tricarboxylic acid (TCA) cycle, and lipid metabolism. The activation of these pathways signifies enhanced host energy metabolism (38) and improved nitrogen utilization efficiency (39, 40), which aligns with the aforementioned findings of increased VFA production and nitrogen retention. Metabolites of Aspergillus oryzae (such as polysaccharides and polyphenols) can directly scavenge free radicals or upregulate the expression of antioxidant enzymes like SOD and CAT (10). Metabolomic data from this trial revealed significant upregulation of antioxidants including ginsenoside Rg3 and lipoic acid (41, 42), as well as anti-inflammatory metabolites such as eicosapentaenoic acid (EPA) and nicotinuric acid (43, 44). Concurrently, the downregulation of the anti-inflammatory drug loxoprofen may indicate alleviated systemic oxidative stress (45). This finding aligns with the research conclusions of Chen et al. (46) on natural plant-derived additives, whose study confirmed that such additives can effectively elevate the levels of antioxidant metabolites in the body, thereby enhancing the animal’s resistance to physiological stress. Furthermore, computational approaches such as microbiome-disease association analysis and network modeling enable the prediction of key functional microbes and core metabolic pathways from correlative data (11). In the present trial, the observed increase in beneficial microbes and reduction in potential pathogens within the microbiome suggest that AOC may synergistically improve the rumen’s antioxidant and anti-inflammatory status through “microbe-metabolite” interactions, ultimately promoting healthier growth in sheep.
This study observed the growth-promoting effects of AOC in sheep through production performance indicators, and further revealed its potential mechanisms through ruminal microbiota and metabolomic analyses. However, several limitations should be considered: the relatively small sample size (only 6 sheep per group) may limit the statistical power of the findings; the 30-day trial duration prevented assessment of long-term effects; methane emissions were not measured, restricting comprehensive evaluation of environmental impact; and the lack of functional validation data made it difficult to establish causal relationships between microbial functions and metabolic phenotypes. Future studies should expand the sample size, extend the trial period, and integrate multi-omics data with functional validation to further elucidate the mechanisms of AOC.
5 Conclusion
Dietary supplementation with 1% AOC improved rumen fermentation efficiency in sheep through synergistic modulation of multiple metabolic pathways, including lipid metabolism, amino acid metabolism, and the TCA cycle, thereby enhancing energy utilization. The increased abundance of fiber-degrading taxa (e.g., Lachnospiraceae groups) promoted fibrous diet degradation, contributing to enhanced production performance. Furthermore, upregulation of antioxidant metabolites (e.g., ginsenoside Rg3, lipoic acid) and downregulation of inflammatory mediators (e.g., loxoprofen) indicated improved rumen health and stress resilience. These findings demonstrate that AOC optimizes rumen microbiota functionality and metabolic homeostasis, offering a sustainable strategy to enhance sheep productivity and welfare.
Data availability statement
The data presented in this study are deposited in the NCBI BioProject repository, accession number PRJNA1348942, and can be accessed at: http://www.ncbi.nlm.nih.gov/bioproject/1348942.
Ethics statement
The animal study was approved by the experimental procedures, management, and animal husbandry followed the regulations and instructions of the Animal Welfare and Ethics Committee of Xinjiang Agricultural University, Urumqi, Xinjiang, China (Approval number 2020022). The study was conducted in accordance with the local legislation and institutional requirements.
Author contributions
JX: Conceptualization, Data curation, Investigation, Methodology, Project administration, Writing – original draft. CW: Writing – review & editing. YZ: Investigation, Methodology, Writing – original draft. XL: Investigation, Methodology, Writing – original draft. GM: Resources, Supervision, Writing – review & editing. KY: Writing – review & editing, Funding acquisition.
Funding
The author(s) declare that financial support was received for the research and/or publication of this article. This study was supported by the Science and Technology Breakthrough Program in Key Areas of Xinjiang Production and Construction Corps: Industrialized Technology Integration of Probiotic Feed Additives and Biofermented Feed (Grant No. 2022AB013). National Natural Science Foundation of China Project (Grant No. 32160811).
Conflict of interest
JX, YZ, XL, and GM were employed by Xinjiang Tiankang Feed Co., Ltd.
The remaining authors declare that the research was conducted in the absence of any commercial or financial relationships that could be construed as a potential conflict of interest.
Generative AI statement
The authors declare that no Gen AI was used in the creation of this manuscript.
Any alternative text (alt text) provided alongside figures in this article has been generated by Frontiers with the support of artificial intelligence and reasonable efforts have been made to ensure accuracy, including review by the authors wherever possible. If you identify any issues, please contact us.
Publisher’s note
All claims expressed in this article are solely those of the authors and do not necessarily represent those of their affiliated organizations, or those of the publisher, the editors and the reviewers. Any product that may be evaluated in this article, or claim that may be made by its manufacturer, is not guaranteed or endorsed by the publisher.
Supplementary material
The Supplementary material for this article can be found online at: https://www.frontiersin.org/articles/10.3389/fvets.2025.1658361/full#supplementary-material
References
1. Bentley, R. From miso, sake and shoyu to cosmetics: a century of science for kojic acid. Nat Prod Rep. (2007) 23:1046–62. doi: 10.1039/b603758p
2. Federico, P, Federico, T, Juan, B, Da Silva, SGM, Schulmeister, TM, Vargas, MJ, et al. Effects of inclusion of Amaferm on animal performance, chewing activity, and nutrient digestibility of backgrounding beef heifers fed either a sorghum silage- or a byproducts-based diet. J Anim Sci. (2021) 99:181–2. doi: 10.1093/jas/skab235.329
3. Kong, F, Lu, N, Liu, Y, Zhang, S, Jiang, H, Wang, H, et al. Aspergillus oryzae and Aspergillus niger co-cultivation extract affects in vitro degradation, fermentation characteristics, and bacterial composition in a diet-specific manner. Animals. (2021) 11:1248–66. doi: 10.3390/ani11051248
4. Ferreira, JA, Lennartsson, PR, and Taherzadeh, MJ. Production of ethanol and biomass from thin stillage using food-grade zygomycetes and ascomycetes filamentous fungi. Energies. (2014) 7:3872–85. doi: 10.3390/en7063872
5. Sosa, A, Marrero, Y, Albelo, N, González, N, Moreira, OB, Cairo, J, et al. Effect of aspergillus oryzae on ruminal fermentation, feed intake and dry matter digestibility in cows fed forage-based diets. Anim Biotechnol. (2022) 33:1519–24. doi: 10.1080/10495398.2021.1914069
6. Hymes-Fecht, UC, and Casper, DP. Adaptation and withdrawal of feeding dried aspergillus oryzae fermentation product to dairy cattle and goats on in vitro NDF digestibility of selected forage sources. Transl Anim Sci. (2021) 5:txab051. doi: 10.1093/tas/txab051
7. Sallam, SMA, Abdelmalek, MLR, Kholif, AE, Zahran, SM, Ahmed, MH, Zeweil, HS, et al. The effect of Saccharomyces cerevisiae live cells and Aspergillus oryzae fermentation extract on the lactational performance of dairy cows. Anim Biotechnol. (2020) 31:491–7. doi: 10.1080/10495398.2019.1625783
8. You, W, Cheng, HJ, Hu, X, Sun, JT, Wang, Q, Li, Y, et al. Effects of Aspergillus oryzae culture on growth performance, nutrient apparent digestibility, serum biochemical and antioxidant indices of beef cattle. Feed Industry. (2024) 45:2547–2553. doi: 10.13302/j.cnki.fi.2024.20.010
9. Schingoethe, DJ, Linke, KN, Kalscheur, KF, Hippen, AR, Rennich, DR, and Yoon, I. Feed efficiency of mid-lactation dairy cows fed yeast culture during summer. J Dairy Sci. (2004) 87:4178–81. doi: 10.3168/jds.S0022-0302(04)73561-4
10. Daba, GM, Mostafa, FA, and Elkhateeb, WA. The ancient koji mold (Aspergillus oryzae) as a modern biotechnological tool. Bioresour Bioprocess. (2021) 8:52–68. doi: 10.1186/s40643-021-00408-z
11. Liu, Y, Liang, Y, Li, Q, and Li, Q. Comprehensive analysis of circulating cell-free RNAs in blood for diagnosing non-small cell lung cancer. Comput Struct Biotechnol J. (2023) 21:4238–51. doi: 10.1016/j.csbj.2023.08.029
12. Xu, XL. Effects of supplemental soybean phospholipids on rumen digestive metabolism and microbial flora in sheep. Urumqi, Xinjiang, China: Xinjiang Agricultural University (2013).
13. Tricarico, JM, Abney, MD, Galyean, ML, Rivera, JD, Hanson, KC, McLeod, KR, et al. Effects of a dietary Aspergillus oryzae extract containing alpha-amylase activity on performance and carcass characteristics of finishing beef cattle. J Anim Sci. (2007) 85:802–11. doi: 10.2527/jas.2006-427
14. Fan, MX, Wang, LY, Chen, WW, Chen, SS, Liu, J, and Li, J. Research progress on strain improvement of Aspergillus oryzae for brewing. Food Sci. (2023) 44:346–54. doi: 10.7506/spkx1002-6630-20220330-370
15. Rakhmani, SIW, Widiawati, Y, Kusumaningrum, DA, and Ahmad, SN. In vitro fermentation characteristic and digestibility of dairy ration supplemented with aspergillus oryzae inoculum. IOP Conf Ser Earth Environ Sci. (2024) 1292:012017. doi: 10.1088/1755-1315/1292/1/012017
16. Zhang, XY, Li, SL, Wei, Y, and Wang, W. Research progress on milk performance and nutrient utilization of dairy cow fed low protein diet. Chin J Anim Sci. (2024) 60:12–8. doi: 10.19556/j.0258-7033.20230407-02
17. Zhang, T, Mu, YY, Qi, WP, Zhang, JY, and Mao, SY. Comparison of rumen epithelium morphology and function in dairy cows with differences in susceptibility for subacute ruminal acidosis. Acta Pratacult Sin. (2023) 32:131–9. doi: 10.11686/cyxb2022065
18. Yohe, TT, O'Diam, KM, and Daniels, KM. Growth, ruminal measurements, and health characteristics of Holstein bull calves fed an Aspergillus oryzae fermentation extract. J Dairy Sci. (2015) 98:6163–75. doi: 10.3168/jds.2015-9313
19. Chiquette, J. Evaluation of the protective effect of probiotics fed to dairy cows during a subacute ruminal acidosis challenge. Anim Feed Sci Technol. (2009) 153:278–91. doi: 10.1016/j.anifeedsci.2009.04.007
20. Pokhrel, B, and Jiang, H. Postnatal growth and development of the rumen: integrating physiological and molecular insights. Biology (Basel). (2024) 13:269–87. doi: 10.3390/biology13040269
21. Zhang, DH. Effects of Aspergillus oryzae culture on production performance and rumen function in Hu sheep. Lanzhou, Gansu, China: Lanzhou University (2021).
22. Cantet, JM, Palladino, RA, Ocasio, C, Bargo, F, and Ipharraguerre, IR. A meta-analysis of the impact of an Aspergillus oryzae fermentation product on ruminal fermentation and dairy cow performance. Anim Feed Sci Technol. (2025) 319:116182. doi: 10.1016/j.anifeedsci.2024.116182
23. Li, W. Roles of ruminal volatile fatty acids and influencing factors. Chin J Anim Sci. (2012) 2012:017 4. doi: 10.3969/j.issn.0258-7033
24. Xu, J, Hou, YJ, Liu, H, Shi, RH, Yang, HP, Zhao, GQ, et al. Advances in ruminal degradation of forage fiber. China Dairy Cattle. (2013) 24:7. doi: 10.3969/j.issn.1004-4264.2013.07.012
25. Newbold, CJ, Brock, R, and Wallace, RJ. The effect of Aspergillus oryzae fermentation extract on the growth of fungi and ciliate protozoa in the rumen. Lett Appl Microbiol. (2010) 15:109–12. doi: 10.1111/j.1472-765X.1992.tb00739.x
26. Sun, H, Wu, YM, Wang, YM, Liu, JX, and Myung, KH. Effects of Aspergillus oryzae culture and 2-hydroxy-4-(methylthio)-butanoic acid on in vitro rumen fermentation and microbial populations between different roughage sources. Asian Australas J Anim Sci. (2014) 27:1285–92. doi: 10.5713/ajas.2013.13742
27. Wu, J, Zhang, XL, Tan, ZL, Jiao, JZ, Zhou, CS, Yin, FQ, et al. Microbiome-host co-oscillation patterns in shaping ruminal ecosystem from birth to puberty in a goat model. Sci China Life Sci. (2025). doi: 10.1007/s11427-024-2824-6
28. Piao, GH. Effects of combined Aspergillus oryzae culture and yeast culture on rumen fermentation and microbial diversity in sheep, Changchun, Jilin Province, China: Jilin Agricultural University (2017).
29. Sun, H, Wu, Y, Wang, Y, Wang, C, and Liu, J. Effects of addition of Aspergillus oryzae culture and 2-hydroxy-4-(methylthio) butanoic acid on milk performance and rumen fermentation of dairy cows. Anim Sci J. (2017) 88:602–9. doi: 10.1111/asj.12646
30. Brule, SVD, Rappe, M, Ambroise, J, Bouzin, C, and Lison, D. Diesel exhaust particles alter the profile and function of the gut microbiota upon subchronic oral administration in mice. Part Fibre Toxicol. (2021) 18:7–21. doi: 10.1186/s12989-021-00400-7
31. Shin, N, Whon, TW, and Bae, JW. Proteobacteria: microbial signature of dysbiosis in gut microbiota. Trends Biotechnol. (2015) 33:496–503. doi: 10.1016/j.tibtech.2015.06.011
32. Fan, P, Bian, B, Teng, L, Nelson, CD, Driver, J, Elzo, MA, et al. Host genetic effects upon the early gut microbiota in a bovine model with graduated spectrum of genetic variation. Nat Publ Group. (2020) 14:302–17. doi: 10.1038/S41396-019-0529-2
33. Suzuki, TA, Martins, FM, Phifer-Rixey, M, and Nachman, MW. The gut microbiota and Bergmann's rule in wild house mice. Mol Ecol. (2020) 29:2300–11. doi: 10.1111/mec.15476
34. Berry, D, Mader, E, Lee, TK, Woebken, D, Wang, Y, Zhu, D, et al. Tracking heavy water (D2O) incorporation for identifying and sorting active microbial cells. Proc Natl Acad Sci USA. (2015) 112:E194–203. doi: 10.1073/pnas.1420406112
35. Bian, X, Wu, W, Yang, L, Lv, L, and Li, L. Administration of Akkermansia muciniphila ameliorates dextran sulfate sodium-induced ulcerative colitis in mice. Front Microbiol. (2019) 10:2259–76. doi: 10.3389/fmicb.2019.02259
36. Cao, H, Zhao, L, Yuan, Y, Liao, C, Zeng, W, Li, A, et al. Lipoamide attenuates hypertensive myocardial hypertrophy through PI3K/Akt-mediated Nrf2 signaling pathway. J Cardiovasc Transl Res. (2024) 17:910–22. doi: 10.1007/s12265-024-10488-9
37. Su, M, Tang, T, Tang, W, Long, Y, Wang, L, and Liu, M. Astragalus improves intestinal barrier function and immunity by acting on intestinal microbiota to treat T2DM: a research review. Front Immunol. (2023) 14:1243834. doi: 10.3389/fimmu.2023.1243834
38. Xia, XL. Overview of respiratory chain pathways for mitochondrial metabolite oxidation and energy supply. Chin Soc Biochem Mol Biol. (2016) 31:226–227. doi: 10.1016/j.cmet.2020.01.004
39. Li, YH. Regulation of aromatic amino acid biosynthesis pathways. Lanzhou, Gansu Province, China: Academy of Military Medical Sciences (2025).
40. Liu, XY, Zhu, Q, Yang, F, Zhang, J, Zhang, QL, Li, JH, et al. Proteomics reveals the impact of phenylalanine metabolism on flavor formation in Jiangxiang Daqu. Food Sci Technol. (2021) 46:1–6. doi: 10.13684/j.cnki.spkj.2021.08.001
41. Cao, Y, Ren, G, Zhang, Y, Qin, H, and Yang, L. A new way for punicalagin to alleviate insulin resistance: regulating gut microbiota and autophagy. Food Nutr Res. (2024) 65:5689. doi: 10.29219/fnr.v65.5689
42. Wang, W, Li, K, and Xiao, W. The pharmacological role of Ginsenoside Rg3 in liver diseases: a review on molecular mechanisms. J Ginseng Res. (2024) 48:129–39. doi: 10.1016/j.jgr.2023.11.004
43. Meyers, CD, Liu, P, Kamanna, VS, and Kashyap, ML. Nicotinic acid induces secretion of prostaglandin D 2 in human macrophages: an in vitro model of the niacin flush ☆. Atherosclerosis. (2007) 192:253–8. doi: 10.1016/j.atherosclerosis.2006.07.014
44. Sherratt, S, Libby, P, Richard Dunbar, M, Bhatt, D, and Preston Mason, M. Abstract 4125992: eicosapentaenoic acid (EPA) increases expression of Nrf2-mediated antioxidant response element and heme oxygenase-1 in cytokine-activated endothelial cells. Circulation. (2024) 150:2. doi: 10.1161/circ.150.suppl_1.4125992
45. Ji, C, Yu, Y, Zhang, M, and Dong, S. Loxoprofen sodium alleviates oxidative stress and apoptosis induced by angiotensin II in human umbilical vein endothelial cells (HUVECs). Drug Des Devel Ther. (2020) 14:5087–96. doi: 10.2147/DDDT.S266175
46. Chen, J, Chen, F, Peng, S, Ou, Y, He, B, Li, Y, et al. Effects of Artemisia argyi powder on egg quality, antioxidant capacity, and intestinal development of Roman laying hens. Front Physiol. (2022) 13:902568. doi: 10.3389/fphys.2022.902568
47. Francisco, JP. The ruminant: life history and digestive physiology of a symbiotic anima In: Sustainable and environmentally friendly dairy farms. Cham: Springer International Publishing (2020). 19–45.
48. Goulart, RS, Vieira, RAM, Daniel, JLP, Amaral, RC, Santos, VP, Toledo Filho, SG, et al. Effects of source and concentration of neutral detergent fiber from roughage in beef cattle diets: comparison of methods to measure the effectiveness of fiber. J Anim Sci. (2020) 98:1–9. doi: 10.1093/jas/skaa108
49. Kong, F, Lu, N, Liu, Y, Zhang, S, Jiang, H, Wang, H, et al. Aspergillus oryzae and Aspergillus niger Co-Cultivation Extract Affects In Vitro Degradation, Fermentation Characteristics, and Bacterial Composition in a Diet-Specific Manner. Animals. (2021) 11:1248.
Keywords: Aspergillus oryzae culture, sheep, fiber degradation, rumen metabolism, microbial diversity
Citation: Xie J, Wang C, Zhao Y, Li X, Ma G and Yang K (2025) Metabolomic and microbial diversity perspectives on Aspergillus oryzae culture-induced modifications in ovine feed utilization and rumen ecosystem. Front. Vet. Sci. 12:1658361. doi: 10.3389/fvets.2025.1658361
Edited by:
Regiane R. Santos, Schothorst Feed Research, NetherlandsReviewed by:
Sumit Singh Dagar, Agharkar Research Institute, IndiaLong Guo, Lanzhou University, China
Shahid Ali Rajput, Muhammad Nawaz Shareef University of Agriculture, Pakistan
Kai Lou, Xinjiang Academy of Agriculture Science, China
Copyright © 2025 Xie, Wang, Zhao, Li, Ma and Yang. This is an open-access article distributed under the terms of the Creative Commons Attribution License (CC BY). The use, distribution or reproduction in other forums is permitted, provided the original author(s) and the copyright owner(s) are credited and that the original publication in this journal is cited, in accordance with accepted academic practice. No use, distribution or reproduction is permitted which does not comply with these terms.
*Correspondence: Kailun Yang, NDAxNDMwODRAcXEuY29t
 Jinglong Xie
 Caidie Wang1