1
Institut National de la Santé et de la Recherche Médicale U 603, Paris, France
2
Centre National de la Recherche Scientifique UMR 8154, Paris, France
3
Neurophysiology and New Microscopy Laboratory, Université Paris Descartes, Paris, France
4
Division of Biology, California Institute of Technology, Pasadena, CA, USA
Calcium imaging using fluorescent reporters is the most widely used optical approach to investigate activity in intact neuronal circuits with single-cell resolution. Calcium signals, however, are often difficult to interpret, especially if the desired output quantity is membrane voltage or instantaneous firing rates. Combining dendritic intracellular electrophysiology and multi-photon calcium imaging in vivo, we recently investigated the relationship between optical signals recorded with the fluorescent calcium indicator Oregon Green BAPTA-1 (OGB-1) and spike output in principal neurons in the locust antennal lobe. We derived from these experiments a simple, empirical and easily adaptable method requiring minimal calibration to reconstruct firing rates from calcium signals with good accuracy and 50-ms temporal resolution.
Despite the wide availability of optical voltage reporters to estimate activity in intact neuronal circuits with single-cell resolution (Chanda et al., 2005
; Cohen et al., 1978
; Ferezou et al., 2006
; Nuriya et al., 2006
; Obaid et al., 1999
; Sjulson and Miesenbock, 2006
; Zhou et al., 2007
), calcium imaging using fluorescent reporters (Denk and Svoboda, 1997
; Helmchen and Waters, 2002
; Smetters et al., 1999
; Tsien, 1999
; Yuste and Katz, 1991
) remains the most used optical approach to achieve similar goals. The robustness of exogenous and endogenous labeling with calcium reporters and the minimal impact they have on neuronal viability make them, in principle, excellent tools to probe activity at the level of neuron populations, single neurons, or single sub-cellular compartments (e.g., dendrites, spines, presynaptic boutons). The availability of genetically engineered calcium indicators (Mank and Griesbeck, 2008
; Miyawaki et al., 1997
, 1999
; Reiff et al., 2005
) and the possibility of controlling their selective expression (Feng et al., 2000
; Hebert and McConnell, 2000
; Jefferis et al., 2001
, 2007
; Zong et al., 2005
) reinforce their use and promise. Despite important remaining issues related to indicator response kinetics (see below), the constant refinement of fluorescent calcium indicator proteins (Garaschuk et al., 2007
; Mank et al., 2006
; Mao et al., 2008
; Wallace et al. 2008
), combined with improvements in optical microscopy techniques (Deisseroth et al., 2006
; Dombeck et al., 2007
; Engelbrecht et al., 2008
; Holekamp et al., 2008
; Llewellyn et al., 2008
) makes calcium imaging a major tool to elucidate activity and function in neuronal circuits (Carlsson et al. 2005
; Friedrich and Korsching, 1997
; Galizia et al., 1999
; Holekamp et al., 2008
; Ohki et al., 2005
; Sobel and Tank, 1994
; Spors et al., 2006
; Tabor et al., 2008
; Wachowiak and Cohen, 2001
; Wang et al. 2003
, 2004
). Often deemphasized, however, is the fact that calcium signals are not always straightforward to interpret, especially if the desired output quantity is membrane voltage or instantaneous firing rates. This study (and its source, Moreaux and Laurent, 2007
) proposes a simple empirical method to estimate instantaneous firing rates of single neurons from fluorescence signals obtained in vivo, using the calcium indicator Oregon Green BAPTA-1.
In the study of neuronal systems, signals from calcium indicators are, given an appropriately selected indicator with adequate calcium sensitivity, usually interpreted as indicating spiking activity; whereas calcium signals and voltage are generally indeed correlated, calcium signals can also be generated by sub-threshold voltage events or influx through ionotropic ion channels (Goldberg et al., 1999
; Kovalchuk et al., 2000
; Lin et al., 2007
; Perez-Reyes, 2003
; Soler-Llavina and Sabatini, 2006
). Conversely, an indicator’s sensitivity may not be matched to the firing statistics of the neurons under study. Correctly interpreting a calcium signal – being in a position to separate synaptic inputs from spike output for example, or estimating the fraction of spike output detected – thus depends on a judicious match between the indicator’s sensitivity and the properties of the neurons under study. Often, this match is difficult or impossible to optimize, for lack of information on the neurons sampled, or for lack of prior testing, especially in the precise conditions in which imaging will be used (the operating range of neurons can differ dramatically between in vitro and in vivo conditions, for example). This match becomes increasingly important as the desired temporal resolution of activity estimates approaches the temporal scale of single action potentials. We note that neuronal activity often consists simply of modulations around baselines rates (themselves sometimes elevated, e.g., 30 spikes/s, or as low as 0) to instantaneous peaks up to several hundred spikes/s. In short, one should be both careful and realistic about what can be reasonably achieved.
To make possible a reasonable extraction of spiking activity, the relationship between calcium signals and voltage should be carefully addressed in a neuron-specific manner. We believe that this is fundamental for a correct functional interpretation of imaging data. Plainly, the functional calibration of indicators should be done in the cell type in which calcium will later be used as a substitute for electrical recordings, and ideally, in the same physiological conditions. Such conditions are harsh, probably even sometimes impossible. Yet, if we do not keep in mind their necessity, we run the risk of having to later re interpret calcium-imaging data, causing unnecessary revisions.
Recently, the correspondence between odor-evoked, somatic and dendritic calcium signals and spike output has been evaluated in vivo in Drosophila projection neurons (PNs) expressing the genetically encoded calcium reporter G-CaMP 1.3 (Jayaraman and Laurent, 2007
). A recent investigation combining calcium imaging and voltage recordings in a nose and brain preparation of Xenopus laevis revealed the underestimated cell-specificity of the correlation between spontaneous and odor-evoked spiking activity and mitral and granule cells’ somatic calcium signals (Lin et al., 2007
). In vivo somatic calcium signals were combined with simultaneous voltage recordings in anesthetized rats to identify temporally sparse spontaneous activity (∼1 Hz) and compared to somatic calcium recordings alone in awake animals (Greenberg et al., 2008
). Spiking activity was restricted to single action potentials or short bursts; an original template-matching method (Greenberg et al., 2008
, SI) applied to the calcium signal alone successfully extracted spike times with good accuracy. In adult zebrafish brain and nose explants, in a study combining soma calcium-signal and voltage recordings, Yaksi and Friedrich (2006)
used a deconvolution method to extract spiking activity of sensory neurons stimulated with odors. The method assumed that each action potential gives rise to a stereotyped somatic calcium transient with mono-exponential decay over time, and that calcium summation caused by a train of action potentials is described well by a simple convolution of a mono-exponential kernel with the spike-train. This approach gave good firing-rate reconstructions
with image sampling rates of ∼30 Hz on neuronal populations of adult zebrafish (Tabor et al., 2008
; Yaksi and Friedrich, 2006
), a remarkable achievement.
Note that most past attempts to extract spiking activity from single neurons have been performed using the fluorescence of calcium indicators recorded at the soma. In invertebrates such as insects, spike-related calcium/fluorescence transients are usually smaller from the soma (sometimes even absent, as in locust PNs; Moreaux and Laurent, 2007
) than from dendrites; importantly, they can also be slower (∼1 s vs. ∼50 ms, decay times), making the capture of neuronal firing modulation questionable. Usually neurons’ somata are spread out in space (more so in larger brains) hindering the capture of a complete neuronal population, even with fast scanning imaging techniques (Göbel et al. 2007
; Holekamp et al., 2008
; Reddy et al., 2008
), and imposing non-ideal trade-offs between spatio-temporal resolution and signal/noise. Each approach should thus be tailored to its experimental system; all methods do not fit all experimental and biological situations. Here we focus on one system, the locust olfactory system, and propose an easily modified method to extract firing-rate estimates from calcium-dendritic signals recorded in vivo using the common calcium indicator OGB-1.
The early olfactory system – olfactory bulb (vertebrates) or antennal lobe (insects) – with its well organized glomerular anatomy offers a beautiful opportunity to use dendritic calcium imaging to help decipher basic rules of sensory processing (Buck and Axel, 1991
; Hallem et al., 2004
; Mombaerts et al., 1996
; Vosshall et al., 2000
). In the exploration of such a sensory system, intrinsic and calcium imaging of glomeruli have been used in vivo to investigate spatio-temporal activity patterns of input, output and local neurons. Typically, imaging of glomeruli using various kinds of fluorescent calcium indicators has been used as a proxy for electro-physiological recordings (Carlsson et al., 2005
; Fried et al., 2002
; Friedrich and Korsching, 1997
; Galizia et al., 1999
; Sachse and Galizia, 2002
; Spors et al., 2006
; Wachowiak and Cohen, 2001
; Wang et al., 2003
). An important point to elucidate in insect antennal lobe circuits is the true relationship between spike output and imaging data in PNs, the antennal lobe’s sole output. We address this issue in locust, combining dendritic voltage recordings and two-photon
calcium imaging
in vivo during odor stimulation in intact, non-anesthetized animals (Figure 1
). Our goal was to identify the main causes of calcium signal fluctuations, to determine whether calcium signals might be used to estimate PNs spike output, and if so, with what accuracy.
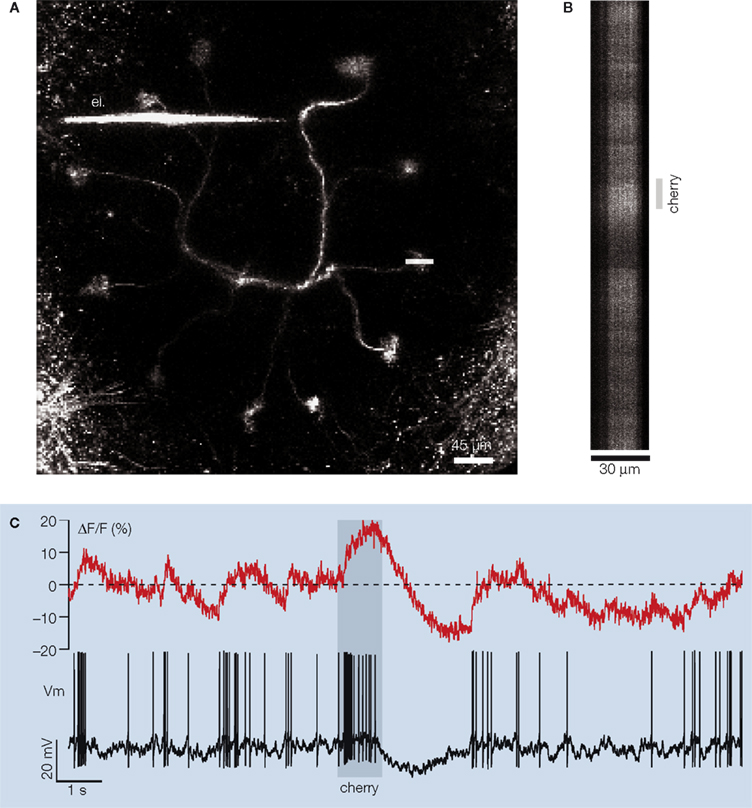
Figure 1. In vivo simultaneous dendritic voltage recordings and two-photon calcium imaging in the locust projection neuron. (A) A frontal view of a PN labeled from a secondary dendrite via a microelectrode (el.) filled with the fluorescent calcium indicator OGB-1. Eleven of the PN’s 12 glomerular tufts can be seen, forming a circle in one plane. The soma and axon of the neuron are respectively above and below the dendritic plane (not included in this view). Shortly after dendritic impalement, one of the several tufts of the PN is selected for fluorescence imaging (horizontal white line). Calcium signal is then acquired simultaneously with voltage across the glomerular tuft using a line scan (typically 30 μm × 24 s). (B) Example of a single 16 s-long line-scan trial during odor presentation [different PN from that in (A)]. (C) Glomerular calcium ΔF/F integrated along the scanned line [500 Hz sampling, PN in (B)] and simultaneous intracellular membrane potential Vm (15 kHz sampling). Stippled line: average baseline fluorescence before odor presentation to the animal. Note the complex modulations of the calcium signal and their relationship to voltage.
Locust PNs are multiglomerular neurons, with projections to 10 or so individual glomeruli (∼30 μm diameter each). The adult locust antennal lobe contains about 1,000 glomeruli, distributed in a sphere of about 300 μm diameter. The glomeruli visited by individual PNs, however, always lie in a plane. By correctly orienting the preparation, all the glomeruli of a stained PN can thus be observed in one plane of focus. The planes defined by all PNs are parallel to one another. For our experiments, a fine borosilicate micropipette was back-filled with OGB-1, gently advanced into the neuropil and used to impale one PN, usually in its principal omega-shaped dendrite, or in a secondary dendrite close to a glomerular tuft (Figure 1
A). Recordings could often be held for several tens of minutes. Odors were presented to the animal in 1 s long pulses, and 24 s of calcium-indicator and intracellular-voltage data were collected (500 Hz image sampling) around the odor stimulus pulse (early fragment shown in Figures 1
B,C). Our data thus contained long epochs of baseline activity, stimulus-evoked responses and recovery periods. PN electrical activity recorded in these experiments was identical (baseline activity; response characteristics; peak firing rates; range of response types; oscillatory activity) to that previously described, using different recording methods (soma intracellular recordings: Laurent and Davidowitz, 1994
; Laurent et al., 1996
; tetrode extracellular recordings: Mazor and Laurent, 2005
; Perez-Orive et al., 2002
).
Locust PN dendritic calcium signals are composed of multiple, distinct components. Our experiments suggested that at least three factors (Figure 2
A) contribute to the variation of calcium in a glomerular dendrite (Moreaux and Laurent, 2007
): calcium transients triggered by action potentials, voltage-dependent calcium entry caused by sub-threshold depolarization, and calcium clearance. First, we observed that a single action potential always produced a detectable calcium increase; single-spike calcium decay time was fast (∼50 ms) after pharmacological blockade of nicotinic-Ach-receptor mediated synaptic input, but slower and non-stereotyped (variable across the glomerular dendrites of a single PN for example) in intact conditions. Spike trains always led to a calcium signal summation. Second, spontaneous or stimulus-evoked sub-threshold depolarizations caused, from a membrane voltage of about −60 mV, a detectable calcium signal (Figure 2
B). While insect nicotinic receptors are known to be calcium permeable, much of this sub-threshold calcium signal seemed to be voltage-dependent, for it could be reproduced simply by depolarizing-current injection. By contrast with observations from somatic imaging, calcium clearance after summation in the dendrite was not necessarily mono-exponential. This might be due to local hyper-polarizing inputs from inhibitory pathways. Because these multiple contributions to the calcium signal sampled may interact in complicated (or at least poorly understood) ways, the extraction of a PN spike output is clearly not a straightforward exercise, especially if attaining single-spike resolution is required. We now summarize an empirical method for instantaneous firing-rate estimation, based on the above data and knowledge.
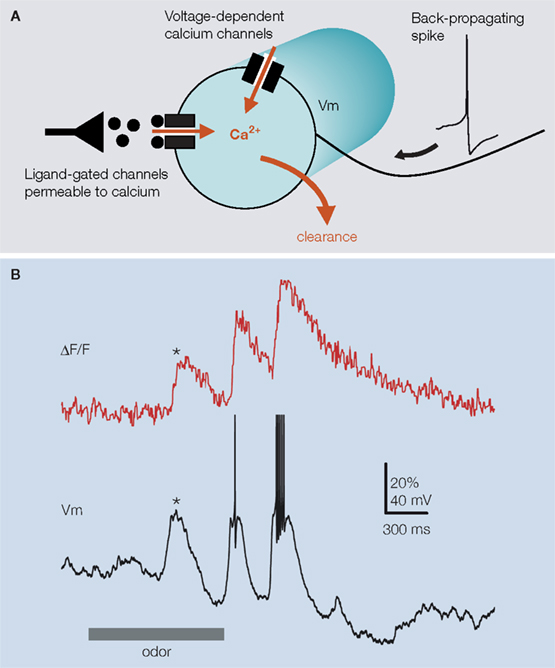
Figure 2. Projection neuron dendritic calcium signals have multiple components as illustrated in (A) with a simple schematic of a PN-glomerular dendritic compartment (circle). The majors sources of calcium variation are back-propagating spikes triggering fast calcium transients trough high-threshold voltage-dependent calcium-channels, sub-threshold depolarizing activity (through low-activated voltage-dependent calcium-channels, possibly also by activation of calcium-permeable ligand-gated channels), and clearance. (B) Calcium signals are not always correlated with spiking. Simultaneous fluorescence and voltage PN-recording illustrates the occurrence of spike-independent components in the glomerular signal. Odor-evoked depolarizing synaptic input to the PN marked (*) can produce a significant calcium elevation in the absence of spike.
Having access to simultaneously recorded voltage and fluorescence, we investigated (Moreaux and Laurent, 2007
) whether a PN’s firing rate could be extracted from its glomerular calcium signal recorded at high sampling rate (500 Hz) using empirically derived routines selective for spike-dependent signals. The goal was to transform the fluorescence of the calcium indicator into spiking activity, using consistent rules and ultimately, a small number of experiment-specific measurements that require no physiological recording. We managed to estimate a PN’s firing activity with a 50-ms time resolution from a single fluorescence recording, using one experiment-specific parameter and a minimal neuron-specific calibration. In its principle, our estimation method relies on two assumptions: (1) when calcium summation occurs, the intracellular calcium value is linearly related to the average firing rate of the spike-train causing calcium integration, and (2) calcium decays are due either to cessation of firing or to inhibition. With this in mind, the main steps of our algorithm are the following (see flowchart in Figure 3
). A fluorescence single trial is smoothed with a Gaussian filter, to “enhance” the fluorescence plateaus (or peaks) and the end of the fluorescence-decays (called valleys). The level of fluorescence representing the absence of firing at baseline (FB, see Figure 4
) needs to be determined, so that the assumed linear relationship between the optical signal and firing can be used. FB is the rest value of the spike-independent components, due mainly to net, depolarizing synaptic bombardment. The fluorescence trace is then normalized to this value. Then, peaks and valleys are detected to define segments of activity. Practically, one has to check that the first peak of the recording comes after the first valley and the last peak comes after the last valley. The value read for a given valley is then subtracted from all following fluorescence values, until the next peak is reached. This step sets all the ends of decay to 0 and guarantees a coherent proportionality between the normalized fluorescence and the actual firing rate while not yet accounting for calcium summation. The values from a peak to the next valley are reset to 0 using a simple Gaussian-decay function. Calcium summation is now taken into consideration by comparing the time interval between a valley and the previous peak to a characteristic time, Tc, the duration over which spike-evoked calcium summation is not relevant. If this time interval <Tc, summation must be factored in: the valley value is added to the following values until the next peak. Only positive values of the reconstruction are kept and scaling is applied. Setting a threshold around the average spontaneous spiking activity filters out large time-resolved synaptic events.
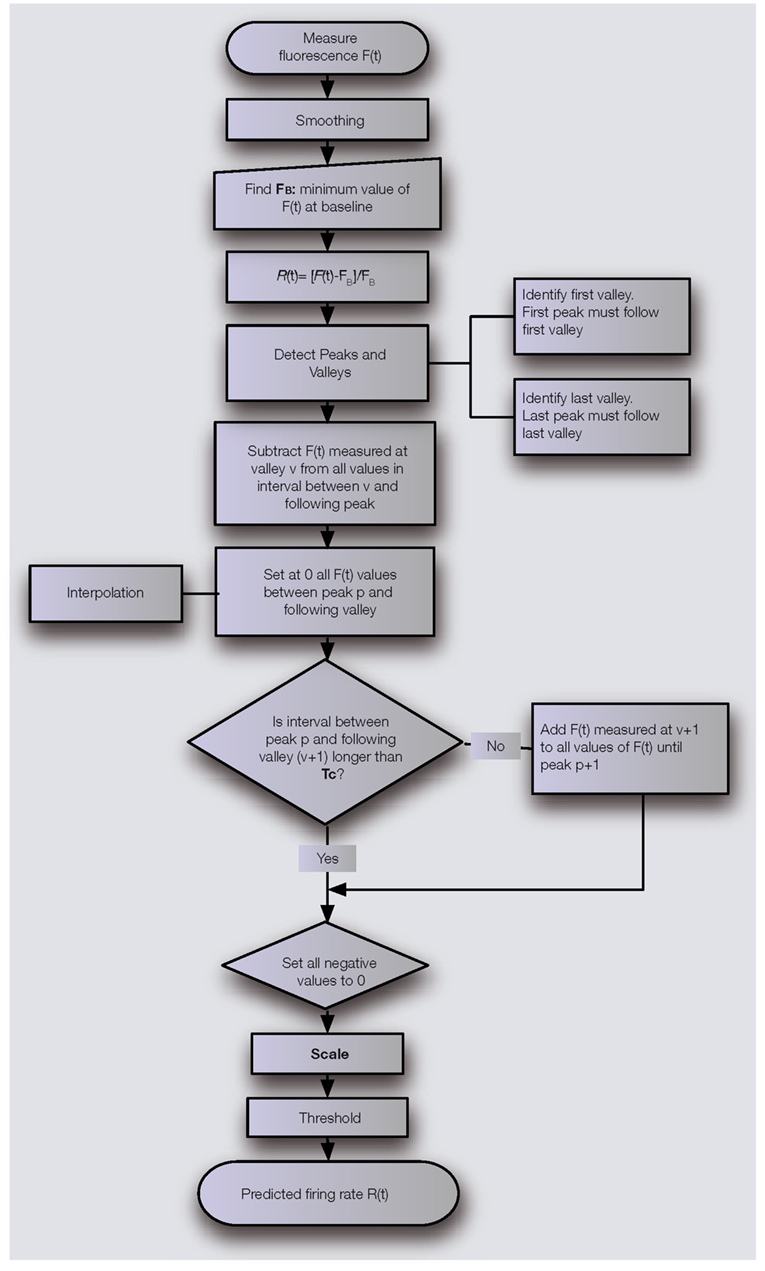
Figure 3. Simple algorithm used to transform the measure of a calcium indicator fluorescence F(t) into a prediction of the firing rate R(t). The algorithm relies on the determination of two parameters: a time parameter Tc and a scaling factor S specific to the indicator and to the cell type under investigation.
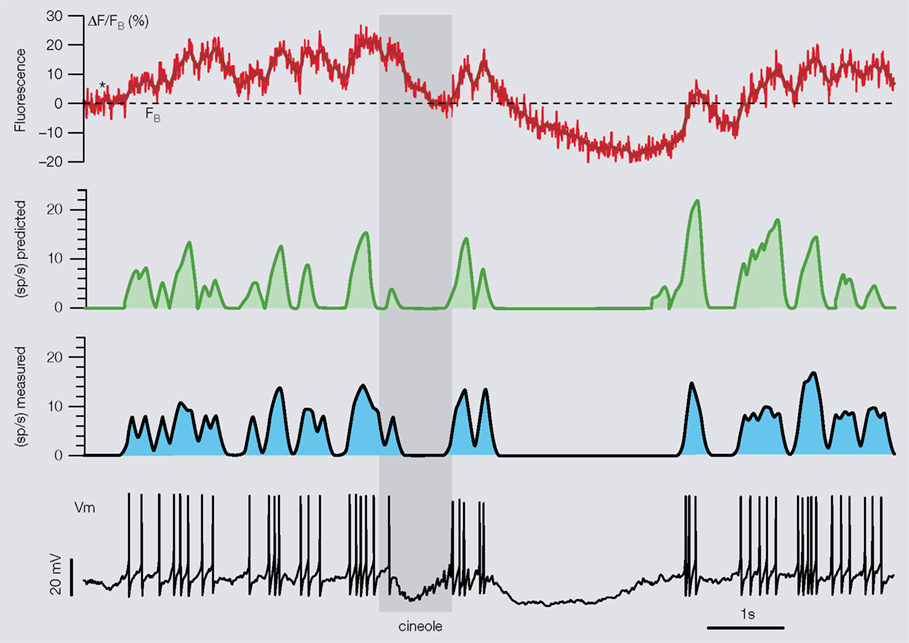
Figure 4. Calibration of our method with paired imaging and electrophysiology. The determination of the neuron-type/indicator’s two specific parameters (Tc, S) is done by optimizing the match between measured firing rate (blue trace, 50-ms Gaussian smoothing) obtained from intracellular trace (Vm) and predicted smoothed firing rate (green trace) reconstructed from the calcium trace (red) using the simple rules describe in the text. For the specific PN/OGB-1 combination, the two calibration parameters were extracted from only five 16 s-long single trials with 1 s odor presentations on different PNs. Stippled line (fluorescence trace) indicates FB, the only experiment-specific measurement.
A mapping between calcium signals and voltage (or firing rates) appropriate for integrative studies is probably attainable, regardless of the methodology, only if some prior calibration steps have been carried out in the same preparation and experimental conditions. In practice, because simultaneous voltage and calcium recordings in vivo in non-anesthetized animals tend to be difficult, the calibration steps should be as limited as possible. Our method relies on the knowledge of three parameters. The first, FB (see Figure 4
), is experiment-specific and requires no prior calibration (i.e., no paired imaging and electrophysiology). The other two (time parameter, Tc, and scaling factor, S), are the only two parameters requiring calibration through prior paired imaging and electrophysiology. With locust PNs and the calcium indicator OGB-1, these two parameters could be estimated satisfactorily from paired simultaneous voltage and calcium recordings in five different animals and by optimizing the overall fit between predicted (from calcium signal) and measured (with a microelectrode) firing rates (Figure 4
).
Once the calibration done, our method was applied to predict PN firing patterns from calcium signals, using different paired recordings as tests. We obtained ∼80–90% mean accuracy. In each experiment, FB was the only experiment-specific parameter required (Figure 5
).
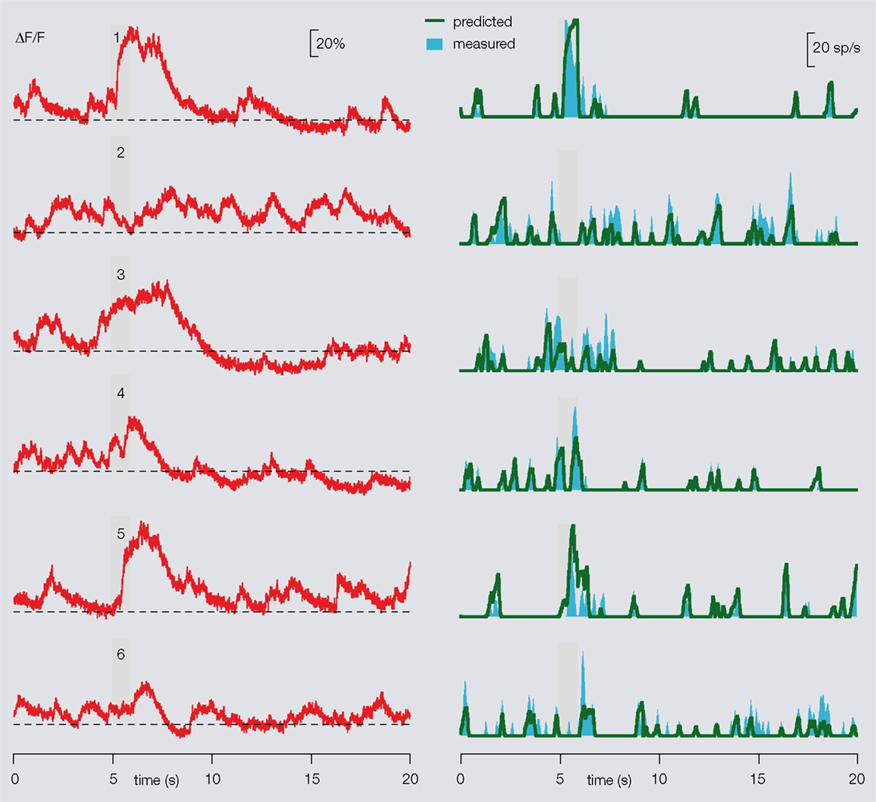
Figure 5. Prediction of a PN’s firing profiles from its dendritic calcium signals. After the specific PN/OGB-1 calibration, the algorithm may be applied to single PN-odor calcium imaging alone, baseline FB being the only trial-specific parameter, as illustrated here. Left: raw fluorescence traces recorded from one PN in response to six different odors (stimulus during gray bar). Stipple line indicates FB for each trial. Right: predicted (from left, green) and measured (cyan) smoothed firing rates. An overall 80–90% mean accuracy is obtained.
When exogenous calcium indicators are used, a key issue for firing-rate-estimate accuracy is the consistency of cytoplasmic concentration of the indicator across experiments. With bolus loading techniques, great care (usually acquired after much practice) is required to minimize inter-experiment variations. With multi-cellular labeling, spatial gradients of calcium indicator concentrations may clearly create problems (Göbel and Helmchen, 2007
). The time and scaling parameters are related to the calcium-buffering capacity added to the neuron’s own by the indicator. In our hands, following strict experimental procedures, the across-experiment variance of the time parameter Tc was very small (∼5%). The major source of error originated from the variance of the scaling parameter, due to a deviation from the assumed linearity between calcium elevation and firing rate. There are at least two distinct potential sources of non-linearity: (1) from the fluorescent calcium indicator itself and (2) from intrinsic cellular properties. The latter especially makes defining a ceiling an empirical issue. With locust PNs and OGB1, we observed that the deviation from linear prediction was usually small for short-lived bursts of high-firing rate (PNs rarely fire at rates >60 sp/s), but larger (and always and underestimate) during prolonged periods of firing, presumably due to a contribution of sustained synaptic inputs and sub-linear summation with spike-related calcium entry. Under pharmacological blockade of synaptic input (in conditions admittedly without much use for network issues), the variance of the scaling factor S was consistent with that of the time parameter measured in normal in vivo condition. Non-linear summation of spike-related events at high-firing rates and the superposition of sub-threshold and spike-dependent components, presumably non-linear, are probably responsible for the variance of the scaling factor.
If activity is sparse and stereotyped (e.g., short burst of few action potentials), if calcium decay time is shorter than the minimum inter-spike (or burst) interval, and if the correlation between calcium elevation and spiking has been properly established in a cell-specific manner (see Lin et al., 2007
for a warning), then template-matching methods applied to somatic calcium signals can provide a good estimate of the “on/off” state of a single or population of neurons (Greenberg et al. 2008
). In the presence of sustained spiking activity, as in sensory receptor neurons for example, the task of estimating firing rates from calcium signals can be more delicate. The deconvolution approach of Yaksi and Friedrich (2006)
assumes that spike-related calcium-transients are stereotyped. Deconvolution is performed in the frequency domain, as a high-pass filter applied to the de-noised calcium spectrum. A calibration step requires the determination of the average filter parameters from simultaneous voltage and calcium recordings. Like all inverse problems, this method is very sensitive to signal-to-(high-frequency) noise ratio. It is also computationally intensive. Finally, the required stereotypy of calcium decay is probably met mainly when fast calcium fluctuations are damped, as expected in somata. Our approach is the opposite. No assumption is made about calcium decays associated with interruptions of firing. We impose a simple reset of those segments, detected in the time domain, and take calcium summation into account following a very simple rule. This method is computationally trivial and less sensitive to noise: we detect extrema rather than invert matrices in the frequency domain. Reconstruction accuracy is ∼80–90% on average – i.e., comparable to Yaksi and Friedrich’s method (2006)
– using raw calcium signals recorded at dendritic sites. The simplicity of the approach should be an advantage if large datasets are to be analyzed. The counterpoint is that our method so far rests on acquiring fast/dendritic calcium signals. Those are potentially well suited for systems such as the olfactory bulb and antennal lobe, where processing occurs in compact glomeruli. How the method fares in different systems, where dendrites are more widespread, remains to be tested.
The authors declare that the research was conducted in the absence of any commercial or financial relationships that could be construed as a potential conflict of interest.