 Alina A. von Davier
 Pak Chung Wong
 Steve Polyak
 Michael Yudelson
- ACTNext, ACT Inc, Iowa City, IA, United States
In recent years, work with educational testing data has changed due to the affordances provided by technology, the availability of large data sets, and by the advances made in data mining and machine learning. Consequently, data analysis has moved from traditional psychometrics to computational psychometrics. Despite advances in the methodology and the availability of the large data sets collected at each administration, the way assessment data is collected, stored, and analyzed by testing organizations is not conducive to these real-time, data intensive computational methods that can reveal new patterns and information about students. In this paper, we propose a new way to label, collect, and store data from large scale educational learning and assessment systems (LAS) using the concept of the “data cube.” This paradigm will make the application of machine-learning, learning analytics, and complex analyses possible. It will also allow for storing the content for tests (items) and instruction (videos, simulations, items with scaffolds) as data, which opens up new avenues for personalized learning. This data paradigm will allow us to innovate at a scale far beyond the hypothesis-driven, small-scale research that has characterized educational research in the past.
Introduction
In recent years, work with educational testing data has changed due to the affordances provided by technology, availability of large data sets, and due to advances made in data mining and machine learning. Consequently, data analysis moved from traditional psychometrics to computational psychometrics. In the computational psychometrics framework, psychometric theory is blended with large scale, data-driven knowledge discovery (von Davier, 2017). Despite advances in the methodology and the availability of the large data sets collected at each test administration, the way the data (from multiple test forms at multiple test administrations) is currently collected, stored and analyzed by testing organizations is not conducive to these real-time, data intensive computational psychometrics and analytics methods that can reveal new patterns and information about students.
In this paper we primarily focus on data collected from large-scale standardized testing programs that have been around for decades and that have multiple administrations per year. Recently, many testing organizations have started to consider including performance or activity-based tasks in the assessments, developing formative assessments, or embedding assessments into the learning process, which led to new challenges around the data governance: data design, collection, alignment, and storage. Some of these challenges have similarities with those encountered and addressed in the field of learning analytics, in which multiple types of data are merged to provide a comprehensive picture of students' progress. For example, Bakharia et al. (2016), Cooper (2014) and Rayon et al. (2014) propose solutions for the interoperability of learning data coming from multiple sources. In recent years, the testing organizations started to work with logfiles and even before the data exchange standards for activities and events, such as the Caliper or xAPI standards, have been developed, researchers have worked on designing the data schema for this type of rich data (see Hao et al., 2016). The approach presented in this paper conceptually builds on these approaches, being focused on the data governance for testing organizations.
Database Alignment
In this paper, we propose a new way to label, collect, and store data from large scale educational learning and assessment systems (LAS) using the concept of the “data cube,” which was introduced by data scientists in the past decade to deal with big data stratification problems in marketing contexts. This concept is also mentioned by Cooper (2014) in the context of interoperability for learning analytics. In statistics and data science the data cube is related to the concept of database alignment, where multiple databases are aligned on various dimensions under some prerequisites (see Gilbert et al., 2017). Applying this paradigm to educational test data is quite challenging, due to the lack of coherence of traditional content tagging, of a common identity management system for test-takers across testing instruments, of collaboration between psychometricians and data scientists, and until recently, of the lack of proven validity of the newly proposed machine learning methods for measurement. Currently, data for psychometrics is stored and analyzed as a two-dimensional matrix—item by examinee. In the time of big data, the expectation is not only that one has access to large volumes of data, but also that the data can be aligned and analyzed on different dimensions in real time—including various item features like content standards.
The best part is that the testing data available from the large testing organizations is valid (the test scores measure what they are supposed to measure, and these validity indices are known) and data privacy policies have been followed appropriately when the data was collected. These are two important features that support quality data and the statistical alignment of separate databases (see Gilbert et al., 2017).
Data Cubes
The idea of relational databases has evolved over time, but the paradigm of the “data cube” is easy to describe. Obviously, the “data cube” is not a cube, given that different data-vectors are of different lengths. A (multidimensional) data cube is designed to organize the data by grouping it into different dimensions, indexing the data, and precomputing queries frequently. Psychometricians and data scientists can interactively navigate their data and visualize the results through slicing, dicing, drilling, rolling, and pivoting, which are various ways to query the data in a data science vocabulary. Because all the data are indexed and precomputed, a data cube query often runs significantly faster than standard queries. Once a data cube is built and precomputed, intuitive data projections on different dimensions can be applied to it through a number of operations. Traditional psychometric models can also be applied at scale and in real time in ways which were not possible before.
Content as Data
Additionally, in this paper we expand the traditional definition of educational data (learning and testing data) to include the content (items, passages, scaffolding to support learning), taxonomies (educational standards, domain specification), the items' metadata (including item statistics, skills and attributes associated with each item), alongside the students' demographics, responses, and process data. Rayon et al. (2014) and Bakharia et al. (2016) also proposed including the content and context for learning data in their data interoperability structures for learning analytics, Scalable Competence Assessment through a Learning Analytics approach (SCALA), and Connected Learning Analytics (CLA) tool kit, respectively. The difference from their approach is in the specifics of the content for tests (items), usage in psychometrics (item banks with metadata), and domain structures such as taxonomies or learning progressions. In addition, we propose a natural language processing (NLP) perspective on these data types that facilitates the analysis and integration with the other types of data.
Any meaningful learning and assessment system is based on a good match of the samples of items and test takers, in terms of the difficulty and content on the items' side, and ability and educational needs on the students' side. In order to facilitate this match at scale, the responses to the test items, the items themselves and their metadata, and demographic data, need to be aligned. Traditionally, in testing data, we collected and stored the students' responses and the demographic data, but the items, instructional content, and the standards have been stored often as a narrative and often it has not been developed, tagged, or stored in a consistent way. There are numerous systems for authoring test content, from paper-based, to Excel spreadsheets, to sophisticated systems. Similarly, the taxonomies or theoretical frameworks by which the content is tagged are also stored in different formats and systems, again from paper to open-sources systems, such as OpenSALT. OpenSALT is an Open source Standards ALignment Tool that can be used to inspect, ingest, edit, export and build crosswalks of standards expressed using the IMS Global Competencies and Academic Standards Exchange (CASE) format; we will refer to data standards and models in more detail later in the paper. Some testing programs have well-designed item banks where the items and their metadata are stored, but often the content metadata is not necessarily attached to a taxonomy.
We propose that we rewrite the taxonomies and standards as data in NLP structures that may take the form of sets, or mathematical vectors, and add these vectors as dimensions to the “data cube.” Similarly, we should vectorize the items' metadata and/or item models and align them on different dimensions of the “cube.”
Data Lakes
The proposed data cube concept could be embedded within the larger context of psychometric data, such as ACT's data lake. At ACT, we are building the LEarning Analytics Platform (LEAP) for which we proposed an updated version of this data-structure: the in-memory database technology that allows for newer interactive visualization tools to query a higher number of data dimensions interactively. A data lake is a storage solution based on an ability to host large amounts of unprocessed, raw data in the format the sender provides. This includes a range of data representations such as structured, semi-structured, and unstructured. Typically, in a data lake solution, the data structure, and the process for formally accessing it, are not defined until the point where access is required. An architecture for a data lake is typically based on a highly distributed, flexible, scalable storage solution like the Hadoop Distributed File System (HDFS). These types of tools are becoming familiar to testing organizations, as the volume and richness of event data increase. They also facilitate a parallel computational approach for the parameter estimation of complex psychometric models applied to large data sets (see von Davier, 2016).
Data Standards for Exchange
Data standards allow those interoperating in a data ecosystem to access and work with this complex, high-dimensional data (see for example, Cooper, 2014). There are several data standards that exist in the education space which allow schools, testing, and learning companies to share information and build new knowledge, such as combining the test scores with the GPA, attendance data, and demographics for each student in order to identify meaningful patterns that may lead to differentiated instructions or interventions to help students improve. We will describe several of these standards and emphasize the need for universal adoption of data standards for better collaboration and better learning analytics at scale.
In the rest of the paper, we describe the evolution of data storage and the usefulness of the data cube paradigm for large-scale psychometric data. We then describe the approach we are considering for testing and learning data (including the content). In the last section, we present preliminary results from a real-data example of the alignment of two taxonomies from the taxonomy-dimension in the “data cube.”
The Foundations of the Data Cube and Its Extensions
Background and Terminology
In computer science literature, a data cube is a multi-dimensional data structure, or a data array in a computer programming context. Despite the implicit 3D structural concept derived from the word “cube,” a data cube can represent any number of data dimensions such as 1D, 2D… nD. In scientific computing studies, such as computational fluid dynamics, data structures similar to a data cube are often referred to as scalars (1D), vectors (2D), or tensors (3D). We will briefly discuss the concept of the relational data model (Codd, 1970) and the corresponding relational databases management system (RDBMS) developed in the 70's, followed by the concept of the data warehouse (Inmon, 1992; Devlin, 1996) developed in the 80's. Together they contributed to the development of the data cube (Gray et al., 1996) concept in the 90's.
Relational Data Model and Relational Databases Management System (RDBMS)
In a relational data model, data are stored in a table with rows and columns that look similar to a spreadsheet, as shown in Figure 1. The columns are referred to as attributes or fields, the rows are called tuples or records, and the table that comprises a set of columns and rows is the relation in RDMBS literature.
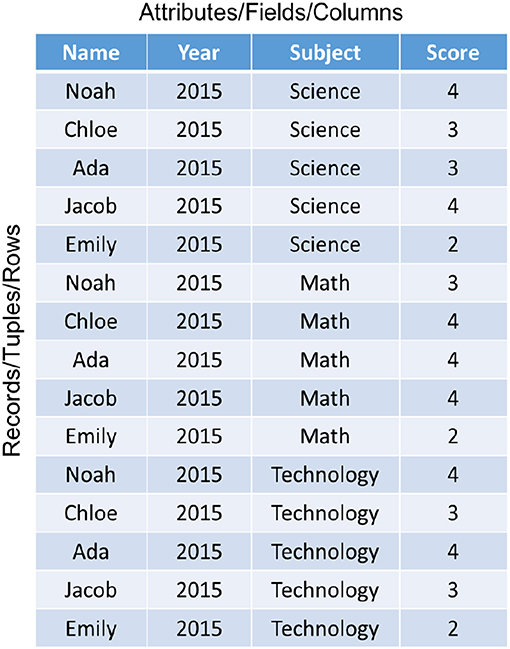
Figure 1. A relational database.
The technology was developed when CPU speed was slow, memory was expensive, and disk space was limited. Consequently, design goals were influenced by the need to eliminate the redundancies (or duplicated information), such as “2015” in the Year column in Figure 1, through the concept of normalization. The data normalization process involves breaking down a large table into smaller ones through a series of normal forms (or procedures). The discussion of the normalization process is important, but beyond the scope of this paper. Readers are referred to Codd (1970) for further details.
Information retrieval from these normalized tables can be done by joining these tables through the use of unique keys identified during the normalization process. The standard RDBMS language for maintaining and querying a relational database is Structured Query Language (SQL). Variants of SQL can still be found in most modern day databases and spreadsheet systems.
Data Warehousing
The concept of data warehousing was presented by Devlin and Murphy in 1988, as described by Hayes (2002). A data warehouse is primarily a data repository from one or more disparate sources, such as marketing or sales data. Within an enterprise system, such as those commonly found in many large organizations, it is not uncommon to find multiple systems operating independently, even though they all share the same stored data for market research, data mining, and decision support. The role of data warehousing is to eliminate the duplicated efforts in each decision support system. A data warehouse typically includes some business intelligence tools, tools to extract, transform, and load data into the repository, as well as tools to manage and retrieve the data. Running complex SQL queries on a large data warehouse, however, can be time consuming and too costly to be practical.
Data Cube
Due to the limitations of the data warehousing described above, data scientists developed the data cube. A data cube is designed to organize the data by grouping it into different dimensions, indexing the data, and precomputing queries frequently. Because all the data are indexed and precomputed, a data cube query often runs significantly faster than a standard SQL query. In business intelligence applications, the data cube concept is often referred to as Online Analytical Processing (OLAP).
Online Analytical Processing (OLAP) and Business Intelligence
The business sector developed OnLine Analytical Processing technology (OLAP) to conduct business intelligence analysis and look for insights. An OLAP data cube is indeed a multidimensional array of data. For example, the data cube in Figure 2 represents the same relational data table shown in Figure 1 with scores from multiple years (i.e., 2015–2017) of the same five students (Noah, Chloe, Ada, Jacob, and Emily) in three academic fields (Science, Math, and Technology). Once again, there is no limitation on the number of dimensions within an OLAP data cube; the 3D cube in Figure 2 is simply for illustrative purposes. Once a data cube is built and precomputed, intuitive data projections (i.e., mapping of a set into a subset) can be applied to it through a number of operations.
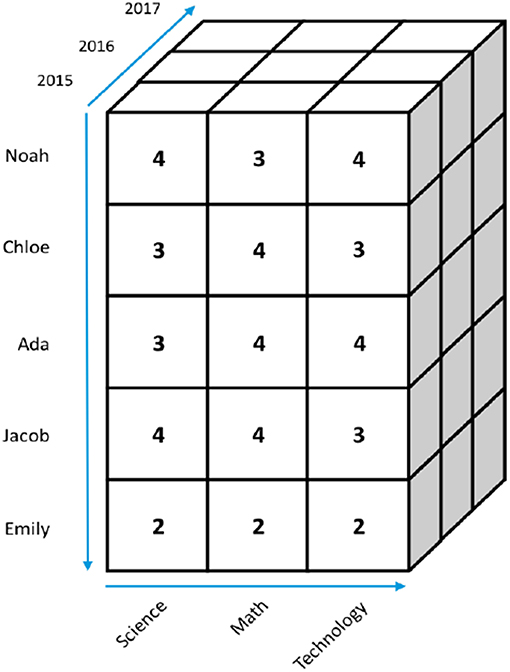
Figure 2. A 3D data cube.
Describing data as a cube has a lot of advantages when analyzing the data. Users can interactively navigate their data and visualize the results through slicing, dicing, drilling, rolling, and pivoting.
Slicing
Given a data cube, such as the one shown in Figure 2, users can, for example, extract a part of the data by slicing a rectangular portion of it from the cube, as highlighted in blue in Figure 3A. The result is a smaller cube that contains only the 2015 data in Figure 3B. Users can slice a cube along any dimension. For example, Figure 4 shows an example of slicing along the Name dimension highlighted in blue, and Figure 5 shows an example of slicing along the Subject dimension.
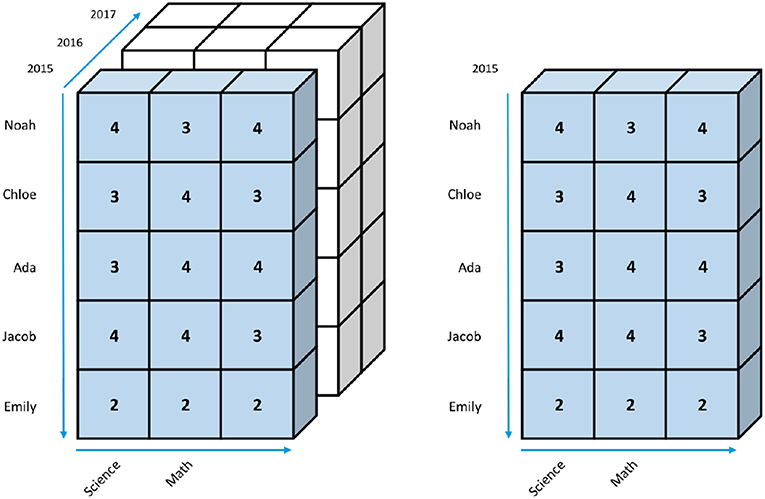
Figure 3. (A,B) Slicing along the Year dimension of a data cube.
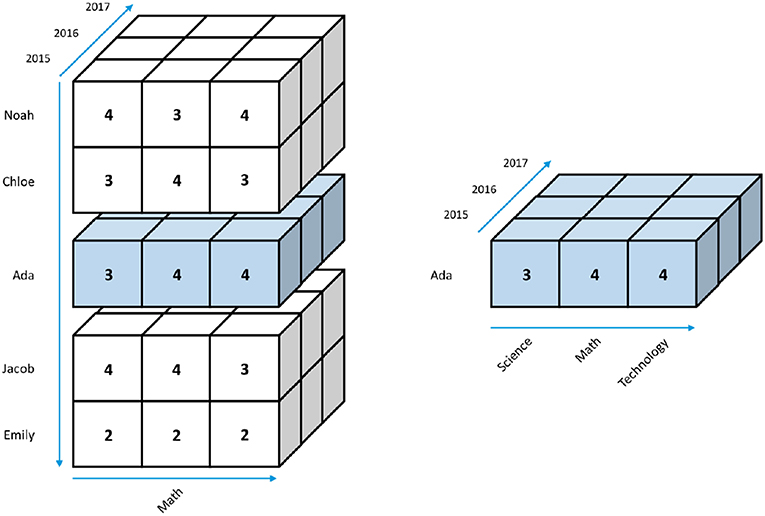
Figure 4. Slicing along the Name dimension of a data cube.
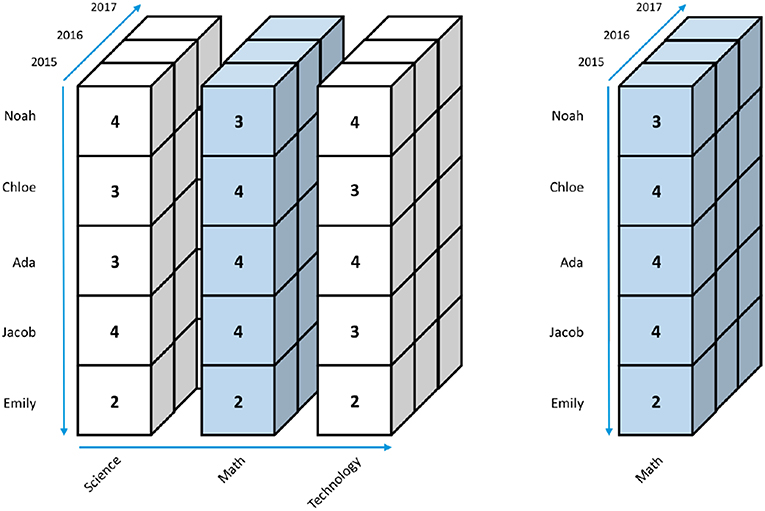
Figure 5. Slicing along the Subject dimension of a data cube.
Dicing
The dicing operation is similar to slicing, except dicing allows users to pick specific values along multiple dimensions. In Figure 6, the dicing operation is applied to both Name (Chloe, Ada, and Jacob) and Subject (Calculus and Algebra) dimensions. The result is a small 2 ×3 ×3 cube shown in the second part of Figure 6.
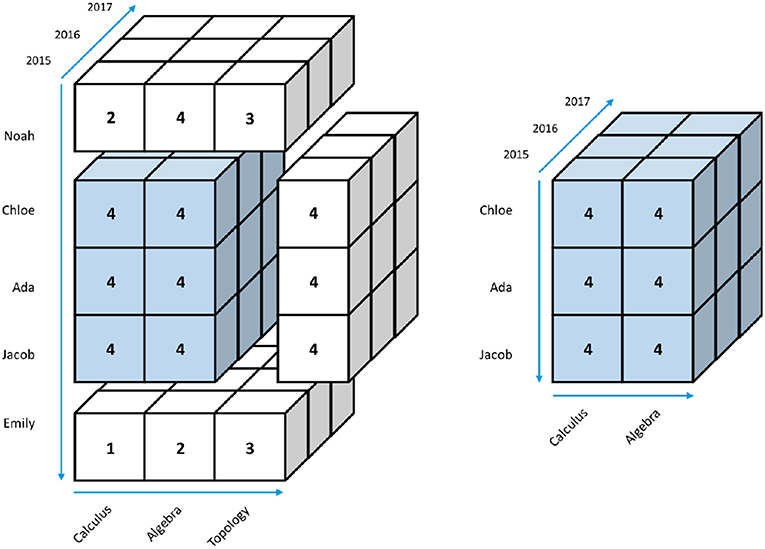
Figure 6. Dicing a 3D data cube.
Drilling
Drilling-up and -down are standard data navigation approaches for multi-dimensional data mining. Drilling-up often involves an aggregation (such as averaging) of a set of attributes, whereas drilling-down brings back the details of a prior drilling-up process.
The drilling operation is particularly useful when dealing with core academic skills that can be best described as a hierarchy. For example, Figure 7A shows four skills of Mathematics (i.e., Number and Quantity; Operations, Algebra, and Functions; Geometry and Measurement; and Statistics and Probability) as defined by the ACT Holistic Framework (Camara et al., 2015). Each of these skill sets can be further divided into finer sub-skills. Figure 7B shows an example of dividing the Number and Quantity skill from Figure 7A into eight sub-skills—from Counting and Cardinality to Vectors and Matrices.
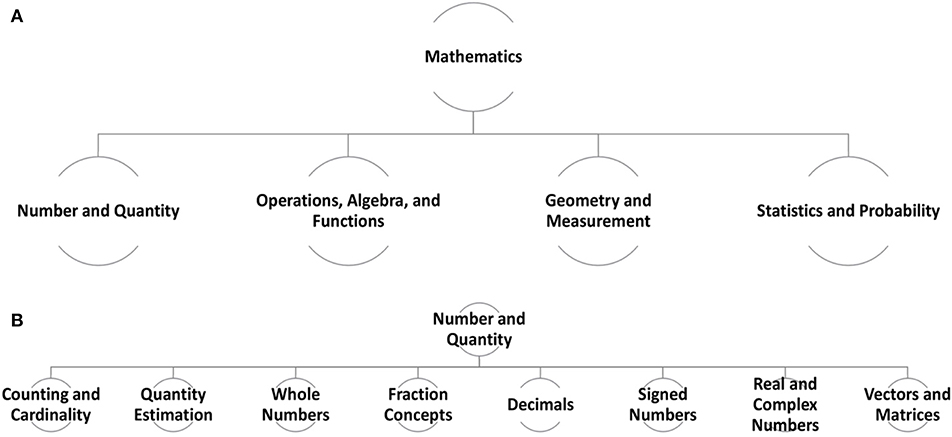
Figure 7. (A) Four skills of Mathematics. (B) Eight sub-skills of the Number and Quantity skill.
Figure 8 shows a drill-down operation in a data cube that first slices along the Subject dimension with the value “Math.” The result is a slice of only the Math scores for all five names from 2015 to 2017 in Figure 8. The drilling-down operation in Figure 8 then shows the single Math score that summarizes the three different Math sub-scores of Calculus, Algebra, and Topology. For example, Emily's 2015 Math score is 2, which is an average of his Calculus (1), Algebra (3), and Topology (2) scores as depicted in Figure 8.
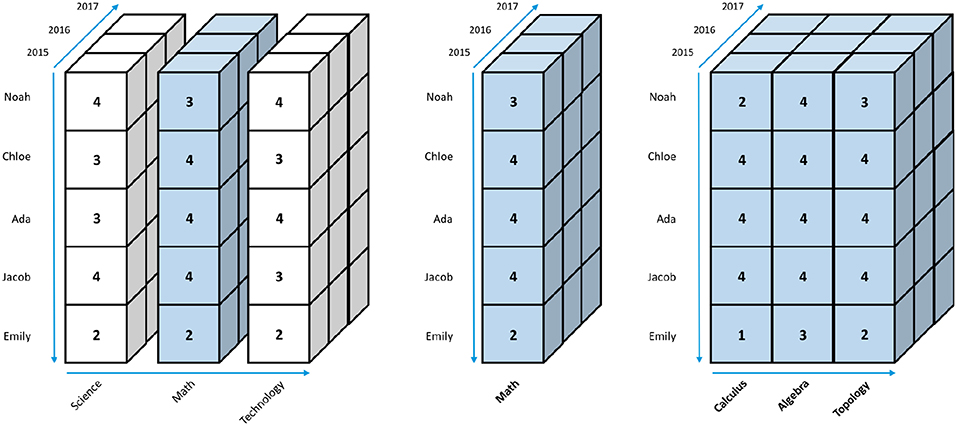
Figure 8. Drilling-down of a data cube.
The drilling-up operation can go beyond aggregation and can apply rules or mathematical equations to multiple dimensions of a cube and create a new dimension for the cube. The idea, which is similar to the application of a “function” on a spreadsheet, is often referred to as “rolling-up” a data cube.
Pivoting
Pivoting a data cube allows users to look at the cube via different perspectives. Figure 9 depicts an example of pivoting the data cube from showing the Name vs. Subject front view in the first part of Figure 9 to a Year vs. Subject in the third part of Figure 9, which shows not just Emily's 2015 scores but also scores from 2016 and 2017. The 3D data cube is indeed rotated backward along the Subject dimension from the middle image to the last image in Figure 9.
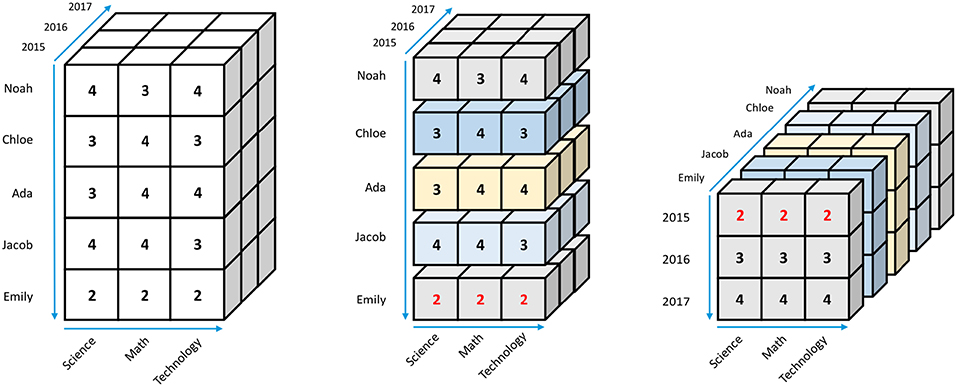
Figure 9. Pivoting a data cube from one perspective (dimensional view) to another.
Beyond Data Cubes
Data cube applications, such as OLAP, take advantage of pre-aggregated data along dimension-levels and provide efficient database querying using languages such as MDX (2016). The more pre-aggregations done on the disk, the better the performance for users. However, all operations are conducted at disk level, which involves slow operation, and thus CPU load and latency issues. As the production cost of computer memory continues to go down and its computational performance continues to go up simultaneously, it has become evident that it is more practical to query data in the memory instead of pre-aggregating data on the disk as OLAP data-cubes.
In-memory Computation
Today, researchers use computer clusters with as much as 1 TB of memory (or more) per computer node for high dimensional, in-memory database queries in interactive response time. For example, T-Rex (Wong et al., 2015) is able to query billions of data records in interactive response time using a Resource Description Framework1 RDF 2014 database and the SPARQL (2008) query language running on a Linux cluster with 32 nodes of Intel Xeon processors and ~24.5 TB of memory installed across the 32 nodes. Because such a large amount of information can be queued from a database in interactive time, the role of data warehouses continues to diminish in the big data era and as cloud computing becomes the norm.
The Traditional Data Cubes Concept
Additionally, in-memory database technology allows researchers to develop newer interactive visualization tools to query a higher number of data dimensions interactively, which allows users to look at their data simultaneously from different perspectives. For example, T-Rex's “data facets” design, as shown in Figure 10A, shows seven data dimensions of a cybersecurity benchmark dataset available in the public domain. After the IP address 172.10.0.6 (in the SIP column) in Figure 10A is selected, the data facets update the other six columns as shown in Figure 10B simultaneously. The query effort continues in Figure 10B where the IP address 172.10.1.102 is queried in the DIP column. Figure 10C shows the results after two consecutive queries, shown in green in the figure.
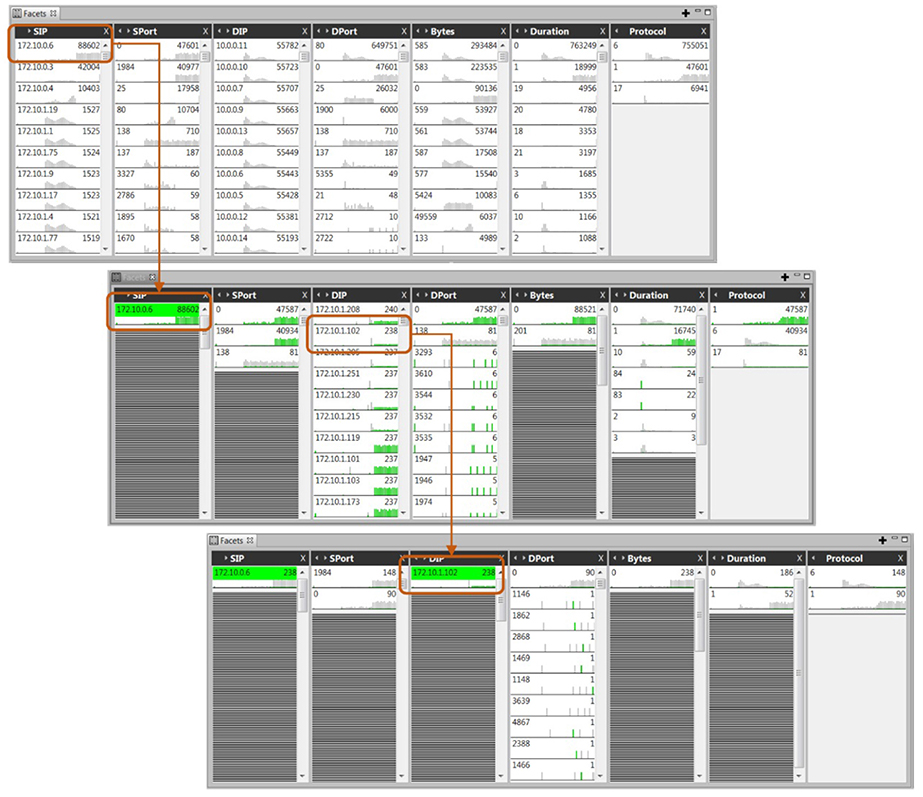
Figure 10. Interactive database queries of a high dimensional dataset.
The spreadsheet-like visual layout in Figure 10 performs more effectively than many traditional OLAP data interfaces found in business intelligence tools. Most importantly, the data facets design allows users to queue data in interactive time without the need for pre-aggregating data with pre-defined options. This video (Pacific Northwest National Laboratory, 2014) shows how T-Rex operates using a number of benchmark datasets available in the public domain.
The general in-memory data cube technology has extensive commercial and public domain support and is here to stay until the next great technology comes along.
Data Cube as Part of a Data Lake Solution and the LEAP for Psychometric Data
The proposed data cube concept could be embedded within the larger context of collecting/pooling psychometric data in something that is known in the industry as a data lake (Miloslavskaya and Tolstoy, 2016). An example of this is ACT's data lake solution known as the LEarning Analytics Platform (LEAP). ACT's LEAP is a data lake is a storage solution based on an ability to host large amounts of unprocessed, raw data in the format the sender provides. This includes a range of data representations such as structured, semi-structured, and unstructured. Typically, in a data lake solution, the data structure, and the process for formally accessing it, are not defined until the point where access is required.
A data lake changes the typical process of: extract data, transform it (to a format suitable for querying) and load in to tables (ETL) into one favoring extract, load and transform (ELT), prioritizing the need to capture raw, streaming data prior to prescribing any specific transformation of the data. Thus, data transformation for future use in an analytic procedure is delayed until the need for running this procedure arises. We now describe how the technologies of a data lake help to embed the data cube analysis functionality we described above.
An architecture for a data lake is typically based on a highly distributed, flexible, scalable storage solution like the Hadoop Distributed File System (HDFS). In a nutshell, an HDFS instance is similar to a typical distributed file system, although it provides higher data throughput and access through the use of an implementation of the MapReduce algorithm. MapReduce here refers to the Google algorithm defined in Dean and Ghemawat (2008). ACT's LEAP implementation of this HDFS architecture is based on the industry solution: Hortonworks Data Platform (HDP) which is an easily accessed set of open source technologies. This stores and preserves data in any format given across a set of available servers as data streams (a flow of data) in stream event processors. These stream event processor uses an easy-to-use library for building highly scalable, distributed analyses in real time, such as learning events or (serious) game play events.
Using map/reduce task elements, data scientists and researchers can efficiently handle large volumes of incoming, raw data files. In the MapReduce paradigm:
“Users define the computation in terms of a map and a reduce function, and the underlying runtime system automatically parallelizes the computation across large-scale clusters of machines, handles machine failures, and schedules inter-machine communication to make efficient use of the network and disk” (Dean and Ghemawat, 2008).
Scripts for slicing, dicing, drilling, and pivoting [See Section Online Analytical Processing (OLAP) and Business Intelligence] in a data cube fashion can be written, executed, and shared via notebook-style interfaces such as those implemented by, for example, open source solutions such as Apache Zeppelin and Jupyter. Zeppelin and Jupyter are web based tools that allow users to create, edit, reuse, and run “data cube”-like analytics using a variety of languages (e.g., R, Python, Scala, etc.). Such scripts can access data on an underlying data source such as HDFS. Organizing analytical code into “notebooks” means combining the descriptive narration of the executed analytical or research methodology along with the code blocks and the results of running them. These scripts are sent to sets of computing machines (called clusters) that manage the process of executing the notebook in a scalable fashion. Data cube applications in the data lake solution typically run as independent sets of processes, coordinated by a main driver program.
Data Standards for Exchange
While data lakes provide flexibility in storage and enable the creation of scaleable data cube analysis, it is also typically a good idea for those operating in a data ecosystem to select a suitable data standard for exchange. This makes it easier for those creating the data, transmitting, and receiving the data to avoid the need to create translations of the data from one system to the next. Data exchange standards allow for the alignment of databases (across various systems), and therefore, facilitate high connectivity of the data stored in the date cube. Specifically, the data exchange standards impose a data schema (names and descriptions of the variables, units, format, etc.) that allow data from multiple sources to be accessed in a similar way.
There are several data standards that exist in the education space that address the data exchange for different types of data, such as:
• Schools Interoperability Framework2 (SIF) Data Model Specification
• SIF is a data sharing, open specification for academic institutions from kindergarten through workforce. The specification is “composed of two parts: an specification for modeling educational data which is specific to the educational locale, and a system architecture based on both direct and assisted models for sharing that data between institutions, which is international and shared between the locales.”
• Ed-Fi Data Standard3
The Ed-Fi Data Standard was developed in order to address the needs of standard integration and organization of data in education. This integration and organization of information ranges across a broad set of data sources so it can be analyzed, filtered, and put to everyday use in various educational platforms and systems.
• Common Education Data Standards (CEDS)4
CEDS provides a lens for considering and capturing the data standards' relations and applied use in products and services. The area of emphasis for CEDS is on data items and representations across the pre-kindergarten, typical K-12 learning, learning beyond high school, as well as jobs and technical education, ongoing adult-based education, and into workforce areas as well.
• IMS Global5 Question and Test Interoperability Specification includes many standards. The most popular are the IMS Caliper and CASE.
° IMS Caliper, which allows us to stream in assessment item responses and processes data that indicate dichotomous outcomes, processes, as well as grade/scoring.
° IMS Global Competencies and Academic Standards Exchange (CASE), which allows us to import and export machine readable, hierarchical expressions of standards knowledge, skills, abilities and other characteristics (KSAOs). One of the notable examples could be found in (Rayon et al., 2014).
• xAPI – Experience API6
xAPI is a specification for education technology that enables collection of data on the wide range of experiences a person has (both online and offline). xAPI records data in a consistent format about an individual or a group of individual learners interacting with multiple technologies. The vocabulary of the xAPI is simple by design, and the rigor of the systems that are able to securely share data streams is high. On top of regulating data exchange, there exists a body of work toward using xAPI for aligning the isomorphic user data from multiple platforms (rf. Bakharia et al., 2016). An example of aligning activity across multiple social networking platforms is discussed. Also, concrete code and data snippets are given.
• OpenSalt7
We have built and released a tool called OpenSALT which is an Open-source Standards ALignment Tool that can be used to inspect, ingest, edit, export and build crosswalks of standards expressed using the IMS Global CASE format.
As we outlined in the data cube overview, we are interested in fusing several main data perspectives:
• Data containing raw item vector analysis data (e.g., correct/incorrect).
• Data containing complex student-item interactions for item classes beyond assessment.
° Examples of complex outcomes may include: partial credit results, media interaction results (play), engagement results, and process data (e.g., time spent browsing), tutored interaction, synergetic activities (e.g., interactive labs).
° Item classes may include: test items, quizzes, and tasks, tutorials, and reading materials.
• Data that contextualizes this item response analysis within a hierarchical expression of learning objectives/standards collection
° Item contextualization that addresses multiple hypotheses of how the conceptualization is structured. Multiple hypotheses include accounts for human vs. machine indexing and alternative conceptualizations in the process for development.
• Demographic data that may include gender, Social and Emotional Skills (SES), locale, and cultural background.
• Item statistical metadata determined during design and calibration stages (beyond contextualization mentioned above).
The selection of which standards to use to accelerate or enhance the construction of data cubes (within data lakes) for large-scale psychometric data depend on the nature of the educational data for the application. For example, CASE is an emerging standard for injecting knowledge about academic competencies whereas something like xAPI is used to inject the direct feed of learner assessment results (potentially aligned to those CASE-based standards) in a standards-based way into a data cube.
By committing to these data standards, we can leverage the unique capability of the data lake (i.e., efficiently ingesting high volumes of raw data relating to item responses and item metadata) while also prescribing structured commitments to incoming data so that we can build robust, reliable processing scripts. The data cube concept then acts as a high-powered toolset that can take this processed data and enable the online analytical operations such as slicing, dicing, drilling, and pivoting. Moreover, the availability of the data cube and alignment of databases will influence the standards that will need to be available for a smooth integration. It is also possible that new standards will be developed.
Example of Applications of the Data Cube Concept
Alignment of Instruments
One of the key elements of an assessment or learning system is the contextualization of the items and learning activities in terms of descriptive keywords that tie them to the subject. The keywords are often referred to as attributes in the Q-matrices (in psychometrics—see Tatsuoka, 1985), skills, concepts, or tags (in the learning sciences). We will use “concepts” as an overarching term for simplicity. Besides items that psychometrics focuses on, the field of learning sciences has a suite of monikers for elements that cater to learning. The latter include: readings, tutorials, interactive visualizations, and tutored problems (both single-loop and stepped). To cover all classes of deliverable learning and assessment items we would use the term “content-based resources” or “resources” for short.
The relationships between concepts and resources are often referred to as indexing. The intensive labor required to create indexes for a set of items can be leveraged via machine learning/NLP techniques over a tremendous corpus of items/resources. This large scale application was not possible before we had present day storage solutions and sophisticated NLP algorithms. More specifically, the production of said indexing is time-consuming, laborious, and requires trained subject matter experts. There are multiple approaches that address lowering the costs of producing indices that contextualize assessment items and learning resources. These approaches can come in the form a machine learning procedure that, given the training data from an exemplary human indexing, would perform automated indexing of resources.
Data cubes can offer affordances to support the process of production and management of concept-content/resource/item indices. First, even within one subject, such as Math or Science, there could be alternative taxonomies or ontologies that could be used to contextualize resources. See Figures 7, 8 for illustrations. Alternatives could come from multiple agencies that develop educational or assessment content or could rely upon an iterative process within one team.
Second, the case when multiple concept taxonomies are used to describe multiple non-overlapping pools of items or resources reserves room for a class of machine learning indexing procedures that could be described as taxonomy alignment procedures. These procedures are tasked with translating between the languages of multiple taxonomies to achieve a ubiquitous indexing of resources.
Third, all classes of machine learning procedures rely upon multiple features within a data cube. The definition and composition of these features is initially developed by subject matter experts. For example, the text that describes the item or resource, its content, or its rationale could be parsed into a high-dimensional linguistic space. Under these circumstances, a deck of binary classifiers (one per concept), or a multi-label classifier could be devised to produce the indexing.
Also, when we are talking about translation form one concept taxonomy to another, one could treat existing expert-produced double-coding of a pool of resources, in terms of the two taxonomies being translated, as a training set. A machine learning procedure, then, would be learning the correspondence relationships. Often, in the form of an n-to-m mapping example, when one item/resource is assigned n concepts from one taxonomy and m from the other.
One of our first attempts with translating two alternative concept taxonomies—between the ACT Subject Taxonomy and ACT Holistic Framework—has yielded only modest results. We had only 845 items indexed in both taxonomies and 2,388 items that only had ACT Subject Taxonomy indexing. Active sets of concepts present in the combined set of 3,233 items included 435 and 455 for the Subject Taxonomy and Holistic Framework respectively. A machine learning procedure based on an ensemble of a deck of multinomial regressions (one per each of the 455 predicted Holistic Framework concepts) yielded a 51% adjusted accuracy. Since the index could be sparse, due to the large size of the concept taxonomy and the lower density of items per concept, and the classic machine learning definition of accuracy (matched classifications over total cases classified) would yield an inflated accuracy result due to overwhelming number of cases where the absence of a concept is easily confirmed (we obtained classical accuracies at 99% level consistently). Adjusted accuracy addresses this phenomenon by limiting the denominator to the union of concepts that were present in the human coder-supplied ground-truth training data, or in the prediction (the latter came in the form of pairings of source and target taxonomy concepts, see Figure 11 for an example). Thus, our work so far and the 51% accuracy should be understood as the first step toward automating taxonomy alignment. We learned that it is significantly harder to align test items than it is to align the instructional resources, because the test items do not usually contain the words that describe the concepts, while the instructional resources do have richer descriptions. This motivated us to include additional data about the test items and the test takers, to increase the samples for the training data, and to refine the models. This is work in progress.
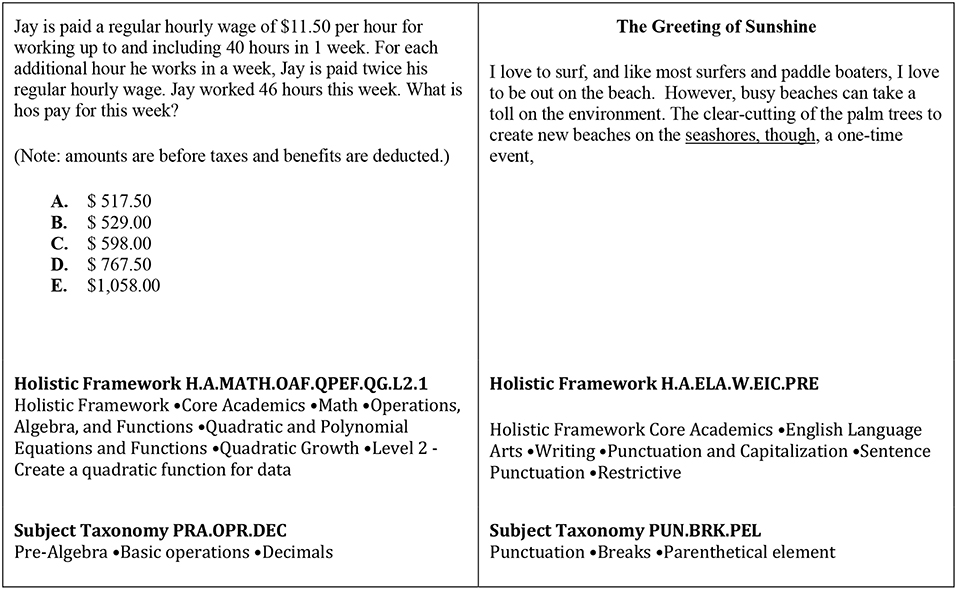
Figure 11. Examples of question items manually tagged with holistic framework and subject taxonomy.
Diagnostic Models
In addition to the alignment of content which is a relatively new application in education, the data cube can support psychometric models that use data from multiple testing administrations and multiple testing instruments. For example, one could develop cognitive diagnostic models (CDMs) that use the data from multiple tests taken by the same individual. CDMs are multivariate latent variable models developed primarily to identify the mastery of skills measured in a particular domain. The CDMs provide fine-grained inferences about the students' mastery and relevance of these inferences to the student learning process.
Basically, a CDM in a data cube relates the response vector Xi = (Xi11, …, Xijt, …, XiJT), where Xijt represents the response of the ith individual to the jth item from the testing instrument t, using a lower dimensional discrete latent variable Ai=(Ai1, …, Aik, …, AiK) and Aik is a discrete latent variable for individual i for latent dimension k as described by the taxonomy or the Q-matrix. CDMs model the conditional probability of observing Xi given Ai, that is, P(Xi|Ai). The specific form of the CDM depends on the assumptions we make regarding how the elements of Ai interact to produce the probabilities of response Xijt.
Traditional data governances in testing organizations cannot easily support the application of the CDMs over many testing administrations and testing instruments: usually the data from each testing instrument is saved in a separate database, that often is not aligned with the data from other instruments. In addition, in the traditional data governance, the taxonomies (and the Q-matrices) across testing instruments are not part of the same framework and are not aligned.
Learning Analytics and Navigation
Another example of the usefulness of a data cube is to provide learning analytics based on the data available about each student. As before, in a data cube, we start with the response vector Xi = (Xi11, …, Xijt, …, XiJT), where Xijt represents the response of the ith individual to the jth item from the testing instrument t. Then, let's assume that we also have ancillary data about the student (demographic data, school data, attendance data, etc.) collected in the vector (or matrix) or Bi=(Bi1, …, Bim, …, BiM) and Bim represents a specific type of ancillary variable (gender, school type, attendance data, etc.). Let's assume that for some students we also have data about their success in college, collected under C. These data, X, B, and C can now be combined across students to first classify all the students, and then later on, to predict the student's success in the first year of college for each student using only the Xi and Bi. Most importantly, these analytics can be used as the basis for learning pathways for different learning goals and different students to support navigation through educational and career journey.
Learning, Measurement, and Navigation Systems
The ACTNext prototype app, Educational Companion, illustrates an applied instance of linking learning, assessment, and navigation data streams using the data governance described above as the data cube. The app was designed as a mobile solution for flexibly handling the alignment of learner data and content (assessment and instructional) with knowledge and skill taxonomies, while also providing learning analytics feedback and personalized resource recommendations based on the mastery theory of learning to support progress in areas identified as needing intervention. Educational Companion evaluates learning progress by continuously monitoring measurement data drawn from learner interactions across multiple sources, including ACT's portfolio of learning and assessment products. Using test scores from ACT's college readiness exam as a starting point, Companion identifies the underlying relationships between a learner's measurement data and skill taxonomies across core academic areas identified in ACT's Holistic Framework (HF). If available, additional academic assessment data is drawn from a workforce skills assessment (ACT WorkKeys), as well as Socio-Emotional Learning (SEL) data taken from ACT's Tessera exam. Bringing these data streams together, the app predicts skill and knowledge mastery at multiple levels in a taxonomy, such as the HF.
See Figure 12 for an illustration of the architecture for the Educational Companion App. More details about this prototype are given in von Davier et al. (2019).
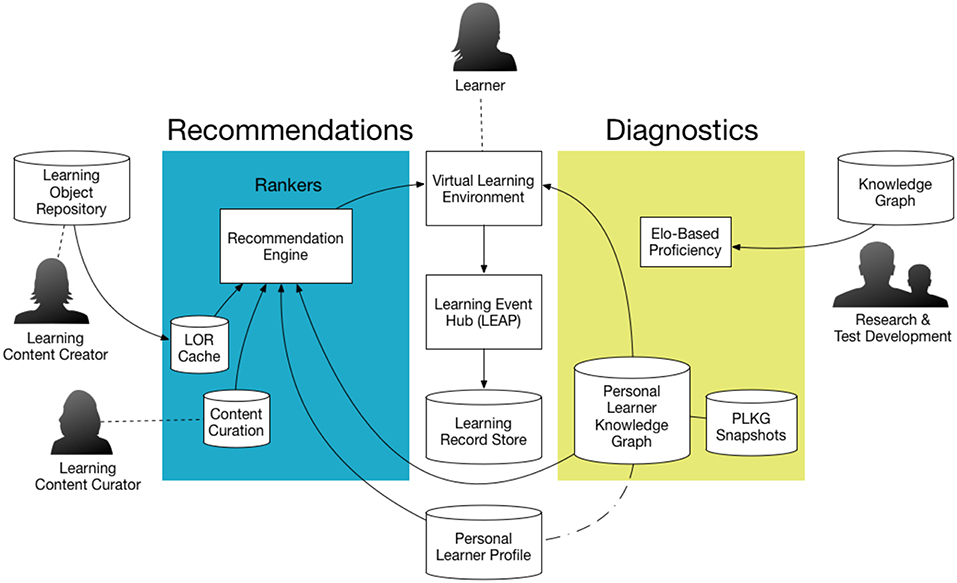
Figure 12. Illustration of the data flow for the ACTNext Educational Companion App. In this figure, the PLKG denotes the personal learning knowledge graph, and the LOR denotes Learning Object Repository. The Elo-based proficiency refers to the estimated proficiency using the Elo ranking algorithm. The knowledge graph is based on the hierarchical relationship of the skills and subskills as described by a taxonomy or standards. A detailed description is available in von Davier et al. (2019).
As explained in section Alignment of Instruments above, through aligning instructional resources and taxonomic structures using ML and NLP methods, and in conjunction with continuously monitoring updates to a learner's assessment data, Companion uses its knowledge of the learner's predicted abilities along with the understanding of hierarchical, parent/child relationships within the content structure to produce personalized lists of content and drive their learning activities forward. Over time, as learners continue to engage with the app, Companion refines, updates, and adapts its recommendations and predictive analytics to best support an individual learner's needs. The Companion app also incorporates navigational tools developed by Mattern et al. (2017) which provide learners with insights related to career interests, as well as the relationships between their personal data (assessment results, g.p.a., etc.) and longitudinal data related to areas of study in college and higher education outcome studies. The Companion app was piloted with a group of Grades 11 and 12 high school students in 2017 (unpublished report, Polyak et al., 2018).
Following the pilot, components from the Educational Companion App were redeployed as capabilities that could extend this methodology to other learning and assessment systems. The ACTNext Recommendation and Diagnostics (RAD) API was released and integrated into ACT's free, online test preparation platform ACT Academy, offering the same mastery theory of learning and free agency via evidence-based diagnostics and personalized recommendations of resources.
Conclusion
In this paper we discussed and proposed a new way to structure large-scale psychometric data at testing organizations based on the concepts and tools that exist in other fields, such as marketing and learning analytics. The simplest concept is matching the data across individuals, constructs, and testing instruments in a data cube. We outlined and described the data structure for taxonomies, item metadata, and item responses in this matched multidimensional matrix that will allow for rapid and in-depth visualization and analysis. This new structure will allow real-time, big data analyses, including machine-learning-based alignment of testing instruments, real-time updates of cognitive diagnostic models during the learning process, and real-time feedback and routing to appropriate resources for learners and test takers. The data cube it is almost like Rubik's Cube where one is trying to find the ideal or typical combination of data. There could be clear purposes for that search, for instance creating recommended pathways or recognizing typical patterns for students for specific goals.
In many ways, the large testing companies are well-positioned to create flexible and well-aligned data cubes as described previously. Specifically, the testing data is valid (the test scores measure what they are supposed to measure, and these validity indices are known) and data privacy policies have been followed appropriately when the data was collected, which are two important features that support quality data and the statistical alignment of separate databases. Nevertheless, this new type of data governance has posed challenges for testing organizations. Part of the problem seems to be that the psychometric community has not embraced yet the data governance as part of the psychometrician's duties. The role of this paper is to bring these issues to the attention of psychometricians and underscore the importance of expanding the psychometric tool box to include elements of the data science and governance.
More research and work is needed to refine and improve AI-based methodologies, but without flexible data alignment, the AI-based methods are not possible at all.
Author Contributions
All authors listed have made a substantial, direct and intellectual contribution to the work, and approved it for publication.
Conflict of Interest Statement
AvD, SP, and MY are employed by ACT Inc. PW was employed by ACT Inc. at the time this work was conducted.
Acknowledgments
The authors thank Andrew Cantine for his help editing the paper. The authors thank Drs. John Whitmer and Maria Bolsinova for their feedback on the previous version of the paper. The authors thank to the reviewers for their feedback and suggestions.
Footnotes
1. ^https://en.wikipedia.org/wiki/Resource_Description_Framework
2. ^https://en.wikipedia.org/wiki/Schools_Interoperability_Framework (Retrieved May 7, 2018).
4. ^https://en.wikipedia.org/wiki/Common_Education_Data_Standards
5. ^https://www.imsglobal.org/aboutims.html
References
Bakharia, A., Kitto, K., Pardo, A., Gašević, D., and Dawson, S. (2016). “Recipe for success: lessons learnt from using xAPI within the connected learning analytics toolkit,” in Proceedings of the Sixth International Conference on Learning Analytics and Knowledge (ACM), 378–382. doi: 10.1145/2883851.2883882
Camara, W., O'Connor, R., Mattern, K., and Hanson, M.-A. (2015). Beyond Academics: A Holistic Framework for Enhancing Education and Workplace Success. ACT Research Report Series (4), ACT, Inc.
Codd, E. F. (1970). A relational model of data for large shared data banks. Commun. ACM 13, 377–387. doi: 10.1145/362384.362685
Cooper, A. (2014). Learning Analytics Interoperability-the Big Picture in Brief. Learning Analytics Community Exchange.
Dean, J., and Ghemawat, S. (2008). MapReduce: simplified data processing on large clusters. Commun. ACM 51, 107–113. doi: 10.1145/1327452.1327492
Devlin, B. (1996). Data Warehouse: From Architecture to Implementation. Boston, MA: Addison-Wesley Longman Publishing Co., Inc.
Gilbert, R., Lafferty, R., Hagger-Johnson, G., Harron, K., Zhang, L. C., Smith, P., et al. (2017). GUILD: guidance for information about linking data sets. J. Public Health 40, 191–198. doi: 10.1093/pubmed/fdx037
Gray, J., Bosworth, A., Layman, A., and Pirahesh, H. (1996). “Data cube: a relational aggregation operator generalizing group-by, cross-tab, and sub-totals,” in Proceedings of the International Conference on Data Engineering (ICDE) (IEEE Computer Society Press), 152–159. doi: 10.1109/ICDE.1996.492099
Hao, J., Smith, L., Mislevy, R., von Davier, A. A., and Bauer, M. (2016). Taming Log Files From Game/Simulation-Based Assessments: Data Models and Data Analysis Tools. ETS Research Report Series. Available online at: http://onlinelibrary.wiley.com/doi/10.1002/ets2.12096/full
Hayes, F. (2002). The Story So Far. Available online at: https://www.computerworld.com/article/2588199/business-intelligence/the-story-so-far.html
Mattern, K., Radunzel, J., Ling, J., Liu, R., Allen, J., and Cruce, T. (2017). Personalized College Readiness Zone Technical Documentation. Unpublished ACT Technical Manual. Iowa City, IA: ACT.
MDX (2016). Multidimensional Expressions (MDX) Reference. Available online at: https://docs.microsoft.com/en-us/sql/mdx/multidimensional-expressions-mdx-reference
Miloslavskaya, N., and Tolstoy, A. (2016). Big data, fast data and data lake concepts. Proc. Comput. Sci. 88, 300–305. doi: 10.1016/j.procs.2016.07.439
Pacific Northwest National Laboratory (2014). T. Rex Visual Analytics for Transactional Exploration [Video File]. Retrieved from: https://www.youtube.com/watch?v=GSPkAGREO2E
Polyak, S., Yudelson, M., Peterschmidt, K., von Davier, A. A., and Woo, A. (2018). ACTNext Educational Companion Pilot Study Report. Unpublished Manuscript.
Rayon, A., Guenaga, M., and Nunez, A. (2014). “Ensuring the integrity and interoperability of educational usage and social data through Caliper framework to support competency-assessment,” in 2014 IEEE Frontiers in Education Conference (FIE) Proceedings (Madrid: IEEE), 1–9. doi: 10.1109/F.I.E.2014.7044448
RDF (2014). RDF-Semantic Web Standards. Available online at: https://www.w3.org/RDF/
SPARQL (2008). SPARQL Query Language for RDF. Available online at: www.w3.org/TR/rdf-sparql-query/
Tatsuoka, K. (1985). A probabilistic model for diagnosing misconceptions in the pattern classification approach. J. Educ. Stat. 12, 55–73. doi: 10.3102/10769986010001055
von Davier, A. A. (2017). Computational psychometrics in support of collaborative educational assessments. J. Educ. Meas. 54, 3–11. doi: 10.1111/jedm.12129
von Davier, A. A., Deonovic, B., Polyak, S. T., and Woo, A. (2019). Computational psychometrics approach to holistic learning and assessment systems. Front. Educ. 4:69. doi: 10.3389/feduc.2019.00069
von Davier, M. (2016). High-Performance Psychometrics: The Parallel-e Parallel-m Algorithm for Generalized Latent Variable Models. Princeton, NJ: ETS Research Report. doi: 10.1002/ets2.12120
Wong, P. C., Haglin, D. J., Gillen, D., Chavarria-Miranda, D. G., Giovanni, C., Joslyn, C., et al. (2015). “A visual analytics paradigm enabling trillion-edge graph exploration,” in Proceedings IEEE Symposium on Large Data Analysis and Visualization (LDAV) 2015 (IEEE Computer Society Press), 57–64. doi: 10.1109/LDAV.2015.7348072
Keywords: database alignment, learning analytics, diagnostic models, learning pathways, data standards
Citation: von Davier AA, Wong PC, Polyak S and Yudelson M (2019) The Argument for a “Data Cube” for Large-Scale Psychometric Data. Front. Educ. 4:71. doi: 10.3389/feduc.2019.00071
Received: 19 November 2018; Accepted: 03 July 2019;
Published: 18 July 2019.
Edited by:
Frank Goldhammer, German Institute for International Educational Research (LG), GermanyReviewed by:
Pei Sun, Tsinghua University, ChinaHendrik Drachsler, German Institute for International Educational Research (LG), Germany
Copyright © 2019 von Davier, Wong, Polyak and Yudelson. This is an open-access article distributed under the terms of the Creative Commons Attribution License (CC BY). The use, distribution or reproduction in other forums is permitted, provided the original author(s) and the copyright owner(s) are credited and that the original publication in this journal is cited, in accordance with accepted academic practice. No use, distribution or reproduction is permitted which does not comply with these terms.
*Correspondence: Alina A. von Davier, QWxpbmEudm9uRGF2aWVyQGFjdC5vcmc=