 Sifiso Vilakati
- Department of Biostatistics, University of the Free State, Bloemfontein, South Africa
Accurate analysis of adverse events in two-stage dynamic treatment regimes is complicated by the presence of competing risks, such as death, which can preclude the observation of an adverse event and introduce bias into standard survival estimates. To address these challenges, this study employs cumulative hazard functions to compare the safety profiles of different treatment policies, offering a more precise quantification of adverse event risk in the context of competing outcomes. The Nelson-Aalen estimator is utilized to decompose the overall hazard into cause-specific components, enabling a nuanced assessment of both mortality and adverse event risks. By appropriately censoring for competing events, the proposed approach ensures unbiased estimation of cumulative hazards, thereby facilitating robust and interpretable comparisons between treatment strategies. Our methodology is demonstrated through the estimation of the cumulative hazard ratio for adverse events in a real world data set for leukemia.
1 Introduction
Dynamic treatment regimes, also referred to as treatment policies, adaptive treatment strategies, or multi-stage treatment strategies, constitute a systematic framework for the allocation of time-dependent treatments. These regimes are informed by intermediate responses to prior interventions and relevant covariates. For example, in the management of leukemia, a two-stage dynamic treatment regime might involve the following steps: initiating treatment with three cycles of chemotherapy, followed by an infusion of GM-CSF; assessing the patient for complete remission; if complete remission is achieved, transitioning to maintenance therapy, and if not, discontinuing treatment. The primary goal in leukemia treatment is to improve overall survival rates. Therefore, a key objective is to identify the treatment regime that produces the most favorable survival outcomes. Determining the optimal patient-specific treatment regime allows clinicians to select the most appropriate therapeutic options based on the patient's medical history. Identifying the ideal set of rules is challenging due to significant inter-individual variability in patient characteristics. Nonetheless, if the number of treatment regimes is limited, it becomes feasible to estimate their effects on overall outcomes and to compare these regimes based on their respective treatment effects.
Various statistical designs are employed to estimate the efficacy of treatments within different regimes: (1) the single-stage randomization design, which entails randomizing patients to all potential treatment regimes at the onset of the trial; (2) multiple separate trials for the initial and subsequent stages; and (3) sequential multiple assignment randomized trials (SMART). A SMART design with two stages of randomization is referred to as a two-stage randomization design. The first method is relatively straightforward to implement but is associated with high costs and necessitates a large sample size. Conversely, the second method raises concerns regarding the comparability of patients across different trials. SMART designs, however, offer several advantageous features. They enable researchers to draw conclusions more rapidly with comparable total sample sizes. The implementation of SMART designs is also straightforward; patients are randomized to initial treatment options upon entering the trial, and those progressing to the next stage are randomized to available second-stage treatments based on their intermediate responses to the initial treatment, and so forth.
Numerous methodologies for estimating survival distributions and comparing various treatment policies have been introduced in the literature [1–3]. These methodologies primarily utilize efficacy data derived from these designs. In SMART designs also collected is information on adverse events, documenting the side effects experienced by patients under different treatment policies. However, there has been limited methodological development focused on adverse events data from two-stage randomization designs. Generally, clinical trials emphasize efficacy data, often analyzing adverse events data using crude rates. In time-to-event settings, crude rate estimators that ignore censoring can be biased. Therefore, it is recommended to employ survival methods for analyzing adverse events data in clinical trials with survival endpoints [4]. We advocate for the application of the same methods used in efficacy data analysis to safety data analysis.
Recent advances in the statistical analysis of adverse events in clinical trials have underscored the importance of accounting for complex event structures and trial designs. Allignol et al. [4] provided a foundational critique of traditional survival analysis methods, such as the Kaplan-Meier estimator, when applied to adverse events data in the presence of competing risks. Their work demonstrated that standard approaches can yield biased estimates of adverse events probabilities, particularly when events like death preclude the observation of an adverse event. The competing risks situation is shown in Appendix Figure 1. To address these limitations, they advocated for the use of the cumulative incidence function and competing risks models, which more accurately reflect the probability of experiencing specific events over time. Their methodological framework also highlighted the need for careful hazard modeling, distinguishing between cause-specific and sub-distribution hazards, and provided practical guidance for the analysis of recurrent events and the interpretation of censored data.
Building on this foundation, Vilakati and Cortese [5] extended these principles to the analysis of safety data in two-stage randomization designs. Recognizing the additional biases introduced by multi-stage allocation and time-dependent treatment decisions, they developed weighted versions of classical estimators such as the Kaplan-Meier and Nelson-Aalen estimators using inverse probability weighting to correct for the complexities of two-stage designs Their methodology is descriptive in nature, primarily estimating the probability and cumulative hazards of experiencing the adverse event of interest, and it does not facilitate comparisons of adverse event experiences between different treatment policies. Consequently, this paper proposes using cumulative hazards within the context of competing risks to perform such comparisons focusing on the time to first serious adverse event [6].
2 Materials and methods
Consider a two-stage randomization design for a clinical study, where patients are initially assigned to one of two first-stage treatments, A1 and A2. Those who respond to the initial treatment and consent to continue are then randomized to one of two maintenance treatments, B1 and B2. The treatment regimes AjBk, where j, k = 1, 2, represent the approach of administering Aj followed by Bk if the patient responds and agrees to further maintenance therapy. The objective is to compare these treatment regimes in terms of overall survival. An example of a two-stage randomization design where responders are randomized to the second stage treatments is shown below in Figure 1.
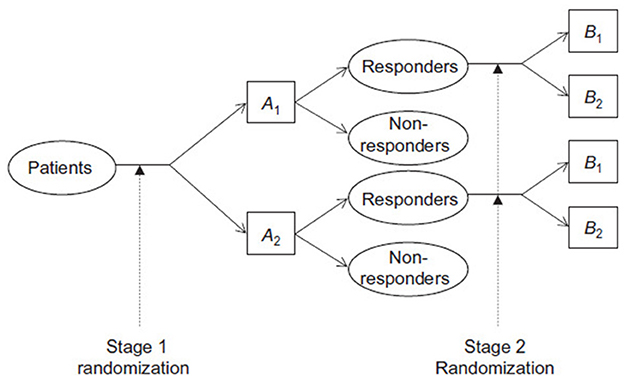
Figure 1. An example of a two-stage standard SMART design.
The observed data from this design can be characterized by the following variables:
where Xji is an indicator for the j-th initial treatment, Ri indicates response and consent, denotes the time to response and consent, Zki is the indicator for the k-th maintenance treatment, Ui denotes the observed death or censoring time, and Δi is the indicator for death or censoring.
We make the following two key assumptions: (1) the censoring time Ci is conditionally independent of the other variables given the induction therapy, and (2) πz = P(Zi = 1|Ri = 1), which represents the probability of being randomized to the B treatment and is typically fixed by design.
2.1 Cumulative hazard ratio estimator
Adverse events data are subject to competing risks, where a patient may die before experiencing the adverse event of interest, thus making death a competing risk. It has been recommended that the survival methods employed for analyzing efficacy data should also be applied to the analysis of safety data. In this context, we propose utilizing cumulative hazards to compare adverse events data across different treatment policies. Cumulative hazards are particularly appropriate in competing risk scenarios, and the use of the Kaplan-Meier estimator is discouraged [4]. Generally, the modeling of competing risks data is based on hazard functions. When analyzing adverse events data, the hazard function decomposes into two cause-specific hazards: death and the adverse event. Only adverse events are considered when computing the Nelson-Aalen estimator of the cumulative hazard for experiencing an adverse event. Practically, this can be achieved by censoring the competing event. In the context of competing risks, it is essential to analyze all event-specific hazards to obtain a comprehensive understanding of the data. In the following sections, we demonstrate the estimation of the cumulative hazard ratio for the adverse event. The analysis for the competing cause, death, is conducted in a similar manner.
The hazard function for adverse event for treatment policy AjBk, where j, k = 1, 2, can be expressed using a stratified proportional hazards model with treatment policies as strata
where λjk0(t) is the baseline hazard function for adverse event for treatment policy AjBk, and β is a vector of coefficients corresponding to baseline covariates V. The coefficient estimate can be obtained by solving a pseudo-score equation.
Consider analyzing adverse events for the treatment policies AjBk, where j, k = 1, 2. We note that the inference in Equation 1 does not focus on the parameter vector β, instead, it aims to compare the hazards associated with different treatment regimes for adverse events data. Utilizing the analytical framework of Inverse Probability Weighting (IPW), we define the weight function for the treatment regime AjBk as follows:
where πj = P(Xji = 1) and πjk = P(Zki = 1|Xji = 1, Ri = 1). This indicates that both responders (Ri = 1) and non-responders (Ri = 0) to treatment Aj are weighted according to the probabilities of randomization when analyzing adverse events data for the treatment regime AjBk. Using the counting process notation, the event and the at risk processes are defined as Ni(t) = ΔiI(Ui ≤ t) and Yi(t) = I(Ui≥t) respectively. The weighted event and risk indicators for treatment policy AiBk are defined as Njki = WjkiΔiI(Ui ≤ t) and Yjki = WjkiI(Ui≥t). The cumulative baseline hazard for the adverse events for the treatment regime AjBk can be expressed as
This allows for a comparison of different treatment regimes in terms of their adverse events based on the ratio of their cumulative baseline hazards. The ratio for comparing treatment regimes with regards to adverse events AjBk and is defined as:
This ratio of cumulative baseline hazards for the adverse events reflects the ratio of cumulative hazards when covariates are held constant, as shown by:
It can be shown that this ratio converges asymptotically to a Gaussian process. Test for comparisons of the cumulative hazard ratios for the adverse events can also be based on the log ratio estimator of the cumulative baseline hazards at specific time points, say t0. The variance of the estimator is obtained via the delta method. Wald-type tests can be then be constructed and comparisons be made.
In cases where we want to compare adverse events from more than two treatment policies, an overall test of difference among the the treatment policies can be done using the Wald chi-square test. Here the test statistic is compared to a chi-square distribution with (JK−1) degrees of freedom (df). More details on this can be found in Tang and Wahed [7]. In what follows we show how this approach can be applied in analyzing safety data from a real world data.
3 Results
In the Cancer and Leukemia Group B 19808 (CALGB 19808) study, 302 patients were randomly assigned to receive induction chemotherapy regimens comprising cytosine arabinoside (Ara-C; A), daunorubicin (D), and etoposide (E) either without (ADE) or with (ADEP) PSC-833 (P). This study targeted patients under the age of 60 with newly diagnosed acute myeloid leukemia. Eligibility criteria required that patients had not previously been treated for leukemia and were under the age of 60. Approximately 75% of the patients responded to the induction chemotherapy in both treatment arms. The National Cancer Institute criteria were employed to define response criteria. Responders to the induction therapy were subsequently randomized to receive one of two maintenance therapies: recombinant interleukin-2 (rIL-2) or no rIL-2 (observation). To be eligible for the second stage of randomization, patients needed to have responded to the induction therapies and provided consent for the second stage treatments. Survival times were calculated from the date of random assignment to the date of death from any cause, with patients still alive at the end of the follow-up period being right-censored [8]. Further details of this clinical dataset are provided in Kolitz et al. [8, 9].
The CALGB 19808 study comprises two datasets: the primary dataset and the adverse events dataset. This analysis specifically focused on the time to the first serious adverse event. The two datasets were merged using the patient ID number, which is consistent across both datasets. All analysis were conducted using R.
The results in Table 1 show that the cumulative hazard ratios for the comparisons between different treatment policies are close to 1, with confidence intervals that include 1. This suggests that there are no significant differences in the cumulative hazard of experiencing adverse events between the treatment policies. For example, the comparison between ADE-OBS and ADE-rIL-2 yields a CHR of 1.413 with a CI of 0.882 to 1.943, indicating no significant difference. Similarly, the comparison between ADE-OBS and ADEP-OBS yields a CHR of 1.082 with a CI of 0.749 to 1.413, also indicating no significant difference.
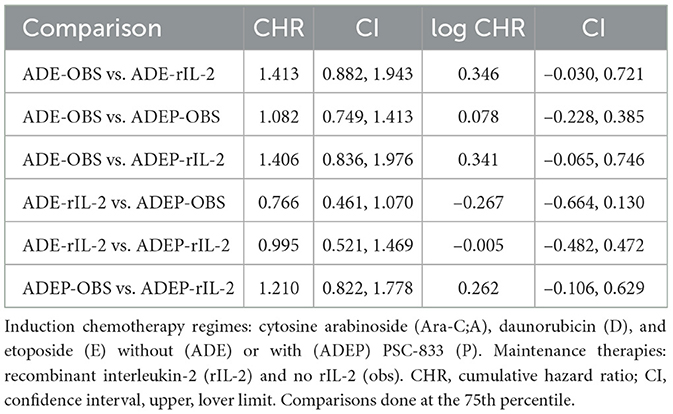
Table 1. Cumulative hazard ratio estimation for the CALGB 19808 study.
Alternatively, the Wald chi-square test can be conducted, with the results presented in Table 2. The overall test for differences among all treatment policies is not significant at the 5% level of significance across all time points. This indicates that the cumulative hazards of experiencing the adverse event of interest do not differ among the various treatment regimes. Similarly, pairwise comparisons reveal no significant differences in the cumulative hazards of experiencing the adverse event of interest, including the first serious adverse event.
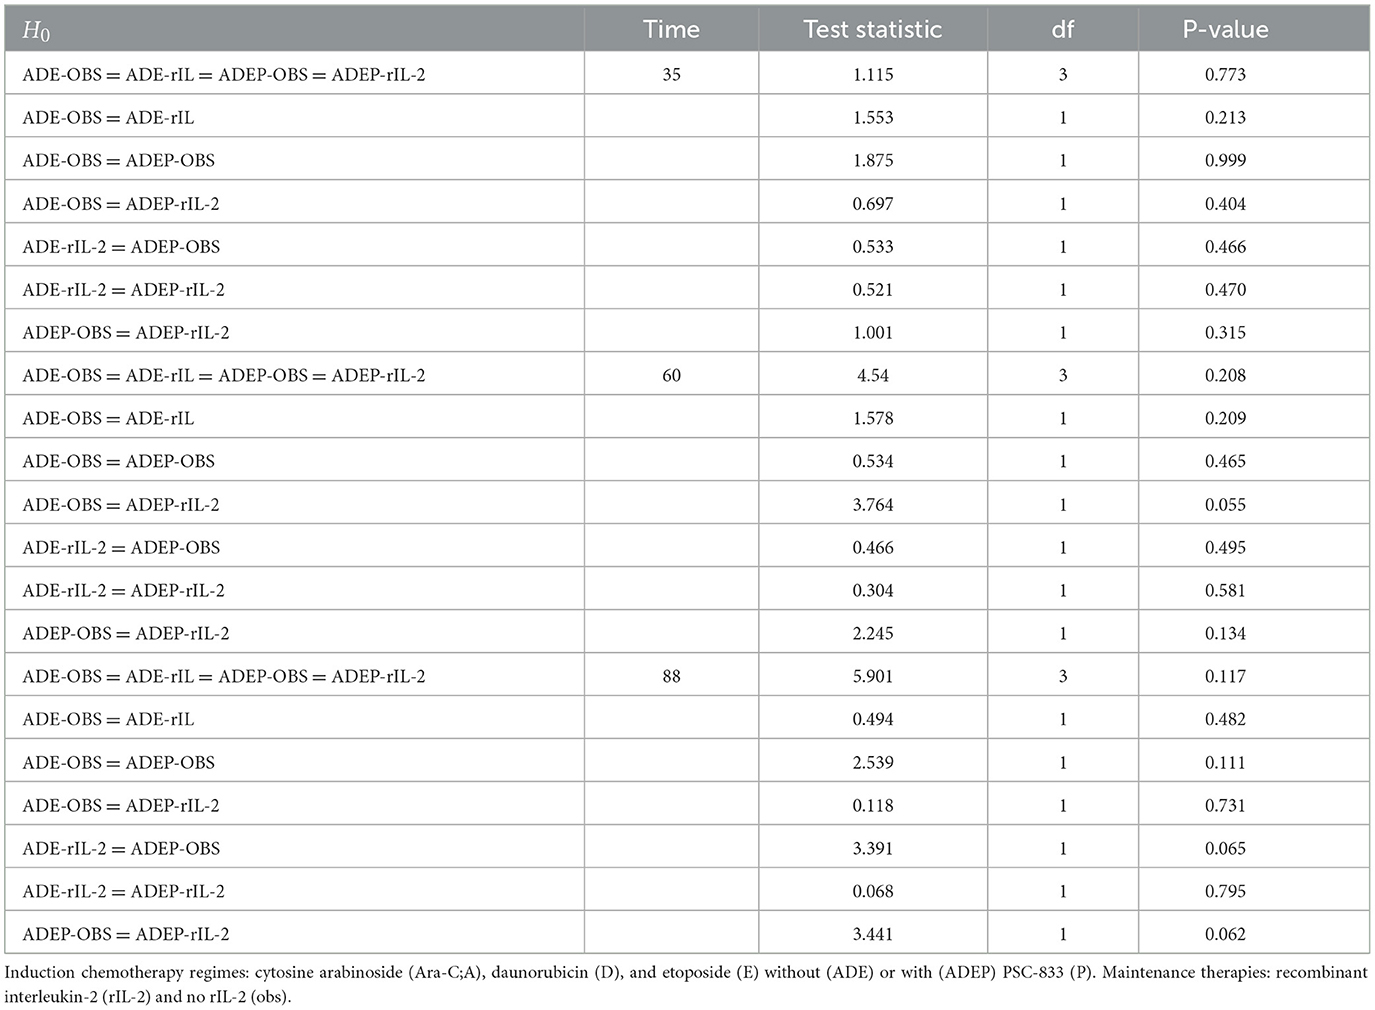
Table 2. Application to CALGB 19808 study.
The results in Table 2 further support the findings from Table 1. The overall test for differences among all treatment policies at different time points (35, 60, and 88) is not significant, with p-values of 0.773, 0.208, and 0.117, respectively. This indicates that there are no significant differences in the cumulative hazards of experiencing the adverse event of interest among the various treatment regimes. Pairwise comparisons also reveal no significant differences, with p-values greater than 0.05 for all comparisons.
4 Discussion
The analysis of adverse events data in two-stage randomization designs is crucial for understanding the safety profile of different treatment policies. In this study, we focused on the cumulative hazard ratio estimation for adverse events data from a two-stage dynamic treatment regime. The results indicate that there are no significant differences in the cumulative hazard of experiencing adverse events across the different treatment policies in the CALGB 19,808 study. This finding is important as it suggests that the toxicity levels of the treatment policies are comparable, which is a critical consideration in the selection of treatment regimes.
The use of cumulative hazards in the context of competing risks provides a more accurate estimation of the risk of adverse events. By censoring the competing event, we ensure that the estimation is not biased by the occurrence of other events, such as death. This approach allows for a clearer comparison of the safety profiles of different treatment policies.
The focus of this study is consistent with previous research that has highlighted the importance of using survival analysis methods for the evaluation of safety data in clinical trials, not just using crude incidence rates only. The application of these methods to adverse events data ensures that the analysis is robust and provides a comprehensive understanding of the safety profile of the treatment regimes.
5 Conclusion
It has been recognized that safety data often does not receive the same level of attention as efficacy data [6]. Typically, safety data analysis relies on crude incidence rates, which may be insufficient. While time-to-event statistical methods are commonly employed for efficacy endpoints in clinical studies, they are seldom applied to safety data analysis. We suggest the use of the cumulative hazard ratios for comparing different treatment policies in terms of their toxicity. The focus in two-stage randomization designs with survival endpoints is on the estimation of the survival distributions and comparing the different treatment policies but such policies should be less toxic to the patients. This paper has contributed in showing how treatment policies can be compared in terms of their toxicities and this work builds on the work done in Vilakati and Cortese [5].
Allignol et al. [4] recommend employing survival analysis methods for the evaluation of safety data when the primary endpoint in a clinical trial is a time-to-event. In alignment with this perspective, we also endorse the application of survival analysis techniques tailored for two-stage randomization designs in the assessment of safety data from such designs. Consequently, we suggest the use of cumulative hazards in comparing different treatment policies in terms of their toxicities. This approach aligns the analysis of safety data with that of efficacy data in these study designs, focusing on the time to the first serious adverse event.
Censoring due to a competing event, such as death, preserves the structure of the competing process's intensity, meaning that the hazard estimation for adverse events remains valid under this approach. However, this censoring is considered informative because it influences the actual probabilities of experiencing each event. Therefore, while it is appropriate to analyze the hazard of adverse events using methods like the Nelson–Aalen estimator with censoring at the competing event, it is equally important to separately analyze the hazard of the competing event itself, such as death without a prior adverse event, to provide a complete and accurate understanding of the event dynamics, however, in this paper we could not analyze the death events because there are very few death events in our dataset.
This paper focused on the time to the first adverse event, the methods of this paper could be extended to recurrent events using the Andersen–Gill model. This model extends the Cox proportional hazards framework using the counting process paradigm, allowing for the modeling of the intensity of recurrent adverse events and the inclusion of past event occurrences as time-dependent covariates. Furthermore, although the present study is based on cumulative hazard ratio analysis, future work could also compare adverse events for different treatment policies using methods based on the cumulative incidence function (CIF).
Data availability statement
The data analyzed in this study is subject to the following licenses/restrictions: data can be obtained by request from the Alliance for Clinical Trials in Oncology and cannot be shared without their consent. Requests to access these datasets should be directed to QWxsaWFuY2VzZXJ2aWNlY2VudGVyQGFsbGlhbmNlbmN0bi5vcmc=.
Ethics statement
The studies involving humans were approved by the Alliance for Clinical Trials in Oncology. The studies were conducted in accordance with the local legislation and institutional requirements. The participants provided their written informed consent to participate in this study.
Author contributions
SV: Software, Writing – original draft, Writing – review & editing.
Funding
The author(s) declare that no financial support was received for the research and/or publication of this article.
Conflict of interest
The author declares that the research was conducted in the absence of any commercial or financial relationships that could be construed as a potential conflict of interest.
Generative AI statement
The author(s) declare that Gen AI was used in the creation of this manuscript. Generative AI was used for paraphrazing and correction of English Grammar.
Publisher's note
All claims expressed in this article are solely those of the authors and do not necessarily represent those of their affiliated organizations, or those of the publisher, the editors and the reviewers. Any product that may be evaluated in this article, or claim that may be made by its manufacturer, is not guaranteed or endorsed by the publisher.
References
1. Kidwell KM, Wahed AS. Weighted log-rank statistic to compare shared-path adaptive treatment strategies. Biostatistics. (2013) 2023:1–14. doi: 10.1093/biostatistics/kxs042
2. Lokhnygina Y, Helterbrand JD. Cox Regression methods for two-stage randomization designs. Biometrics. (2007) 63:422–8. doi: 10.1111/j.1541-0420.2007.00707.x
3. Wahed AS. Inference for two-stage adaptive treatment strategies using mixture distributions. J R Stat Soc: Ser C (Appl Stat). (2010) 59:1–18. doi: 10.1111/j.1467-9876.2009.00679.x
4. Allignol A, Beyersmann J, Schmoor C. Statistical issues in the analysis of adverse events in time-to-event data. Pharm Stat. (2016) 15:297–305. doi: 10.1002/pst.1739
5. Vilakati S, Cortese G. Analyzing safety data for two-stage randomization designs. Front Appl Mathem Stat. (2025) 11:1519056. doi: 10.3389/fams.2025.1519056
6. Gould AL. Statistical Methods for Evaluating Safety in Medical Product Development. New York: John Wiley & Sons (2015). doi: 10.1002/9781118763070
7. Tang X, Wahed AS. Cumulative hazard ratio estimation for treatment regimes in sequentially randomized clinical trials. Stat Biosci. (2015) 7:1–18. doi: 10.1007/s12561-013-9089-6
8. Kolitz JE, George SL, Benson. Recombinant interleukin-2 in patients aged younger than 60 years with acute myeloid leukemia in first complete remission: results from CALG 19808. Cancer. (2014) 120:1010–1017. doi: 10.1002/cncr.28516
9. Kolitz JE, George SL, Marcucci G, Vij R, Powell BL, Allen SL, et al. P-glycoprotein inhibition using valspodar (PSC-833) does not improve outcomes for patients younger than age 60 years with newly diagnosed acute myeloid leukemia: Cancer and Leukemia Group B study 19808. Blood. (2010) 116:1413–21. doi: 10.1182/blood-2009-07-229492
Additional requirements
Appendix A: Adverse events and competing risks
An individual who enters the study can either experience the adverse event of interest or die before experiencing the adverse event. Death is a competing event.
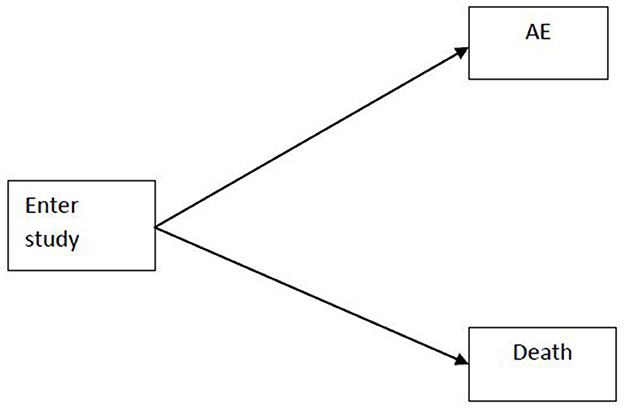
Appendix Figure A1. Competing risks situation for adverse events data.
Keywords: adverse events, competing risks, cumulative hazard ratio, Kaplan-Meier estimator, Nelson-Aalen estimator
Citation: Vilakati S (2025) Cumulative hazard ratio estimation for adverse events data from two-stage dynamic treatment regimes. Front. Appl. Math. Stat. 11:1595650. doi: 10.3389/fams.2025.1595650
Received: 18 March 2025; Accepted: 09 June 2025;
Published: 25 June 2025.
Edited by:
Noemi Montobbio, University of Genoa, ItalyReviewed by:
Zakariya Yahya Algamal, University of Mosul, IraqDragos Bozdog, Stevens Institute of Technology, United States
Usman Riaz, Qurtuba University of Science and Information Technology, Pakistan
Copyright © 2025 Vilakati. This is an open-access article distributed under the terms of the Creative Commons Attribution License (CC BY). The use, distribution or reproduction in other forums is permitted, provided the original author(s) and the copyright owner(s) are credited and that the original publication in this journal is cited, in accordance with accepted academic practice. No use, distribution or reproduction is permitted which does not comply with these terms.
*Correspondence: Sifiso Vilakati, c2lmZW1tYW5AZ21haWwuY29t