 Jiao Xue1
 Ruifeng Yin
- 1Huaxin College of Hebei GEO University, Shijiazhuang, China
- 2Hebei University of Science and Technology, Shijiazhuang, China
This study presents a comprehensive computational and experimental investigation of thread fatigue behavior in ultra-high-pressure hydrogen storage vessels. A high-fidelity finite element model, incorporating axisymmetric assumptions and nonlinear material properties, is developed to simulate stress concentration and crack propagation under multiaxial cyclic loading. Crack growth is evaluated using an iterative fracture mechanics approach based on stress intensity factors, with polynomial fitting applied to characterize axial stress distributions. The influence of hydrogen embrittlement is explicitly considered in the fatigue life prediction through threshold-based stress intensity criteria. To validate the computational results, fatigue experiments are conducted on SA-372J steel vessels under controlled high-pressure hydrogen environments. The computational prediction indicated a fatigue life of approximately 613,190 cycles, while experimental results showed no measurable leakage or thread damage after 60,000 cycles, confirming excellent agreement and validating the model’s accuracy. This work establishes a reliable computational framework for predicting the fatigue life of threaded connections, offering valuable design insights to improve the safety and durability of hydrogen storage vessels operating under extreme service conditions.
1 Introduction
In the context of the global energy transition, hydrogen energy has emerged as a highly promising alternative due to its high energy density and zero-emission characteristics. This has led to significant advancements in hydrogen storage technologies (1–4). Ultra-high-pressure hydrogen storage vessels, which are critical for the safe transportation and utilization of hydrogen, are subjected to complex cyclic stresses (5–7). These stresses significantly affect the structural integrity and operational reliability of the vessels. Therefore, understanding and improving the fatigue resistance of these vessels in high-pressure hydrogen environments is a top research priority (8–10).
Traditional fatigue life prediction methods for hydrogen storage vessels primarily rely on stress-life (S-N) curve analysis and damage mechanics approaches. While S-N curves provide valuable insights into material behavior under uniaxial loading conditions (11, 12), their accuracy decreases when applied to multiaxial stress scenarios, which are common in practical engineering applications (13). Damage mechanics approaches, which consider microstructural changes and multiaxial stress interactions (14), require extensive experimental validation and significant computational resources (15). Recent studies have integrated finite element analysis (FEA) with experimental data to improve fatigue life predictions, demonstrating increased accuracy through parameter calibration (16).
The hydrogen environment has a significant impact on the fatigue performance of materials. Hydrogen embrittlement reduces material plasticity and toughness, thus increasing the risk of fatigue crack initiation and propagation (12–19). Hydrogen diffuses into the material, altering its microstructure and accelerating crack growth.
Numerical simulation plays an essential role in studying the fatigue resistance of hydrogen storage vessels. Using the finite element method (FEM), researchers can simulate the stress–strain distribution of vessels under cyclic loading and predict their fatigue life (20–22). Optimizing model parameters with experimental data can further enhance prediction accuracy (23). Additionally, experimental techniques such as acoustic emission and digital image correlation can be used to validate and calibrate the models, providing high-quality data for numerical simulations (24–26).
Despite the progress made in this field, several challenges remain. Under complex stress states, current prediction methods often fail to accurately capture the accumulation of fatigue damage and crack propagation processes (27). The complex mechanism of hydrogen embrittlement also makes it difficult for existing models to quantify its impact on fatigue life, particularly in high-pressure hydrogen environments (23, 28). Obtaining experimental data under the actual service conditions of ultra-high-pressure hydrogen storage vessels is still challenging. Insufficient model verification and calibration further limit the applicability and reliability of these models (29).
Currently, there is limited research on the fatigue performance of threads in ultra-high-pressure hydrogen storage vessels during long-term service, as well as on methods for structural improvement. During repeated filling cycles, fatigue damage to the threads poses a serious threat to the safety and stability of the vessels. Therefore, in-depth research on the performance of threads under high-pressure fatigue conditions is crucial.
This chapter addresses these issues by establishing a high-precision fatigue model for threads through numerical simulation to predict stress concentration and crack initiation sites under different operating conditions. Experimental validation will be conducted to verify the simulation results, collect data, and refine the model. The aim is to offer robust support for the design and safe operation of ultra-high-pressure hydrogen storage vessels, thereby contributing to the advancement of this field.
2 Crack analysis of threads in ultra-high-pressure hydrogen storage vessels
2.1 Crack propagation mechanism and analytical assumptions in high-stress regions
Under the service conditions of ultra-high-pressure hydrogen storage vessels, cyclic loading—particularly concentrated at threaded connections—is a common occurrence. The non-uniform load distribution along the threaded engagement, coupled with pronounced stress concentration at the thread root, renders this region highly susceptible to fatigue crack initiation. These cracks typically nucleate at the thread root and propagate along the radial-circumferential plane, as illustrated in Figure 1.
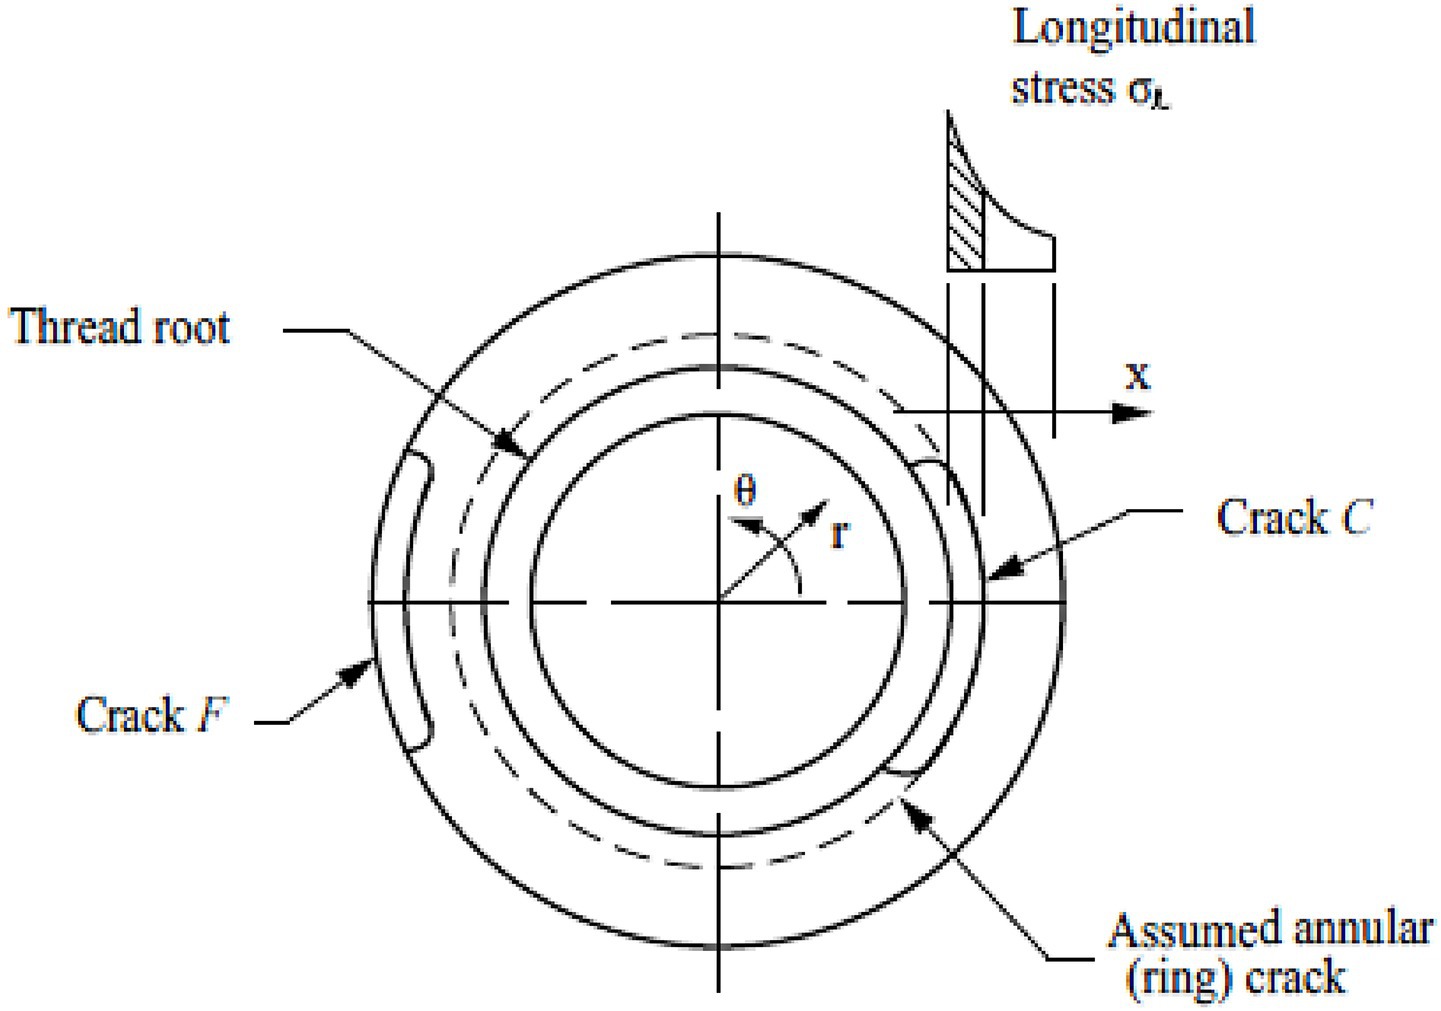
Figure 1. Schematic illustration of stress concentration at the thread root and the corresponding crack propagation direction.
Although the internal high-pressure hydrogen does not directly act on the crack surface, the severe stress concentration at the thread root generates a steep longitudinal stress gradient, which significantly accelerates crack propagation. In this study, to analyze the crack growth behavior in high-stress regions, the following assumptions are adopted: the crack propagates within a plane perpendicular to the direction of the maximum tensile stress, and the initial crack configuration is idealized as a semi-elliptical surface crack with an aspect ratio (a/ℓ) of 1/3. Variations in this aspect ratio during crack growth are considered to reflect the evolving crack morphology.
The initiation and propagation of cracks are predominantly governed by the combined effects of uneven load distribution and stress concentration at the thread root. Despite the absence of direct exposure of the crack surface to the high-pressure hydrogen, the localized stress concentration is sufficient to generate a sharp longitudinal stress gradient, promoting crack growth along the radial-circumferential plane. Accurate prediction of crack propagation behavior therefore requires precise determination of the crack initiation location and the propagation path, which typically aligns with the plane normal to the maximum tensile stress. Moreover, the continuous evolution of the crack aspect ratio during growth must be incorporated into the analysis to capture the dynamic characteristics of crack propagation under cyclic loading conditions.
2.2 Fatigue life analysis process
The analysis process begins by setting initial conditions and key parameters, with the critical stress intensity factor Kc and hydrogen-induced crack threshold representing the material’s fracture toughness and resistance to hydrogen embrittlement, respectively. The analysis starts by assuming an initial crack size and an aspect ratio of 1/3, based on the geometry of common cracks in engineering.
Loading conditions are set to simulate the stress state of the material in the actual usage environment. Then, using crack geometry and stress distribution analysis, the stress intensity factor is calculated as long as the maximum stress intensity factor Kmax does not exceed the threshold values of Kc or KH, and the crack’s aspect ratio remains below 0.8. Based on this condition, the stress intensity factor range ΔK is calculated ΔK is negative, the crack is assumed to be closed under compressive loading, and its growth rate da/dN is assumed to be 0 mm/cycle. In this case, crack propagation is not expected.
For positive values of ΔK, the crack propagation rate is calculated using an equation that incorporates material constant C, a function f(Rk) of the stress ratio Rk, and the crack growth exponent m. This formula considers material properties and loading conditions, and is key to predicting crack propagation. By calculating the crack propagation rate, the growth rate of the crack is determined, which provides the basis for subsequent cycle number calculations.
Once the crack growth rate is determined, the next step is to calculate the crack growth increment Δ(a) and the corresponding cycle number increment ΔN. By iterating calculations of crack size and cycle number, the crack growth and cycle numbers are accumulated, and the complete crack growth trajectory with time is obtained. When the crack reaches its critical size, it is considered that the material can no longer withstand the load. The total failure cycle number Nd is the minimum number of cycles required for the crack to grow from the initial crack size to the critical size. This result can also be defined by another standard, which is the number of cycles required for the crack to grow to the allowed final depth. The smaller of these two values is taken as the final fatigue life prediction result.
This crack growth-based fatigue life analysis method, by combining material fracture toughness, stress distribution, and crack geometry characteristics, can accurately predict fatigue life. Additionally, the introduction of the hydrogen-induced crack threshold KIH is considered, especially under extreme conditions such as ultra-high pressure hydrogen storage, making the model more reliable and scientific for predicting fatigue life in special environments. Ultimately, this method not only predicts the material’s service life but also provides a theoretical basis and data support for design optimization and safety evaluation.
3 Numerical simulation of thread fatigue
3.1 Assumed initial crack size
Based on technical data from an experimental sample of an ultra-high-pressure vessel as shown in Table 1, it is conservatively assumed that no cracks deeper than 0.8 mm exist due to manufacturing requirements and non-destructive testing capabilities. Therefore, the maximum stress location on the vessel’s thread is assumed to have an initial crack depth of 0.8 mm. The crack type is assumed to be radial and circumferential cracks along the inner thread root. This conservative assumption is made to ensure a safe margin in crack impact assessment.
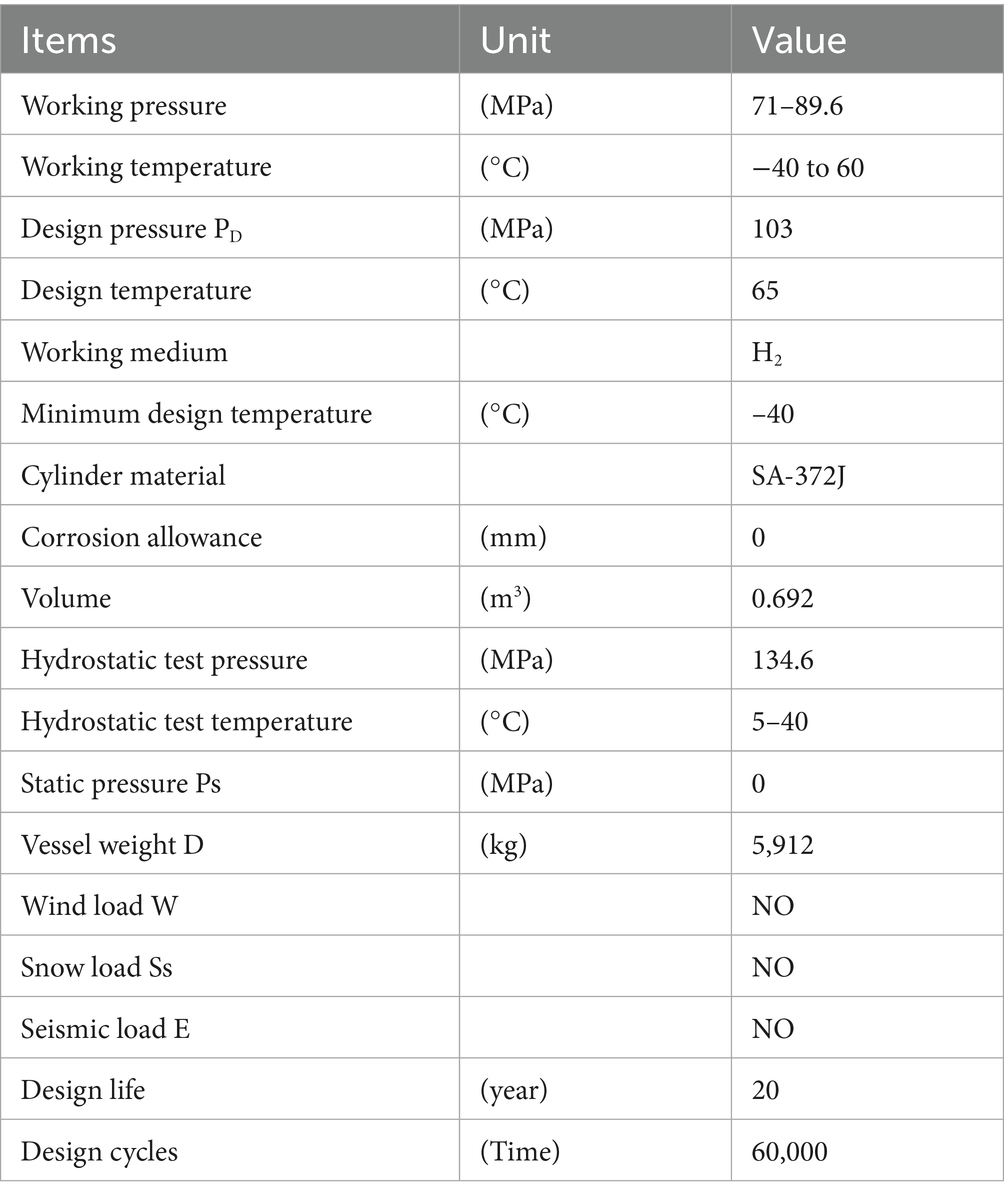
Table 1. Ultra-high pressure hydrogen storage vessels.
3.2 Pressure cycle diagram
The ultra-high-pressure hydrogen storage vessel is subjected to a pressure cycling profile over its 20-year designed service life. The maximum pressure reaches 134.6 MPa, which corresponds to the hydrostatic pressure test conducted biennially. It should be noted that this test pressure does not represent the vessel’s normal operating conditions but is part of a periodic structural integrity assessment, simulating extreme pressure scenarios the vessel may encounter. Figure 2 illustrates this pressure cycling profile.
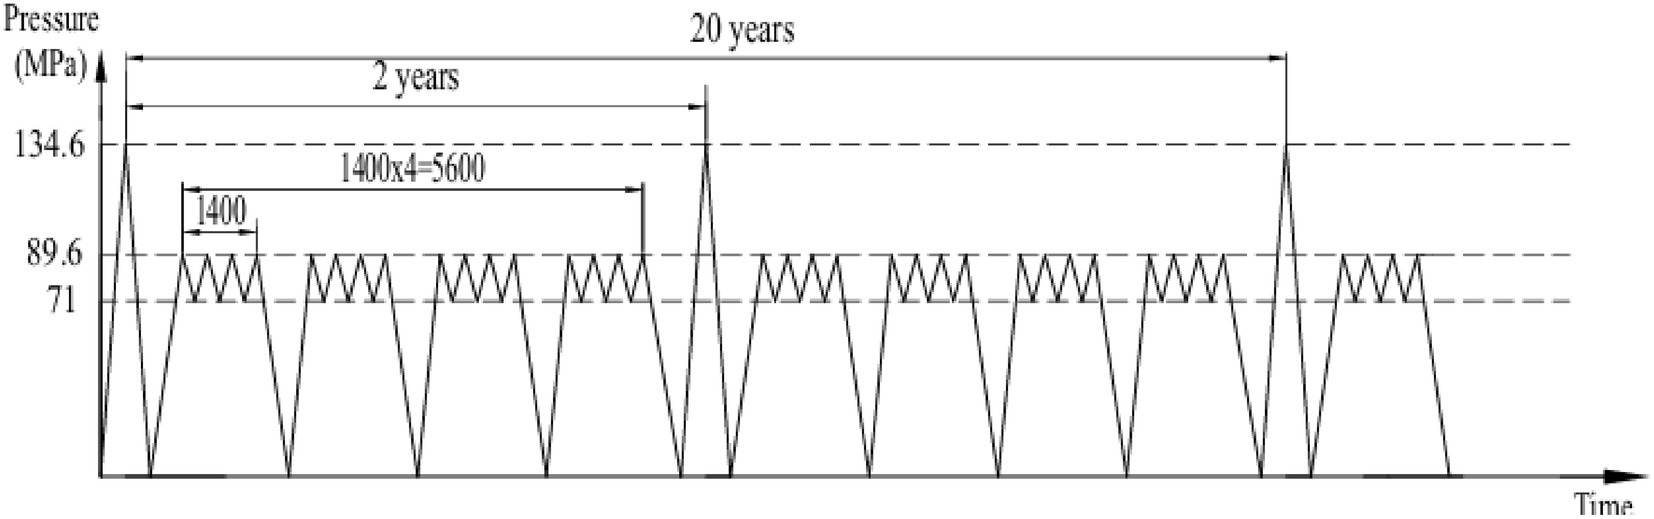
Figure 2. Pressure cycling profile over a 20-year service life.
During regular operation, the vessel undergoes approximately 27,740 pressure fluctuation cycles between 71 MPa and 89.6 MPa, reflecting typical variations during hydrogen charging and discharging. Additionally, about 40 full pressure release cycles are considered, where the pressure rises from 0 MPa to 89.6 MPa, simulating complete filling and emptying events, 10 cycles from 0 to 134.6 MPa, which are conducted as part of periodic hydrostatic requalification tests.
This pressure cycling profile is crucial for assessing the vessel’s fatigue behavior and long-term structural integrity. The detailed load history supports quantitative analysis of the vessel’s durability and aids in validating design assumptions, predicting fatigue life, and developing safety guidelines and inspection protocols for ultra-high-pressure hydrogen storage systems.
3.3 Design of threaded sealing structure
Figure 3 illustrates the end-cap sealing mechanism and threaded connection system of the ultra-high-pressure hydrogen storage vessel. This structure plays a vital role in connecting the end-cap to the vessel body, providing sealing performance, and ensuring mechanical locking under high-pressure conditions.
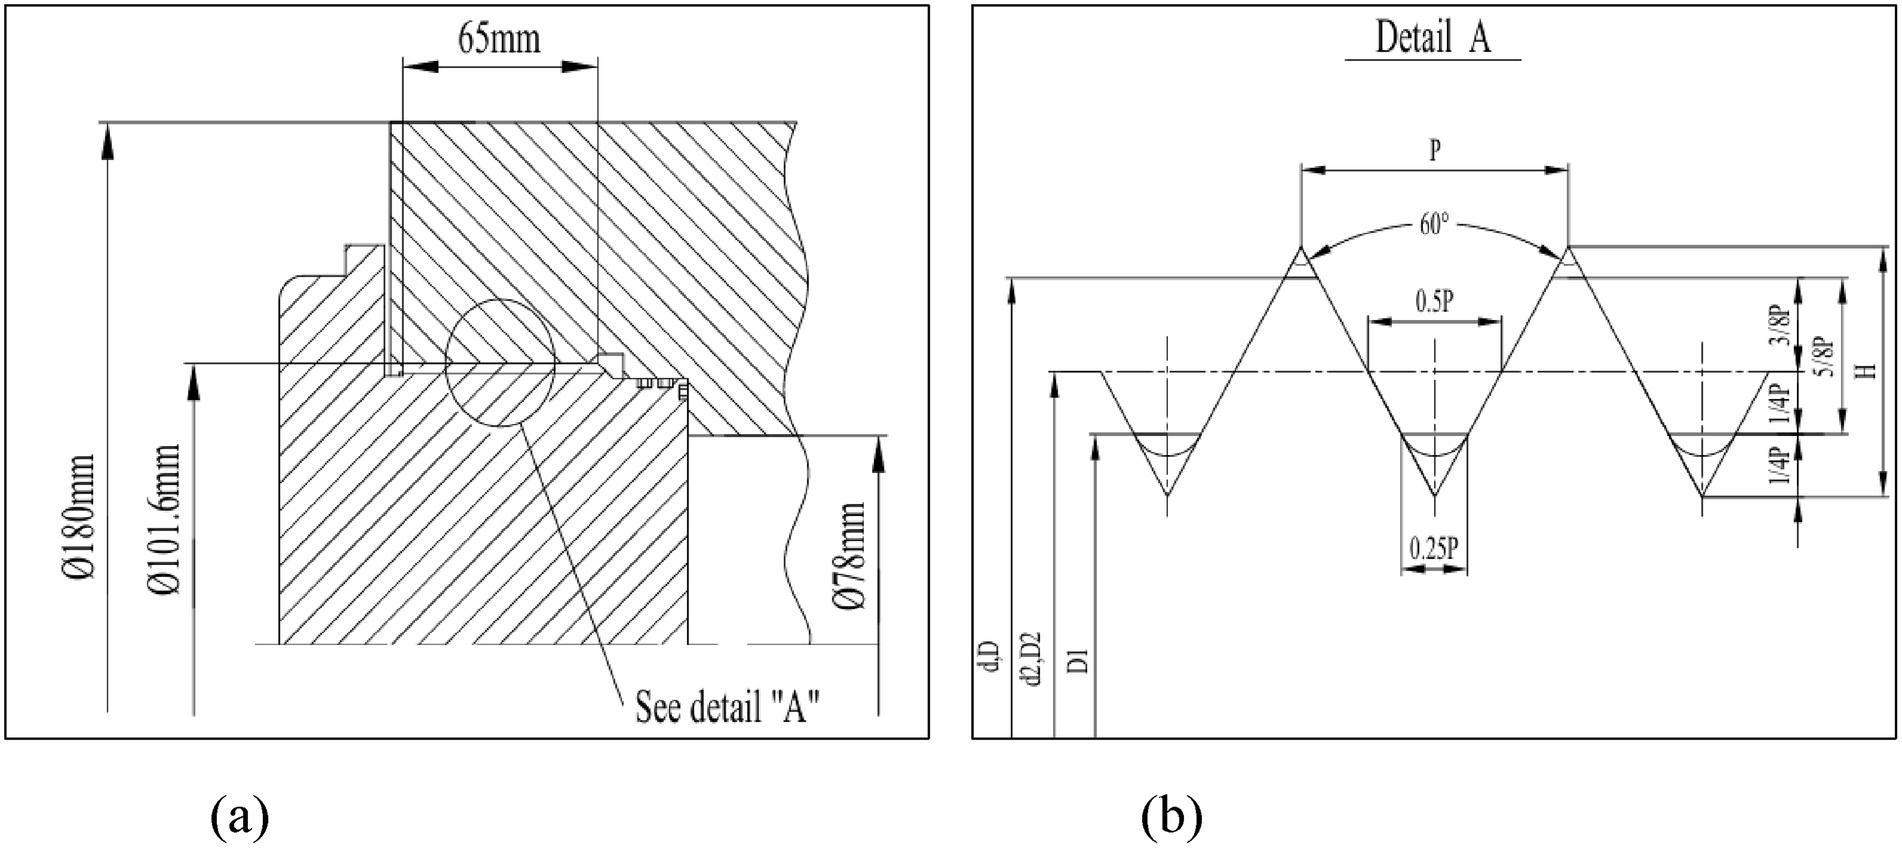
Figure 3. Screw seal structure diagram. (a) Threaded connection. (b) Detailed thread profile.
As shown in Figure 3a, the end-cap is connected to the vessel through a threaded system with precisely defined geometric dimensions. A step reduction in diameter is designed at the connection region to enhance the load-bearing capacity and improve structural safety under cyclic pressure loads.
Figure 3b presents the detailed thread specification, identified as 4-8UN-2A/2B, indicating unified standard threads with specific pitch and tolerance grades. The accurate design and machining of the thread ensure the reliability of the connection and the sealing performance required for ultra-high-pressure operation.
3.4 Axial stress distribution under cyclic loading
To investigate the axial stress distribution of the threaded connection under cyclic loading, a local axisymmetric finite element model of the end-cap, vessel neck, and thread was developed, as shown in Figure 4. The model adopts the center of the end-cap’s top surface as the origin, with the Y-axis pointing upward, the Z-axis extending outward from the paper, and the X-axis oriented horizontally to the upper left. The 8-node axisymmetric solid element (PLANE183) is used for the structural components, while contact interactions at the thread and sealing surfaces are simulated using CONTA172 and TARGE169 elements. (2) Finite Element Model.
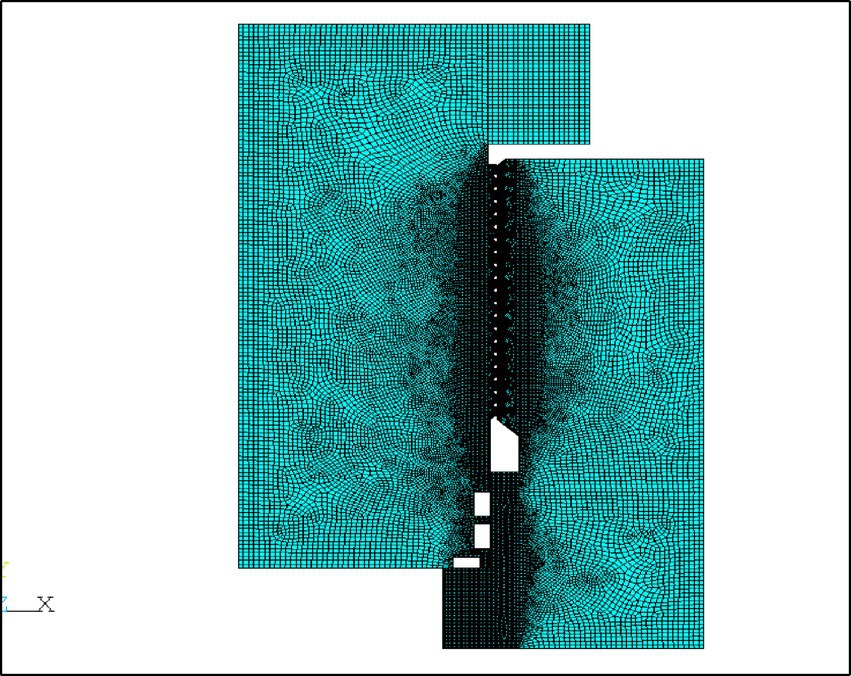
Figure 4. Finite element model of thread.
Boundary conditions are applied as shown in Figure 5. Axial displacement constraints are imposed at the bottom of the internal thread, and symmetry conditions are applied along the axial symmetry plane of the thread plug. Internal pressures of 71 MPa, 89.6 MPa, and 134.6 MPa are applied to the lower surface of the thread plug and the inner surface of the vessel neck, corresponding to different service and test conditions. This modeling approach enables an accurate evaluation of the stress distribution and structural performance of the threaded connection under high-pressure cyclic loading.
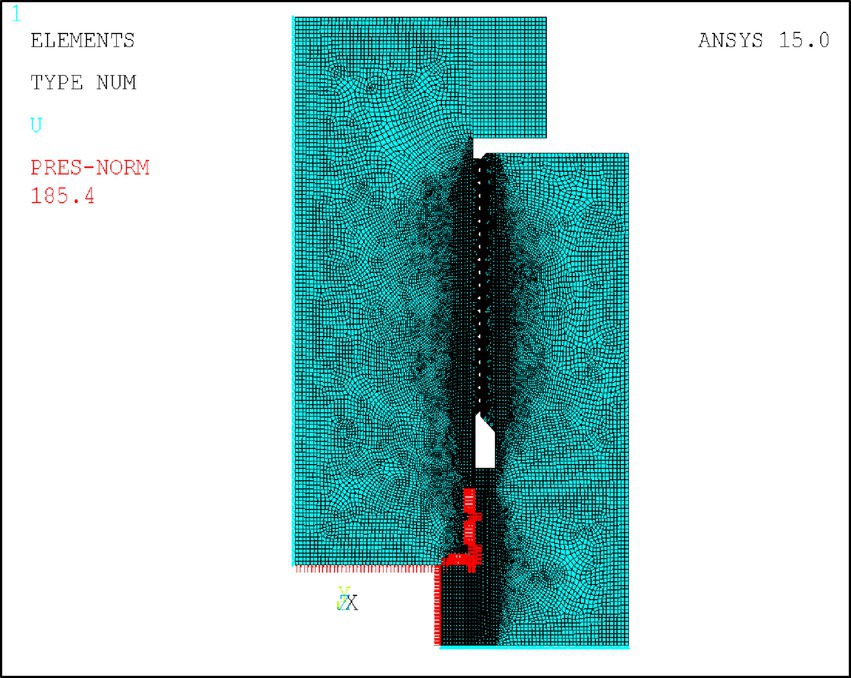
Figure 5. Boundary conditions.
3.5 Simulation result analysis
A local axisymmetric finite element model of the end cap thread connection was developed based on Saint-Venant’s principle and the structure’s axisymmetric characteristics. The model uses PLANE183 elements and considers geometric nonlinearity to capture the stress response under cyclic loading accurately. Axial displacement constraints were applied at the bottom of the internal thread, and symmetry constraints were imposed along the axisymmetric plane. Internal pressures of 71 MPa, 89.6 MPa, and 134.6 MPa were applied to simulate different working conditions.
As shown in Figure 6, the load distribution and boundary conditions of the model reflect the actual stress state of the thread connection under ultra-high pressure. Figure 7 shows the stress and strain contours, where stress concentrations are mainly located at the thread crest and root potential initiation sites for fatigue cracks. The strain distribution also reveals localized plastic deformation, indicating areas susceptible to damage under high cyclic loads.
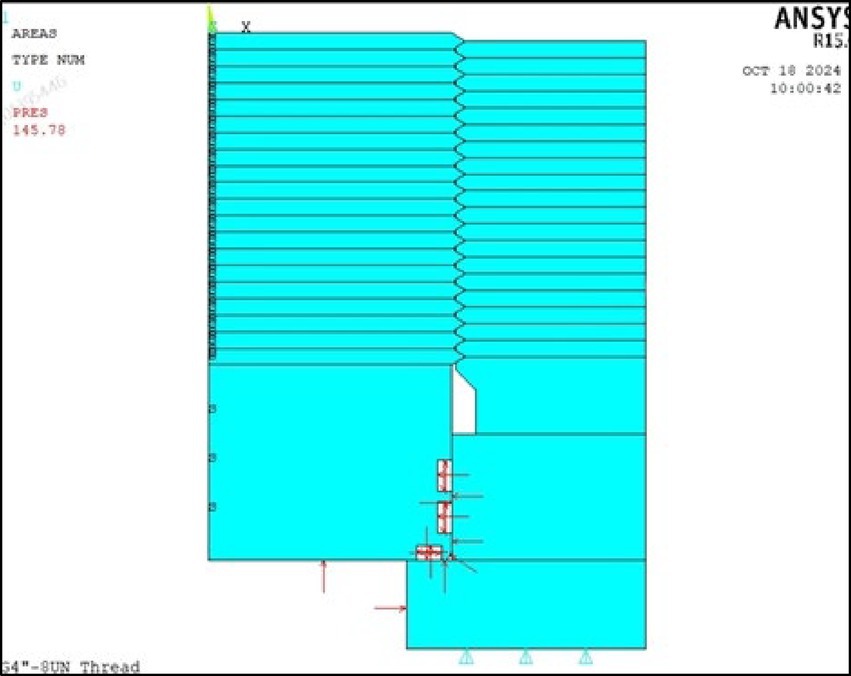
Figure 6. Load distribution diagram.
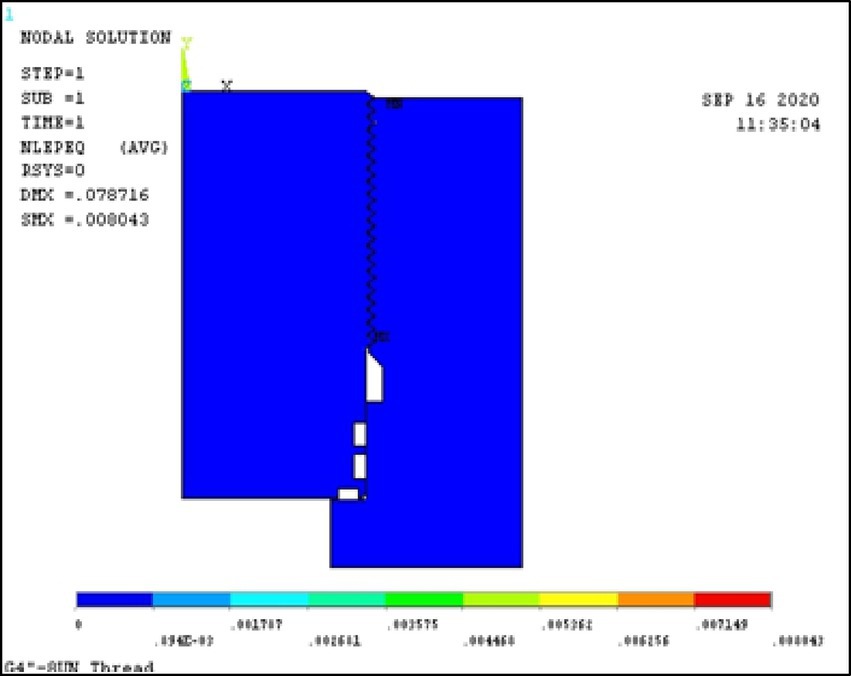
Figure 7. Plastic stress–strain contour.
The longitudinal stress distribution of the threaded connection was analyzed under internal pressures of 71 MPa, 89.6 MPa, and 134.6 MPa. As shown in Figure 8, at 71 MPa, stress is mainly concentrated at the thread crest and root, which are potential fatigue crack initiation sites.
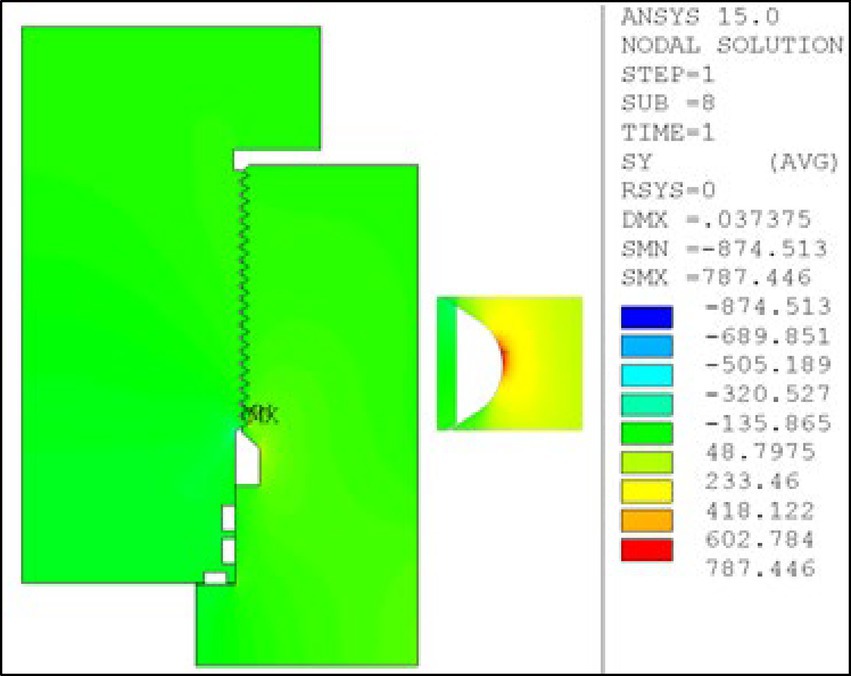
Figure 8. Stress distribution at 71 Mpa.
With increasing pressure to 89.6 MPa (Figure 9), the overall stress level rises, and stress concentration becomes more pronounced in critical areas. At the maximum pressure of 134.6 MPa (Figure 10), stress near the thread root reaches its peak, indicating a significantly elevated risk of fatigue failure.
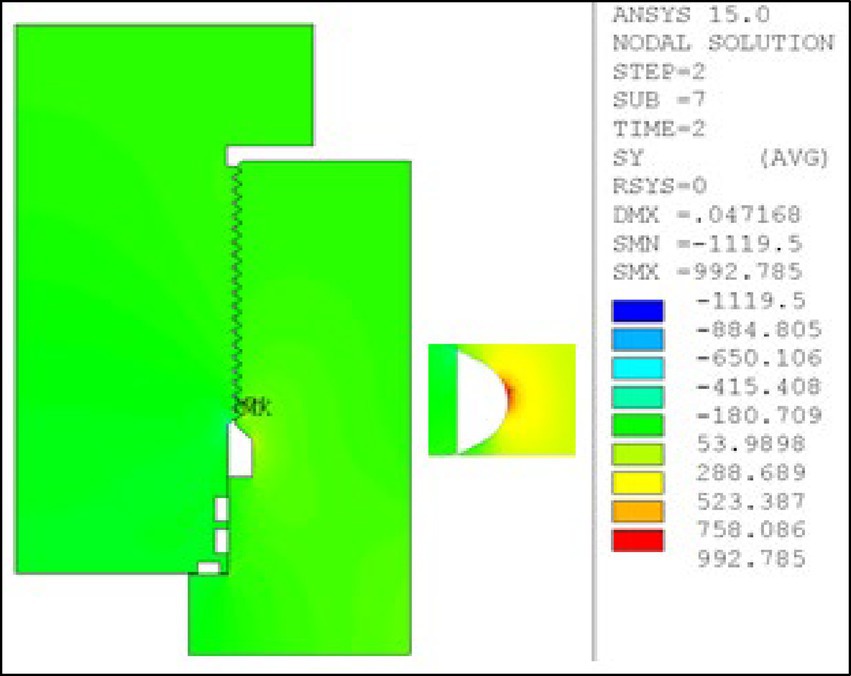
Figure 9. Stress distribution at 89.6 Mpa.
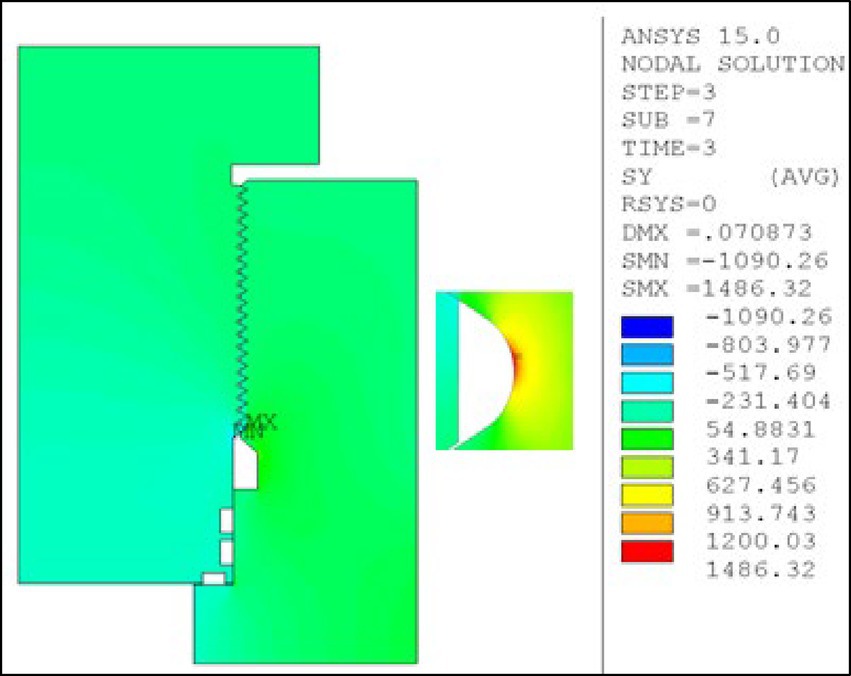
Figure 10. Stress distribution at 134.6 Mpa.
The radial stress variation along path A-A, from the inner to outer diameter, is shown in Figure 11 for three different internal pressure conditions. The stress is most concentrated near the inner thread diameter, with a marked increase as pressure rises. A sharp decrease in stress occurs at the transition to the outer diameter, indicating a more uniform stress distribution outside the thread region.
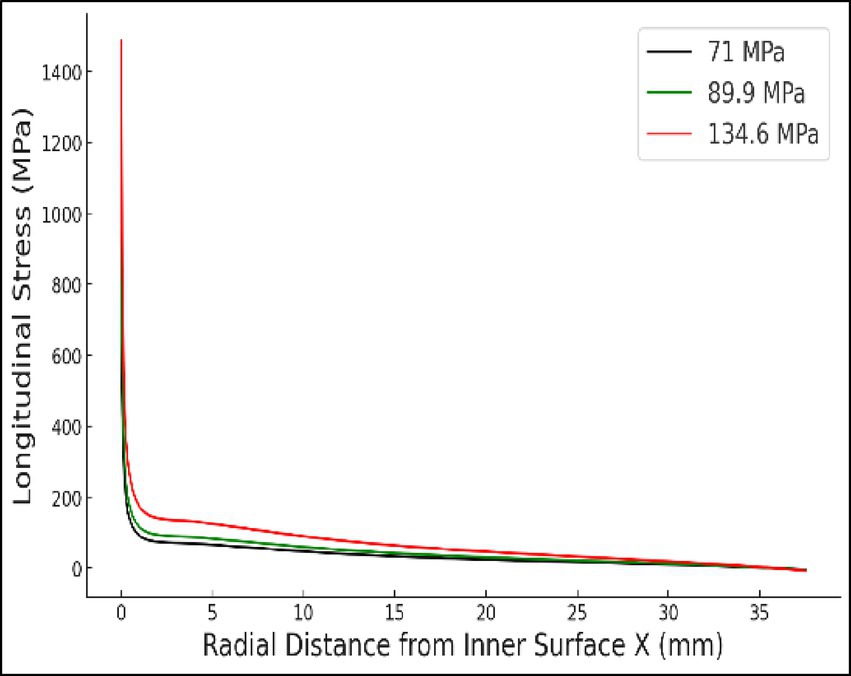
Figure 11. Path A-A under different pressures.
Figure 12 displays the stress distribution contour in the thread region of the ultra-high-pressure hydrogen storage vessel. Stress levels are represented by a color gradient, from blue (low stress) to red (high stress). The red areas highlight regions of maximum stress concentration, primarily caused by the thread geometry. These areas are critical for the thread’s fatigue performance and integrity, being potential sites for fatigue crack initiation.
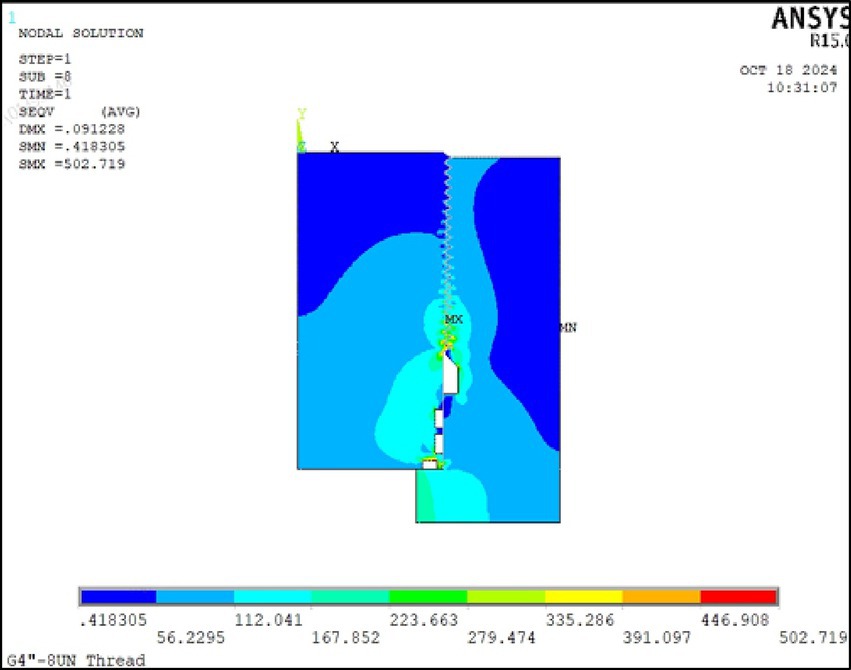
Figure 12. Contour of stress distribution.
The contour of plastic strain distribution in the thread region is shown in Figure 13. Using color coding, the diagram represents the magnitude of plastic strain, with blue indicating the lowest strain values and transitioning to green, yellow, and red as the strain increases. Areas of concentrated strain suggest that the material may have reached or exceeded its yield limit, resulting in plastic deformation.
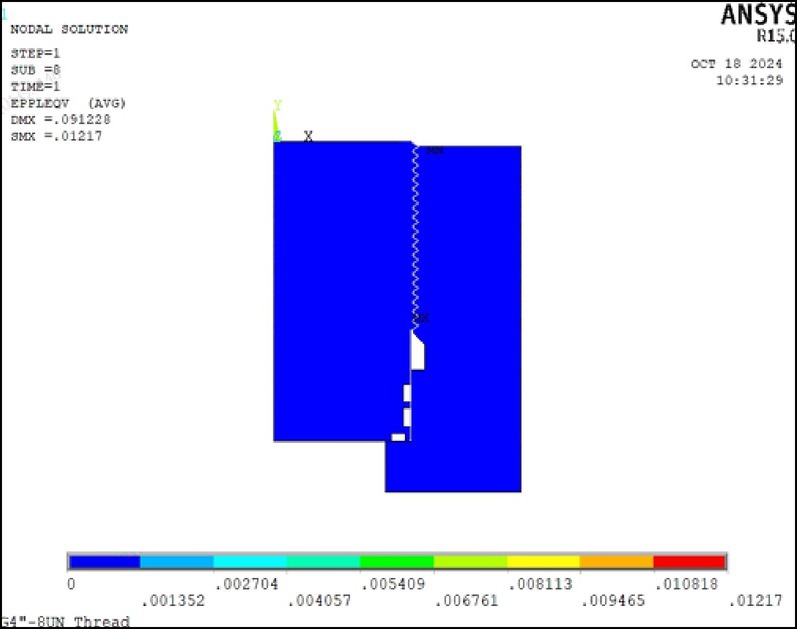
Figure 13. Contour of plastic strain distribution.
3.6 Crack propagation calculation
(1) Determination of Cubic Polynomial Coefficients for Stress
The relationship between the axial stress s and the distance x from the inner surface is expressed as a cubic polynomial for each pressure condition, as follows (see Equation 1):
Using the least squares method, the cubic polynomial coefficients for each region under different pressures are determined, as shown in Table 2.
(2) Stress Intensity Factor K1 Calculation
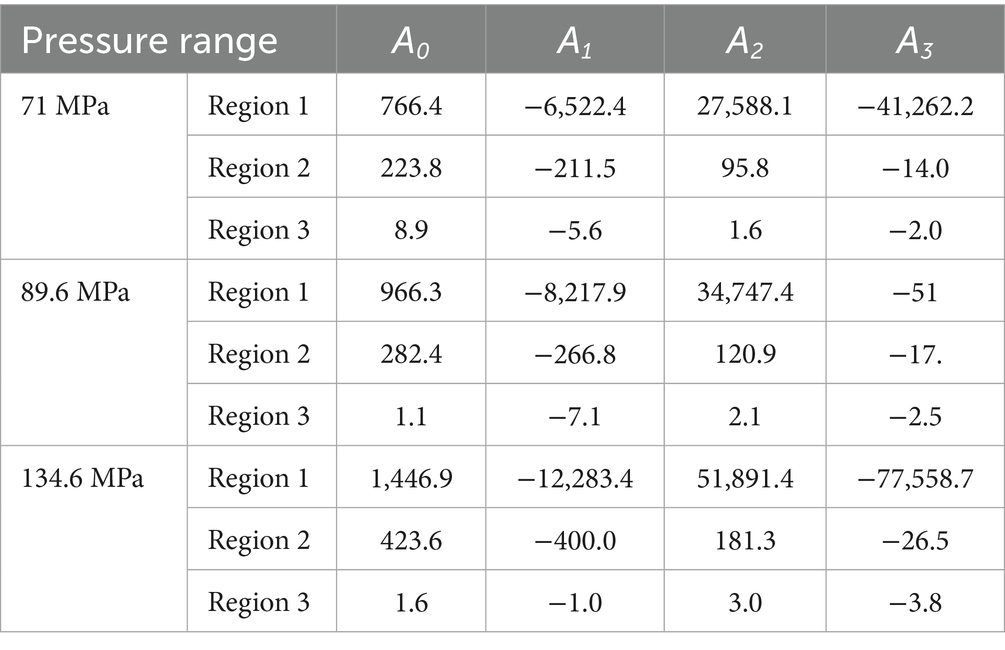
Table 2. Cubic polynomial coefficients of the relationship between axial stress and distance under different pressure.
Based on ASME VIII-3-2019 Appendix D, Formula D-403, the stress intensity factor K1 corresponding to the crack depth a is calculated for 71 MPa, 89.6 MPa, and 134.6 MPa (see Equation 2):
Where —represents the plastic zone correction factor.
When used for crack propagation, it is set to 1. The crack propagation formula is) (see Equation 3):
The formula is transformed into (see Equation 4):
F1 is expressed as (see Equation 5):
F2 is expressed as (see Equation 6):
F3 is expressed as (see Equation 7):
F4 is expressed as (see Equation 8):
(3) Stress Intensity Factor K1 Correction
When considering the multi-region stress distribution model, the stress intensity factor K1 should theoretically remain continuous at the boundaries between regions. However, due to differences in the cubic polynomial coefficients A0, A1, A2, and A3 between regions, the calculated K1 values To address this, the difference in 𝐾1 values at the boundaries between Region 1 and Region 2 and between Region 2 and Region 3, denoted as ΔK1,2 and ΔK2,3, calculated as shown in Table 3. This correction ensures the continuity of K1 across the entire analysis range, allowing for more accurate crack propagation predictions.
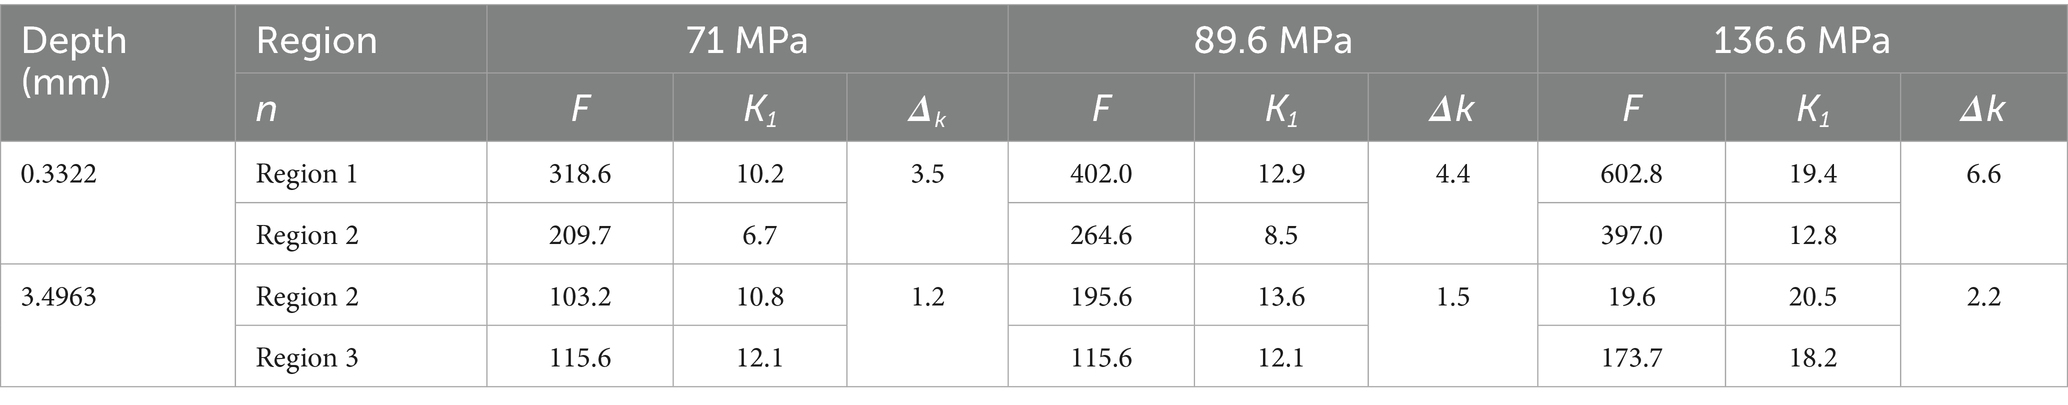
Table 3. Intensity factor K1 correction.
In the K1 calculation values for Region 2 and Region 3, in order to ensure continuity across regions and accurately predict crack propagation, we apply corrections to these values. The specific correction process involves adding ΔK1,2 to the ΔK1,2 calculation value in Region 2, and adding to the ΔK1,2 + ΔK2,3 calculation value in Region 3. This adjustment ensures the continuity of K1 at the region boundaries, as presented in Figure 14, and allows us to obtain a corrected K1 value, providing a more accurate calculation foundation for crack propagation analysis.
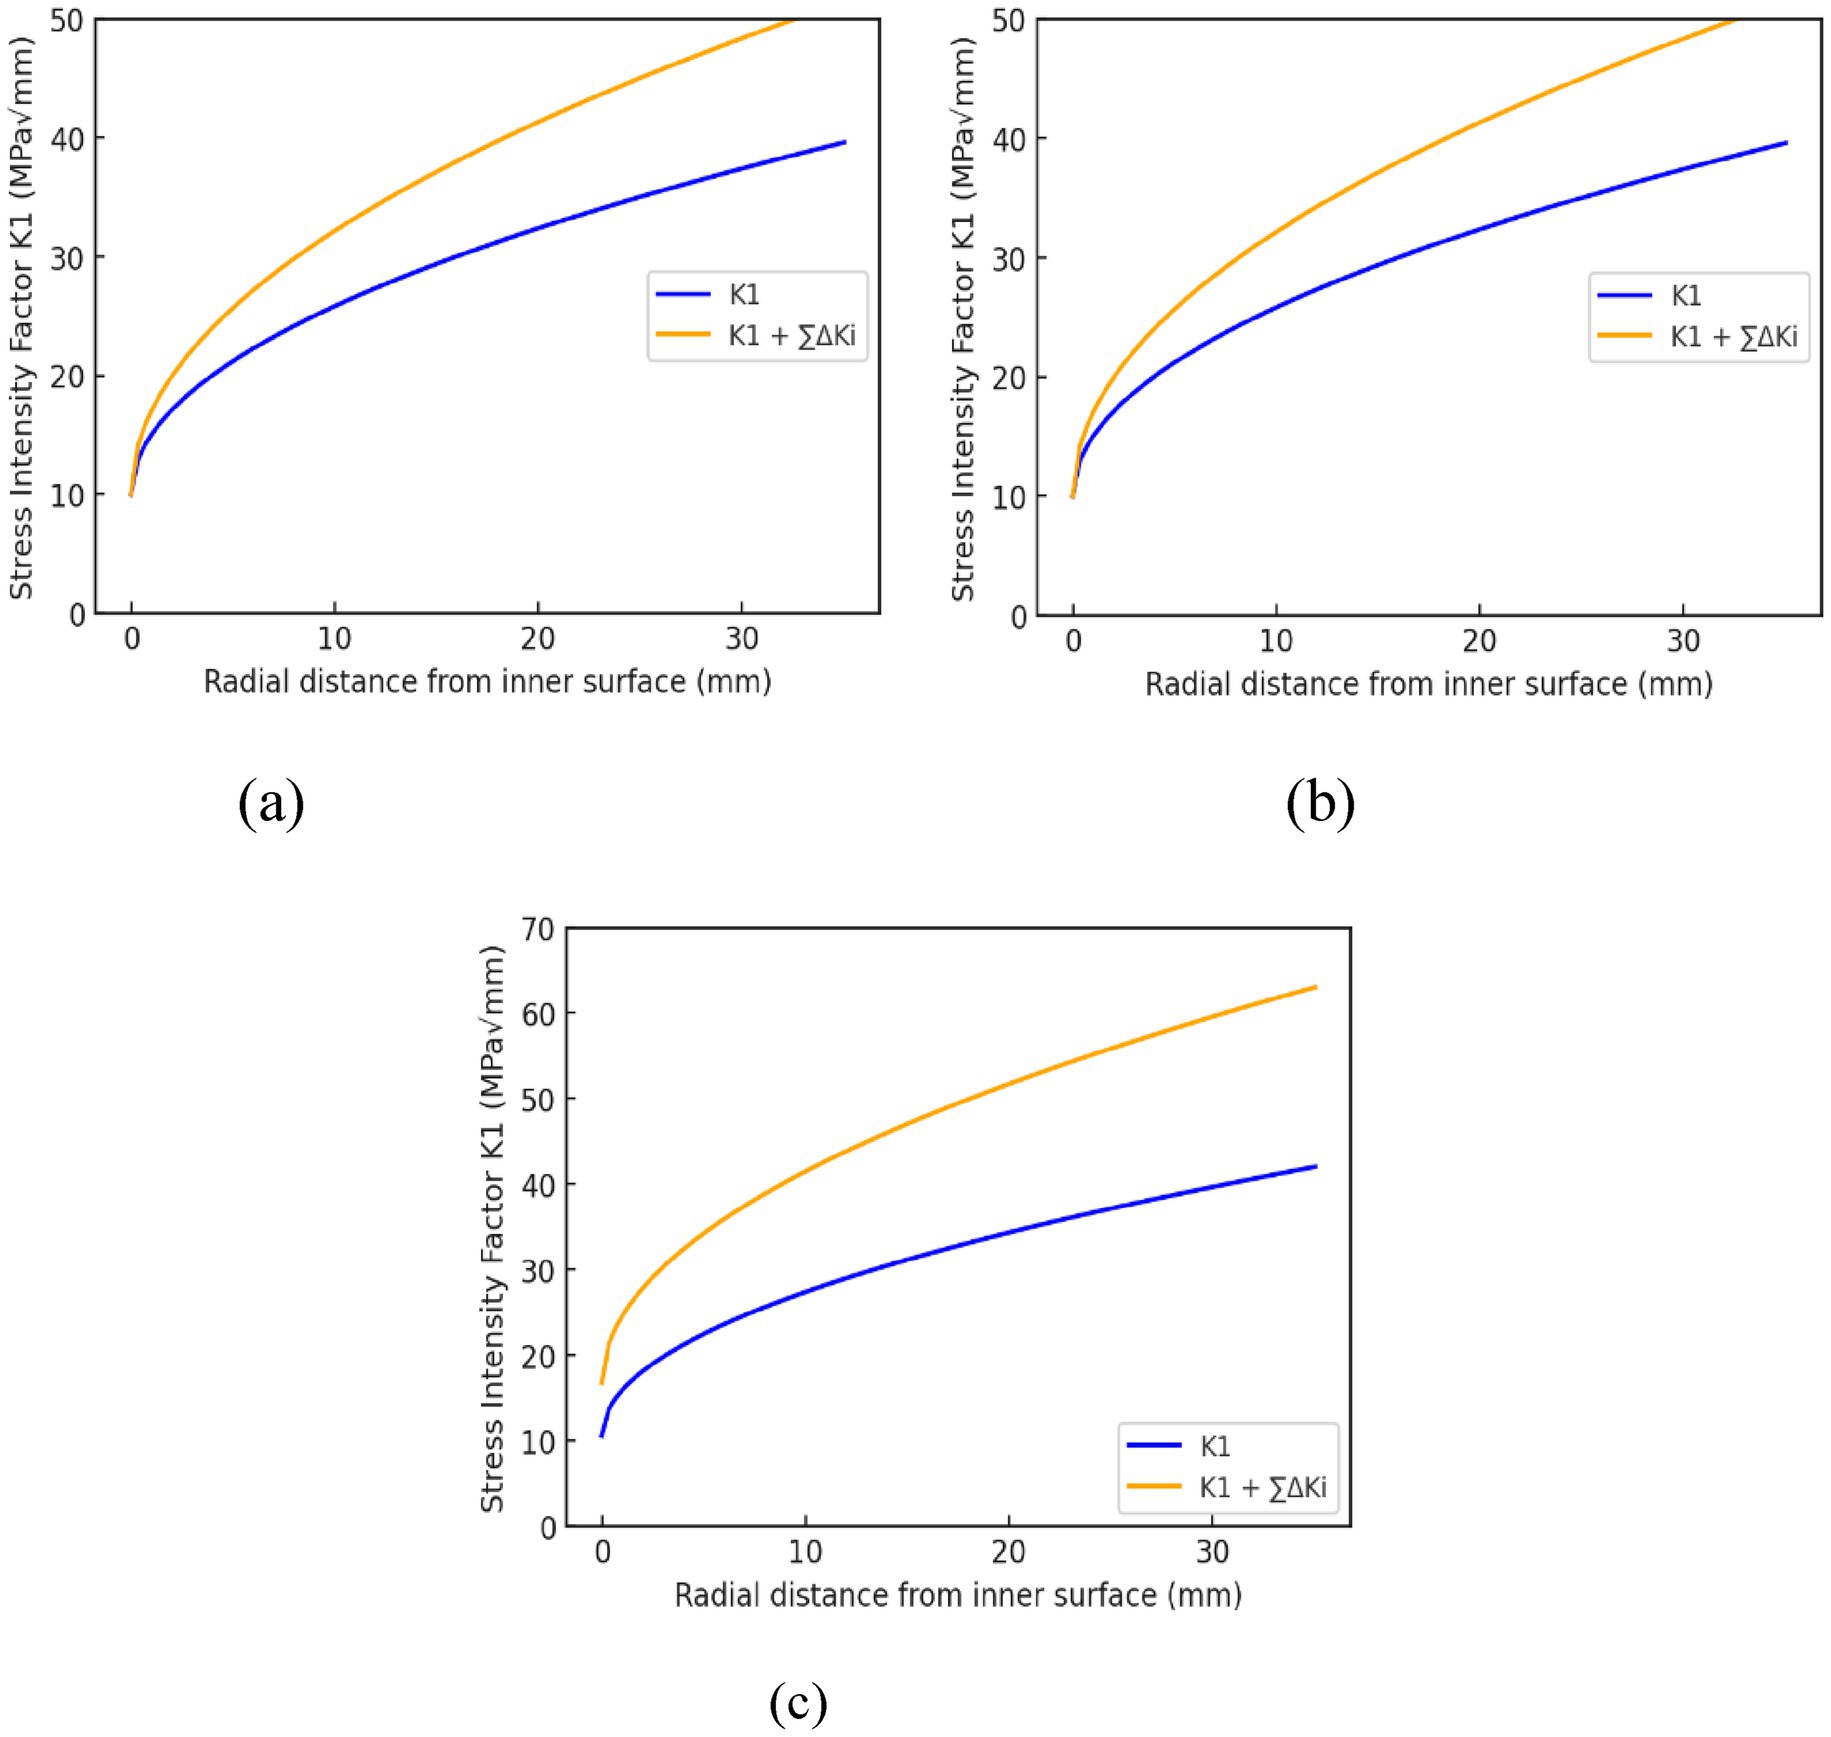
Figure 14. Corrected stress intensity factor curve. (a) 71 MPa. (b) 89.9 MPa. (c) 134.6 MPa.
3.7 Design life calculation
Based on the pressure cycle characteristics shown in Figure 3, the stress intensity factor at the crack tip is quantitatively analyzed under different cyclic pressures. Specifically, for each pressure cycle, the stress intensity factors at the deepest crack point and the crack surface under minimum cycle pressure (Pmin) and maximum cycle pressure (Pmax) are calculated, and the stress intensity factors K1min and K1max are derived. Then, the crack growth rates are computed using the following formulas (see Equation 9):
The stress ratio R is defined as (see Equation 10):
The crack growth rate at the deepest crack point is given by (see Equation 11):
According to KD-430 regulations, the crack growth at the current crack depth is (see Equation 12):
Using the expression for f(Rk) as defined in Code Case 2938-1, we calculate the crack growth rate at the crack surface f(Rk) (see Equation 13):
f(Rk) is expressed as (see Equation 14):
The crack growth rate at the crack surface is (see Equation 15):
From the initial crack depth a0, the crack growth is iteratively calculated based on the loading order and pressure amplitude shown in Figure 3 for each cyclic pressure. After each cycle, the crack depth is updated as a = a + Δa, and this iteration continues until the maximum stress intensity factor K1max at the crack tip reaches the critical hydrogen-induced cracking stress intensity factor threshold KIH. After 100,000 cycles, the crack depth increases from the initial 0.8 mm to 1.3028925 mm. Under the highest working pressure of 89.6 MPa, the stress intensity factor at the crack tip is 15.478 at the experimental pressure of 134.6 MPa, it is 23.217 , both significantly lower than the critical threshold of K1H = 40 , indicating that the crack growth rate and final size meet the design cycle life requirements.
The design cycle life is defined as the minimum of the following two conditions:
a. The number of cycles required to expand the crack from its initial assumed size to the critical crack depth, divided by two.
b. The number of cycles required to expand the crack from its initial assumed size to its allowed final crack depth.
The crack propagation calculation results show that expanding the crack from the initial depth of 0.8 mm to the critical depth of 2.874 mm requires Nd = Min(Nc/2, Np) = Min(122,638/2, 64,361) = 613,19 cycles, while expanding it to the allowed final depth of 1.319 mm requires.
4 Fatigue testing of threads in ultra-high-pressure hydrogen environment
A small-scale hydrogen storage vessel, fabricated from high-strength SA-372J steel—matching the material used in full-scale 103 MPa hydrogen storage vessels—was utilized for testing. The vessel has a volume of 300 mL and a wall thickness of 58 mm, as shown in Figure 15. High-precision pressure sensors were installed to continuously monitor internal pressure variations in real time. To ensure stable gas-tightness throughout the testing process, a dual O-ring sealing system was employed. Experimental parameters were strictly controlled according to the specifications outlined in Table 1 and Figure 1. To simulate service conditions, the vessel was subjected to repeated pressurization cycles.
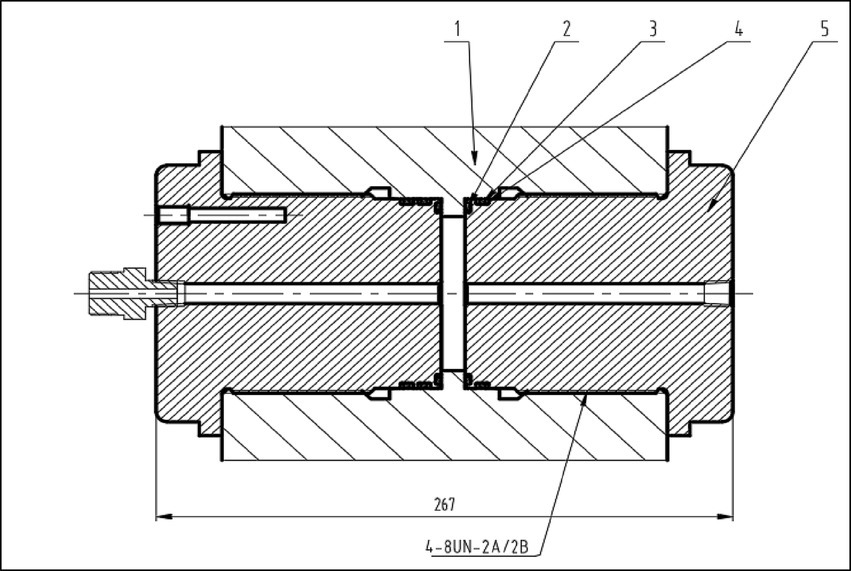
Figure 15. Schematic diagram of the sample cylinder. 1. Cylinder, 2. Rubber O-ring 1, 3. Retaining ring, 4. Rubber O-ring 2, 5. Rubber seal.
Figure 16 shows the test parameter settings used for the experiment, including the pressure settings, hold times, and temperature control. The pressure cycle is clearly outlined, with the upper and lower pressure limits set for the test.
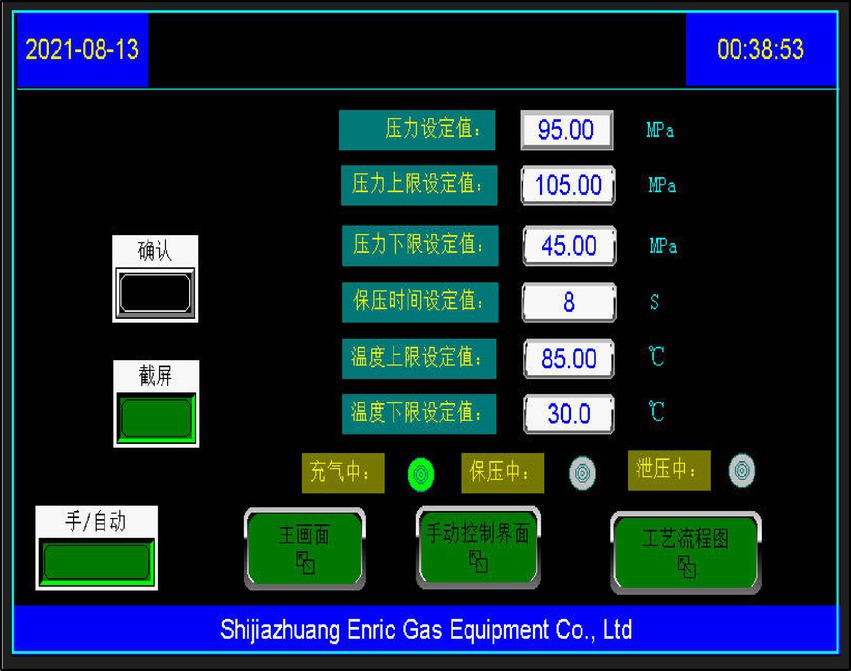
Figure 16. Test parameter setting.
Figure 17 presents the pressure–temperature and time curves during the testing process, which were continuously monitored to track the performance of the hydrogen storage vessel under varying conditions. These curves provide valuable data for analyzing the vessel’s behavior during cyclic loading and pressure fluctuations.
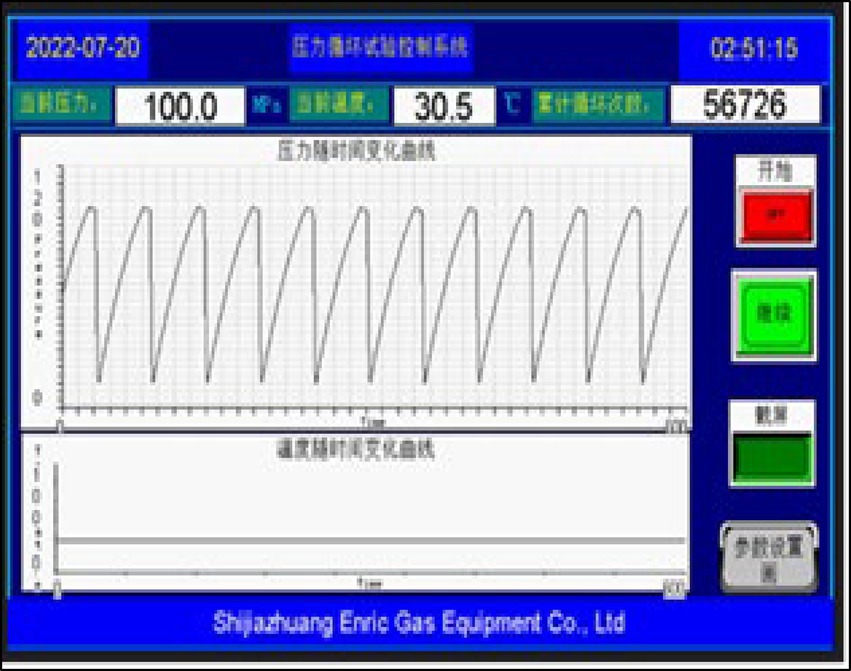
Figure 17. Pressure–temperature and time curves.
After 60,000 pressure cycles at 103 MPa, H2 leak testing was conducted using a mass spectrometer leak detector. The measured leak rate was below the detection limit of 1.0 × 10⁻⁶ Pa·m3/s, indicating no measurable leakage at the threaded connection. These results confirm that the threaded joints exhibit excellent fatigue resistance and maintain stable sealing performance under ultra-high-pressure hydrogen environments.
5 Summary
This chapter establishes both theoretical and experimental foundations for the optimized design of threaded connections in high-pressure hydrogen storage vessels, verifying the fatigue durability of threads operating in hydrogen environments.
1. Stress concentration and crack initiation mechanisms: simulation results under various pressure cycling and temperature conditions reveal that threaded connections exhibit satisfactory fatigue durability in high-pressure hydrogen environments. However, stress concentration at the thread root remains the primary site for fatigue crack initiation. Under cyclic high-pressure conditions, hydrogen penetration further aggravates localized stress distribution, increasing the risk of crack formation at critical geometric features of the threads.
2. Validation through long-term pressure cycling experiments: following 60,000 pressure cycles at 103 MPa, the experimental evaluation confirmed the long-term operational performance of threaded connections. While minor fatigue cracks and wear traces were observed on the thread surface, crack propagation remained limited and did not compromise the vessel’s sealing performance or structural integrity. The dual O-ring sealing design effectively maintained excellent gas-tightness throughout the test, ensuring the safety and reliability of the threaded connection over extended service periods.
3. Comparison of numerical simulations with experimental observations: the numerical simulation results closely matched the experimental findings, accurately predicting stress concentration zones and potential crack initiation sites within the threaded region. Based on these analyses, this study proposes several recommendations for improving thread fatigue life, including optimizing surface treatment processes at the thread root to alleviate stress concentration effects and mitigate hydrogen embrittlement-induced crack propagation. These findings provide valuable guidance for enhancing the safety and durability of high-pressure hydrogen storage vessel designs.
Data availability statement
The original contributions presented in the study are included in the article/supplementary material, further inquiries can be directed to the corresponding author.
Author contributions
JX: Conceptualization, Data curation, Formal analysis, Funding acquisition, Investigation, Methodology, Project administration, Resources, Software, Supervision, Validation, Visualization, Writing – original draft, Writing – review & editing. YZ: Data curation, Formal analysis, Conceptualization, Visualization, Writing – original draft. JL: Investigation, Methodology, Conceptualization, Formal analysis, Software, Writing – original draft. RY: Funding acquisition, Resources, Software, Supervision, Validation, Visualization, Writing – original draft, Writing – review & editing.
Funding
The author(s) declare that no financial support was received for the research and/or publication of this article.
Acknowledgments
The authors thank the reviewers for their valuable comments.
Conflict of interest
The authors declare that the research was conducted in the absence of any commercial or financial relationships that could be construed as a potential conflict of interest.
Generative AI statement
The authors declare that no Gen AI was used in the creation of this manuscript.
Publisher’s note
All claims expressed in this article are solely those of the authors and do not necessarily represent those of their affiliated organizations, or those of the publisher, the editors and the reviewers. Any product that may be evaluated in this article, or claim that may be made by its manufacturer, is not guaranteed or endorsed by the publisher.
References
1. Zheng, J, Liu, X, Xu, P, Liu, P, Zhao, Y, and Yang, J. Development of high pressure gaseous hydrogen storage technologies. Int J Hydrog Energy. (2012) 37:1048–57. doi: 10.1016/j.ijhydene.2011.02.125
2. Sikiru, S, Oladosu, TL, Amosa, TI, Olutoki, JO, Ansari, MNM, Abioye, KJ, et al. Hydrogen-powered horizons: transformative technologies in clean energy generation, distribution, and storage for sustainable innovation. Int J Hydrog Energy. (2024) 56:1152–82. doi: 10.1016/j.ijhydene.2023.12.186
3. Dou, Y, Sun, L, Ren, J, and Dong, L. Opportunities and future challenges in hydrogen economy for sustainable development [M]// Hydrogen economy : Academic Press (2023). 537–69.
4. Dincer, I, and Aydin, MI. New paradigms in sustainable energy systems with hydrogen. Energy Convers Manag. (2023) 283:116950. doi: 10.1016/j.enconman.2023.116950
5. Kim, T, and Kim, HY. Design and structural safety evaluation of an ultra-high-pressure hydrogen vessel (type I) with maximum capacity. J Mech Sci Technol. (2025) 39:637–50. doi: 10.1007/s12206-025-0111-y
6. Chen, X, Fan, Z, Xu, S, Xu, P, and Liu, X. Technological progress on safety assurance for hydrogen storage and transportation pressure equipments in China In: Pressure vessels and piping conference, vol. 86144: American Society of Mechanical Engineers (2022). V001T01A071.
7. Yamabe, J, Itoga, H, Awane, T, Matsuo, T, Matsunaga, H, and Matsuoka, S. Pressure cycle testing of Cr–Mo steel pressure vessels subjected to gaseous hydrogen. J Press Vessel Technol. (2016) 138:011401. doi: 10.1115/1.4030086
8. Li, JQ, Xu, H, Wang, JB, Wang, XY, Li, JC, Kwon, S, et al. A review of methods to study the fatigue life of nodes connecting marine composite hydrogen storage tanks to ships under the action of external forces. J Energy Storage. (2023) 72:108367. doi: 10.1016/j.est.2023.108367
9. Nachtane, M, Tarfaoui, M, Abichou, MA, Vetcher, A, Rouway, M, Aâmir, A, et al. An overview of the recent advances in composite materials and artificial intelligence for hydrogen storage vessels design. J Compos Sci. (2023) 7:119. doi: 10.3390/jcs7040119
10. Jia, G, Lei, M, Li, M, Xu, W, Li, R, Lu, Y, et al. Hydrogen embrittlement in hydrogen-blended natural gas transportation systems: a review. Int J Hydrog Energy. (2023) 48:32137–57. doi: 10.1016/j.ijhydene.2023.04.266
11. Kong, L, Xie, H, Gao, C, and Li, C. Experimental and theoretical research on the anisotropic deformation and energy evolution characteristics of shale under uniaxial cyclic loading and unloading. Int J Geomech. (2022) 22:04022208. doi: 10.1061/(ASCE)GM.1943-5622.0002590
12. Yang, S, Hu, W, Meng, Q, and Zhao, B. A new continuum damage mechanics–based two-scale model for high-cycle fatigue life prediction considering the two-segment characteristic in S-N curves. Fatigue Fract Eng Mater Struct. (2020) 43:387–402. doi: 10.1111/ffe.13161
13. Böhme, SA, and Papuga, J. Advancements in stress-based multiaxial fatigue prediction: a data-driven approach and a new criterion. Fatigue Fract Eng Mater Struct. (2024) 47:2139–55. doi: 10.1111/ffe.14281
14. Tamoud, A, Zaïri, F, Mesbah, A, and Zaïri, F. A multiscale and multiaxial model for anisotropic damage and failure of human annulus fibrosus. Int J Mech Sci. (2021) 205:106558. doi: 10.1016/j.ijmecsci.2021.106558
15. Nejad, RM, Tohidi, M, Darbandi, AJ, et al. Experimental and numerical investigation of fatigue crack growth behavior and optimizing fatigue life of riveted joints in Al-alloy 2024 plates. Theor Appl Fract Mech. (2020) 108:102669. doi: 10.1016/j.tafmec.2020.102669
16. Qin, YQ, Gong, Y, Yuan, YW, and Yang, ZG. Failure analysis on leakage of hydrogen storage tank for vehicles occurring in oil circulation fatigue test. Eng Fail Anal. (2020) 117:104830. doi: 10.1016/j.engfailanal.2020.104830
17. Wetegrove, M, Duarte, MJ, Taube, K, Rohloff, M, Gopalan, H, Scheu, C, et al. Preventing hydrogen embrittlement: the role of barrier coatings for the hydrogen economy. Hydrogen. (2023) 4:307–22. doi: 10.3390/hydrogen4020022
18. Tan, L, Li, D, Yan, L, Pang, X, and Gao, K. A novel heat treatment for improving the hydrogen embrittlement resistance of a precipitation-hardened martensitic stainless steel. Corros Sci. (2022) 206:110530. doi: 10.1016/j.corsci.2022.110530
19. Kawamori, M, Urushihara, W, and Yabu, S. Improved hydrogen embrittlement resistance of steel by shot peening and subsequent low-temperature annealing. ISIJ Int. (2021) 61:1159–69. doi: 10.2355/isijinternational.ISIJINT-2020-463
20. Li, B, Reis, L, and De Freitas, M. Simulation of cyclic stress/strain evolutions for multiaxial fatigue life prediction. Int J Fatigue. (2006) 28:451–8. doi: 10.1016/j.ijfatigue.2005.07.038
21. Guo, H, Sun, B, and Li, Z. A multi-scale fatigue-creep coupled damage model for steel structures under extreme cyclic loading and temperature. Int J Damage Mech. (2020) 29:591–609. doi: 10.1177/1056789519871339
22. Shenoy, V, Ashcroft, IA, Critchlow, GW, and Crocombe, AD. Fracture mechanics and damage mechanics based fatigue lifetime prediction of adhesively bonded joints subjected to variable amplitude fatigue. Eng Fract Mech. (2010) 77:1073–90. doi: 10.1016/j.engfracmech.2010.03.008
23. Wasim, M, Djukic, MB, and Ngo, TD. Influence of hydrogen-enhanced plasticity and decohesion mechanisms of hydrogen embrittlement on the fracture resistance of steel. Eng Fail Anal. (2021) 123:105312. doi: 10.1016/j.engfailanal.2021.105312
24. Sendrowicz, A, Myhre, AO, Wierdak, SW, and Vinogradov, A. Challenges and accomplishments in mechanical testing instrumented by in situ techniques: infrared thermography, digital image correlation, and acoustic emission. Appl Sci. (2021) 11:6718. doi: 10.3390/app11156718
25. He, X, Zhou, R, Liu, Z, Yang, S, Chen, K, and Li, L. Review of research progress and development trend of digital image correlation. Multidiscip Model Mater Struct. (2024) 20:81–114. doi: 10.1108/MMMS-07-2023-0242
26. Deng, L, Yuan, H, Chen, J, Zhang, M, Su, G, Zhou, Y, et al. Experimental investigation and field application of acoustic emission array for landslide monitoring. Landslides. (2024) 21:71–81. doi: 10.1007/s10346-023-02119-2
27. Zhang, H, Cui, Y, Liang, G, Li, L, Zhang, G, and Qiao, X. Fatigue life prediction analysis of high-intensity marine diesel engine cylinder head based on fast thermal fluid solid coupling method. J Braz Soc Mech Sci Eng. (2021) 43:327. doi: 10.1007/s40430-021-03049-7
28. Singh, R, Singh, V, Arora, A, and Mahajan, DK. In-situ investigations of hydrogen influenced crack initiation and propagation under tensile and low cycle fatigue loadings in RPV steel. J Nucl Mater. (2020) 529:151912. doi: 10.1016/j.jnucmat.2019.151912
Keywords: thread fatigue, hydrogen storage vessel, finite element modeling, crack propagation, computational mechanics, hydrogen embrittlement
Citation: Xue J, Zhang Y, Li J and Yin R (2025) Computational modeling and experimental investigation of thread fatigue in ultra-high-pressure hydrogen storage vessels. Front. Appl. Math. Stat. 11:1625013. doi: 10.3389/fams.2025.1625013
Edited by:
Modesar Shakoor, IMT Lille Douai, FranceReviewed by:
Pavlo Maruschak, Ternopil Ivan Pului National Technical University, UkraineYoussri Hassan Youssri, Cairo University, Egypt
Copyright © 2025 Xue, Zhang, Li and Yin. This is an open-access article distributed under the terms of the Creative Commons Attribution License (CC BY). The use, distribution or reproduction in other forums is permitted, provided the original author(s) and the copyright owner(s) are credited and that the original publication in this journal is cited, in accordance with accepted academic practice. No use, distribution or reproduction is permitted which does not comply with these terms.
*Correspondence: Ruifeng Yin, MTU5MzEwNTkyMzdAMTYzLmNvbQ==