 Olli-Pekka Hilmola
 Daniella Fjellström
 Per Hilletofth
- 1Department of Industrial Management, Industrial Design and Mechanical Engineering, University of Gävle, Gävle, Sweden
- 2Estonian Maritime Academy, Tallinn University of Technology, Kopli, Tallinn, Estonia
- 3Department of Business and Economic Studies, University of Gävle, Gävle, Sweden
The three Nordic countries (Denmark, Finland, and Sweden) have long enjoyed economic success in manufacturing and innovation. All of these countries have small domestic markets and depend on international trade. Before the Global Financial Crisis (GFC; 2008–2009), Finland and Sweden set the standards, but since the GFC, Denmark has performed particularly well, while Sweden has had a mediocre performance. Growth is evident not only in revenues but also in profits and asset amounts. This growth has been consistent across many companies and has followed a linear pattern. Finland has generally performed worse than the other two countries, with issues mostly associated with lower revenue and profit growth, and changes in assets. Finland lacks companies with consistent growth. A key difference from Denmark is the smaller presence of the healthcare sector. The present analysis indicated that consistent growth is required to achieve the desired results using the current measures.
1 Introduction
Several international studies have explored economic growth and its connection to social welfare (1), R&D (2), patents, and innovation capability [(see 3)] in OECDs, Africa, and European country clusters. Historically, Denmark, Finland, and Sweden have excelled in manufacturing and innovation, despite their limited domestic markets and reliance on international trade. This success can be attributed to their focus on education, research and development (R&D), and fostering environments that encourage innovation. These factors help improve high-value manufacturing and increase their competitiveness globally (4). According to the European Commission (5), these countries, along with the Netherlands, are considered leaders in European innovation. Despite having small domestic markets and being located in Northern Europe, they remain at the forefront of new technologies and their application.
In the early 2000s, both Finland and Sweden experienced significant success in terms of new manufacturing industries, growth, profits, and employment. The telecommunications sector, in particular, was experiencing significant positive change. This development was led by companies such as Nokia and Ericsson. These two companies also provided growth for local supplies, technology companies, and the Information Technology (IT) sector in general. Both companies were publicly traded on their respective stock exchanges, and many of their suppliers and partners were as well. For example, the total market capitalization of the Helsinki (Finland) stock exchange was at its highest in April 2000, and it is still one-fourth higher than what it was in the early 2025s [do note that this is in nominal terms; (6)]. However, things changed quickly, and it could be said that the global leadership of both Finland and Sweden in the telecommunications sector was seriously challenged in the following decade, with growth giving way to decline, deficits, restructuring, and mergers [(e.g., 7–9)]. At the same time, however, Danish healthcare and pharmaceutical sector companies started to grow and gain a global foothold. Change was rapid: In early 2024, Novo Nordisk became the company with the largest market capitalization in Europe and challenged Tesla with its valuation (10). Growth was also evident in revenues, profits, and investments. Sales of breakthrough drugs for diabetes treatment and weight loss were leading the development. Like Nokia and Ericsson at their best times, even Danish pharmaceutical companies are using a global supply network for deliveries, and not all exports will ever cross Danish borders (11). The pharmaceutical sector also has a long tradition in this country [(e.g., 12)], like telecommunications giants from two other countries [(e.g., 7, 8)]. Interestingly, there were very few early indicators or signs of this huge Danish success (13, 14).
The three Nordic countries of this research are all high-income countries with high Gross Domestic Product (GDP) per capita. They all belong to the European Union (EU) and are currently members of the North Atlantic Treaty Organization (NATO). Finland is a part of the euro currency system (since its inauguration in 2002), while Sweden has its own currency (krona) and Denmark as well (krone). In terms of population, these countries are rather similarly sized: Finland is the smallest with a population of 5.6 million [end of the year 2023; (15)], while Denmark has 5.93 million, and Sweden has 10.55 million. At the end of 2023, GDP per capita (15) was the highest in Denmark (68,619 USD), followed by Sweden (55,433 USD) and Finland (53,131 USD). If going back to the year 2000, GDP per capita was highest in Sweden, and Denmark closely followed it, and even back then, Finland had the lowest performance in this regard.
Before the Global Financial Crisis (GFC) of 2008–2009, Finland and Sweden led in the telecommunications and IT sectors. However, after the GFC, Denmark and Sweden have shown notable growth in revenues, profits, and assets, with many companies exhibiting consistent, linear expansion. In contrast, Finland’s performance has lagged, characterized by stagnant revenues, lower profit growth, and inconsistent company growth. One significant factor differentiating Denmark from Finland is the robust presence of the healthcare sector in Denmark. This underscores the necessity of sustained growth for achieving desired financial performance. Finland’s manufacturing sector has struggled to regain its pre-crisis momentum [(see 16)]. The main reasons for this, besides the GFC, are the trade collapse and the Nokia crisis. In addition, many metal industry export products are in segments, which had very small or even negative growth prospects available after the GFC (17).
Sweden’s manufacturing sector has also faced challenges. Recently, for example, Northvolt, a battery manufacturer, faced financial difficulties, resulting in debts, operational setbacks, and eventually bankruptcy in March 2025 (18). Saab Automotive is another Swedish company that encountered financial difficulties after the global financial crisis (GFC), eventually leading to bankruptcy in late 2011 (19, 20). These two cases raise concerns about the stability of Sweden’s long-term industrial initiatives and their broader economic implications.
It could be concluded that during the observation period of this research, from 2010 to 2023, interest is in Danish manufacturing companies, as its economy has shown the highest GDP per capita growth from 2000 to 2023 and is currently leading these three countries. At the same time, there is a lack of interest in how the previously leading economy of Sweden has developed over the years and what challenges Finland faces in the analysis outcome. Additionally, this research aims to examine the results of consistent and linear growth in the long term. Our overall research problem could be stated with the following research question: What is the role of consistent growth (in revenues, profits, and assets) in explaining country-level success of manufacturing in these three Nordic countries?
The post-GFC recovery strategies of Denmark and Sweden, which have outperformed Finland in terms of financial growth, present an important avenue for further investigation. A closer look at the specific policies, industrial structures, and corporate strategies that helped these two economies perform better could provide valuable insights for Finland and other countries with similar manufacturing sector challenges. While existing research provides a solid foundation for understanding financial growth in Nordic manufacturing, this exploration could add deeper insights for both academic research and practical policy recommendations, ultimately contributing to a more comprehensive understanding of the financial growth mechanisms within Nordic manufacturing industries. Thus, this study aims to explore how consistent financial growth and industry composition influence long-term economic performance in Denmark, Finland, and Sweden. This distinction is crucial, as financial predictability may play a more significant role in long-term sustainability.
This research is structured as follows: Section 2 reviews research concerning the manufacturing sector of the three Nordic countries in this study, and the perspective is on understanding performance in the observation period of the empirical part (2010–2023). Thereafter, Section 3 introduces research data and environment, a comprehensive country-level analysis of three measures of interest in the following empirical data analysis. Section 4 introduces the 20 most consistent (linear regression model with positive coefficient and highest possible R2 value) growing manufacturing companies in terms of growth in revenues, profits, and assets. These consistently growing companies are further analyzed in Section 5 regarding the relative growth during the observation period. Research is concluded and discussed in Section 6, and further research avenues are also proposed.
2 Related literature
The Nordic countries have long been recognized for their strong manufacturing industries and commitment to innovation [(see 4)]. Innovation has always been a key driver of economic progress, and previous research has shown a strong connection between investment in R&D and long-term financial performance. Existing research on Nordic manufacturing growth has explored various dimensions, including environmental sustainability, trade dependencies, and the challenges of high-cost manufacturing environments. Fu et al. (21) studied how Multinational Enterprises (MNEs), Foreign Direct Investment (FDI), and changes in industries affect economic growth. While their research primarily focuses on developing countries, they use China as an example. Research explains how China moved from relying on labor-intensive manufacturing to focusing more on MNEs and attracting FDI. This change demonstrates how economies move from low-value industries, like agriculture, to higher-value sectors, such as manufacturing, services, and knowledge-based industries. These changes support improved innovation, productivity, and long-term growth. Countries that make this type of shift to high-value industries can boost their productivity, which leads to steady economic growth [(e.g., 22)]. Improving manufacturing capabilities is crucial for staying competitive and ensuring long-term economic stability. Lasisi et al. (3) studied the impact of environmental innovations and technologies on economic growth, particularly in leading eco-innovation economies such as Denmark, Finland, and Sweden. Eco-innovation brings efficiency and environmental benefits while developing innovations. The research highlights that oil consumption and environmental technologies drive economic growth, but has not linked them explicitly to long-term financial performance in manufacturing sectors. However, environmental technologies can mitigate the negative impact of fossil fuel dependence and contribute to long-term financial growth. The study underscores the importance of cost-effectiveness and energy efficiency in manufacturing processes. This finding is relevant to Nordic manufacturing companies that prioritize sustainability-driven innovations. Given the increasing emphasis on green technology, further research is needed to assess how environmental policies influence financial growth in Nordic manufacturing beyond energy efficiency alone.
Similarly, Lind (23) has highlighted the productivity benefits of Chinese intermediaries, but has not assessed whether such trade dependencies lead to financial vulnerabilities in times of global supply chain disruptions. By using Chinese suppliers for parts and materials, firms can become more efficient in their production processes. This approach has been especially useful in high-cost countries like Sweden, where manufacturing cost is a challenge. The use of global supply chains has therefore played an important role in supporting productivity and growth in the region.
A study of born global start-ups in Sweden’s manufacturing sector (24) between 1998 and 2008 found that these firms were still relatively uncommon (p. 69). Despite factors such as open trade policies, the rise of the Internet, and digitalization, the number of such companies did not grow significantly over the past 10 years. In the short term, born global tend to concentrate on increasing sales and expanding, but their overall performance does not appear to be stronger than that of more traditional firms. While these firms show rapid growth in terms of employment and sales, their long-term profitability does not always surpass that of traditional manufacturing companies. This raises questions about the financial sustainability of born global firms and the strategic measures they could adopt to improve profitability over time.
Ahmad and Zhang (2) demonstrated that R&D investments rise during economic booms and decline in periods of downturn in the context of OECD economies. They further explain that a new reason for economic growth is the digital economy. The role of public policy and welfare institutions in fostering innovation is highlighted in the studies by Hajighasemi et al. (1), who analyze how different welfare state models influence economic competitiveness. It was previously considered a conflict between the welfare system and the capacity for economic growth and innovation. Their study finds that the Nordic countries support innovation by allocating resources to R&D, education, and infrastructure, creating an environment encouraging technological advancement and business expansion. Furthermore, this suggests that social policies may serve as enablers of sustained growth in the manufacturing sector.
3 Research data and environment
A sample of companies from three different countries is rather balanced in terms of total amount. The Denmark analysis includes 36 publicly traded manufacturing companies, the Sweden analysis comprises 51 companies, and the Finland analysis encompasses 52 companies. As Appendix A illustrates, the number of companies varies in the observation period of 2010–2023. In all countries, Initial Public Offerings (IPO) have been taking place, and new companies were listed on the stock exchange during this observation period. These IPO companies could be entirely new or spinoffs from existing corporations. In the case of new Swedish publicly traded companies, they are spinoffs from existing and already listed corporations (some might have been taken as independent earlier than 2010 and were not listed right away). However, according to our knowledge, not a single IPO company in the Finnish sample was a spinoff, and in Denmark, there is only one. In the Finnish sample, there also exist companies that were acquired by another corporation.
In the following analysis, it should be kept in mind that these three countries have certain differences among them. Finland joined the euro currency in the first wave of 1999/2002, where Sweden and Denmark have their national currencies; the Swedish currency (krona, SEK) has been showing constant weakness since 2012 until the end of 2023. Danish currency (krone, DKK) has stayed in a leveled off development for the entire observation period against the euro. All three currencies (euro, SEK, and DKK) have weakened against the US dollar during the research period, and this has been especially the case with the Swedish krona. Consequently, the following Swedish figures could appear biased (against Finland and Denmark) as they are based on the national currency, and most of the sales volume originates from exports.
Industries in these three countries differ. Danish companies are well represented in the healthcare and pharmaceuticals sector (12 companies out of 36, or 33.3% of all companies), and several of these companies are well-known throughout the world. In Sweden and Finland, companies are mostly from the steel, mechanics, and electronics industries, together with forestry and the food industry. In Sweden, four out of 51 companies are in the healthcare and pharmaceutical industry, and in Finland, one out of 52 companies is in the same industry.
The average revenue development varies between these three countries (Figure 1). Danish companies have been able to increase their revenues by 84.9% (or 1.849 times) in the observation period, where Swedish companies have grown 77.4% (in euros, this growth would be 47.5%), and Finnish companies show a low growth of 14%. It should be noted that average revenue was, for many years, in decline within Finland (in 2015 it was 21.3% lower than in 2010). A similar situation was also present in Sweden, where in the same period of time, revenues simply did not grow that consistently, and experienced declines in 2013 and 2016 (in 2013, Swedish revenues were the same as they were in 2010). In the early years of the observation period, Denmark did not show any weakness, and average revenue was growing. The double crisis, that of the coronavirus era and the following war in Europe (Ukraine), has notably increased revenues of all three countries. Denmark was strongest (again), followed by Sweden (very closely in the final years of the observation period). Only Finland started to indicate a declining revenue in 2023.
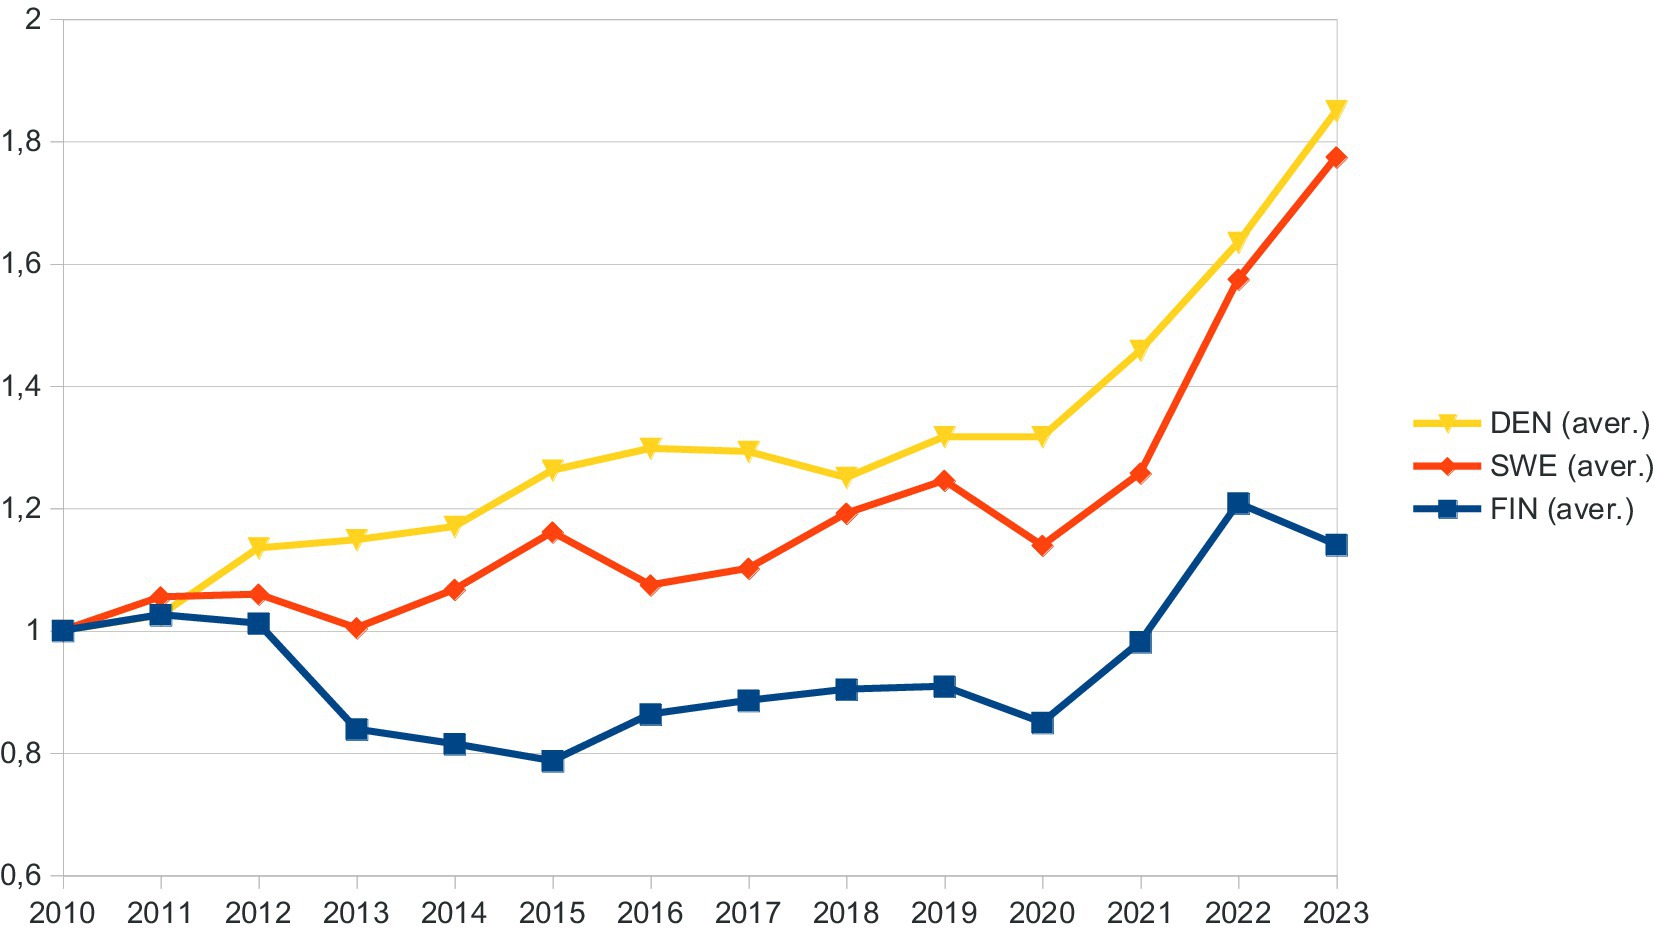
Figure 1. Average revenues (indexed, 2010 = 1.000) of Danish (DEN), Finnish (FIN), and Swedish (SWE) publicly traded manufacturing companies in the period of 2010–2023.
As Danish manufacturing has shown clear growth in revenues, it has also been profitable and has improved its profitability during the observation period (Figure 2). It could be concluded that Swedish and Finnish manufacturers have been under constant pressure with profits, and they have fluctuated rather significantly (especially Finnish data). Average profitability was practically the same in Finnish data in 2023 as compared to 2010, where Swedish companies were able to increase it by 36.5% (in euros, this profit growth slows down to 13.5%), and Danish companies recorded growth of 73.8%.
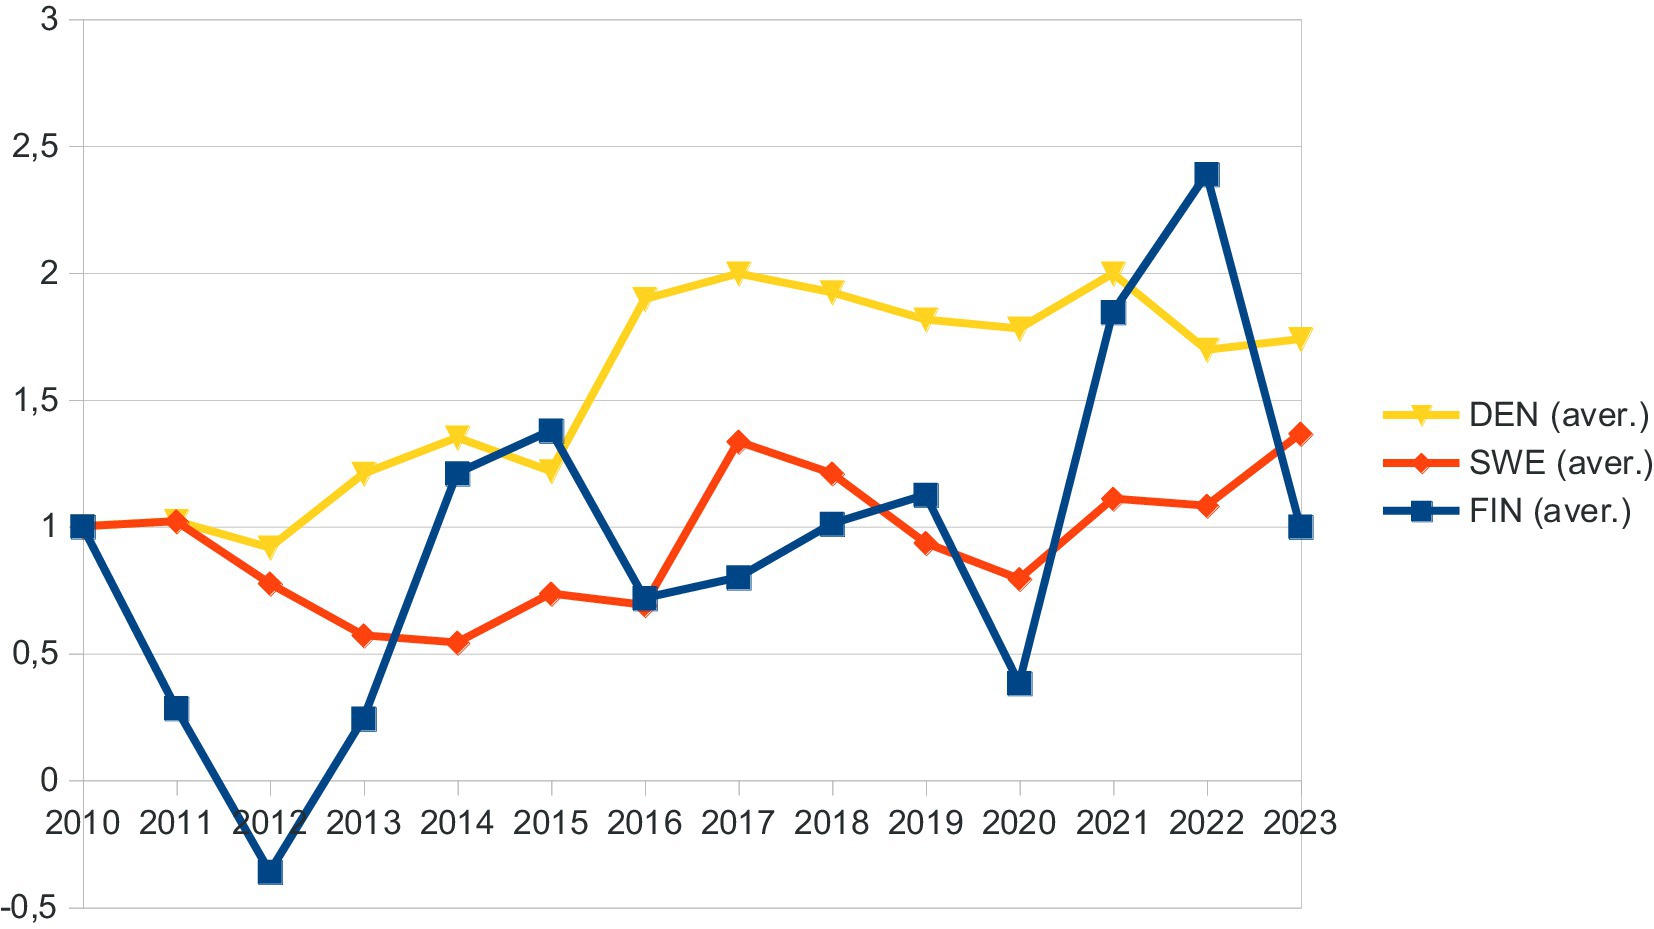
Figure 2. Average profit/loss (indexed, 2010 = 1.000) of Danish (DEN), Finnish (FIN), and Swedish (SWE) publicly traded manufacturing companies in the period of 2010–2023.
Similarly to the two earlier measures, total assets grew most predictably among Danish manufacturing companies (114% or 2.14 times), followed by Swedish (92%; in euro terms, 59.6%) and Finnish (43.8%) manufacturers (see Figure 3). Danish growth in assets was extremely strong after 2016–2017, and during this same time, Swedish and Finnish series started to show some clear growth as well. It should be noted that the average asset decline in the Finnish series shows a decrease until 2015. During the worst years (2014–2015), it was nearly 15% lower than in 2010.
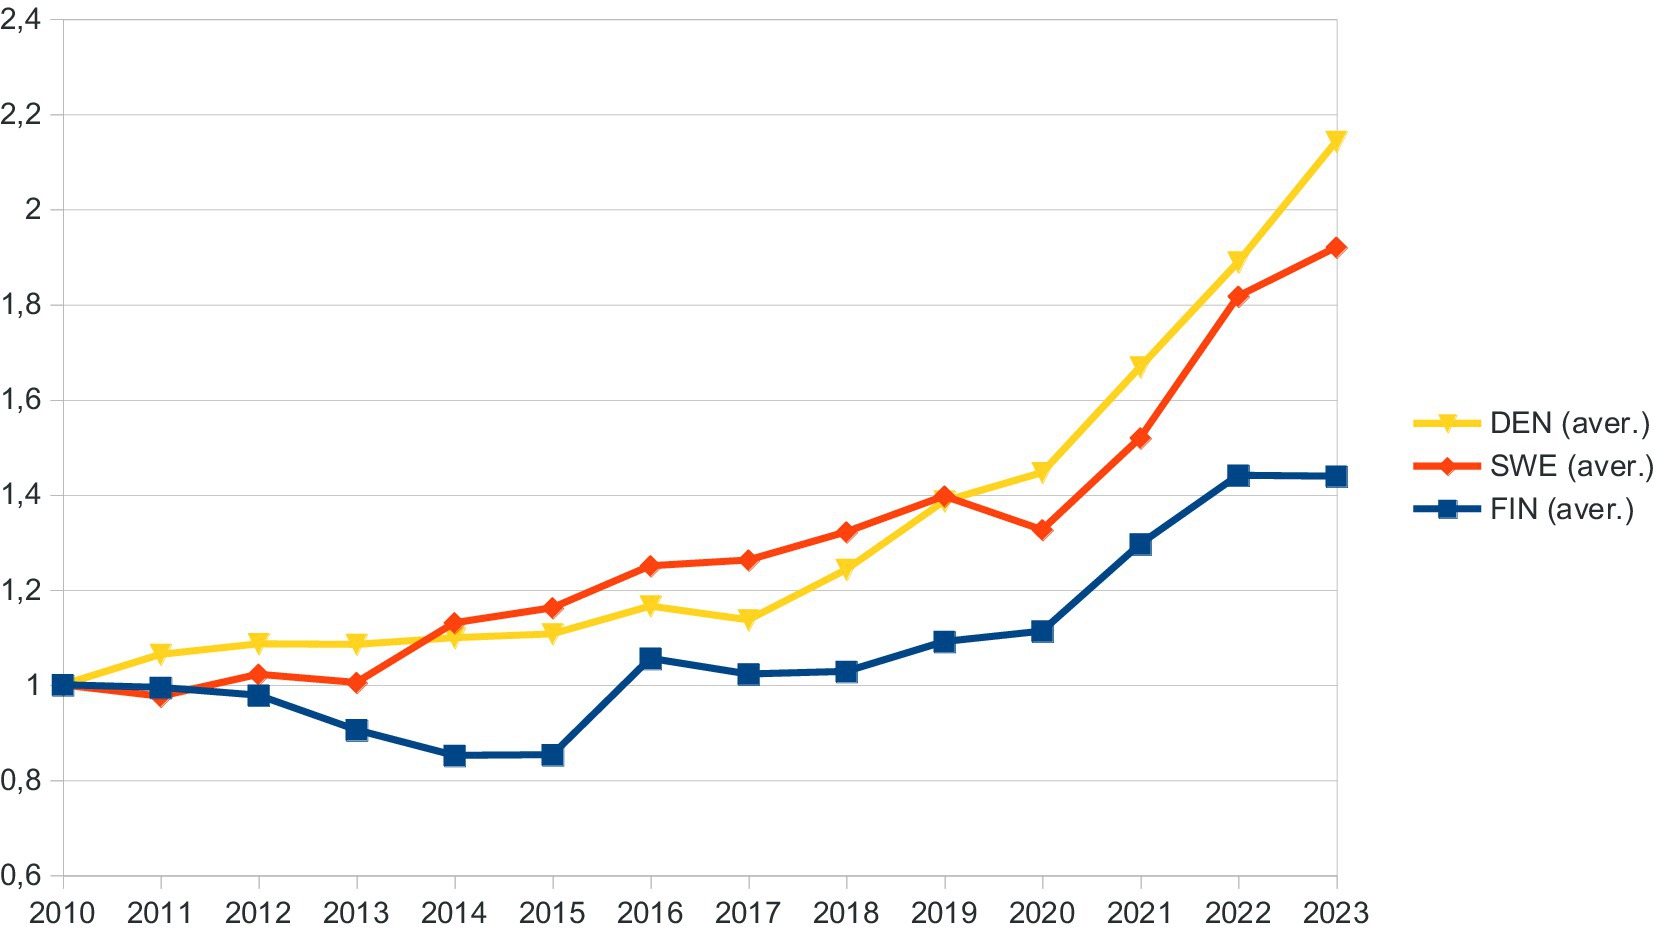
Figure 3. Average total assets (indexed, 2010 = 1.000) of Danish (DEN), Finnish (FIN), and Swedish (SWE) publicly traded manufacturing companies in the period 2010–2023.
Hajighasemi et al. (1) data reveal that Finland spent more on social protection (% of GDP) than Denmark and Sweden. On the other hand, Sweden spent more on R&D expenditure (% of GDP) than both Denmark and Finland, and the same results go for patent applications (1). Several studies have examined the relationship between economic growth and patents [(see 2)]. However, throughout their study, these three countries (e.g., Sweden, Finland, and Denmark) form a cluster in each measure, but they present different results.
We observed that the economic paths of Denmark, Sweden, and Finland have shifted since the 2008–2009 Global Financial Crisis. While Denmark and Sweden have demonstrated steady financial growth in the manufacturing sector, Finland has struggled to achieve similar levels of recovery. This disparity is particularly evident in revenue expansion, profit growth, and the ability to sustain long-term financial development. One of the key differentiators has been the industrial composition of these economies. Denmark has benefited from a robust healthcare and pharmaceutical sector, which has contributed significantly to its post-crisis recovery. Finland, on the other hand, lacks a similarly dominant industry, making it more vulnerable to economic fluctuations. Furthermore, another notable distinction between Denmark and Finland is the scale and impact of their healthcare sectors. Denmark’s healthcare system is characterized by extensive digital infrastructure and a strong emphasis on innovation, contributing positively to its economic growth.
4 Most consistently growing manufacturing companies
4.1 Revenue
Regression models were built from all companies that had data from the entire observation period (2010–2023). The focus was on those companies that consistently showed revenue growth throughout the period and achieved a high R2 value. In Table 1, the two most consistently growing companies have both R2 values above 97%, indicating that time alone (years) can explain this percentage amount from revenue change (in a linear regression model). All linear regression model coefficients are statistically significant.
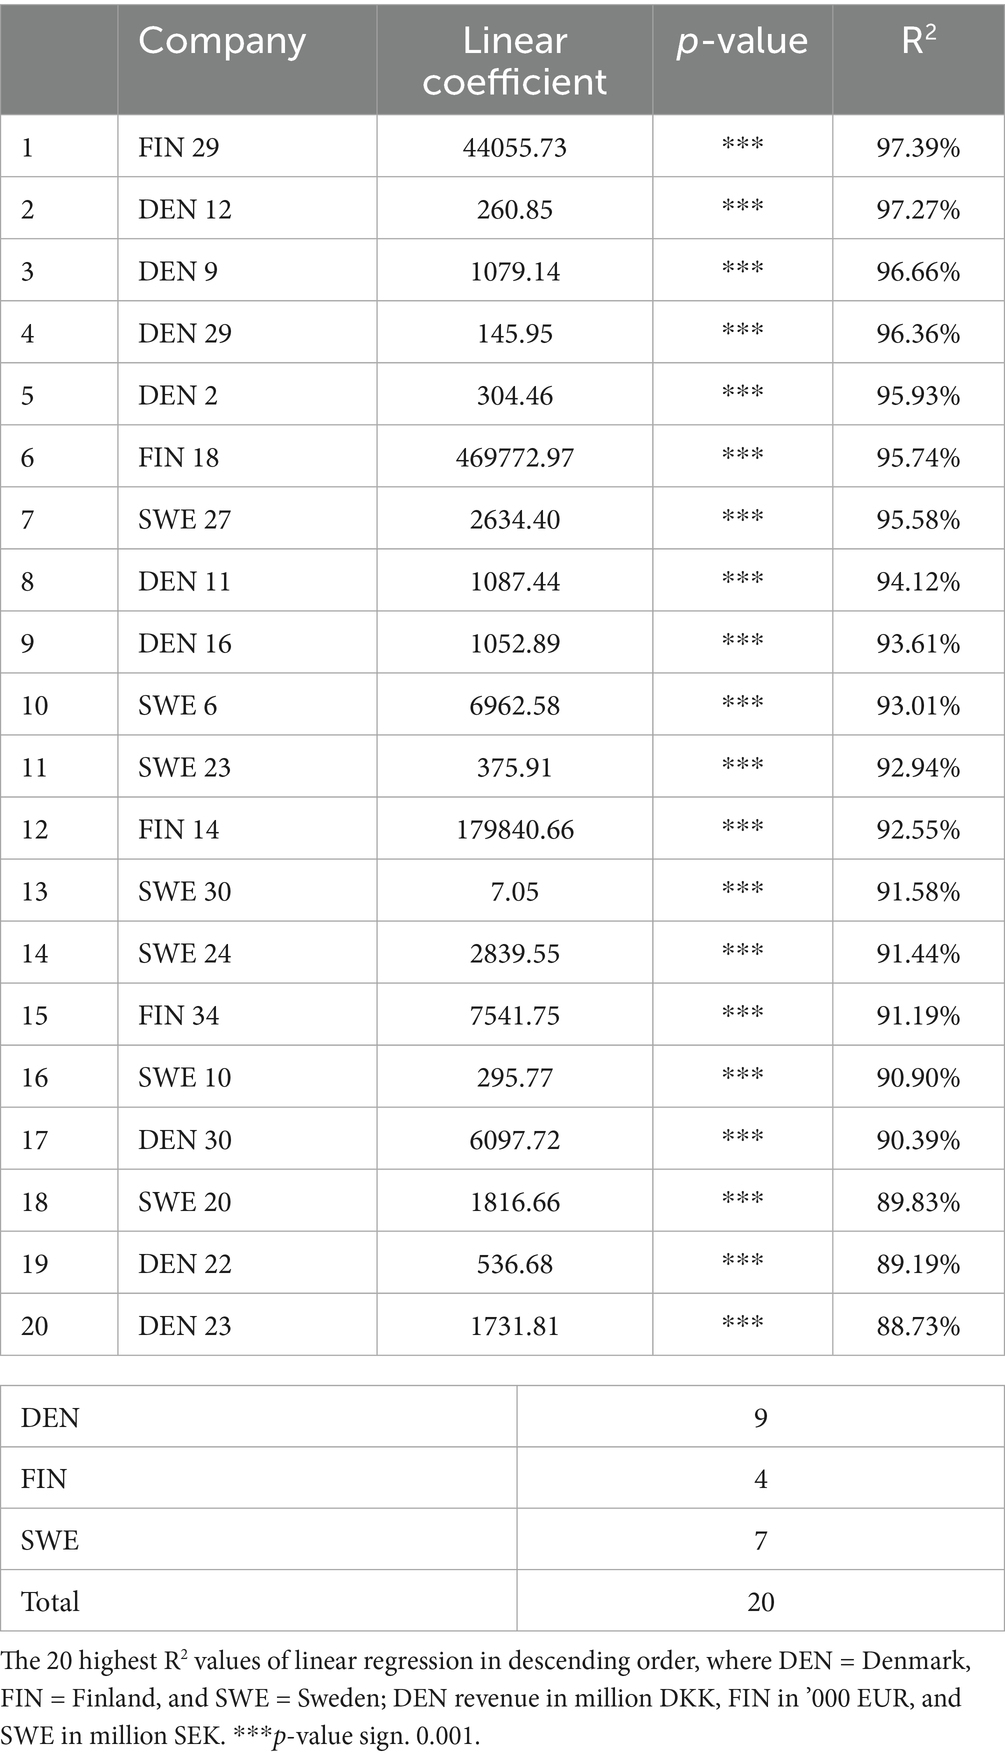
Table 1. Most consistently revenue-growing companies in three countries.
Table 1 depicts that the most consistently growing company appears to be Finnish, which is producing forestry machinery. As only four Finnish companies make the TOP 20 list, it is worthwhile to note that another Finnish company is ranked sixth, and this one specializes in lift and escalator production and their maintenance. Other companies in the TOP 10 are six Danish companies and two Swedish companies. All Danish manufacturing companies are entirely or partly connected to the healthcare sector. The second highest ranked company is a producer of prostheses and other aids, enabling mobility for people (such as those with injured or missing limbs). The following ones are not medicine or vaccine manufacturers, but mostly make different disposable items for patients or enable patient monitoring. In addition, some are specialized in hearing devices. This part of healthcare seems to be predictable and revenue-generating. The most consistently growing Swedish company in the TOP 10 list (seventh position) is a defense industry actor with a wide range of offered products, including missiles, submarines, sea vessels, and aircraft. Another Swedish company is in position 10, and it is a locking systems supplier.
Ranks from 11 to 20 are mostly taken by Swedish companies (five), followed by three Danish companies, as well as two Finnish manufacturers. Swedish companies are, in general, from the metal industry, and/or combined with some electronics. They could be both consumer and business/industrial products. For example, the 11th-ranked Swedish company is making equipment and machinery for the electronics industry. Two Finnish companies are from a packaging product supplier (12th-ranked) and a drilling consumables supplier (15th-ranked). Three Danish companies are suppliers of renewable (wind) systems (17th-ranked), biotechnology raw materials and semi-finished products (19th-ranked), and jewelry producers (20th-ranked).
Although Danish and Swedish companies were more represented in the TOP 20 of consistent revenue growth, the three countries otherwise do not have that many differences. As Table 2 shows, average R2 values are rather close to each other (and these are not different from each other in statistical terms, as values are compared with an ANOVA single-factor test). In addition, on average, four Finnish companies have the highest rank, followed by Danish and Swedish companies.

Table 2. Averages of R2 values and ranks of three countries in the TOP 20 of revenue consistency (where DEN = Denmark, FIN = Finland, and SWE = Sweden).
4.2 Profits
For profits, it is difficult to find many companies that have consistently grown profits with a high R2 value (90% or higher). As with revenue (Table 1), nearly all companies were showing such performance, but with profits in Table 3, only two companies are doing so. Of course, companies in ranks of 3–5 are rather close to the 90% level (Table 2), but still, we are talking only a few companies at best. On the other end of Table 3, within ranks of 19 and 20, there are companies with R2 values of 66–67%, which indicates that other factors account for one-third of the profit growth over the years, beyond what can be attributed to time alone. However, all linear regression coefficients are statistically significant.
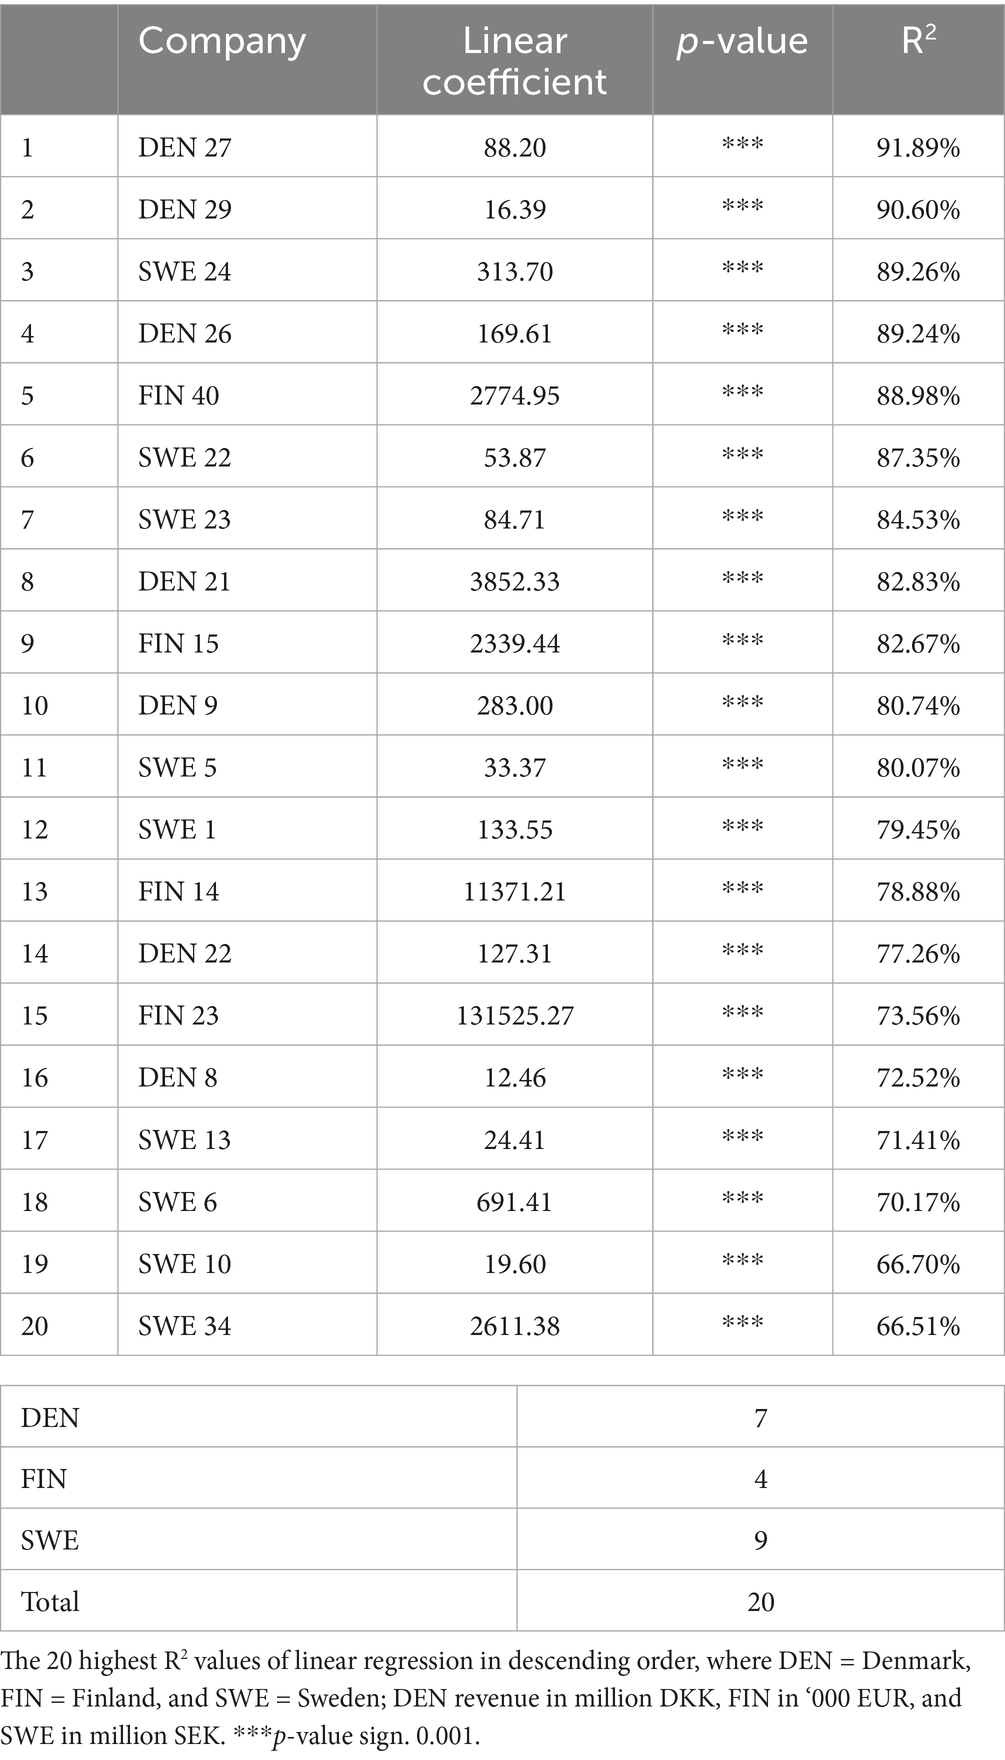
Table 3. Most consistently profit-growing companies in three countries.
Consistency of profit growth is again centered in Denmark (seven companies) and Sweden (nine companies), while only four companies from Finland are represented. The highest performing company in Table 3 is a Danish brewery (together with other alcoholic and non-alcoholic drinks), while in the second position is a healthcare industry accessories supplier. As a third, in profit consistency is a Swedish multi-industry corporation, followed by a Danish insulation company, and in the fifth rank is a Finnish measurement device manufacturer. Diversity of industries continues in ranks 6–10. Within the sixth rank, there is again a Swedish corporation having multiple industry presences (but mostly in making devices from metal), followed by an electronics industry equipment and machinery supplier. A large Danish vaccine and medical industry ranks eighth and in tenth position is a Danish company from healthcare sector, which sells accessories supplies. In between these two, there is a Finnish electronics contract manufacturer.
Ranks from 11 to 20 are mostly held by Swedish companies (six), while Danish and Finnish companies each occupy two positions in this range. Once again, the diversity of industries is high. In eleventh rank, there is a Swedish contract manufacturer for the electrical and metal industry, while an oil producer is in twelfth position. These are followed by a packaging product supplier from Finland (13th), a biotechnology products supplier from Denmark (14th), and an oil and renewable oil refinery from Finland (15th). Danish healthcare sector analysis manufacturer is in position 16, while Swedish machinery manufacturer (metal and electrical industry products) is in the 17th position. The last ranks in Table 2 are for three Swedish companies of locking systems suppliers (18th), metal industry product suppliers (19th), and truck and machinery manufacturers (20th).
Furthermore, differences in average performance at the country level are marginal, as Table 4 illustrates. All R2 values are rather close to each other, and within the statistical significance test, they are not different from each other (ANOVA single-factor test). The highest average rank is for Danish companies, followed by Finnish and Swedish.
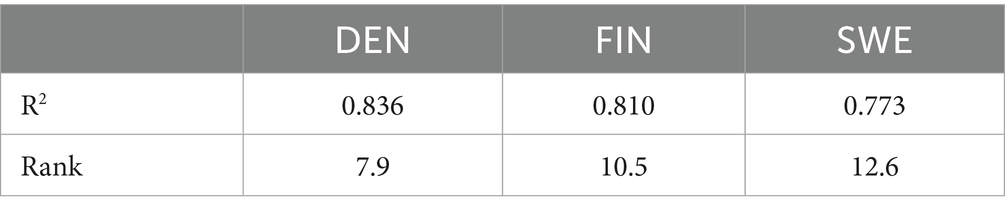
Table 4. Averages of R2 values and ranks of three countries in the TOP 20 of profit consistency (where DEN = Denmark, FIN = Finland, and SWE = Sweden).
4.3 Assets
Consistently growing assets seem to be easiest to achieve, and all 20 companies in Table 5 have 91.6% or higher explanation power. Thus, time alone can explain most of the growth during the observation period. Although Finnish manufacturing companies are not highly represented in consistent growth overall, all four companies are among the top 10 most consistent asset-growing companies in Table 5. This is one more than Danish or Swedish companies in the top 10. However, overall Danish and Swedish companies dominate Table 5 as they did earlier for profits and revenues.
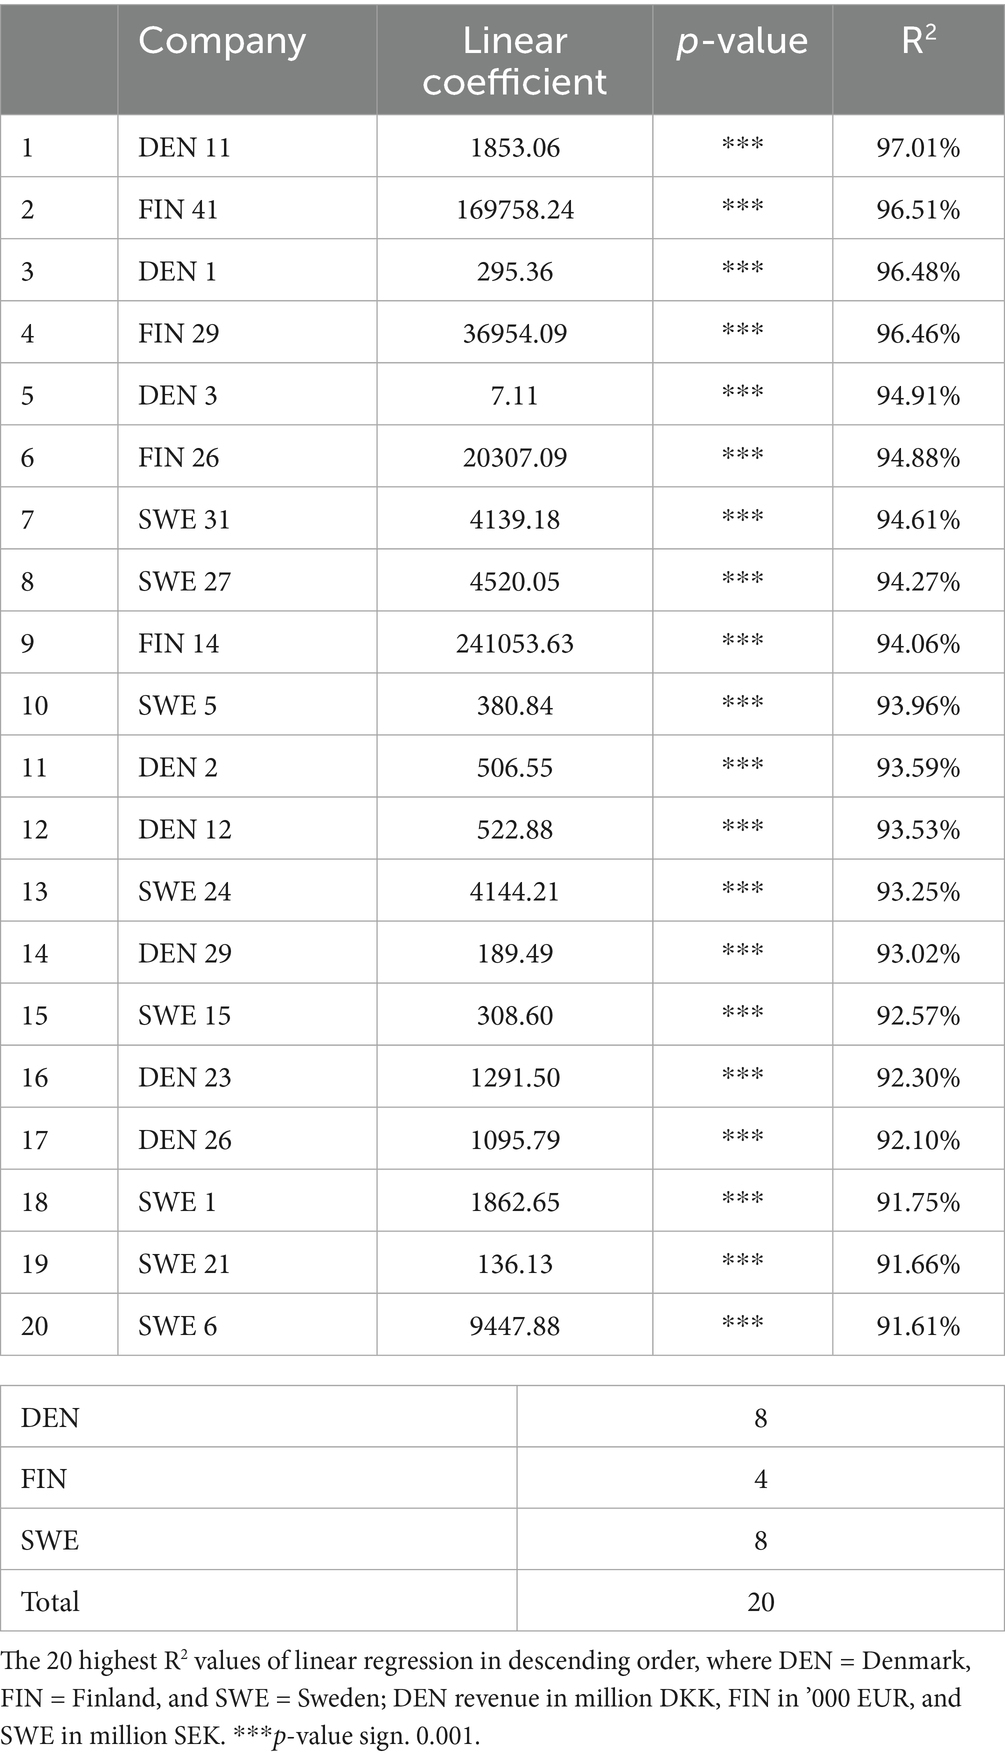
Table 5. Most consistently asset-growing companies in three countries.
The most consistent asset-growing company is a Danish hearing device manufacturer, followed by an engine and energy system supplier from Finland, a Danish healthcare company specialized in treatments and diagnostics, and a Finnish company producing forestry machinery. All four have an R2 value of more than 96%. The gaming and computer device manufacturer from Denmark is ranked fifth in Table 5, while the Finnish-based brewery and soft drink manufacturer is in sixth place. In the following ranks, there exist Swedish companies, where eighth is a metal industry product manufacturer, and ninth is a military equipment producing company. In the ninth rank is a Finnish packaging product supplier. The Swedish contract manufacturer is in the tenth rank.
In the ranks of the top 10 most consistent asset-growing companies, Table 5 has only Danish and Swedish companies, and these in equal shares. In the ranks of 11th and 12th, as well as 14th, are Danish medical industry actors, which are mostly producing devices, different aids, and patient monitoring suppliers. In positions 16th and 17th are Danish companies from other industries, namely from the production of jewelry and insulation products. Swedish companies are also from rather diverse industries, mechanical and electrical product suppliers (13th), kitchenware supplier (15th), oil product supplier (18th), mobile homes and trailer manufacturer (19th), and locking systems supplier (20th).
As Finnish companies only had positions among the 10 most consistent asset-growing companies, it is not surprising that the country-level average rank is the highest among these three countries (see Table 6). Denmark, followed by Finland, and, similarly to earlier growth aspects, in consistent asset growth, Swedish companies had the lowest average rank. Although the growth fit to the linear model is rather high (R2 values), it is surprising to find out that R2 values differ statistically from each other. This could be explained by the high variance of the Danish group of companies (as they are represented in both very high rank positions, and the ranks of 10 and lower).

Table 6. Averages of R2 values and ranks of three countries in the TOP 20 of asset consistency (where DEN = Denmark, FIN = Finland, and SWE = Sweden).
5 Does consistent growth result in higher relative growth?
It is always challenging to have very high growth, which is consistent over a longer period. As it was further analyzed, most consistent revenue-growing companies (Table 1) did not have the highest revenue growth. As Figure 4 illustrates, revenue growth rates do not improve at all if growth consistency gets higher (R2 value). The regression model in Figure 4 is not statistically significant at all, and its explanatory value is next to zero. So, consistent growth does not result in a higher growth rate. However, in general, consistent growth does bring higher growth, if compared to Figure 1, and general growth rates of Denmark (84.9%), Finland (14%), and Sweden (57.3%). During the same period, the 20 most consistently growing companies grew on average by 237.5%. So, consistent growth will bring results, but it does not lead to extremely high growth of revenues (which rarely follows a linear growth progression). Among the highest growing companies in this three-country sample, there are three companies from the healthcare sector, which grew 1,000–2,000% in this observation period. This growth was not consistent and did not follow a linear progression. However, these sudden jumps in revenue do not even appear within Danish data (see Figure 5), consistently growing companies can show on average as a group growth to an index value of 2.55, where the rest of the companies end up growing to 1.61. What is interesting is the observation that the growth of the latter group takes place in the very recent years of the observation period. In the year 2020, the index of other companies was as low as 1.04 (barely a growth in a decade). Our further analysis reveals that development in Sweden and Finland is following a pattern similar to that of Denmark: Consistent growth of companies is predictable over time, and other companies are growing in the very recent years of the observation period.
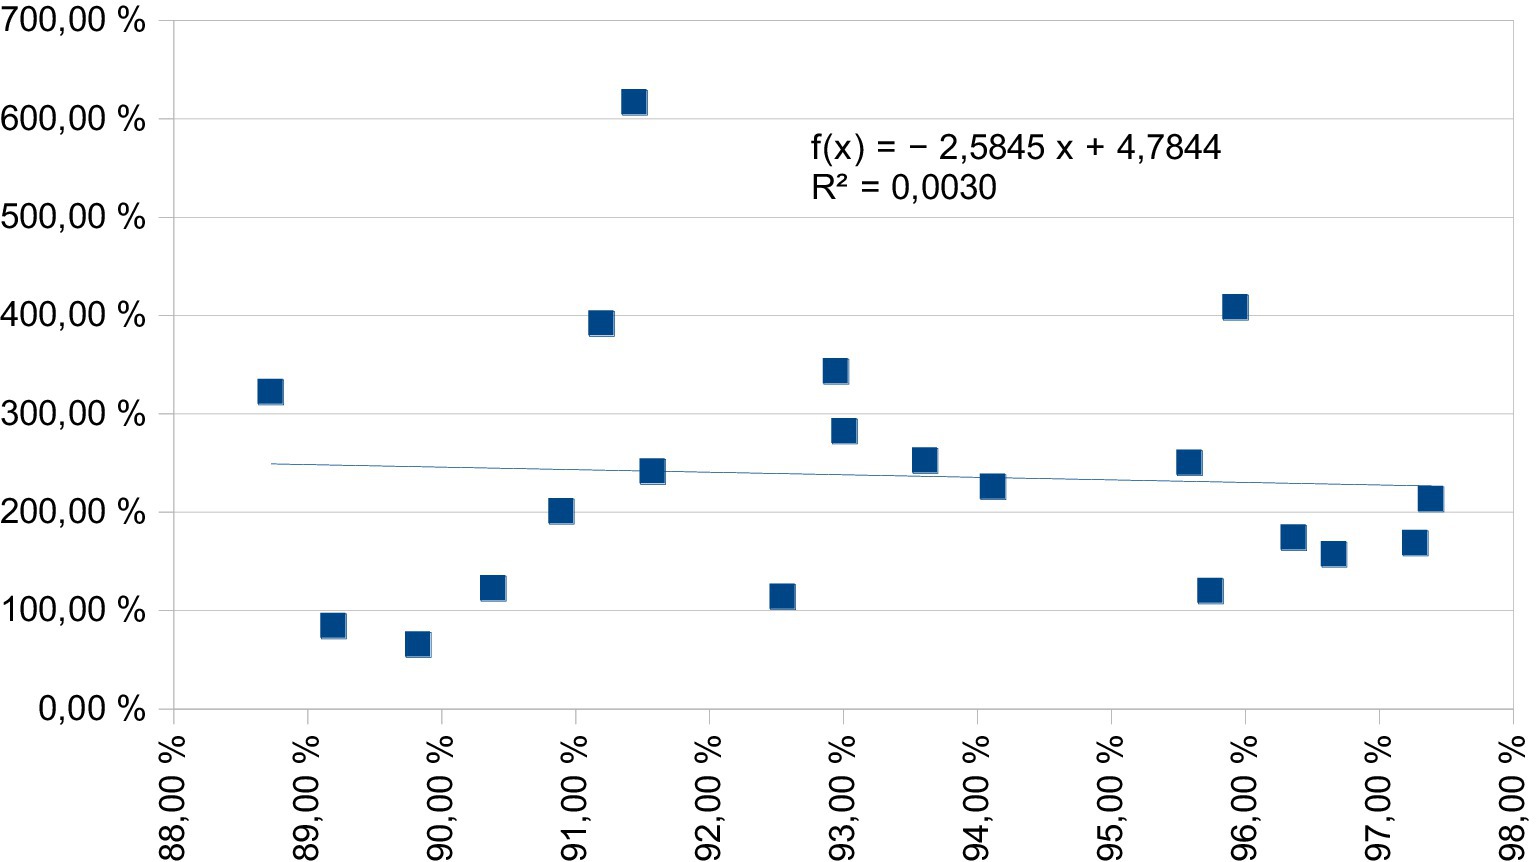
Figure 4. Scattergram of most consistently revenue-growing companies (R2 value, x-axis) and change in revenues during 2010–2023 (y-axis).

Figure 5. Indexed revenue growth (2010 = 1.000) of Danish companies divided into two groups: consistent growth (n = 9) and other (rest of the group, n = 27).
For a profit growth situation, it is rather similar. Consistent growth of profits does not bring additional growth for profits, as Figure 6 illustrates. Here, it includes 17 companies out of 20, as some companies had losses in the early years of the observation period, and relative growth could not be calculated. Although the regression model in Figure 6 is not statistically significant (not even near), its coefficient is positive, which gives some very minor indication of possible positive development. However, the explanatory power of this model is still very low, 8.2%. Despite this, it should be emphasized that consistent profit-growing companies in Figure 6 do show very high profit improvement in the period, on average 643%. This could be compared to the Danish average of 73.8% and the Swedish average of 21.3%. In this observation period, Finnish company profits did not grow on average at all (as shown in Figure 2). So, in this comparison, consistent profit growth is bringing an extremely high increase in profits. The second and third highest profit-growing companies analyzed in this research are also among other companies, as depicted in Figure 6.
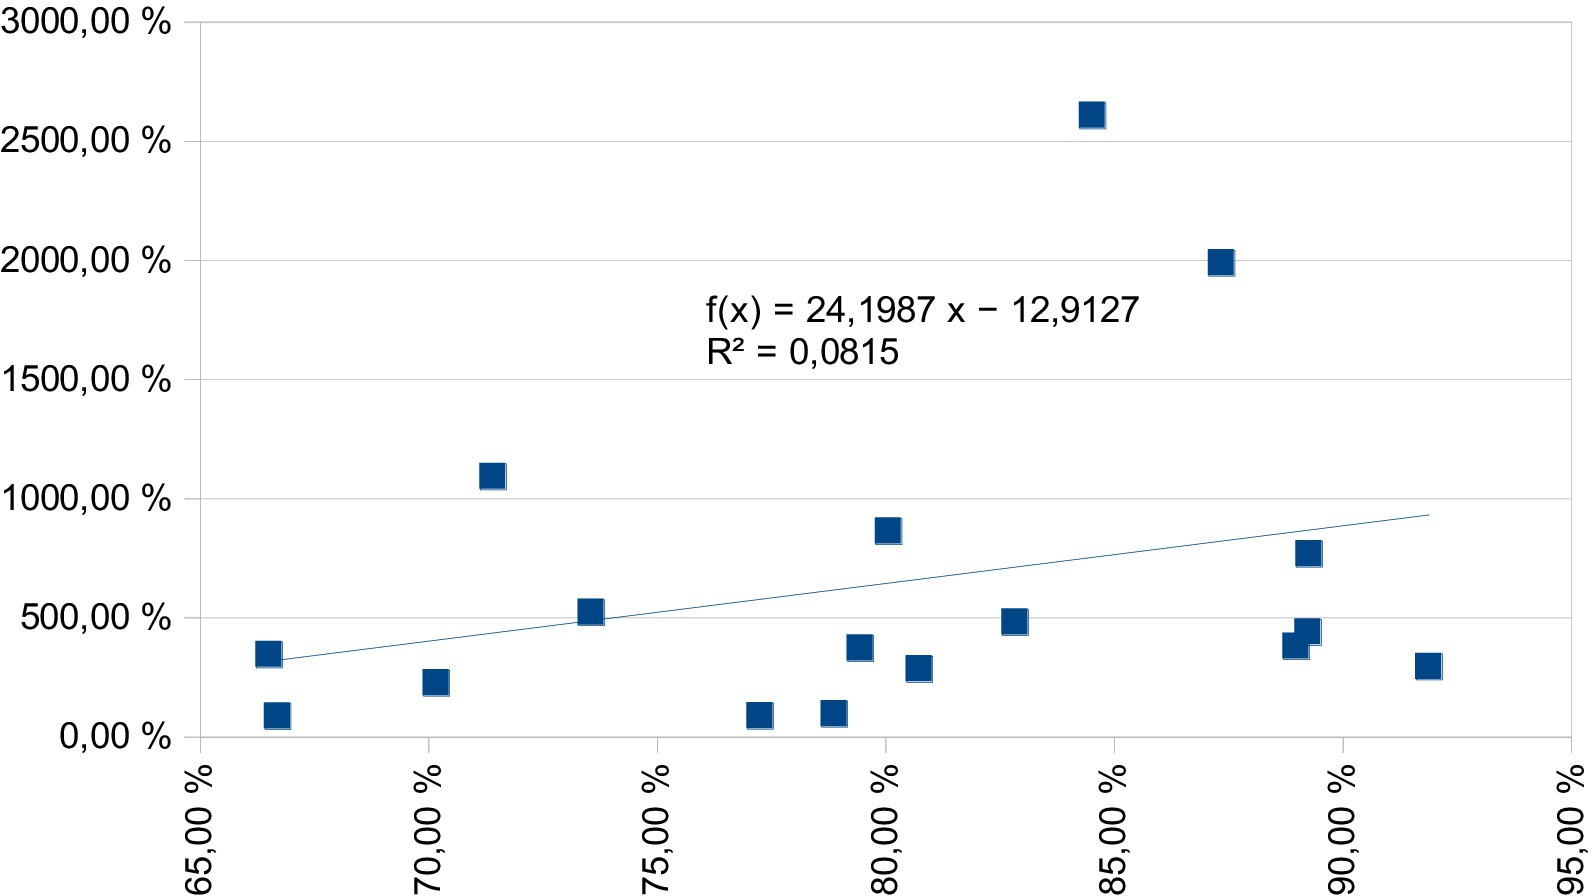
Figure 6. Scattergram of most consistently profit-growing companies (R2 value, x-axis) and change in profits during 2010–2023 (y-axis).
Consistent asset growth seems to repeat development with two earlier measures – consistent growth does not result in an accelerating growth rate in assets (Figure 7). The regression model in Figure 7 has a negative coefficient, and the entire model is nowhere near statistically significant. Explanation of the power of the regression line (R2 value) is next to zero. Even without accelerating asset growth within the observation period, companies in Figure 7 do have average asset growth of 323.6%, which is much higher than the average asset growth in Denmark (114%), Finland (43.8%), or Sweden (70.5%). Furthermore, the second and third highest asset-growing companies are from Figure 7.
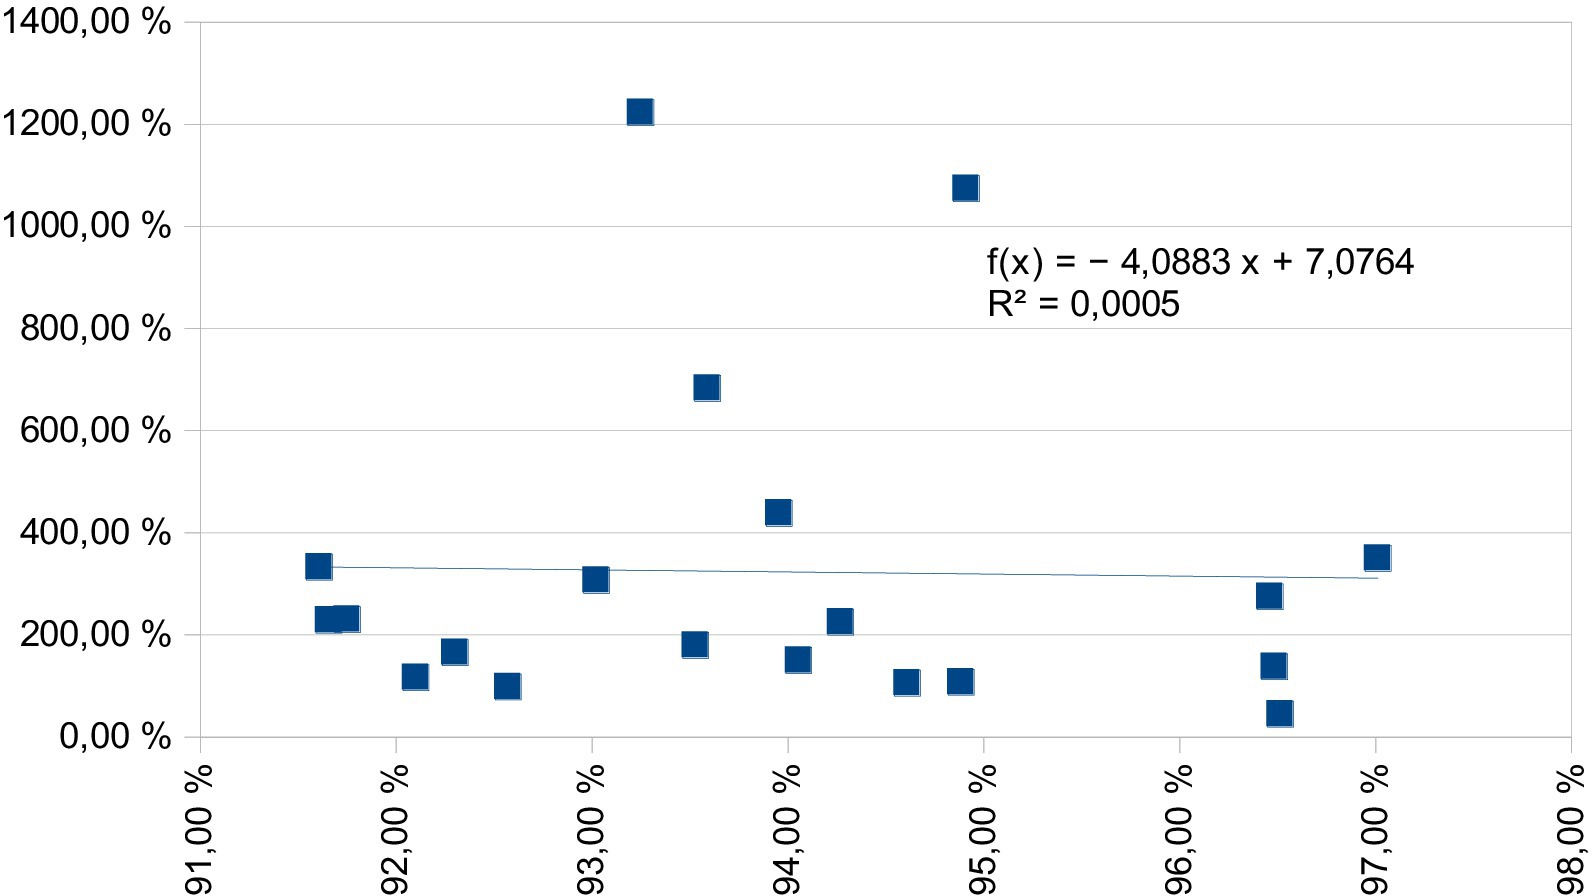
Figure 7. Scattergram of the most consistently asset-growing companies (R2 value, x-axis) and change in assets during 2010–2023 (y-axis).
6 Concluding discussion
Growth is the key to the survival and prosperity of both national economies and their manufacturing companies in the long term. This research examined three different kinds of financially based growth of manufacturing companies in three different Nordic countries. In general, Denmark and Sweden have been able to show growth in all three measures within the observation period, Denmark doing so consistently, and Sweden catching up at the end of the observation period. In the situation of Finland, growth was missing nearly the entire first decade of the observation period. This illustrates the effects of earlier telecommunications sector dominance, and its serious decline faced (e.g., (7, 8)); effects are well identified in this study throughout the publicly listed companies (very few actors from this sector ended as consistent growth companies as one electronics contract manufacturer from Finland and one electronics industry equipment and machinery supplier from Sweden were part of consistent growth companies). However, in the same period, Finland was having serious challenges with the forest industry, and restructuring, revenue decline, and losses were present due to the effects of digitalization and a decrease in demand for writing and reading papers. The conclusion from the consistent growth is similar to that from the country-level average numbers: Denmark and Sweden account for a significant proportion of the most consistently growing companies, while Finland performs the worst. However, there are exceptions to this general observation. The company with the highest consistent revenue growth in the observation period was Finnish, and two Finnish companies were in the top positions for consistent asset growth. Typically, this research identifies high-performing and exceptional Finnish companies, but they are limited in numbers compared to the two other countries.
It is, of course, that Danish success and consistent growth are mostly dependent on the healthcare sector, which was not a predictable growth area before the study observation period (13, 14). As the analysis illustrated, this is not only a matter of pharmaceuticals, but in addition, all kinds of devices and measurements, as well as diagnostics manufacturers, are within the group. In some aspects of consistent growth, it was found that brewery and insulation producers were also showing growth. In comparison, Swedish growth is across a broader range of industries, and it is typically high performing in machinery, metal industry products, and electronics. Swedish companies typically hold consistent growth top positions, followed by others, which are clearly at the top of the lists. They also have the highest number of companies in consistent profit growth. These illustrate the conservative nature of these manufacturers and their desire to have predictable profits. Swedish performance could be the result of higher spending on R&D (1), and being a natural learning point for two other countries (especially Finland, which also has low growth and, unlike pharmaceutical companies, (17)).
By analyzing the financial growth of manufacturing firms in Denmark, Finland, and Sweden, this study bridges a critical gap in existing literature. It extends traditional economic and financial growth theories by incorporating stability as a key growth indicator, emphasizing industry composition as a driver of economic performance, and providing policy insights for fostering resilient manufacturing industries. Future research could build on this foundation by exploring case studies of consistently growing firms and further investigating the mechanisms behind stable financial expansion in high-income economies.
This study makes a valuable contribution to financial growth theories in manufacturing by emphasizing the importance of consistent growth and sector-specific economic performance. Traditional growth theories often assume that increasing profits is the main indicator of financial success. However, this study argues that steady and predictable financial growth is equally important for long-term sustainability. For example, Swedish manufacturing firms have increasingly used Chinese intermediaries to source components and materials (see (23)). This strategy enables them to concentrate on higher-value activities at home while outsourcing lower-cost tasks abroad. As a result, productivity in core operations has improved, contributing to sustained growth. In contrast, Finland has seen fewer of these strategic shifts, with more modest productivity gains.
Calligaris et al. (16) point out that companies need strong knowledge and innovation skills to stay competitive. They found that some firms (like those in Finland) were productive, but still struggled because they could not adapt to changing conditions. The study also highlights the importance of building digital skills and creating systems that make it easier to share knowledge. In addition, the success of many Finnish start-ups shows that new businesses could play a bigger role in improving the country’s economic strength.
Denmark’s case is different again, as its strength lies more in sectoral shifts, particularly in the growth of the healthcare and pharmaceutical sectors, than in structural efficiencies in traditional manufacturing. While Sweden has a strong tradition of innovation and international trade, the relatively slow growth of born global start-ups in its manufacturing sector suggests that digital openness alone does not encourage rapid firm expansion or growth. Compared to Denmark’s more dynamic post-GFC performance (particularly in sectors like healthcare), it seems better positioned for international scaling. Finland’s challenges with consistent growth firms also align with this pattern, suggesting that structural and sector-specific conditions may play a greater role in fostering competitive manufacturing ecosystems than digital infrastructure or trade policies alone. This pattern may partly explain Finland’s weaker performance, as its manufacturing sector lacks a stable base of firms that maintain consistent innovation efforts regardless of macroeconomic conditions (2, 16). However, on the positive side, there are some growth-oriented and high-performing companies in Finland, and the spread of their management practices to other companies could increase performance substantially.
This study contributes to the understanding of how economic resilience and competitiveness are shaped by the interplay between industry specialization, sectoral diversification, and industry adaptability. The findings emphasize that consistent financial growth should be a strategic priority for policymakers.
This study identifies industry specialization as a determinant of long-term financial success, as demonstrated by the pharmaceutical and healthcare sectors. Denmark’s healthcare and pharmaceutical sector has played a pivotal role in its sustained economic expansion, contrasting with Finland’s struggling manufacturing industries, which have faced challenges due to digitalization and global market shifts. These results indicate that a diversified industrial base may be crucial for fostering economic resilience and ensuring long-term financial stability. By examining and comparing national growth models, this study builds on earlier studies by underscoring how government policy, trade dynamics, and targeted sectoral investment influence financial trajectories. The evidence also highlights the importance of industry-level flexibility for sustaining competitiveness. Furthermore, the findings reinforce the argument that both economic policymakers and business leaders should priorities steady, long-term growth over short-term surges.
As further research in this area, it would be interesting to examine manufacturers with consistent growth. The most fruitful aspect could come out of case studies, and particularly in the countries of this research. In addition to this, more understanding of the dynamics and mechanisms of growth is needed, especially in a new environment of deglobalization and geopolitical uncertainty. Future research could usefully compare born global firms with traditional manufacturers to identify business strategies that support long-term success, especially since born global often face challenges in sustaining profitability over time. Another important aspect is the financial impact of digital transformation within Nordic manufacturing. Although technologies such as artificial intelligence, automation, and digital tools are widely regarded as crucial for achieving global competitiveness, little research has explored their direct influence on financial performance.
Data availability statement
Publicly available datasets were analyzed in this study. This data can be found at: data will be available from the authors by request.
Author contributions
O-PH: Validation, Data curation, Methodology, Conceptualization, Writing – original draft, Investigation, Visualization, Funding acquisition, Supervision, Software, Formal analysis, Project administration, Resources, Writing – review & editing. DF: Validation, Writing – review & editing, Supervision, Conceptualization, Writing – original draft, Investigation. PH: Resources, Funding acquisition, Project administration, Writing – review & editing, Supervision, Investigation, Validation, Conceptualization.
Funding
The author(s) declare that financial support was received for the research and/or publication of this article. Authors of this research manuscript hold gratitude for research grant funding of the Knowledge Foundation (Sweden) for the project called” ASSURE: Initial assessment of manufacturing relocation decisions” (20220013-H-01). The main parts of the analyses presented here were completed during the project execution.
Conflict of interest
The authors declare that the research was conducted in the absence of any commercial or financial relationships that could be construed as a potential conflict of interest.
Generative AI statement
The authors declare that no Gen AI was used in the creation of this manuscript.
Publisher’s note
All claims expressed in this article are solely those of the authors and do not necessarily represent those of their affiliated organizations, or those of the publisher, the editors and the reviewers. Any product that may be evaluated in this article, or claim that may be made by its manufacturer, is not guaranteed or endorsed by the publisher.
References
1. Hajighasemi, A, Oghazi, P, Aliyari, S, and Pashkevich, N. The impact of welfare state systems on innovation performance and competitiveness: European country clusters. J Innov Knowl. (2022) 7:100241. doi: 10.1016/j.jik.2022.100241
2. Ahmad, N, and Zhang, X. The cyclical and nonlinear impact of R&D and innovation activities on economic growth in OECD economies: a new perspective. J Knowl Econ. (2023) 14:544–93. doi: 10.1007/s13132-021-00887-7
3. Lasisi, TT, Alola, AA, Muoneke, OB, and Eluwole, KK. The moderating role of environmental-related innovation and technologies in growth-energy utilization nexus in highest-performing eco-innovation economies. Technol Forecast Soc Chang. (2022) 183:121953. doi: 10.1016/j.techfore.2022.121953
4. Schwaag Serger, S., Dachs, B., Kivimaa, P., Lazarevic, D., Lukkarinen, J., and Stenberg, L.. Transformative innovation policy in practice in Austria, Finland and Sweden. (2023). In: OECD Science, Technology and Industry Policy Papers, No. 156.
5. European Commission European innovation scoreboard 2024. (2024). Available online at: https://4front.fi/european-innovation-scoreboard-2024-released-denmark-leads-as-most-innovative-eu-member-state-finland-ranked-as-third/ (Accessed May 8, 2025).
6. Bank of Finland. Market capitalization and turnover of shares in Helsinki Stock exchange. Bank of Finland, Helsinki. (2025). Available online at: https://www.suomenpankki.fi/en/statistics/data-and-charts/securities-statistics/charts/arvopaperit-kuviot-en/kanta_ja_vaihto_chrt_en/ (Accessed January 15, 2025).
7. Elfving, SW, Lindahl, M, and Sundin, E. Ericsson – the history from product to solution provider and challenges and opportunities in an evolving environment. Procedia CIRP. (2015) 30:239–44. doi: 10.1016/j.procir.2015.02.107
8. Lamberg, JA, Lubinaitė, S, Ojala, J, and Tikkanen, H. The curse of agility: the Nokia corporation and the loss of market dominance in mobile phones, 2003–2013. Bus Hist. (2019) 63:574–605. doi: 10.1080/00076791.2019.1593964
9. Sundkvista, R, Hedmana, R, Almströma, P, and Kinnander, A. Improvement potentials in Swedish electronics manufacturing industry – analysis of five case studies. Proc CIRP. (2012) 3:126–31. doi: 10.1016/j.procir.2012.07.023
10. Gilchrist, K. Novo Nordisk market cap surpasses Tesla on new obesity pill trial data. CNBC, 8.March.2024. (2024). Available online at: https://www.cnbc.com/2024/03/08/novo-nordisk-market-cap-surpasses-tesla-on-new-obesity-pill-trial-data.html (Accessed January 15, 2025).
11. IMF. Productivity shocks to the pharmaceutical sector and the Danish economy. Washington, USA: International Monetary Fund (2024).
12. Laursen, K. Horizontal diversification in the Danish national system of innovation: the case of pharmaceuticals. Res Policy. (1996) 25:1121–37. doi: 10.1016/S0048-7333(96)00894-3
13. McKinsey & Company. Danish Manufacturing—winning in the next decade. Denmark, Aarhus/Copenhagen: The Tuborg Research Centre For Globalisation and Firms and McKinsey & Company (2016). 61 p.
14. Perunovic, Z, and Christiansen, TB. Exploring Danish innovative manufacturing performance. Technovation. (2005) 25:1051–8. doi: 10.1016/j.technovation.2004.02.013
15. IMF World Economic Outlook (October 2024). International Monetary Fund (IMF), Washington, USA. (2025). Available online at: https://www.imf.org/external/datamapper/datasets/WEO (Accessed January 13, 2025).
16. Calligaris, S., Jurvanen, O., Lassi, A., Manaresi, F., and Verlhac, R. The slowdown in Finnish productivity growth: Causes and consequences. (2023). In: OECD Science, Technology and Industry Policy Papers, No. 139, OECD Publishing, Paris.
17. Mäki-Fränti, P. Finland struggling to defend its market share in goods exports. Bank of Finland Bulletin (Bank of Finland articles on the economy), 5.July.2024. (2024). Available online at: https://www.bofbulletin.fi/en/2024/3/finland-struggling-to-defend-its-market-share-in-goods-exports/ (Accessed May 12, 2025).
18. Patridge, J EV battery startup Northvolt files for bankruptcy in Sweden. (2025) The Guardian, 12.March.2025. Available online at: https://www.theguardian.com/business/2025/mar/12/ev-battery-startup-northvolt-files-for-bankruptcy-in-sweden (Accessed May 5, 2015).
19. Macalister, T. Saab denied bankruptcy protection. The Guardian. September 8, 2011. (2011). Available online at: https://www.theguardian.com/business/2011/sep/08/saab-denied-bankruptcy-protection (Accessed May 8, 2025).
20. Reed, J. Saab files for bankruptcy after GM veto. Financial Times, December 19, 2011. (2011). Available online at https://www.ft.com/content/11efd28e-2a22-11e1-8f04-00144feabdc0 (Accessed May 8, 2025).
21. Fu, X, Emes, D, and Hou, J. Multinational enterprises and structural transformation in emerging and developing countries: a survey of the literature. Int Bus Rev. (2021) 30:101801. doi: 10.1016/j.ibusrev.2020.101801
22. Brege, S, Nord, T, Brege, H, Holtström, J, and Sjöström, R. The Swedish wood manufacturing sector: findings from a contextually adapted structure-conduct-performance model. Wood Mat Sci Engineer. (2022) 17:878–86. doi: 10.1080/17480272.2021.1969594
23. Lind, D. The China effect on the productivity in Nordic countries. J Finnish Econ Assoc. (2022) 3:798. doi: 10.33358/jfea.126798
24. Braunerhjelm, P, and Halldin, T. Born globals—presence, performance and prospects. Int Bus Rev. (2019) 28:60–73. doi: 10.1016/j.ibusrev.2018.06.001
Appendix A
List of Analyzed Danish, Finnish, and Swedish Publicly Traded Manufacturing Companies (in parentheses, years data included, if not the entire observation period available from 2010–2023)
Denmark (total, 36 companies): ALK-Abelló, Ambu, Aquaporin (2015–2023), Asetek, Bang & Olufsen, Bavarian Nordic, BioPorto, Carlsberg, ChemoMetec, Coloplast, Dantax, Demant, Embla Medical, FLSmidth, Flügger Group, Glunz & Jensen, GN Store Nord, Green Hydrogen Systems (2020–2023), H + H International, Harboes Bryggeri, HusCompagniet (2019–2023), Lundbeck, Nilfisk (2014–2023), NKT, Novo Nordisk, Novozymes, Pandora, Rias, Roblon, Rockwool, Royal Unibrew, Scandinavian Tobacco Group (2011–2023), SKAKO, SP Group, TCM Group (2017–2023), Vestas.
Finland (total, 52 companies): Afarak, Ahlstrom-Munksjö (2010–2020), Anora (2015–2023), Apetit, Aspocomp, Atria, Boreo, Cargotec, Componenta, Elecster, Enedo (2010–2022), Exel, Fiskars, Glaston, Harvia (2017–2023), HKScan, Honka, Huhtamäki, Incap, Kemira, Kempower (2018–2023), Kesla, Kone, Konecranes, Martela, Metso Outotec, Metsä, Neste, Nokia, Nokian Tyres, Olvi, Orion, Outokumpu, Outotec, Ponsse, Raisio, Rapala, Raute, Reka Industrial, Robit, Scanfil (2011–2023), StoraEnso, Suominen, Teleste, Tikkurila (2010–2020), Tulikivi, UPM, Uponor, Uutechnic (2010–2020), Vaisala, Valmet, Wärtsilä.
Sweden (total, 51 companies): AAK, ABB Group, Alfa Laval. Alimak Group. Alleima (2021–2023), AQ Group, Arjo (2016–2023), Arla Plast (2019–2023), Assa Abloy, AstraZeneca, Atlas Copco Group, Autoliv, Balco Group (2013–2023), Beijer Alma, Beijer Ref (2015–2023), Billerud, Cloetta, Concentric, CTT Systems (2016–2023), Dometic, Doro, Duni Group, Electrolux, Electrolux Professional (2019–2023), Epiroc (2018–2023), Ericsson, Essity (2015–2023), Garo (2015–2023), Getinge, Gränges, Holmen, Husqvarna, Kabe Group, Lagercrantz Group, Munters (2016–2023), Mycronic, Nibe Industrier, Nobia, PowerCell (2016–2023), ProfilGruppen, Saab, Sandvik, SCA, Sintercast, SKF, SSAB, Traton (2016–2023), Trelleborg, VitroLife, Volvo, Volvo Car Group (2011–2023).
Keywords: international business, sustainability, manufacturing location, consistency, Denmark, Finland, Sweden
Citation: Hilmola O-P, Fjellström D and Hilletofth P (2025) Analysis of financial growth in manufacturing companies across three Nordic countries. Front. Appl. Math. Stat. 11:1629810. doi: 10.3389/fams.2025.1629810
Edited by:
Said Hamadene, Le Mans Université, FranceReviewed by:
Yu Mu, Stony Brook University, United StatesBatuhan Medetoglu, Mehmet Akif Ersoy University, Türkiye
Copyright © 2025 Hilmola, Fjellström and Hilletofth. This is an open-access article distributed under the terms of the Creative Commons Attribution License (CC BY). The use, distribution or reproduction in other forums is permitted, provided the original author(s) and the copyright owner(s) are credited and that the original publication in this journal is cited, in accordance with accepted academic practice. No use, distribution or reproduction is permitted which does not comply with these terms.
*Correspondence: Olli-Pekka Hilmola, b2xsaS1wZWtrYS5oaWxtb2xhQGhpZy5zZQ==
†ORCID: Olli-Pekka Hilmola, orcid.org/0000-0002-0622-5791
Daniella Fjellström, orcid.org/0000-0002-1666-4317
Per Hilletofth, orcid.org/0000-0002-8305-4412