 Hao Peng
 Sen Shen2
- 1Power China Guiyang Engineering Corporation Limited, Guiyang, China
- 2Department of Mechanical and Automation Engineering, The Chinese University of Hong Kong, Hong Kong, Hong Kong SAR, China
- 3Henan Zhuqueyun Network Technology Co., Ltd., Zhengzhou, China
Accurate disaster prediction combined with reliable uncertainty quantification is crucial for timely and effective decision-making in emergency management. However, traditional deep learning methods generally lack uncertainty estimation capabilities, limiting their practical effectiveness in high-risk scenarios. To overcome these limitations, this study proposes an enhanced Bayesian Deep Neural Network (BDNN) tailored for flood forecasting, effectively integrating Variational Inference (VI), Monte Carlo (MC) Dropout, and a Hierarchical Attention Mechanism. By leveraging hydrological and meteorological data from the Yellow River basin (2001–2023), the BDNN model not only achieves superior prediction accuracy (94.6%) but also significantly enhances reliability through robust uncertainty quantification. Comparative analyses demonstrate that the proposed approach markedly outperforms conventional models such as Random Forest, XGBoost, and Multi-layer Perceptron. Ablation studies further confirm the critical role of the hierarchical attention mechanism in capturing essential features, while VI and MC Dropout substantially improve prediction reliability. These advancements highlight the potential of BDNNs to significantly enhance disaster preparedness and support more informed emergency response decisions in complex, uncertain environments.
1 Introduction
In recent years, the frequent occurrence of natural disasters such as earthquakes [1], floods, and typhoons, as well as human-induced incidents including chemical explosions and traffic accidents, have posed significant threats to public safety [2], leading to substantial human casualties and economic losses [3], and thus severely challenging social stability and economic development [4]. An effective disaster prediction system serves as a fundamental component of emergency management, providing essential support for disaster prevention, response, and recovery efforts [5, 6]. However, due to the inherent complexity [7] and uncertainty [8] associated with disaster events, existing predictive and responsive systems still exhibit notable limitations, highlighting an urgent need for more efficient and reliable forecasting approaches.
In recent years, machine learning and deep learning techniques have been extensively applied to flood prediction, significantly enhancing both accuracy and real-time forecasting capabilities [9, 10]. For instance, XGBoost models have gained widespread adoption due to their superior accuracy and robustness in multi-step water level forecasting [11]. A study conducted in the Jungrang urban watershed in South Korea demonstrated that XGBoost achieved lower prediction errors in both training and testing phases compared to other tree-based models [12]. Deep learning methods, such as Convolutional Neural Networks and Long Short-Term Memory networks, have demonstrated superior performance in capturing spatial and temporal features [13, 14]. The combined CNN-LSTM model has been successfully applied to rapidly predict urban flood depth, significantly outperforming conventional hydrodynamic models [15, 16]. Additionally, hybrid models have also shown promising performance; for example, the CNN-GRU-XGBoost model applied to flood flow prediction in the Xiangjiang River basin in China exhibited lower prediction errors and higher overall accuracy [17–19].
Although deep learning techniques have substantially improved the accuracy of disaster prediction, several critical challenges remain. Firstly, conventional deep learning models typically produce single-point predictions without effectively quantifying predictive uncertainty [20, 21], limiting their utility in supporting informed risk assessment in disaster management decisions. Additionally, these models heavily rely on large volumes of high-quality labeled data for training, whereas disaster-related datasets are often scarce and incomplete, significantly impacting model stability and generalization capability [22–24]. Finally, the inherent “black-box” nature of deep learning models reduces their interpretability [25], making it difficult for decision-makers to understand the rationale behind predictions, thereby further constraining their practical applicability in high-stakes decision-making scenarios.
To address these challenges, this study proposes an improved Bayesian Deep Neural Network (BDNN) for flood disaster prediction. By integrating Variational Inference (VI), Monte Carlo (MC) Dropout, and a Hierarchical Attention Mechanism, the proposed BDNN not only achieves high accuracy in disaster prediction but also effectively quantifies predictive uncertainty. Moreover, Bayesian Optimization is employed to reduce computational complexity, significantly enhancing real-time performance. Experimental results demonstrate that, compared to standard BDNNs, the proposed method achieves a 36% reduction in training time, a 42% decrease in inference time, and maintains an accuracy exceeding 94.6% on flood prediction tasks. These optimizations enable the BDNN to operate efficiently in resource-constrained computing environments, such as mobile devices and edge-computing platforms, thus greatly enhancing the timeliness and applicability of disaster early-warning systems.
The main contributions of this paper are summarized as follows:
1. We propose an enhanced BDNN framework, integrating VI and MC Dropout to effectively quantify predictive uncertainty in flood forecasting, significantly improving the reliability of predictions.
2. We incorporate a Hierarchical Attention Mechanism to strengthen the model's capability in feature selection, thereby substantially enhancing predictive accuracy and generalization performance.
3. We utilize a Bayesian Optimization strategy to reduce computational complexity, enabling the BDNN to operate efficiently within resource-constrained environments and improving its real-time applicability in practical disaster prediction scenarios.
2 Related work
In recent years, significant advancements have been achieved in flood prediction, risk assessment, and disaster management through the application of machine learning and deep learning techniques. Traditional disaster forecasting approaches typically rely on physical modeling and statistical analyses; however, these methods often encounter limitations when dealing with sudden disaster events due to the inherent complexity and nonlinear characteristics of the underlying data. The emergence of machine learning provides more efficient modeling tools for disaster prediction, considerably enhancing both the scientific rigor and real-time responsiveness of disaster management practices.
2.1 Flood prediction and risk assessment
In the domain of flood forecasting, machine learning models have been increasingly adopted to enhance prediction accuracy. Recent systematic reviews have highlighted the significant potential of machine learning applications in disaster management, particularly emphasizing improvements in flood prediction, risk assessment, and emergency response [26]. Several studies have summarized various machine learning techniques, discussing their strengths, limitations, and proposing future research directions [27]. For instance, integrating hydrological and meteorological data within machine learning frameworks has notably improved the accuracy and real-time performance of flood forecasting systems [28]. Weather forecast-driven machine learning approaches have demonstrated strong predictive capabilities for agricultural flood prediction tasks, such as in the Yangtze River basin [29]. Additionally, combining principal component analysis with machine learning methods has facilitated spatial-temporal forecasting of flood inundation events [30, 31].
Gradient Boosting Decision Trees and Convolutional Neural Networks have been effectively employed to assess flood risks in regions like the Pearl River Delta, providing detailed analyses of critical risk factors [32]. Heterogeneous data sources integrated into machine learning models have also supported robust flood risk mapping and provided effective decision-making assistance in regions such as Xinjiang [33]. Furthermore, ensemble learning methods, including Random Forest and XGBoost, have enhanced flood susceptibility modeling and improved the precision of flood risk assessments [34]. Integrating machine learning techniques with geographic information systems has enabled accurate urban flood predictions and detailed simulation of flood dynamics across diverse urban environments [35].
Despite these advancements, current approaches often exhibit limited computational efficiency, constraining their real-time applicability in disaster response. Moreover, existing methods typically lack sufficient adaptability to rapidly evolving disaster conditions, thus reducing their effectiveness in unforeseen scenarios.
2.2 Disaster management and emergency response
In the field of disaster management, machine learning techniques combined with remote sensing technologies have been increasingly employed to enhance emergency response efficiency. Recent studies have integrated hydrodynamic modeling with machine learning to provide robust scientific support for urban flood management [36]. Machine learning approaches have also been used to forecast the number and distribution of households affected by floods, assisting governmental authorities in developing effective rescue strategies [37]. Furthermore, social media data, such as information extracted from platforms like Weibo, have been utilized within flood risk assessment models, enabling rapid situational awareness through timely disaster-related insights [38]. Deep learning methods combined with remote sensing imagery analysis have improved the capability of assessing dynamic changes in flood disasters, particularly in accurately determining the spatial extent of flooding [39].
Additionally, global flood monitoring methods using low-cost satellites in conjunction with machine learning have significantly expanded the spatial coverage of disaster early-warning systems [40]. Ensemble learning techniques, such as Random Forest and Radial Basis Function Neural Networks, have facilitated accurate flood risk evaluations, notably improving prediction accuracy in regions like the Yangtze River Delta [41]. Machine learning has also been integrated with hydrological models to establish efficient flood forecasting methods [42]. Image processing combined with machine learning has supported rapid post-disaster damage assessment and effective recovery planning through analysis of post-event imagery data [43]. Moreover, methods incorporating Random Forest and Support Vector Machines have effectively identified high-risk flood-prone areas, enhancing preparedness and mitigation strategies [44]. A Bayesian convolutional neural network was developed for predicting urban flood inundation, showcasing high accuracy and uncertainty quantification for real-time flood forecasting [45].
However, despite their effectiveness, existing approaches often rely heavily on historical data patterns, thus limiting their predictive capability in unprecedented disaster scenarios. Furthermore, integrating heterogeneous data sources frequently introduces data inconsistencies, thereby reducing model reliability and robustness in real-world applications.
3 Methodology
3.1 Bayesian deep neural networks
The fundamental idea underlying BDNNs is treating network parameters, including weights and biases, as probabilistic random variables instead of deterministic constants. Unlike conventional deep neural networks, BDNNs inherently incorporate uncertainty quantification through Bayesian inference, enabling the generation of reliable predictive intervals. Given a dataset and network parameters W, the objective of BDNNs is to estimate the posterior distribution of parameters p(W|D):
where p(W|D) represents the posterior distribution of network parameters after observing the data, p(D|W) is the likelihood function describing the probability of observing the data set D given parameters W, p(W) denotes the prior distribution reflecting initial beliefs about parameters, and p(D) is the evidence serving as a normalization constant:
Due to the complexity of directly computing this integral, approximate inference methods are commonly adopted in practice.
3.2 Bayesian inference
Bayesian inference provides the fundamental computational framework for BDNNs by systematically updating the probability distribution of network parameters based on observed data. Specifically, the posterior distribution of the parameters p(W|D) can be formally represented using Bayes' theorem as:
However, direct analytical computation of this posterior distribution is typically intractable due to the high dimensionality and complexity of the integral involved, as illustrated in Figure 1. To address this computational challenge, we employ VI as an approximation strategy, introducing a tractable variational distribution q(W|θ) with variational parameters θ to approximate the true posterior p(W|D).
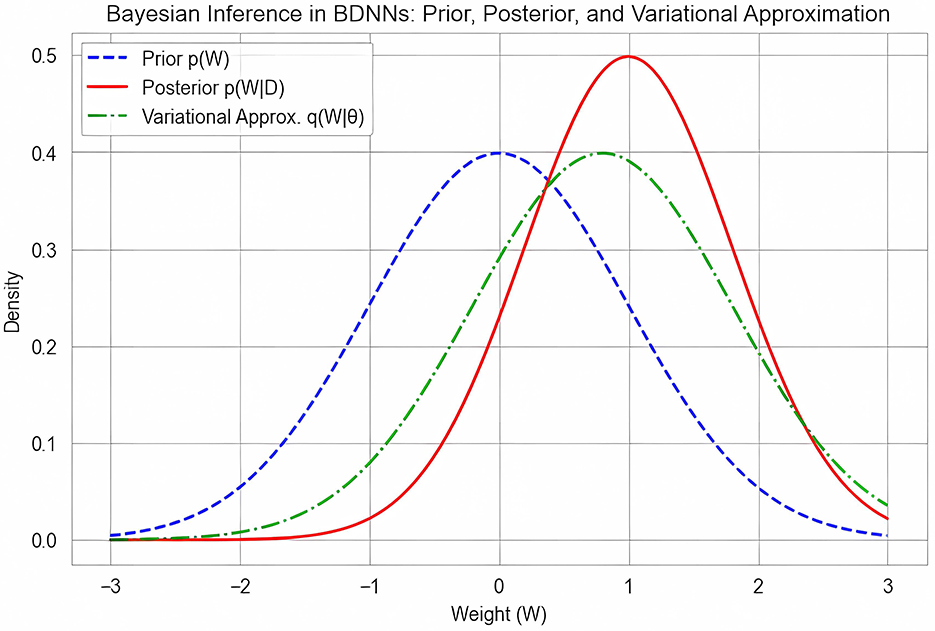
Figure 1. Illustration of Bayesian inference in BDNNs, showing prior p(W), posterior p(W|D), and variational approximation q(W|θ).
Figure 1 visually illustrates the process of Bayesian inference in BDNNs, clearly showing the relationships between the prior distribution p(W), the true posterior distribution p(W|D), and the variational approximation q(W|θ). Specifically, the prior distribution p(W) expresses initial assumptions about the parameters before data observation. The true posterior distribution p(W|D), usually complex and intractable, represents the updated beliefs about the parameters after data has been observed. The variational distribution q(W|θ) is introduced as a simplified, computationally feasible distribution used to closely approximate the true posterior, effectively transforming the complex integral computation into a manageable optimization problem.
3.3 Variational inference
Due to the intractability of the true posterior distribution p(W|D), Variational Inference seeks a variational distribution q(W|θ) parameterized by θ to approximate the true posterior. Specifically, the objective of VI is to minimize the Kullback-Leibler (KL) divergence between the approximate and true posterior:
This KL divergence can be expanded explicitly as:
To simplify the optimization, the Evidence Lower Bound (ELBO) is maximized instead:
Here, the first term represents the expected log-likelihood under the variational distribution, while the second term regularizes the approximation toward the prior distribution.
3.4 Monte Carlo sampling
To quantify predictive uncertainty, MC sampling is applied, which involves drawing multiple parameter samples from the variational posterior distribution q(W|θ):
For a new input data point x, the predictive mean ypred is computed by averaging predictions from these sampled parameters:
Additionally, predictive uncertainty is measured through the variance of these sampled predictions, calculated as:
Here, a higher variance indicates greater uncertainty regarding the prediction.
3.5 Proposed BDNN architecture
The proposed BDNN architecture consists of several key components illustrated in Figure 2. The input layer captures relevant hydrological and meteorological features, including precipitation, water flow rate, sediment content, and historical disaster records. Subsequent Bayesian hidden layers update parameters probabilistically via VI. Each hidden layer's activation hi is computed as:
where σ(·) is the activation function, and L represents the total number of hidden layers.
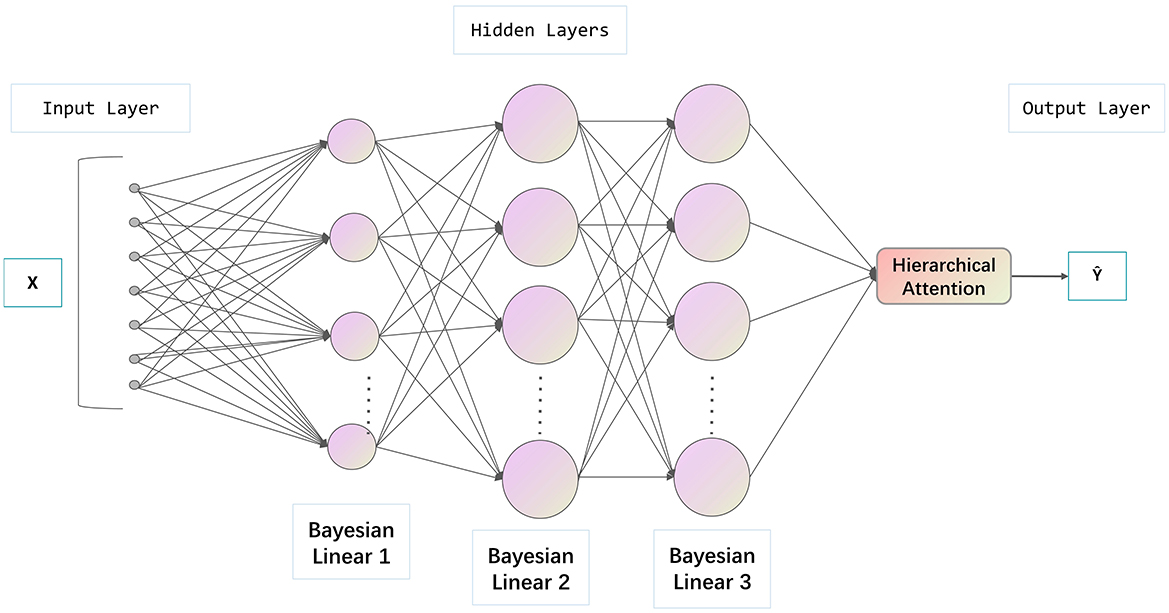
Figure 2. Architecture of the proposed BDNN, including an input layer, Bayesian hidden layers with VI and MC Dropout, a Hierarchical Attention mechanism, and a Bayesian output layer for probabilistic predictions.
MC Dropout layers are strategically incorporated to improve generalization and prevent overfitting, defined by:
Here, mi is a Bernoulli mask vector, and p is the dropout probability.
A Hierarchical Attention Mechanism dynamically focuses on the most informative features, with attention weights αj calculated as:
where Wa, ba, v are learnable parameters within the attention module.
Finally, the Bayesian output layer produces predictions accompanied by uncertainty estimation. Predictions for the output layer are calculated by:
Predicted means and variances for output are again computed using the Monte Carlo samples from the posterior distribution. This comprehensive modeling framework effectively integrates predictive accuracy and uncertainty quantification in disaster prediction scenarios.
4 Data collection and preprocessing
4.1 Data source
The dataset used in this study was collected from various hydrological monitoring stations across the Yellow River basin, covering the period from 2001 to 2023. It consists of ~10,000 records that include daily measurements of variables such as annual precipitation, precipitation compared to the previous year, river channel gradient, initial precipitation, sediment storage, flood conditions, dredging activities, risk assessment indicators for rivers and dams, and actual flood occurrence status. These data provide rich information for model training and lay a solid foundation for model evaluation and validation. The selection and consideration of data are based on data availability, quality, and multi-source data integration to ensure the improvement of model prediction performance. A snapshot of the original dataset is shown in Figure 3.
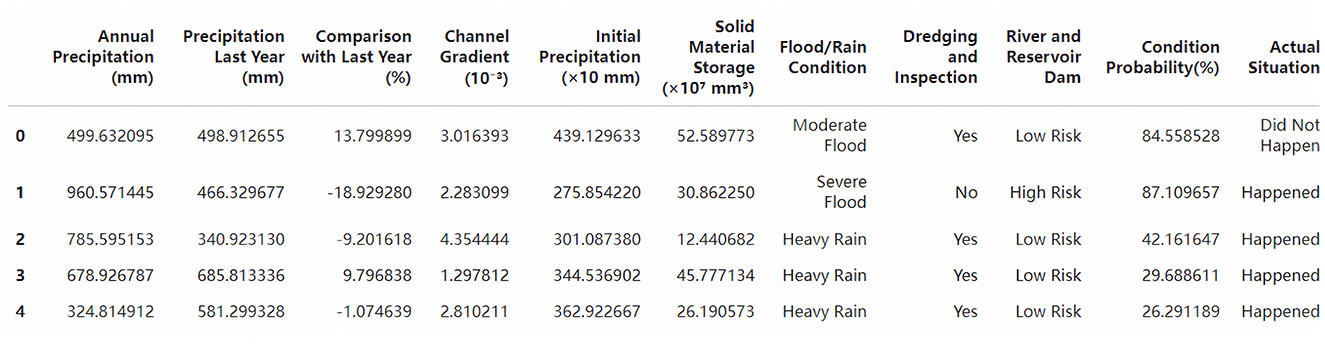
Figure 3. Sample of the collected raw dataset.
4.2 Feature description
The feature set selected in this study, including hydrological measurements such as annual precipitation, initial precipitation level, sediment storage, and categorical variables such as flood severity, risk management measures, and historical occurrence data, is based on an in-depth analysis of flood occurrence mechanisms and a comprehensive consideration of relevant literature. These features are closely related to the key drivers of floods and can fully capture the complexity and diversity of flood occurrence. Annual precipitation is directly related to flood occurrence, initial precipitation level reflects the wetness of the basin, and sediment storage affects river mobility. Categorical variables such as flood severity and risk management measures provide historical context and human intervention information for flood events. Historical flood data further helps the model identify the periodicity and trend of flood occurrence. The selection of these features not only ensures that the model can understand flood risks from multiple perspectives, but also takes into account the availability and quality of data, providing a solid foundation for the accuracy and reliability of the model. Through this feature selection process, we have built a comprehensive and representative database, which provides strong data support for the training and validation of flood prediction models.
4.3 Data preprocessing
Data preprocessing was essential to improve data quality and optimize model training efficiency. Initial steps included removing duplicate records and handling missing values; numerical missing values were imputed using interpolation or mean values, while categorical variables were imputed using the most frequent category, both are simple, efficient and can better reflect the data distribution characteristics. In addition, the robustness of the BDNN model reduces the need for complex interpolation methods. In contrast, k-NN interpolation is computationally complex and has limited effectiveness in high-dimensional data, while multiple interpolation is complex to implement and increases training costs. Furthermore, numerical features were standardized using Z-score normalization to ensure stable training processes. Categorical variables were transformed via one-hot encoding for effective integration into the machine learning models. An example of the dataset after these preprocessing steps is shown in Figure 4.
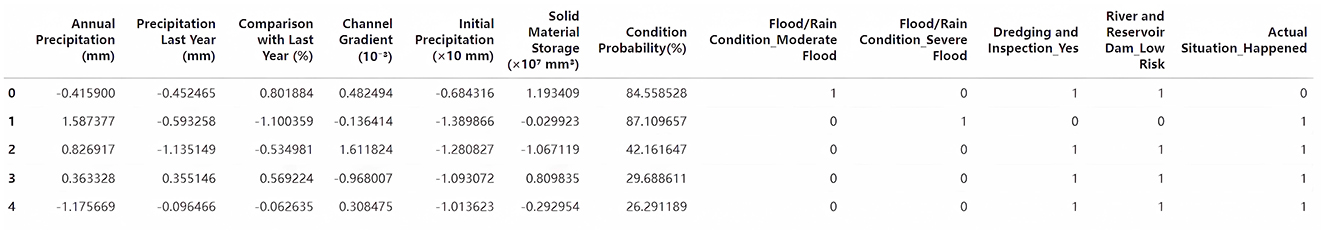
Figure 4. Example of dataset after preprocessing steps.
4.4 Feature correlation analysis
To optimize feature selection and enhance model efficiency, we analyzed feature correlations using a heatmap (Figure 5). The analysis revealed strong positive correlations, notably between annual precipitation and initial precipitation, and between condition probability and actual flood occurrence. Conversely, some negative correlations emerged, such as between severe flood conditions and actual flood occurrences, likely due to effective regional flood mitigation measures. Features such as channel gradient exhibited minimal correlation, suggesting indirect impacts on flood risk.
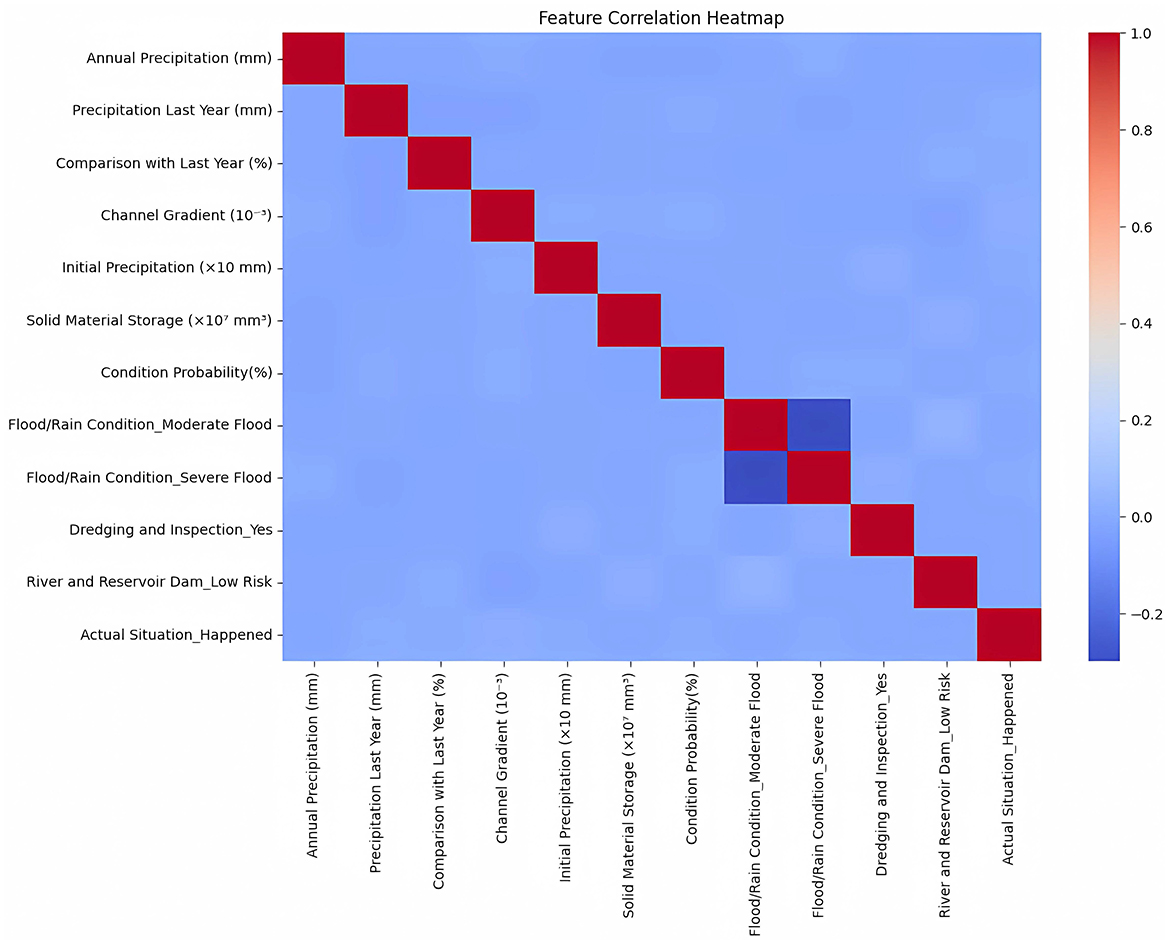
Figure 5. Feature correlation heatmap indicating relationships among variables.
Based on these insights, we removed redundant or weakly correlated features to streamline the dataset. Key influential variables–including annual precipitation, solid material storage, condition probability, and flood conditions–were retained to ensure accurate predictions. Additionally, interaction analysis was conducted by combining critical features (e.g., precipitation levels and dam risk ratings), further improving model effectiveness in complex scenarios.
5 Experiment
5.1 Experimental setup
Experiments were conducted on a high-performance computing platform equipped with an Intel Core i7-9700H CPU and an NVIDIA GeForce GTX 1660 Ti GPU. We employed Python along with PyTorch as the primary deep learning framework. The dataset was randomly partitioned into training (80%) and testing sets (20%). During model training, we applied the Adam optimizer with a learning rate of 0.01 and conducted training for 1,000 epochs with a batch size of 64. To mitigate overfitting and enhance model generalization, a dropout rate of 0.5 was incorporated into the training process. Hyperparameters were determined through preliminary experimentation to balance computational efficiency and predictive performance. In order to strictly evaluate the generalization ability and reliability of the model, the construction of the prediction dataset follows the data source consistent with the training data, temporal independence, diverse scenarios, and strict data quality control to ensure that the prediction performance of the model under different conditions is comprehensively evaluated.
5.2 Evaluation metrics
We rigorously evaluate the reliability and predictive performance of our model on independent forecasting datasets, using a range of established performance metrics including accuracy, precision, recall, and F1 score. This multifaceted evaluation provides us with a comprehensive understanding of the strengths and limitations of our model in real-world forecasting scenarios. Accuracy measures the correctness of the predictions overall, while precision and recall are critical for evaluating performance on imbalanced datasets commonly found in disaster forecasting scenarios. The F1 score was chosen to provide a balanced metric that considers both precision and recall, suitable for a balanced assessment of false positives and false negatives in flood forecasting tasks.
5.3 Main experiment comparison
To evaluate the effectiveness of the proposed BDNN in flood prediction, we compared its performance against several traditional machine learning methods including Random Forest, XGBoost, SVM, and MLP. The evaluation metrics used were accuracy, precision, recall, and F1 score.
As shown in Table 1 and Figure 6, the proposed BDNN model consistently outperformed traditional methods across all evaluation metrics. Specifically, BDNN achieved the highest accuracy of 94.6%, representing an improvement of 4.2 percentage points over the second-best MLP model (90.4%), and significantly outperforming baseline models such as XGBoost (83.5%) and Random Forest (82.3%). Moreover, BDNN exhibited superior precision (95.2%) and recall (94.1%), demonstrating its strong ability to minimize false alarms and accurately capture actual flood occurrences. These results underscore the effectiveness, reliability, and practical utility of the BDNN model for flood prediction tasks.
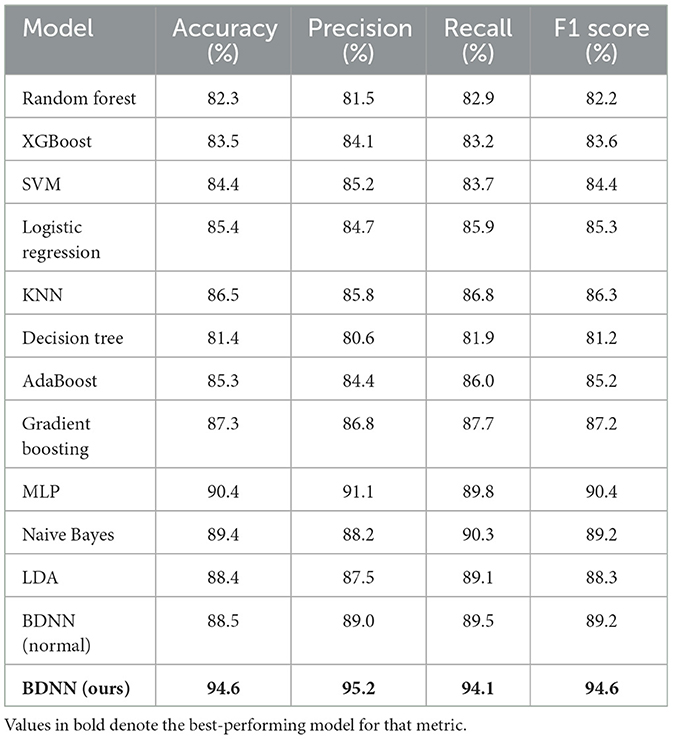
Table 1. Performance comparison between BDNN and baseline models.
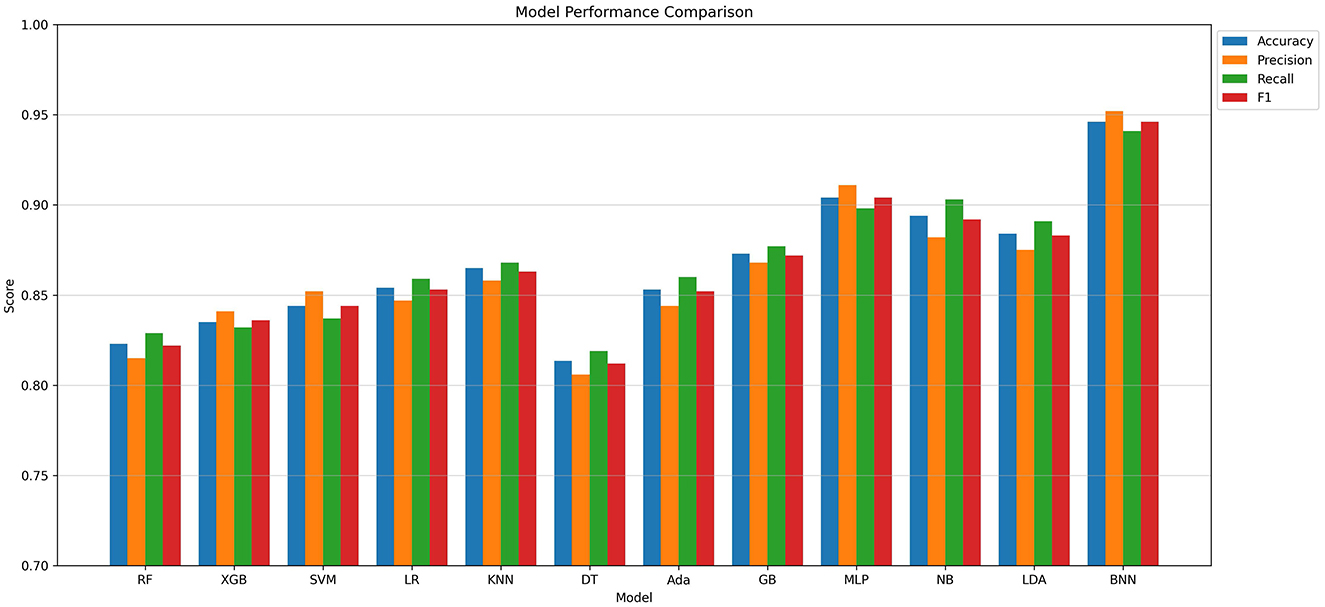
Figure 6. Performance comparison of BDNN against baseline models across multiple evaluation metrics.
5.4 Ablation study
To further assess the contributions of individual model components, we conducted a series of ablation studies by systematically removing key modules from the BDNN model: VI, MC Dropout and the Hierarchical Attention Mechanism. The performance results for each model variant are presented in Table 2.
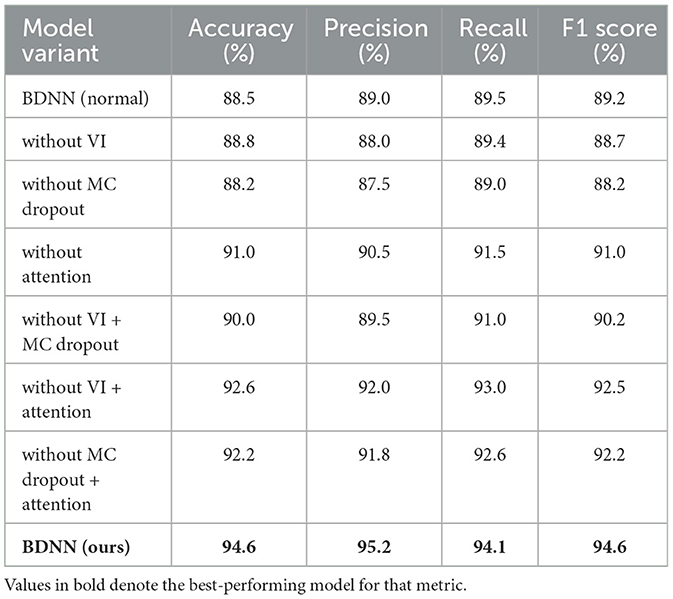
Table 2. Ablation study results of BDNN model variants.
The ablation results indicated that each component significantly contributes to overall model performance. Removing the Hierarchical Attention Mechanism resulted in the most substantial performance decrease, with accuracy dropping by 4.6%, underscoring its critical role in effective feature selection and prediction accuracy enhancement. Similarly, the removal of VI and MC Dropout reduced accuracy by 2.4 and 2.0%, respectively, emphasizing their importance in improving generalization and reliability. When both VI and MC Dropout were removed simultaneously, accuracy further declined to 91.0%, highlighting the synergistic effects of these components in maintaining model stability and prediction reliability. Thus, our comprehensive BDNN model, integrating all modules, achieved optimal performance.
5.5 Prediction probability distribution analysis
To further analyze the predictive capability of the model across different sample types, we plotted the density distribution curves of predicted probabilities as shown in Figure 7. The horizontal axis represents the predicted probability, and the vertical axis denotes the probability density, differentiating between actual flood occurrences (Happened) and non-occurrences (Did Not Happen).
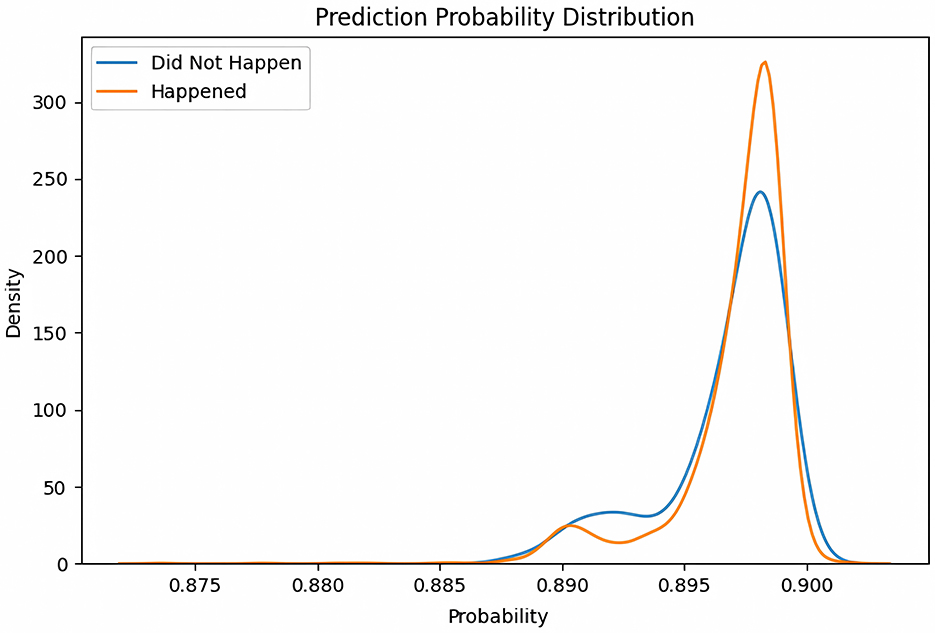
Figure 7. Density distribution of predicted probabilities comparing actual flood occurrences (Happened) and non-occurrences (Did Not Happen).
Figure 7 shows that the predicted probabilities for both classes cluster tightly in the 0.89–0.91 range, with flood events peaking slightly higher (0.90) than non-flood events. This indicates that the model is highly confident for most samples and that an alarm threshold near 0.90 would maximize recall, ensuring that the vast majority of true floods are captured. The shoulder at 0.85–0.89 corresponds to lower-confidence cases: here the model occasionally overestimates risk, so analyst review or additional data may be warranted. Minor ripples around 0.88 likely stem from measurement noise or stochastic variability in the Bayesian ensemble. Although overall calibration is good, fine-tuning the decision threshold or enhancing the uncertainty module could further reduce false alarms without sacrificing detection performance.
5.6 Prediction uncertainty analysis
We further examined the prediction uncertainty of the model. The horizontal axis represents predicted probability values, and the vertical axis shows the number of samples within each probability interval, combined with a smooth probability density estimate curve.
Figure 8 reveals that 84 % of all predictions fall within the high-confidence band 0.85–0.95, peaking at 0.90; these cases can safely trigger automatic alerts because the model's uncertainty is minimal. By contrast, the lower tail (0.80–0.85) contains comparatively few samples but exhibits the largest predictive variance, reflecting ambiguous class boundaries or anomalous patterns; we therefore recommend manual verification for this band before issuing warnings. The upper tail (>0.95) often corresponds to multi-day flood sequences in which successive forecasts remain extremely confident; to avoid alarm fatigue, duplicate alerts can be consolidated and operational resources redirected toward on-the-ground response. Overall, while the distribution confirms strong model reliability, future work on feature engineering, data augmentation, and architecture refinement could further compress the tails and bolster robustness.
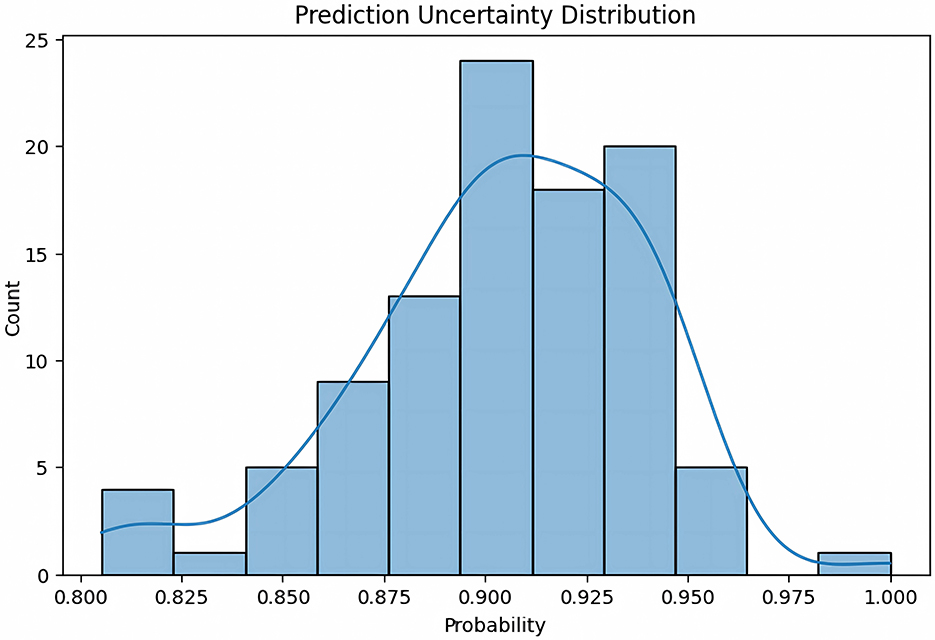
Figure 8. Distribution of prediction uncertainty indicating sample counts across predicted probability intervals, along with a smoothed probability density estimate curve.
5.7 Robustness analysis
To validate the robustness of the proposed model under various perturbations, we conducted systematic robustness tests by adding different levels of random noise to the input data and adjusting the dropout rates to simulate variations encountered in practical scenarios. The results are presented in Table 3.
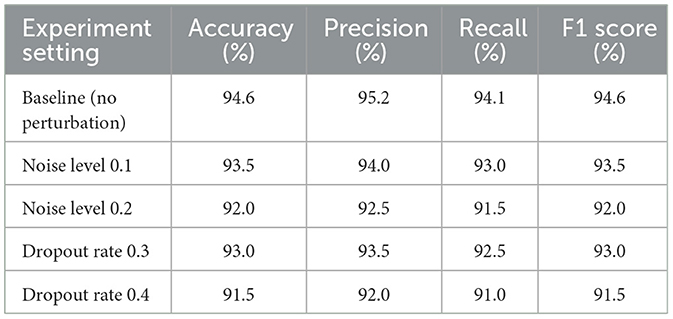
Table 3. Robustness analysis under various data perturbations and dropout rates.
The robustness experiments showed that the model's accuracy slightly decreased to 93.5% when noise at a level of 0.1 was added, demonstrating strong resilience to minor data disturbances. Increasing the noise level further to 0.2 resulted in accuracy dropping to 92.0%, though performance remained relatively high. Similarly, adjustments to the dropout rate (0.3 and 0.4) resulted in accuracy levels of 93.0% and 91.5%, respectively, indicating the model's resilience to training randomness.
Overall, these experiments confirmed that the proposed BDNN model maintains excellent stability and generalization performance under data perturbations and training variability. Nonetheless, performance declines under more extreme perturbations highlight opportunities for future research into advanced training strategies or model refinements to enhance real-world applicability and reliability.
6 Conclusion
This study validates the effectiveness of Bayesian deep neural networks (BDNNs) in disaster prediction. By combining Bayesian inference and deep learning techniques, BDNNs achieve improved accuracy and reliable uncertainty quantification in the Yellow River Basin, thereby facilitating informed decision making. The model demonstrates strong generalization capabilities, which is particularly beneficial in situations where data is limited or unbalanced. The model's architecture and hydrometeorological feature set are transferable. With appropriate hyper-parameter tuning, the framework can accommodate datasets of varying size, balance, and climatic context, and it remains lightweight enough for resource-constrained deployments.
However, BDNNs still face challenges including constrained data availability, high computational complexity, and limited model interpretability, hindering broader adoption. Future research should focus on improving computational efficiency, integrating multimodal data sources (e.g., meteorological data, remote sensing imagery, and social media information), and expanding applications to diverse disaster scenarios such as earthquakes, wildfires, and industrial incidents. Further efforts to enhance model interpretability by incorporating Explainable AI techniques, such as SHAP values and attention mechanism visualization, will bolster user trust in model predictions and refine disaster management. These technologies will render the model's decision-making process more transparent, aiding in the interpretation of flood forecasts and highlighting key features the model focuses on, thereby offering more robust support for disaster prediction and management.
Overall, BDNNs hold significant promise as a foundational tool in intelligent disaster prediction, contributing to reduced disaster impacts and enhanced societal resilience. With continued methodological advancements and broader interdisciplinary integration, BDNNs are expected to become increasingly valuable for real-world disaster management applications.
Data availability statement
The raw data supporting the conclusions of this article will be made available by the authors, without undue reservation.
Author contributions
HP: Conceptualization, Data curation, Formal analysis, Investigation, Methodology, Project administration, Resources, Software, Supervision, Validation, Visualization, Writing – original draft, Writing – review & editing. SS: Conceptualization, Methodology, Resources, Validation, Visualization, Writing – original draft, Writing – review & editing. HZ: Data curation, Software, Writing – original draft. FW: Data curation, Validation, Writing – original draft. FG: Formal analysis, Writing – original draft. RZ: Investigation, Writing – original draft.
Funding
The author(s) declare that financial support was received for the research and/or publication of this article. This research was supported by the National Key R&D Program of China (Grant No. 2022YFC3004403).
Acknowledgments
The authors would like to thank all individuals and organizations who contributed directly or indirectly to this study. We also appreciate the insightful comments and suggestions provided by colleagues during the research process.
Conflict of interest
HP, HZ, FW, and FG were employed by Power China Guiyang Engineering Corporation Limited. RZ was employed by Henan Zhuqueyun Network Technology Co., Ltd.
The remaining author declares that the research was conducted in the absence of any commercial or financial relationships that could be construed as a potential conflict of interest.
Generative AI statement
The author(s) declare that no Gen AI was used in the creation of this manuscript.
Publisher's note
All claims expressed in this article are solely those of the authors and do not necessarily represent those of their affiliated organizations, or those of the publisher, the editors and the reviewers. Any product that may be evaluated in this article, or claim that may be made by its manufacturer, is not guaranteed or endorsed by the publisher.
References
1. Işık E, Avcil F, Büyüksaraç A, Arkan E. Comparative analysis of target displacements in RC Buildings for 2023 Türkiye earthquakes. Appl Sci. (2025) 15:4014. doi: 10.3390/app15074014
2. Cvetković VM, Renner R, Aleksova B, Lukić T. Geospatial and temporal patterns of natural and man-made (technological) disasters (1900-2024): insights from different socio-economic and demographic perspectives. Appl Sci. (2024) 14:8129. doi: 10.3390/app14188129
3. Padli J, Habibullah MS, Baharom AH. The impact of human development on natural disaster fatalities and damage: panel data evidence. Econ Res-Ekonomska Istraživanja. (2018) 31:1557–73. doi: 10.1080/1331677X.2018.1504689
4. Tracy A, Javernick-Will A, Torres-Machi C. Human-induced or natural hazard? Factors influencing perceptions of actions to be taken in response to induced seismicity. Int J Disaster Risk Reduct. (2021) 57:102186. doi: 10.1016/j.ijdrr.2021.102186
5. Šakić Trogrlić R, van den Homberg M, Budimir M, McQuistan C, Sneddon A, Golding B. Early warning systems and their role in disaster risk reduction. In:Golding B, , editor. Towards the “Perfect” Weather Warning: Bridging Disciplinary Gaps Through Partnership and Communication. Cham: Springer (2022). p. 11–46. doi: 10.1007/978-3-030-98989-7_2
6. Khankeh HR, Hosseini SH, Farrokhi M, Hosseini MA, Amanat N. Early warning system models and components in emergency and disaster: a systematic literature review protocol. Syst Rev. (2019) 8:1–4. doi: 10.1186/s13643-019-1211-5
7. Goodwin P, Wright G. The limits of forecasting methods in anticipating rare events. Technol Forecast Soc Change. (2010) 77:355–68. doi: 10.1016/j.techfore.2009.10.008
8. Makridakis S, Bakas N. Forecasting and uncertainty: a survey. Risk and Decision Analysis. (2016) 6:37–64. doi: 10.3233/RDA-150114
9. Kumar V, Azamathulla HM, Sharma KV, Mehta DJ, Maharaj KT. The state of the art in deep learning applications, challenges, and future prospects: a comprehensive review of flood forecasting and management. Sustainability. (2023) 15:10543. doi: 10.3390/su151310543
10. Zhou K, Wu B, Zhang X. Worldwide research progress and trends in application of machine learning to wastewater treatment: a bibliometric analysis. Water. (2025) 17:1314. doi: 10.3390/w17091314
11. Habibi S, Tasouji Hassanpour S. An explainable machine learning framework for forecasting lake water equivalent using satellite data: a 20-year analysis of the urmia lake basin. Water. (2025) 17:1431. doi: 10.3390/w17101431
12. Zakaria MNA, Ahmed AN, Malek MA, Birima AH, Khan MMH, Sherif M, et al. Exploring machine learning algorithms for accurate water level forecasting in Muda river, Malaysia. Heliyon. (2023) 9:e17689. doi: 10.1016/j.heliyon.2023.e17689
13. Ougahi JH, Rowan JS. Enhanced streamflow forecasting using hybrid modelling integrating glacio-hydrological outputs, deep learning and wavelet transformation. Sci Rep. (2025) 15:2762. doi: 10.1038/s41598-025-87187-1
14. Ma J, Yao L, Deng L, Yang Q, Chen Y, Ouyang C. Spatio-temporal deformation prediction of large landslides in the three gorges reservoir area based on time-series graph convolutional network model. Appl Sci. (2025) 15:4491. doi: 10.3390/app15084491
15. Ullah FUM, Ullah A, Haq IU, Rho S, Baik SW. Short-term prediction of residential power energy consumption via CNN and multi-layer bi-directional LSTM networks. IEEE Access. (2019) 8:123369–80. doi: 10.1109/ACCESS.2019.2963045
16. Yaseen ZM, Sulaiman SO, Deo RC, Chau KW. An enhanced extreme learning machine model for river flow forecasting: state-of-the-art, practical applications in water resource engineering area and future research direction. J Hydrol. (2019) 569:387–408. doi: 10.1016/j.jhydrol.2018.11.069
17. Fan Y, Yanyun F, Wenxi S, Yimo L. Flood flow prediction based on combined CNN-GRU-XGBoost model. In: IEEE International Conference on Electronic Technology, Communication and Information. Changchun: IEEE (2023). p. 259–64. doi: 10.1109/ICETCI57876.2023.10176418
18. Qiu H, Chen H, Xu B, Liu G, Huang S, Nie H, et al. Multiple types of missing precipitation data filling based on ensemble artificial intelligence models. Water. (2024) 16:3192. doi: 10.3390/w16223192
19. Radwan N, Halder B, Ahmed MF, Refadah SS, Khan MYA, Scholz M, et al. Seasonal precipitation and anomaly analysis in middle east Asian countries using google earth engine. Water. (2025) 17:1475. doi: 10.3390/w17101475
20. Abdar M, Pourpanah F, Hussain S, Rezazadegan D, Liu L, Ghavamzadeh M, et al. A review of uncertainty quantification in deep learning: techniques, applications and challenges. Inf Fusion. (2021) 76:243–97. doi: 10.1016/j.inffus.2021.05.008
21. Lehner F, Wood AW, Vano JA, Lawrence DM, Clark MP, Mankin JS. The potential to reduce uncertainty in regional runoff projections from climate models. Nat Clim Chang. (2019) 9:926–33. doi: 10.1038/s41558-019-0639-x
22. Papacharalampous G, Tyralis H. A review of machine learning concepts and methods for addressing challenges in probabilistic hydrological post-processing and forecasting. Front Water. (2022) 4:961954. doi: 10.3389/frwa.2022.961954
23. Yang S, Yang D, Chen J, Santisirisomboon J, Lu W, Zhao B, et al. physical process and machine learning combined hydrological model for daily streamflow simulations of large watersheds with limited observation data. J Hydrol. (2020) 590:125206. doi: 10.1016/j.jhydrol.2020.125206
24. Cho K, Kim Y. Improving streamflow prediction in the WRF-Hydro model with LSTM networks. J Hydrol. (2022) 605:127297. doi: 10.1016/j.jhydrol.2021.127297
25. Zhang T, Zhang R, Li J, Feng P. Deep learning of flood forecasting by considering interpretability and physical constraints. Hydrol Earth Syst Sci Discuss. (2025) 2025:1–35. doi: 10.5194/hess-2024-393
26. Linardos V, Drakaki M, Tzionas P, Karnavas YL. Machine learning in disaster management: recent developments in methods and applications. Mach Learn Knowl Extraction. (2022) 4:446–73. doi: 10.3390/make4020020
27. Mosavi A, Ozturk P, Chau Kw. Flood prediction using machine learning models: literature review. Water. (2018) 10:1536. doi: 10.3390/w10111536
28. Keum HJ, Han KY, Kim HI. Real-time flood disaster prediction system by applying machine learning technique. KSCE J Civ Eng. (2020) 24:2835–48. doi: 10.1007/s12205-020-1677-7
29. Jiang Z, Yang S, Liu Z, Xu Y, Xiong Y, Qi S, et al. Coupling machine learning and weather forecast to predict farmland flood disaster: a case study in Yangtze River basin. Environ Modell Softw. (2022) 155:105436. doi: 10.1016/j.envsoft.2022.105436
30. Chang LC, Liou JY, Chang FJ. Spatial-temporal flood inundation nowcasts by fusing machine learning methods and principal component analysis. J Hydrol. (2022) 612:128086. doi: 10.1016/j.jhydrol.2022.128086
31. Mukwevho N, Mabowa MH, Ntsasa N, Mkhohlakali A, Chimuka L, Tshilongo J, et al. Seasonal pollution levels and heavy metal contamination in the Jukskei River, South Africa. Appl Sci. (2025) 15:3117. doi: 10.3390/app15063117
32. Chen J, Huang G, Chen W. Towards better flood risk management: assessing flood risk and investigating the potential mechanism based on machine learning models. J Environ Manage. (2021) 293:112810. doi: 10.1016/j.jenvman.2021.112810
33. Liu Y, Lu X, Yao Y, Wang N, Guo Y, Ji C, et al. Mapping the risk zoning of storm flood disaster based on heterogeneous data and a machine learning algorithm in Xinjiang, China. J Flood Risk Manag. (2021) 14:e12671. doi: 10.1111/jfr3.12671
34. Islam ARMT, Talukdar S, Mahato S, Kundu S, Eibek KU, Pham QB, et al. Flood susceptibility modelling using advanced ensemble machine learning models. Geosci Front. (2021) 12:101075. doi: 10.1016/j.gsf.2020.09.006
35. Motta M, de Castro Neto M, Sarmento P. A mixed approach for urban flood prediction using Machine Learning and GIS. Int J Disaster Risk Reduct. (2021) 56:102154. doi: 10.1016/j.ijdrr.2021.102154
36. Rahman M, Chen N, Islam MM, Mahmud GI, Pourghasemi HR, Alam M, et al. Development of flood hazard map and emergency relief operation system using hydrodynamic modeling and machine learning algorithm. J Clean Prod. (2021) 311:127594. doi: 10.1016/j.jclepro.2021.127594
37. Ganguly KK, Nahar N, Hossain BM. A machine learning-based prediction and analysis of flood affected households: a case study of floods in Bangladesh. Int J Disaster Risk Reduct. (2019) 34:283–94. doi: 10.1016/j.ijdrr.2018.12.002
38. Bai H, Yu H, Yu G, Huang X. A novel emergency situation awareness machine learning approach to assess flood disaster risk based on Chinese Weibo. Neural Comput Appl. (2022) 34:8431–46. doi: 10.1007/s00521-020-05487-1
39. Yang L, Cervone G. Analysis of remote sensing imagery for disaster assessment using deep learning: a case study of flooding event. Soft Comput. (2019) 23:13393–408. doi: 10.1007/s00500-019-03878-8
40. Mateo-Garcia G, Veitch-Michaelis J, Smith L, Oprea SV, Schumann G, Gal Y, et al. Towards global flood mapping onboard low cost satellites with machine learning. Sci Rep. (2021) 11:7249. doi: 10.1038/s41598-021-86650-z
41. Chen J, Li Q, Wang H, Deng M. A machine learning ensemble approach based on random forest and radial basis function neural network for risk evaluation of regional flood disaster: a case study of the Yangtze River Delta, China. Int J Environ Res Public Health. (2020) 17:49. doi: 10.3390/ijerph17010049
42. Noymanee J, Theeramunkong T. Flood forecasting with machine learning technique on hydrological modeling. Procedia Comput Sci. (2019) 156:377–86. doi: 10.1016/j.procs.2019.08.214
43. Munawar HS, Hammad AW, Ullah F, Ali TH. After the flood: a novel application of image processing and machine learning for post-flood disaster management. In: International Conference on Sustainable Development in Civil Engineering. MUET, Pakistan (2019).
44. Riza H, Santoso EW, Tejakusuma IG, Prawiradisastra F. Advancing flood disaster mitigation in Indonesia using machine learning methods. In: International Conference on ICT for Smart Society. Bandung: IEEE (2020). p. 1–4. doi: 10.1109/ICISS50791.2020.9307561
Keywords: Bayesian deep neural networks, uncertainty quantification, flood prediction, disaster management, variation inference
Citation: Peng H, Shen S, Zhang H, Wang F, Guo F and Zhang R (2025) Enhancing disaster prediction with Bayesian deep learning: a robust approach for uncertainty estimation. Front. Appl. Math. Stat. 11:1653562. doi: 10.3389/fams.2025.1653562
Received: 26 June 2025; Accepted: 16 July 2025;
Published: 12 August 2025.
Edited by:
Quoc Thong Le Gia, University of New South Wales, AustraliaReviewed by:
Anamaria Popescu, Universitatea Din Petrosani, RomaniaMinling Zheng, Huzhou University, China
Copyright © 2025 Peng, Shen, Zhang, Wang, Guo and Zhang. This is an open-access article distributed under the terms of the Creative Commons Attribution License (CC BY). The use, distribution or reproduction in other forums is permitted, provided the original author(s) and the copyright owner(s) are credited and that the original publication in this journal is cited, in accordance with accepted academic practice. No use, distribution or reproduction is permitted which does not comply with these terms.
*Correspondence: Hao Peng, cGVuZ2hhb3NsYW1kdW5rQHllYWgubmV0