- University Department of Statistics and Computer Applications, T. M. Bhagalpur University, Bhagalpur, India
Software reliability analysis is vital for evaluating software quality, where reliability is the probability of failure operation of a system for a specified duration. Numerous SRGMs have been proposed, mainly based on the NHPP to enhance the reliability of software product. A key aspect of software reliability modeling involves the FDP and FCP, both of which are vital for understanding and predicting software performance. These models have evolved to consider dependencies between FD and FC, time delay effects, and testing effort consumption, thereby refining predictions and providing robust reliability estimates. In this paper, we first provide a comprehensive review of the last four decades of research on software reliability modeling, focusing on methods proposed for predicting software reliability through FDP and FCP. We then present the FDP and FCP for imperfect debugging considering BTXTEF. Two specific paired FDP and FCP models are proposed with BTXTEF. The proposed SRGM with BTXTEF contains some undetermined parameters. We use PSO to optimize these parameters on an actual dataset rather than using traditional estimation methods. We compare the performance of the proposed SRGM model, in relation to other existing models from the literature. The results reveal that the proposed SRGM with BTXTEF for FDP and FCP is highly effective and outperforms existing models.
1 Introduction
Software reliability (SR) analysis plays a vital role in evaluating software (s/w) quality. It helps in identifying potential weaknesses in software systems and ensures that reliability standards are met before release. SR may be explained as the probability that s/w will function reliably over a defined period [1, 2]. During the previous four decades, several software reliability growth models (SRGMs) have been established for non-homogeneous Poisson process (NHPP) framework [1–4]. Such models facilitate significant insights for effective decision-making, including: (i) Cost analysis [5–7, 77], (ii) Testing resource/effort consumption [8–19, 78], (iii) Optimum release time determination [20], and (iv) Change point perspective [21, 22]; etc.
Another important factor in decision-making is the duration needed for fault correction (FC) [23, 24]. Delays in fault correction can lead to higher costs and risks, impacting the reliability of the s/w system. Efficient fault correction modeling helps in optimizing resources and minimizing the impact of errors on the development process. This has led to increasing attention from researchers in modeling both fault detection process (FDP) and fault correction process (FCP). Such models aim to provide more comprehensive insights into software testing by incorporating additional information and increase the accuracy of SR assessments [25, 26].
Most previous studies have estimated the parameters of fault detection (FD) and FC along with the testing effort function (TEF) using traditional statistical techniques [20, 27, 80]. These approaches often rely on various assumptions or transformations to apply traditional estimation methods to the original software failure data. However, in real-world scenarios, failure models are potentially shaped by factors such as testing strategies, operational conditions, and testing resource allocation. As a result, satisfying these assumptions becomes challenging in practical applications. Therefore, Soft computing techniques, which typically do not require additional assumptions, offer an alternative approach. This paper employs the Particle Swarm Optimization (PSO) algorithm to enhance the parameters of the SRGM, considering FD, FC, and the TEF. It focuses on modeling the FDP and FCP as integral components of software reliability assessment. The paper reviews FDP and FCP, SRGMs based on NHPP, various fault detection rates, mathematical models of FDP and FCP, diverse testing effort functions, and time-delay distributions, all of which include mean value functions. Furthermore, it discusses the methods for estimating parameters related to FDP and FCP.
The rest of the paper is organized as follows: in Section 2, the related works of the past are presented. Section 3 explains the methodology of NHPP-based SRGMs, modeling of FDP and FCP with time delay, and proposed paired models of FDP and FCP with Burr Type X and estimation methods. Section 4 provides an illustrative example based on real data. The conclusion and future works are presented in Section 5.
2 Related works
SRGMs are essential tools for predicting and evaluating various reliability metrics. These models are essential for ensuring consistent software performance and minimizing failures over time. The ability to model both the FD and FC processes has significantly advanced SR research. This section presents an in-depth review of key contributions in modeling these processes. A clear understanding of the interaction between FDP and FCP is vital for enhancing software quality, reducing downtime, and optimizing release schedules.
Schneidewind [28] introduced the foundational concept of modeling the FDP and also proposed a model for the FCP with a constant time lag. This approach was later expanded by Xie and Zhao [29], who replaced the fixed time lag with a time-variable defer function, making the model continuous. This refinement facilitated a more realistic depiction of fault correction over time. Subsequently, Schneidewind [30] extended his work by developing a fault correction model that considered time defer as a stochastic variable that exhibits exponential behavior in its distribution. Further, Lo [31], and Lo and Huang [32] introduced a common plan for modeling both FDP and FCP in software systems. Their framework was able to encompass various existing SRGMs, making it versatile and widely applicable. Wu et al. [33, 34] explored methods to address time dependencies between the FD and FC processes, an area that had been somewhat overlooked in earlier models. Xie et al. [24] introduced additional approaches to modeling both the FDP and FCP, offering solutions that were easy to implement in practical applications. Their analysis of software release time decisions incorporated both FD and FC models, ensuring a balanced approach to releasing reliable software. The novel concept of recurrent neural networks was used by Hu et al. [35] to design the FDP and FCP together, marking a shift toward more advanced computational methods in software reliability modeling. In 2008, Lo proposed further improvements to SRGMs by addressing some of the unrealistic assumptions present in earlier models. He developed a more comprehensive framework for modeling the FDP and FCP, which offered greater accuracy, precise assessments and adaptability. Shu et al. [36] modeled the association between corrected faults and detected faults using their ratio and analyzed the dependency between the FDP and FCP by assessing the number of faults involved.
Wu et al. [37] introduced dual SRGMs that consider the prediction of the inclusion of repeated faults as well as the exclusion of repeated faults. Shu et al. [38] extended his previous work by examining the dependency between FDP and FCP using two approaches. In order to reflect the knowledge that the testing team has gained, Kapur et al. [39] developed a general SRGM that included various learning functions. A Markovian SRGM that considered the FCP was introduced by Jia et al. [40]. By employing Markov processes, Jia et al. provided a structured approach for analyzing the fault correction dynamics over time. In order to investigate the consequences of imperfect debugging and present a comparison with perfect debugging, Lin [41] used a “single-queue multichannel queuing model” to simulate both the FD and FC processes. A new SRGM model that acknowledged error dependencies between various error types and integrated correction time lags between FD and FC was presented by Rafi and Akhtar [42].
Peng et al. [25, 27] introduced TEF with a fault introduction into the FDP, subsequently developing the FCP as a delayed FDP with correction effort. By varying the preconditions regarding fault introduction and FC effort they derived some paired FDP and FCP models. Liu et al. [43] developed a plan for modeling fault removal in SR using “semi-grouped” data, extending this framework to multi-release software. Wang et al. [79] introduced an algorithm for parameter estimation based on a Bayesian framework for both the FDP and the combined FD and FC processes. A new method for SRGM was presented by Chatterjee and Shukla [44], who used the Weibull curve to represent the fault reduction factor. For transient FD and FC Chen and Chen [45] suggested a “redundant execution programming model” based on s/w. Imam et al. [26] investigated how FD and FC processes were influenced of testing by the testing resource allocation using Log-logistic TEF. Further, Imam et al. [46] proposed an NHPP-based SRGM incorporating FD and FC processes with Burr Type XII testing effort.
In contrast to the conventional NHPP, Liu et al. [47] investigated an SR model framework that integrated data from the FD and FC processes using a Markov model. Further, to improve modeling and increase the accuracy of time-delayed FD and FC processes, Liu et al. [48] recommended using semi-grouped datasets in SRGMs rather than traditional grouped datasets. An SRGM was proposed by Kumar et al. [49] to address the difficulties associated with software development for multiple releases. Wang et al. [50] presented a modeling framework to investigate the temporal interdependence between FD and FC processes during the early testing phase or with small datasets. Additionally, a fault correction time delay model for multi-release software was developed by Yang et al. [51]. Zhang et al. [16] integrated TEF into NHPP-based SRGMs and used a multivariate bathtub-shaped FD rate to increase the efficiency of the model. In order to capture the relationship between FD and FC times, Okamura and Dohi [52] proposed a new model based on hyper-Erlang distributions and presented a generalized framework for modeling FD and FC processes. To get around the drawbacks of conventional analytical models, Liu [81] developed a simulation-based method for modeling FDP and FCP concurrently. Peng and Zhai [53] introduced a number of pair models that take fault dependency into account when modeling FDP and FCP in order to address the debugging lags between FD and FC. Additionally, Peng et al. [54] concentrated on paired fault detection and correction models, offering five methods that addressed variables such as fault classification, testing effort, fault introduction, dependency, and multi-release software.
A novel NHPP-based SR model that takes into consideration different two-phase debugging procedures as well as fault dependency and imperfect fault removal was introduced by Zhu and Pham [55]. An SRGM was created by Kumar and Gupta [56] to methodically handle the problems of determining the ideal software release time in the face of uncertainties. A reliability model that takes into account fault introduction during detection and correction as well as delays in fault removal was presented by Pachauri et al. [57]. In order to address imperfect debugging, change points, and error generation in testing, Saraf and Iqbal [58] presented a biphasic SR model. In a different study, Saraf and Iqbal [59] expanded the multi-release model to account for realistic situations, such as time lags between FD and FC and parameter changes brought on by variables like tester efficiency and learning. Choudhary et al. [60] addressed the intricacies of FD and FC by taking them into consideration independently and presented a unified framework for TEF-based SRGMs to maximize software launch time by minimizing total lifecycle costs. An NHPP-based framework for multi-release SR models that take into account two-stage FD and FC processes was covered by Saraf et al. [61]. In order to overcome the drawbacks of analytical models, Xiao et al. [62] presented a stepwise prediction model that models FDP and FCP using artificial neural networks (ANNs) without depending on particular assumptions. Both FDP and FCP are included in the generalized testing coverage framework for SR modeling put forth by Li and Pham [63], which places more emphasis on fault amount dependency than time dependency. An NHPP-based SR model that combines FD and FC processes was presented by Li and Pham [64]. It emphasizes dependencies between fault amounts rather than time delay. Tiwary and Sharma [65] proposed an SRGM to analyze FD and FC under imperfect debugging, accounting for the appearance of new faults during the removal of complex issues. Using the fault-counting data that is already available, Minmino et al. [66] proposed a method to evaluate the efficacy of FC operations without the need for additional, expensive data collection. Using intensity functions that are obtained from inflection S-shaped and delayed S-shaped SRGMs, the thinning method is applied to produce fault detection time samples. In order to predict the reliability of multi-release Open Source Software (OSS), Saraf et al. [67] proposed an SRGM framework that uses three distinct reliability models. For the stepwise prediction of FD and FC, Raamesh et al. [68] presented a hybrid LSTM-based model in conjunction with the BSO-LAHC algorithm. A generalized SR model was proposed by Xie et al. [69] that allows the use of arbitrary distributions and takes into account heterogeneous faults with fault-specific parameters for detection time and correction delay.
3 Methodology
3.1 SRGMs based on NHPP
Let {N(t), t ≥ 0} represent a counting process that shows the total number of faults detected by time t and let m(t) represent the mean value function (MVF), which shows the expected number of faults discovered in the interval (0, t). The counting process of the NHPP is given as:
where λ(t) denotes the failure intensity at testing time t and
Thus, under certain assumptions, an NHPP based SRGM with MVF on m(t) can be expressed as Lyu [1], Musa et al. [2], Ohba [3], and Pham [70]:
By solving the aforementioned equation under the preconditions, m(t) is determined as:
where a is the expected number of faults to be identified at the end [i.e., m(∞) = a)] and d(t) is the FD rate. Different SRGMs are derived from different d(t). For example, when d(t) = r then the MVF is the G–O model [4] given by m(t) = a[1−e−rt]; when then the MVF is the delayed S-shaped model [7] given by m(t) = a[1−(1+rt)e(−rt)]; and when then MVF is inflected S-shaped model [3] given by , where c is the inflection factor/ rate.
3.2 Modeling of FDP and FCP
In this sub-section, SR model incorporating both the FD and FC processes is presented. The MVF of FDP, md(t) and FCP, mc(t), can be represented by the differential equations listed below [32]:
Different SRGMs of FDP and FCP were derived from the above differential equations for different ψ(t) & φ(t). For example, when ψ(t) = φ(t) = r then the MVF is given by and ; and when ψ(t) = r & φ(t) = u, then the MVF is given by and .
3.3 Modeling of FDP and FCP with time delay
In this sub-section, SR model considering both the FD and FC processes with time delay is presented. The MVF of FDP md(t) satisfies [34, 51]
The FCP model can be defined using the MVF, mc(t). The MVF of FCP models can be obtained from λd(t), and the time delay Δt as follow
Consider, the MVF as Goel and Okumoto [4]
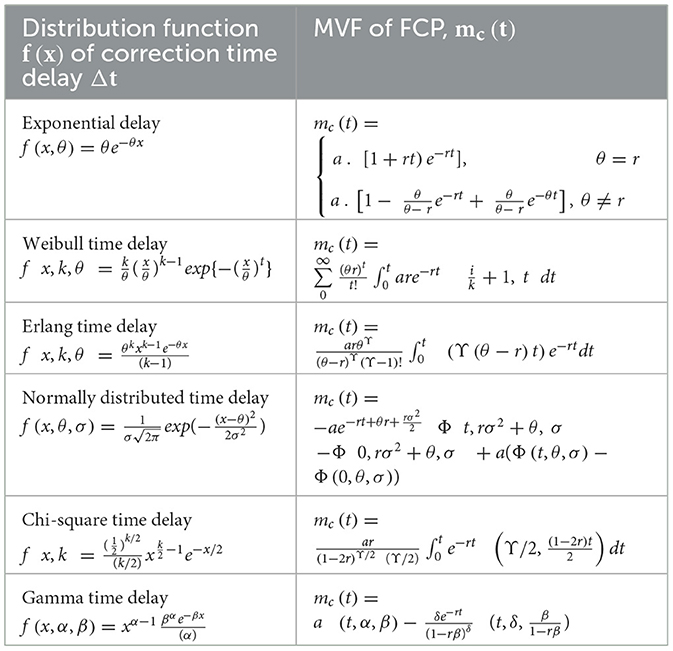
Then, for the constant fault correction time delay [i.e., Δ(t) = Δ], the MVF of FCP is ; for the time-dependent fault correction time delay, the MVF of FCP is ; and If the fault correction time delay is a random variable following a probability distribution, the MVF of FCP, mc(t), along with the corresponding correction time delay distribution, is presented in Table 1.
The function, a(t), is the fault content rate, that quantifies the expected cumulative number of faults at a given time t. The number of detected faults during the interval [t, t+Δt) is considered to be proportional to the current testing effort consumption, x(t), as well as the number of faults left at time t. Based on the assumption, the following differential equation [25, 27] represents the SRGM as:
where, the current or cumulative testing effort consumption is denoted by x(t) or X(t), respectively, and the FD rate per unit testing effort at time t is denoted by d(t). Note that if d(t) = r and a(t) = a, then the solution to the Equation 10 is:
Under the starting state md(0) = 0, the MVF of the FDP models with testing effort can be derived from the above differential equation as:
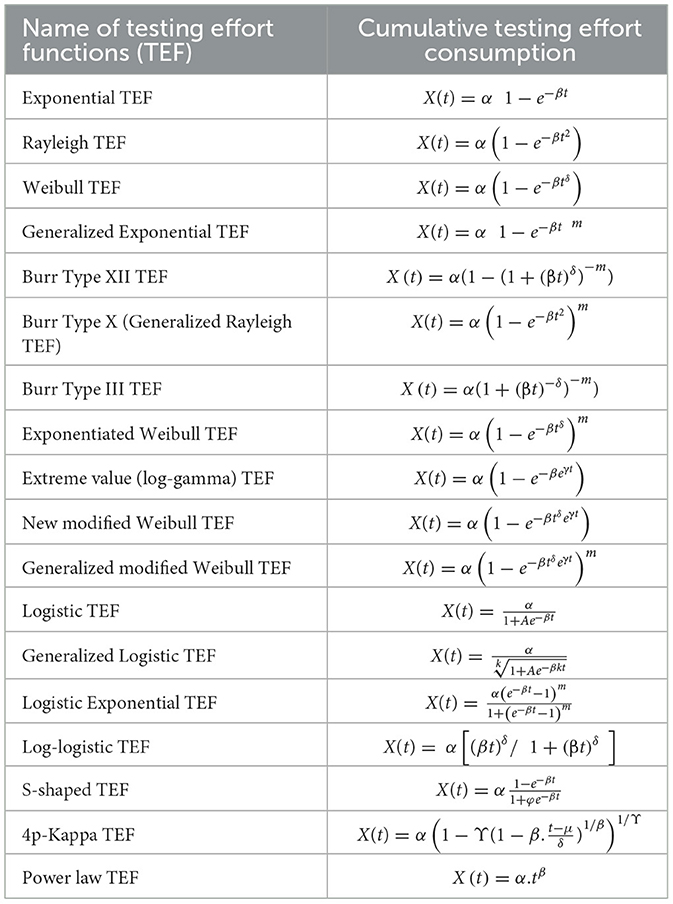
where . Clearly, various MVF, md(t), can be derived by assuming different, a(t), d(t), and, X(t) (see Table 2).
Also, fault detection intensity function λd(t) is derived as
It is significant to observe that the effort required to correct a fault eventually corrected at time t, is equals to s. The average number of FC within the time interval [t, t+Δt) corresponds to the average number of FD during the interval [X−1(X(t)−s), X−1(X(t+Δt)−s)]. Additionally, different amounts of testing effort are required to correct different faults. Thus, the correction effort can be modeled using the pdf, f(s) and cdf, (s). The MVF mc(t) can then be derived as follows:
where, F(X(t)−X(s)) is the probability of corrected fault before t which is deducted at s. Several mc(t) can be derived based on md(t) by taking different f(s) from Table 1 and X(t) from Table 2. And fault correction intensity function is given as
Different mc(t) can be derived based on md(t) and different f(x, θ).
3.4 Proposed paired models with Burr Type X
Generally, FD rate function d(t) is constant and it is denoted by r i.e., d(t) = r. Now the Equation 12 can be written as
Usually, in the literature, the total number of faults a(t) was assume to be exponentially or linearly related to time [71]. We consider Burr Type X as a cumulative TEF given in Table 2 as
where, is the current testing effort function, α is the total amount of testing effort consumptions, β is the scale parameter, and m is the shape parameter.
3.4.1 Paired model 1
The assumption is that the total number of faults increases in a linear fashion with the total testing effort consumption, while the required correction effort is characterized as an exponential variable. This can be formulated using mathematical notation as
Therefore, we have
If θ = r, then
and If θ≠r, then
3.4.2 Paired model 2
Assuming that the total number of faults increases exponentially with the total TEF, and the required correction effort follows an exponential distribution. Mathematically, it can be written as,
Therefore, we have
If θ = r, then
and If θ≠r, then
3.5 Parameters estimation methods
In this subsection, Particle Swarm Optimization (PSO) algorithm for estimation of parameters and other traditional estimation methods are presented.
3.5.1 Particle swarm optimization
Over the past two decades, soft computing techniques like PSO have gained prominence in software reliability analysis [72–74]. These techniques offer flexible and adaptive solutions for complex optimization problems, which are essential in the dynamic and uncertain environment of software reliability. PSO optimization is basically a population-based search algorithm inspired by the collective behavior of swarms and was presented by Eberhart and Kennedy [75].
When optimizing the parameters of a SRGM using PSO, the unknown model parameters are treated as particles that move through the solution space toward the optimal values. The process of updating velocity and position is repeated until the optimal solution is found. The optimal solution is achieved when the difference between the actual errors and the predicted errors is minimized. The estimation of the best solution is found with the help of a predefined evaluation criterion. Generally, Mean Squared Error (MSE) criterion is used to evaluate the performance of the SRGMs. The PSO starts by initializing the parameters of PSO, and setting them initial position and velocity. It estimates the objective function at every particle location, and finds the personal best position (pk), global best position (gk). It selected new velocity, based on the current velocity, the individual best position of particles, and the neighbors best positions. On each iteration it updates the particle locations, velocities, and neighbors. The Algorithm 1 runs until a stopping criterion is met.
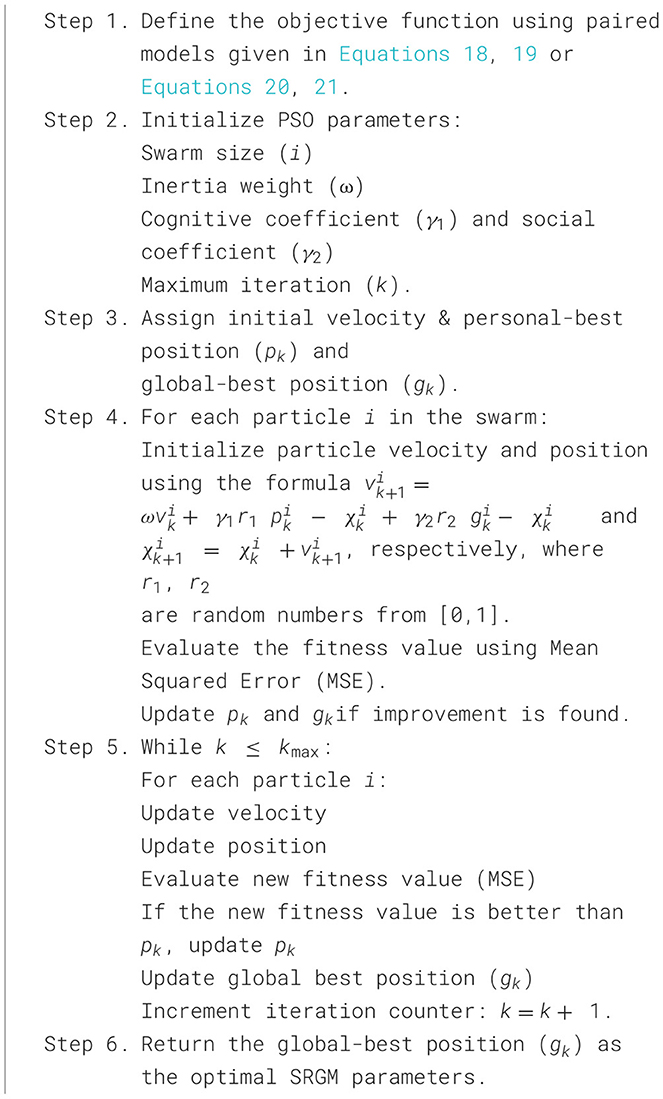
Algorithm 1. PSO algorithm: algorithm of PSO for the estimation of model parameters is described in this algorithm.
3.5.2 Other traditional estimation methods
3.5.2.1 Least square method
Parameter estimation is carried out by minimizing the squared differences between the MVFs of FD and FC.
Where di is the cumulative number of detected faults and ci is corrected faults collected until time ti, where, ti, i = 1, 2, 3…, the testing durations are measured from the initiation of testing.
3.5.2.2 Maximum likelihood method
Let P(ni,mi) represent the chance of finding ni faults and fixing mi faults by time ti. In the FD and FC modeling, are the parameters. The joint pdf of the FD and FC counts over the specified partition can be derived, and likelihood function can be expressed with θ0 substituted by θ as follows:
4 Illustrated example
4.1 Real data and criteria for model comparison
The actual dataset is taken from the T1 data [Rome Air Development Center (RADC)] projects and cited from Musa et al. [2]. The data set describes 21 weeks of testing, during which 300.1 CPU hours were consumed. Approximately 136 faults were identified and all of them were eliminated. We estimate the parameters using soft computing techniques, specifically Particle Swarm Optimization (PSO), and obtain the following parameters to present a comprehensive comparison among previous models and the proposed SRGM integrating Burr Type-X Testing Effort function (BTXTEF).
To demonstrate the effectiveness of proposed SRGM incorporating BTXTEF, we have three criteria:
4.1.1 Mean squared error (MSE)
MSE, a Goodness of Fit Criteria, measures the average of the squared difference between estimated and actual cumulative errors. The well-understood measure is considered to give good qualitative comparison. MSE is expressed as follows:
where n be the observations number, mi be the real detected errors by ti and is the predicted number of errors by time ti. Lesser MSE values reflect improved model accuracy and enhanced reliability prediction.
4.1.2 Average error (AE)
where n be the observations number, mi be the real detected faults by ti and is the predicted errors by time ti. A smaller AE corresponds superior performance.
4.1.3 Coefficient of determination (R2)
This is a quantitative statistic that reflects the degree to which the estimated values fit the real values in a model. It measures the extent to which the independent variable(s) explain the variance observed in the dependent variable. A higher R2 value signifies a more accurate fit of the model with the data.
where is the mean of real number of cumulative faults.
4.2 Performance analysis
The following section presents the estimate of all model parameters utilizing PSO on real failure data concurrently, as the interactions between these parameters exert influence that warrants simultaneous estimation [74]. The standard metrics AE, MSE, and R2 are employed to evaluate the proposed model.
To estimate all parameters α, β, m a, r, u, and θ simultaneously of the proposed Pair Model 1 of Equations 18, 19 with the BTXTEF, we fit the real failure data into the Pair Model using PSO coded in Python. The parameters are estimated as
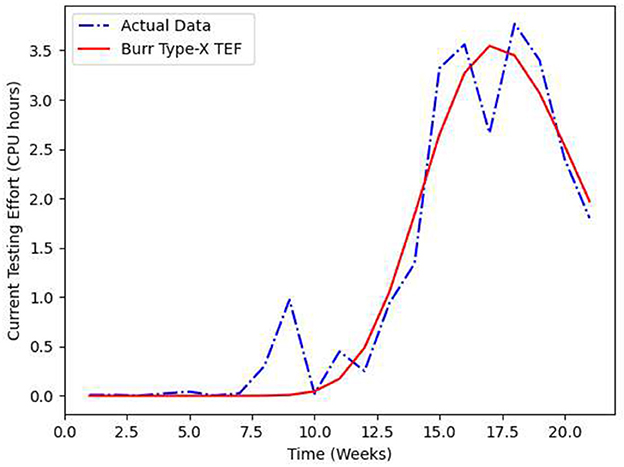
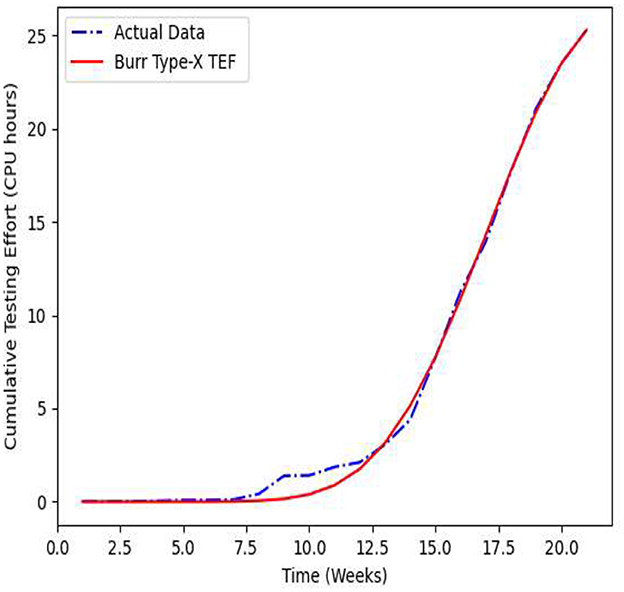
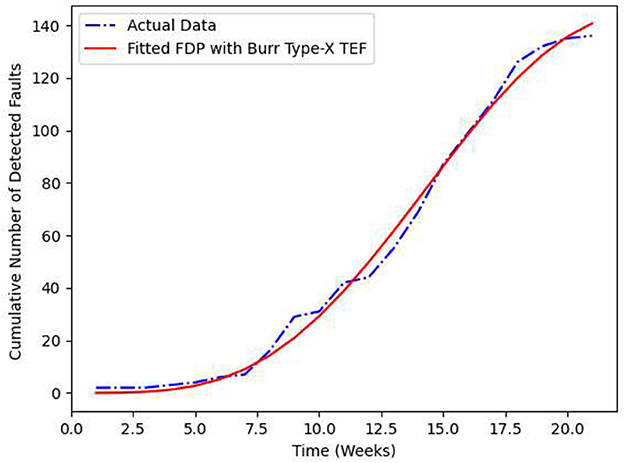
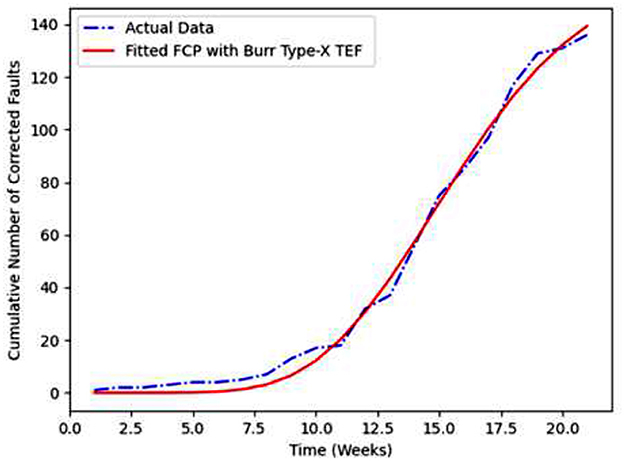
Figures 1, 2 demonstrates the fitting of the current and cumulative testing effort consumptions (CPU hours) with the time for BTXTEF using PSO respectively. Figures 3, 4 shows the fitting of the cumulative number of detected faults and corrected faults for the Pair Model 1 with the time respectively.
Similarly, we fit the real failure data into the Pair Model 2 of Equations 20, 21 for BTXTEF using PSO. The parameters estimated as
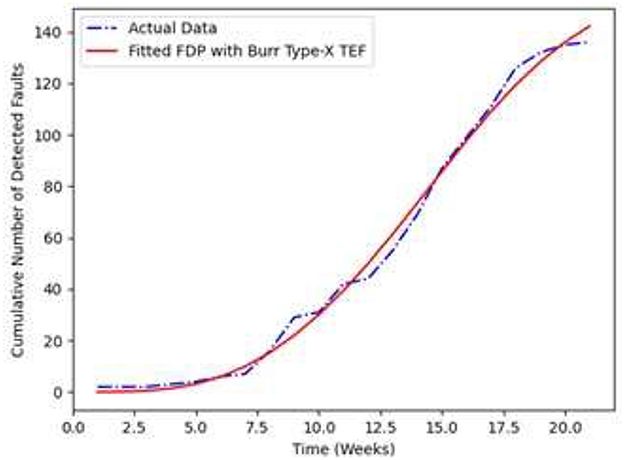
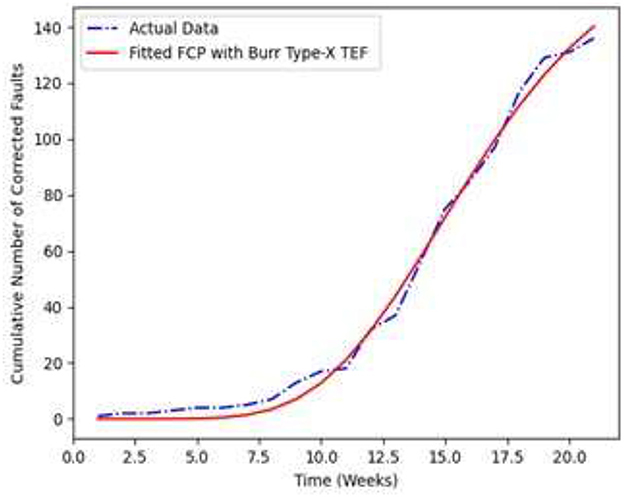
Figures 5, 6 demonstrates the fitting of the cumulative number of detected faults and corrected faults for the Pair Model 2 with the time respectively.
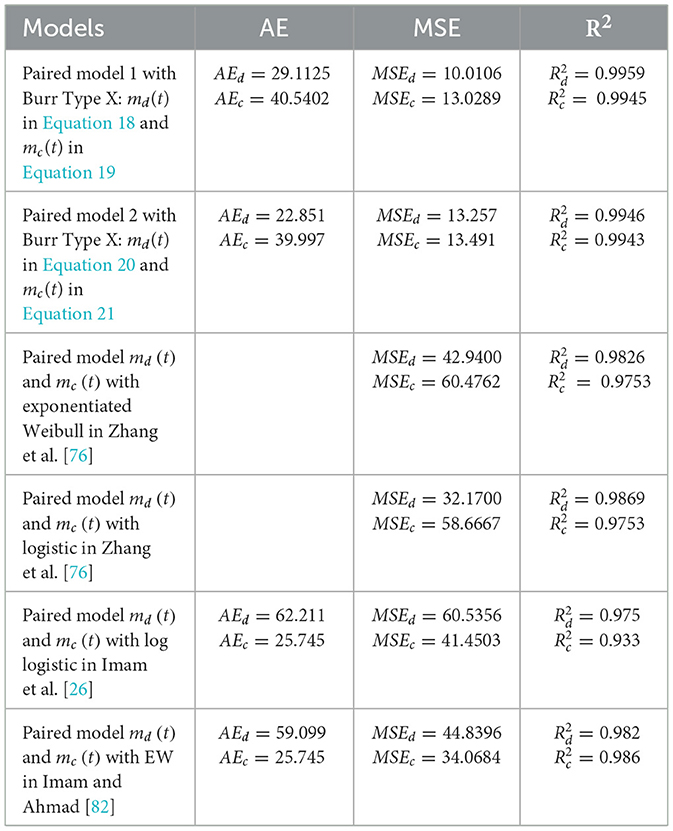
The performance comparison of different SRGMs using the actual dataset, along with all estimated values for the various models, is presented in Table 3.
We also present paired models below for quick reference:
Paired Model 1:
Paired Model 2:
For the dataset T1, we have compared the goodness-of-fit test values namely AE, MSE and R2 of the proposed Pair Model 1 and 2 against previous models from the literature which shows that the proposed SRGM model outperform in all parameters. From Figures 3–6 and the comparison criteria outlined in Table 3, indicate that the proposed model provides a more accurate depiction of how resources are allocated throughout the software development process, offering a superior fit in this experiment relative to other models.
5 Conclusion and future works
In this paper, we discussed several mathematical models for the FDP and FCP, along with methods for estimating key parameters. We proposed the FDP and FCP for imperfect debugging considering BTXTEF. Two particular paired FDP and FCP models are discussed with Testing Effort Function. Further, we applied PSO to optimize the parameters of SRGM and Burr Type X simultaneously on an actual dataset. We conclude that the proposed FDP and FCP with Burr Type X testing effort function using PSO optimization technique is highly effective and efficient as compared to existing models in the literature.
According to the findings and analysis delineated in this study, several promising avenues for future research have been identified. First, incorporating other TEF into the modeling of both FDP and FCP could lead to more accurate and realistic models. This would reflect the actual resources expended during testing, thereby improving predictions of software reliability. Additionally, the use of statistical distributions for modeling correction time delay is another avenue that could enhance the precision of future models by better capturing the stochastic nature of fault correction.
Further, the introduction of a change point into the FD and FC modeling processes could significantly improve the adaptability of reliability growth models, especially in environments where the testing dynamics shift over time. Weighted least squares, as an alternative estimation method, could also be employed to estimate model parameters, particularly in scenarios where traditional methods fall short. Moving beyond the Goel-Okumoto NHPP model, calendar-time-based approaches may also be considered to provide a broader perspective on the time-based progression of FDP and FCP.
Analyzing optimal software release timing based on cost-reliability criteria is another vital area for future research, allowing developers to balance cost efficiency with software quality. In addition, considering the correlation between FD and FC, as well as the correlation of failure times, could provide a more nuanced understanding of the interactions between different reliability factors. Future research could also explore reliability modeling in the context of networked and combined software/hardware systems as these systems introduce unique challenges in fault detection and correction.
Lastly, soft computing techniques should continue to be a focus of future research. The flexibility and adaptability of methods like genetic algorithms, neural networks, and fuzzy logic offer a powerful means to tackle the complexity of modern software systems, paving the way for more resilient and reliable software reliability models.
Data availability statement
Publicly available datasets were analyzed in this study. This data can be found at: T1 data of the Rome Air Development Center (RADC) projects and cited from Musa et al. [2].
Author contributions
KK: Formal analysis, Writing – original draft, Writing – review & editing, Visualization, Methodology, Conceptualization, Software. NA: Visualization, Conceptualization, Methodology, Supervision, Writing – original draft, Formal analysis, Writing – review & editing. ZA: Formal analysis, Writing – original draft, Methodology, Conceptualization, Visualization. JK: Methodology, Writing – original draft, Visualization, Formal analysis, Conceptualization.
Funding
The author(s) declare that no financial support was received for the research and/or publication of this article.
Conflict of interest
The authors declare that the research was conducted in the absence of any commercial or financial relationships that could be construed as a potential conflict of interest.
Generative AI statement
The author(s) declare that no Gen AI was used in the creation of this manuscript.
Any alternative text (alt text) provided alongside figures in this article has been generated by Frontiers with the support of artificial intelligence and reasonable efforts have been made to ensure accuracy, including review by the authors wherever possible. If you identify any issues, please contact us.
Publisher's note
All claims expressed in this article are solely those of the authors and do not necessarily represent those of their affiliated organizations, or those of the publisher, the editors and the reviewers. Any product that may be evaluated in this article, or claim that may be made by its manufacturer, is not guaranteed or endorsed by the publisher.
Abbreviations
md(t), expected mean number of fault detected till time t; mc(t), expected mean number of fault corrected till time t; m(t), expected number of fault detected till time t; ∅(t), fault detection rate; φ(t), fault correction rate per detected but not corrected fault; x(t), current testing effort function; X(t), cumulative testing effort function; λ(t), failure intensity at testing time t; λd(t), fault detection intensity function; λc(t), fault correction intensity function; F(x, θ), cumulative distribution function of correction effort; f(x, θ), probability density function of correction effort; N(t), total number of faults detected by time t; a(t), expected total number of faults at testing time t; d(t), fault detection rate per unit testing effort consumption at time t; r, constant fault detection rate; c, inflection factor/ rate; u, parameter of a(t); Δ(t), time delay; α, total amount of testing effort consumption; β, scale parameter of TEF; m, shape parameter of TEF; a, total number of initial faults; θ, parameter of probability density function of correction effort; AE, average error; MSE, mean squared error; R2, coefficient of determination; AEd, average error for fault detection process; AEc, average error for fault correction process; MSEd, mean squared error for fault detection process; MSEc, mean squared error for fault correction process; , coefficient of determination for fault detection process; , coefficient of determination for fault correction process.
References
1. Lyu MR. Handbook of Software Reliability Engineering. Vol. 222. Los Alamitos: IEEE Computer Society Press (1996).
2. Musa JD, Iannino A, Okumoto K. Software reliability: Measurement, prediction, application. McGraw-Hill (1987).
4. Goel AL, Okumoto K. Time-dependent error-detection rate model for software reliability and other performance measures. IEEE Trans Reliab. (2009) 28:206–11. doi: 10.1109/TR.1979.5220566
5. Bokhari MU, Ahmad N. Analysis of a software reliability growth models: the case of log-logistic test-effort function. In: Proceedings of the 17th International Conference on Modelling and Simulation (MS'2006). Montreal, Canada (2006). p. 540–5.
6. Ahmad N, Bokhari MU, Quadri SMK, Khan MGM. The exponentiated Weibull software reliability growth model with various testing-efforts and optimal release policy: a performance analysis. Int J Qual Reliab Manag. (2008) 25:211–35. doi: 10.1108/02656710810846952
7. Yamada S, Ohba M, Osaki S. S-shaped software reliability growth models and their applications. IEEE Trans Reliab. (1984) R-33:289–92. doi: 10.1109/TR.1984.5221826
8. Kuo S-Y, Huang C-Y, Lyu MR. Framework for modeling software reliability, using various testing-efforts and fault-detection rates. IEEE Trans Reliab. (2001) 50:310–20. doi: 10.1109/24.974129
9. Yamada S, Ohtera H, Narihisa H. Software reliability growth models with testing-effort. IEEE Trans Reliab. (1986) 35:19–23. doi: 10.1109/TR.1986.4335332
10. Yamada S, Hishitani J, Osaki S. Software-reliability growth with a Weibull test-effort: a model and application. IEEE Trans Reliab. (1993) 42:100–6. doi: 10.1109/24.210278
11. Ahmad N, Khan MGM, Rafi LS. A study of testing-effort dependent inflection S-shaped software reliability growth models with imperfect debugging. Int J Qual Reliab Manag. (2010) 27:89–110. doi: 10.1108/02656711011009335
12. Ahmad N, Khan MGM, Rafi LS. Analysis of an inflection S-shaped software reliability model considering log-logistic testing-effort and imperfect debugging. Int J Comput Sci Netw Secur. (2011) 11:161–71.
13. Khan MGM, Ahmad N, Rafi LS. Optimal testing resource allocation for modular software based on a software reliability growth model: a dynamic programming approach. In: 2008 International Conference on Computer Science and Software Engineering Vol. 2. Wuhan: IEEE (2008). p. 759–62. doi: 10.1109/CSSE.2008.1394
14. Khan MGM, Ahmad N, Rafi LS. Determining the optimal allocation of testing resource for modular software system using dynamic programming. Commun Stat Theory Methods. (2016) 45:670–94. doi: 10.1080/03610926.2013.834455
15. Ahmad N, Khan MGM. Determination of the optimal allocation of testing resource for modular software reliability growth using LINGO. J Softw. (2016) 11:664–76. doi: 10.17706/jsw.11.7.664-676
16. Zhang J, Lu Y, Yang S, Xu C. NHPP-based software reliability model considering testing effort and multivariate fault detection rate. J Syst Eng Electron. (2016) 27:260–70.
17. Huang C-Y, Kuo S-Y. Analysis of incorporating logistic testing-effort function into software reliability modeling. IEEE Trans Reliab. (2002) 51:261–70. doi: 10.1109/TR.2002.801847
18. Huang C-Y, Kuo S-Y, Lyu MR. An assessment of testing-effort dependent software reliability growth models. IEEE Trans Reliab. (2007) 56:198–211. doi: 10.1109/TR.2007.895301
19. Ahmad N, Kumar J, Singh AK, Kumar K. Testing effort-based software reliability growth models: a comprehensive study. In: 2023 10th International Conference on Computing for Sustainable Global Development (INDIACom). New Delhi: IEEE (2023). p. 1558–63
20. Ahmad N, Khan MGM, Quadri SMK, Kumar M. Modelling and analysis of software reliability with Burr Type X testing-effort and release-time determination. J Model Manag. (2009) 4:28–54. doi: 10.1108/17465660910943748
21. Huang C-Y. Performance analysis of software reliability growth models with testing-effort and change-point. J Syst Softw. (2005) 76:181–94. doi: 10.1016/j.jss.2004.04.024
22. Zhao J, Liu H-W, Cui G, Yang X-Z. Software reliability growth model with change-point and environmental function. J Syst Softw. (2006) 79:1578–87. doi: 10.1016/j.jss.2006.02.030
23. Zhang X, Teng X, Pham H. Considering fault removal efficiency in software reliability assessment. IEEE Trans Syst Man Cybern A Syst Hum. (2003) 33:114–20. doi: 10.1109/TSMCA.2003.812597
24. Xie M, Hu QP, Wu YP, Ng SH. A study of the modeling and analysis of software fault-detection and fault-correction processes. Qual Reliab Eng Int. (2007) 23:459–70. doi: 10.1002/qre.827
25. Peng R, Hu QP, Ng SH, Xie M. Testing effort dependent software FDP and FCP models with consideration of imperfect debugging. In: 2010 Fourth International Conference on Secure Software Integration and Reliability Improvement. IEEE (2010). p. 141–6. doi: 10.1109/SSIRI.2010.13
26. Imam Z, Ara IJ, Ahmad N. Analysis of software fault detection and correction processes with log-logistic testing-effort. In: Recent Advances in Mathematics, Statistics and Computer Science. Bihar: India & World Scientific (2016). p. 549–60. doi: 10.1142/9789814704830_0052
27. Peng R, Li YF, Zhang WJ, Hu QP. Testing effort dependent software reliability model for imperfect debugging process considering both detection and correction. Reliab Eng Syst Saf. (2014) 126:37–43. doi: 10.1016/j.ress.2014.01.004
28. Schneidewind NF. Analysis of error processes in computer software. In: Proceedings of the International Conference on Reliable Software. Los Angeles, CA; New York, NY: Association for Computing Machinery (1975). p. 337–46. doi: 10.1145/800027.808456
29. Xie M, Zhao M. The Schneidewind software reliability model revisited. In: Proceedings Third International Symposium on Software Reliability Engineering. Research Triangle Park, NC: IEEE Computer Society (1992). p. 184–5. doi: 10.1109/ISSRE.1992.285846
30. Schneidewind NF. Modelling the fault correction process. In: Proceedings 12th International Symposium on Software Reliability Engineering. Hong Kong: IEEE (2001). p. 185–190. doi: 10.1109/ISSRE.2001.989472
31. Lo J-H. Considering both failure detection and fault correction activities in software reliability modeling. in TENCON 2006-2006 IEEE Region 10 Conference. IEEE (2006). p. 1–4. doi: 10.1109/TENCON.2006.344098
32. Lo J-H, Huang C-Y. An integration of fault detection and correction processes in software reliability analysis. J Syst Softw. (2006) 79:1312–23. doi: 10.1016/j.jss.2005.12.006
33. Wu YP, Hu QP, Xie M, Ng SH. Detection and correction process modeling considering the time dependency. In: 2006 12th Pacific Rim International Symposium on Dependable Computing (PRDC'06). IEEE (2006). p. 19–25. doi: 10.1109/PRDC.2006.27
34. Wu YP, Hu QP, Xie M, Ng SH. Modeling and analysis of software fault detection and correction process by considering time dependency. IEEE Trans Reliab. (2007) 56:629–42. doi: 10.1109/TR.2007.909760
35. Hu QP, Xie M, Ng SH, Levitin G. Robust recurrent neural network modeling for software fault detection and correction prediction. Reliab Eng Syst Saf. (2007) 92:332–40. doi: 10.1016/j.ress.2006.04.007
36. Shu Y, Wu Z, Liu H, Yang X. Considering the dependency of fault detection and correction in software reliability modeling. In: 2008 International Conference on Computer Science and Software Engineering, vol. 2. Wuhan: IEEE (2008). p. 672–5. doi: 10.1109/CSSE.2008.1325
37. Wu C, Zhu X, Liu J. The SRGM framework of integrated fault detection process and correction process. In: 2008 International Conference on Computer Science and Software Engineering, vol. 2. IEEE (2008). p. 679–82. doi: 10.1109/CSSE.2008.865
38. Shu Y, Wu Z, Liu H, Yang X. Software reliability modeling of fault detection and correction processes. In: 2009 Annual Reliability and Maintainability Symposium. Fort Worth, TX: IEEE (2009). p. 521–6. doi: 10.1109/RAMS.2009.4914730
39. Kapur PK, Aggarwal AGA, Garmabaki AS. Generalized framework for fault detection and correction processes for successive release of software. In: International Conference on Quality Reliability And Infocom Technology: 18/12/2009-18/12/2009. New Delhi: Narosa Publications (2009). p. 252–63.
40. Jia L, Yang B, Guo S, Park DH. Software reliability modeling considering fault correction process. IEICE Trans Inf Syst. (2010) 93:185–8. doi: 10.1587/transinf.E93.D.185
41. Lin C-T. Analyzing the effect of imperfect debugging on software fault detection and correction processes via a simulation framework. Math Comput Model. (2011) 54:3046–64. doi: 10.1016/j.mcm.2011.07.033
42. Rafi SM, Akthar S. Incorporating fault dependent correction delay in SRGM with testing effort and release policy analysis. In: 2012 CSI Sixth International Conference on Software Engineering (CONSEG). IEEE (2012). p. 1–6. doi: 10.1109/CONSEG.2012.6349508
43. Liu Y, Xie M, Yang J, Zhao M. A new framework and application of software reliability estimation based on fault detection and correction processes. In: 2015 IEEE International Conference on Software Quality, Reliability and Security. Vancouver, BC: IEEE (2015). p. 65-74. doi: 10.1109/QRS.2015.20
44. Chatterjee S, Shukla A. Modeling and analysis of software fault detection and correction process through Weibull-type fault reduction factor, change point and imperfect debugging. Arab J Sci Eng. (2016) 41:5009–25. doi: 10.1007/s13369-016-2189-0
45. Chen Y-S, Chen P-S. A software-based redundant execution programming model for transient fault detection and correction. In: 2016 45th International Conference on Parallel Processing Workshops (ICPPW). IEEE (2016). p. 66–71. doi: 10.1109/ICPPW.2016.25
46. Imam MZ, Sultan S, Ahmad N. Analysis of software fault detection and correction process models with Burr Type XII testing-effort. In: 2016 3rd International Conference on Computing for Sustainable Global Development (INDIACom). IEEE (2016). p. 1210–3.
47. Liu Y, Li D, Wang L, Hu Q. A general modeling and analysis framework for software fault detection and correction process. Softw Test Verif Reliab. (2016) 26:351–65. doi: 10.1002/stvr.1600
48. Liu Y, Xie M, Wang L, Hu Q. Reliability analysis of open source software: a Bayesian approach considering both fault detection and correction processes. In: 26th European Safety and Reliability Conference, ESREL 2016. Glasgow: CRC Press/Balkema (2016). doi: 10.1201/9781315374987-360
49. Kumar V, Mathur P, Sahni R, Anand M. Two-dimensional multi-release software reliability modeling for fault detection and fault correction processes. Int J Reliab Qual Saf Eng. (2016) 23:1640002. doi: 10.1142/S0218539316400027
50. Wang L, Hu Q, Liu J. Software reliability growth modeling and analysis with dual fault detection and correction processes. IIE Transactions. (2016) 48:359–70. doi: 10.1080/0740817X.2015.1096432
51. Yang J, Liu Y, Xie M, Zhao M. Modeling and analysis of reliability of multi-release open source software incorporating both fault detection and correction processes. J Syst Softw. (2016) 115:102–10. doi: 10.1016/j.jss.2016.01.025
52. Okamura H, Dohi T. A generalized bivariate modeling framework of fault detection and correction processes. In: 2017 IEEE 28th International Symposium on Software Reliability Engineering (ISSRE). Toulouse: IEEE (2017). p. 35–45. doi: 10.1109/ISSRE.2017.22
53. Peng R, ZhAi Q. Modeling of software fault detection and correction processes with fault dependency. Eksploatacja i Niezawodność. (2017) 19:467–75. doi: 10.17531/ein.2017.3.18
54. Peng R, Li Y-F, Liu Y. Software Fault Detection and Correction: Modeling and Applications. Singapore: Springer (2018). doi: 10.1007/978-981-13-1162-8
55. Zhu M, Pham H. A two-phase software reliability modeling involving with software fault dependency and imperfect fault removal. Comput Lang Syst Struct. (2018) 53:27–42. doi: 10.1016/j.cl.2017.12.002
56. Kumar D, Gupta P. Fuzzy software release problem with learning functions for fault detection and correction processes. In: Software Engineering: Proceedings of CSI 2015. Springer: Singapore (2019). p. 655–61. doi: 10.1007/978-981-10-8848-3_63
57. Pachauri B, Kumar A, Raja S. Imperfect software reliability growth model using delay in fault correction. In: Performance Prediction and Analytics of Fuzzy, Reliability and Queuing Models: Theory and Applications. Springer Nature: New York (2019). p. 119–26. doi: 10.1007/978-981-13-0857-4_8
58. Saraf I, Iqbal J. Generalized software fault detection and correction modeling framework through imperfect debugging, error generation and change point. Int J Inf Technol. (2019) 11:751–7. doi: 10.1007/s41870-019-00321-x
59. Saraf I, Iqbal J. Generalized multi-release modelling of software reliability growth models from the perspective of two types of imperfect debugging and change point. Qual Reliab Eng Int. (2019) 35:2358–70. doi: 10.1002/qre.2516
60. Choudhary C, Kapur PK, Khatri SK, Muthukumar R, Shrivastava AK. Effort based release time of software for detection and correction processes using MAUT. Int J Syst Assur Eng Manag. (2020) 11:367–78. doi: 10.1007/s13198-020-00955-2
61. Saraf I, Shrivastava AK, Iqbal J. Generalised fault detection and correction modelling framework for multi-release of software. Int J Ind Syst Eng. (2020) 34:464–93. doi: 10.1504/IJISE.2020.106085
62. Xiao H, Cao M, Peng R. Artificial neural network based software fault detection and correction prediction models considering testing effort. Appl Soft Comput. (2020) 94:106491. doi: 10.1016/j.asoc.2020.106491
63. Li Q, Pham H. Software reliability modeling incorporating fault detection and fault correction processes with testing coverage and fault amount dependency. Mathematics. (2021) 10:60. doi: 10.3390/math10010060
64. Li Q, Pham H. Modeling software fault-detection and fault-correction processes by considering the dependencies between fault amounts. Appl Sci. (2021) 11:6998. doi: 10.3390/app11156998
65. Tiwari A, Sharma A. Imperfect debugging-based modeling of fault detection and correction using statistical methods. J Circuits Syst Comput. (2021) 30:2150185. doi: 10.1142/S0218126621501851
66. Minamino Y, Makita Y, Inoue S, Yamada S. Efficiency evaluation of software faults correction based on queuing simulation. Mathematics. (2022) 10:1438. doi: 10.3390/math10091438
67. Saraf I, Iqbal J, Shrivastava AK, Khurshid S. Modelling reliability growth for multi-version open source software considering varied testing and debugging factors. Qual Reliab Eng Int. (2022) 38:1814–25. doi: 10.1002/qre.3048
68. Raamesh L, Jothi S, Radhika S. Enhancing software reliability and fault detection using hybrid brainstorm optimization-based LSTM model. IETE J Res. (2023) 69:8789–803. doi: 10.1080/03772063.2022.2069603
69. Xie R, Qiu H, Zhai Q, Peng R. A model of software fault detection and correction processes considering heterogeneous faults. Qual Reliab Eng Int. (2023) 39:3428–44. doi: 10.1002/qre.3172
71. Yamada S, Tokuno K, Osaki S. Imperfect debugging models with fault introduction rate for software reliability assessment. Int J Syst Sci. (1992) 23:2241–52. doi: 10.1080/00207729208949452
72. Sheta A, Al-Salt J. Parameter estimation of software reliability growth models by particle swarm optimization. Management. (2007) 7:14.
73. Zhang KH, Li AG, Song BW. Estimating parameters of software reliability models using PSO. Comput Eng Appl. (2008) 44:47–9.
74. Jin C, Jin S-W. Parameter optimization of software reliability growth model with S-shaped testing-effort function using improved swarm intelligent optimization. Appl Soft Comput. (2016) 40:283–91. doi: 10.1016/j.asoc.2015.11.041
75. Eberhart R, Kennedy J. Particle swarm optimization. Proc IEEE Int Conf Neural Netw. (1995) 4:1942–8. doi: 10.1109/ICNN.1995.488968
76. Zhang N, Cui G, Liu H. Software reliability analysis using queuing-based model with testing effort. J Softw. (2013) 8:1301–7. doi: 10.4304/jsw.8.6.1301-1307
77. Wang J, Wu Z, Shu Y, Zhang Z. An imperfect software debugging model considering log-logistic distribution fault content function. J Syst Softw. (2015) 100:167–81. doi: 10.1016/j.jss.2014.10.040
78. Li F, Yi Z-L. A New software reliability growth model: multigeneration faults and a power-law testing-effort function. Math Probl Eng. (2016) 2016:9276093. doi: 10.1155/2016/9276093
79. Wang LJ, Hu QP, Xie M. Bayesian analysis for NHPP-based software fault detection and correction processes. In: 2015 IEEE International Conference on Industrial Engineering and Engineering Management (IEEM). Singapore: IEEE (2015). p. 1046–50. doi: 10.1109/IEEM.2015.7385808
80. Lo J-H. An integrated framework of the modeling of failure-detection and fault-correction processes in software reliability analysis. In: 2008 6th IEEE International Conference on Industrial Informatics. Daejeon: IEEE (2008). p. 557–62. doi: 10.1109/INDIN.2008.4618163
81. Liu, RPJ. Simulated software testing process considering debuggers with different detection and correction capabilities. Int J Performability Eng. (2017) 13:334. doi: 10.23940/ijpe.17.03.p10.334336
Keywords: software reliability growth model (SRGM), fault detection process (FDP), fault correction process (FCP), mean value function (MVF), Particle Swarm Optimization (PSO)
Citation: Kumar K, Ahmad N, Ahmad Z and Kumar J (2025) Software reliability modeling for fault detection and fault correction processes considering Burr Type X testing effort function. Front. Appl. Math. Stat. 11:1669066. doi: 10.3389/fams.2025.1669066
Received: 18 July 2025; Accepted: 14 August 2025;
Published: 03 September 2025.
Edited by:
Mohammad G. M. Khan, University of the South Pacific, FijiReviewed by:
Javaid Iqbal, University of Kashmir, IndiaAasim Zafar, Aligarh Muslim University, India
Copyright © 2025 Kumar, Ahmad, Ahmad and Kumar. This is an open-access article distributed under the terms of the Creative Commons Attribution License (CC BY). The use, distribution or reproduction in other forums is permitted, provided the original author(s) and the copyright owner(s) are credited and that the original publication in this journal is cited, in accordance with accepted academic practice. No use, distribution or reproduction is permitted which does not comply with these terms.
*Correspondence: Kaushal Kumar, a2F1c2hhbC5tb25rQGdtYWlsLmNvbQ==
 Kaushal Kumar
 Nesar Ahmad
 Zubair Ahmad
 Jitendra Kumar