 Jacques Demongeot
 Haiwe Adam Ouangko1
 Maryam Diarra
- 1AGEIS, Faculté de Médecine, Université Grenoble Alpes, La Tronche, France
- 2CARE, Institut Pasteur, Dakar, Senegal
- 3MISIT, Pôle Santé Publique, CHU Grenoble Alpes, La Tronche, France
Introduction: The epidemic transition that took place in Europe and North America during the twentieth century, with the historical decline of infectious disease epidemics, gradually diverted physicians' attention from the world of “microbes.” However, recent epidemics have made the surveillance of new microorganisms, particularly viruses, in the general population a new public health priority.
Methods: Most of the highly sophisticated mathematical models currently in use have failed to accurately predict and describe the latest emerging epidemics (mad cow disease, H1N1, swine flu, Covid-19, etc.). Predicting the occurrence of an epidemic remains almost as challenging today as it was in 1760, when D. Bernoulli defined the notion of endemicity and successfully proposed his famous SI equation to describe epidemic dynamics, then applied it to smallpox epidemics. Finally, it might be more interesting to return to the historical, more pragmatic approach, especially in a context of uncertainty, by favoring simpler but robust mathematical models that are more in line with the basic principles governing the interactions of microorganisms with their hosts, in a given environment and exposure conditions. For this reason, we will use the Bernoulli model and the parameters related to the empirical distribution of new daily or weekly cases observed.
Results: Using the empirical distribution of new cases and the revisited SI model, we have studied the predictive power of the dispersion index of new cases and the applications proposed to illustrate our approach concern the Covid-19 epidemic in various developed and developing countries as well as the Dengue epidemic in the French Antilles. The results obtained show that, except in cases where the occurrence of vaccination reduces its anticipation capacities, the dispersion index has a predictive power of the occurrence of epidemic peaks.
Discussion: One limitation of this study is that it is based on official data that is sometimes affected by changes in health policies (recommendations, monitoring indicators, data collection methods, etc.), but we believe that the impact on the quality of the demonstration remains moderate or even modest.
1 Introduction
The epidemiological transition that took place in Europe and North America during the 20th century [1], that is, the historical decline in infectious disease epidemics and the increasing burden of cardiovascular diseases, cancers, and other chronic conditions, has gradually diverted the attention and training of physicians from the world of “microbes” (with the exception of nosocomial infections), but recent epidemics in the general population have made the surveillance of new microorganisms, particularly viruses, a new public health priority.
The majority of the highly sophisticated mathematical models used for this purpose today have often failed to accurately predict and describe the latest emerging epidemics. For example, for the estimated global mortality associated with the first 12 months of the 2009 pandemic influenza A H1N1 virus, the global estimates were more than 15 times higher than the number of laboratory-confirmed deaths reported worldwide to the World Health Organization (WHO) [2] for the period April 2009–August 2010, this number being likely only a fraction of the true number of the deaths due to a low rate of reported cases. Predicting the occurrence of an epidemic from endemic behavior has indeed always been a challenge since D. Bernoulli defined in 1760 the notion of endemic and proposed his SI equation for epidemic dynamics [3], followed by a series of authors improving the initial SI model, such as the SIRS model [4–6] up to the most recent models, based on COVID-19 epidemic data [7]. We thus studied epidemic forecasting and introduced the dispersion index (equal to the variance of the empirical distribution of the number of new cases in a given time window divided by its expectation) as an effective predictor of the occurrence of epidemic peaks [8–11] from the variations of daily cases observed during the endemic periods preceding them [8–11]. In this article, we present a new application of this forecasting tool to the epidemic peaks of COVID-19 in different developed (France, Japan, the United Kingdom, and the USA) and developing (Brazil and Senegal) countries, and of dengue fever in the French Antilles. Section 2 presents the methodology, Section 3 the results, Section 4 the discussion, and Section 5 the conclusions with the perspectives.
2 Methods
2.1 Brief historical reminder
The first mathematical definition of the notion of histogram was given in 1892 by Pearson [12]. In 1925, Sir Ronald Fisher used a similar notion of sample frequency diagram [13], and in 1933, Andrei Kolmogorov introduced the rigorous notion of empirical distribution linked to the observation of a sample of independent observations of the same random variable [14]. We will use this last concept of empirical distribution in the following sections by recalling the definitions of the parameters related to this probability distribution.
2.2 Stationarity breakdown criteria
The transition between the stationary endemic state of a contagious disease and an epidemic wave will be studied in the following sections by calculating empirical distribution parameters in a moving window around the frontier on which we suspect this transition occurred. The six parameters are the coefficient of variation, the skewness, the kurtosis, the index of dispersion, the normality index, and the entropy of the empirical distribution of the random variable N(t) equal to the new cases of the disease daily observed.
Figure 1 shows artificial data in (A)–(C) and real data from the fourth wave peak of the daily new cases of COVID-19 in the USA in (D). The differences between the curves of new daily cases and their corresponding histograms reflect distinct distribution shapes. A quasi-uniform shape typically appears during the peak period, with a concentration on the endemic phase in case of a linear, Laplacian, or Gaussian pattern increase of the newly infected (Figures 1A–C). In contrast, a concentration in the case of a plateau-like peak with a quasi-uniform shape during the endemic part in the case of real data corresponding to the fourth wave of COVID-19 cases peak in the USA (Figure 1D).
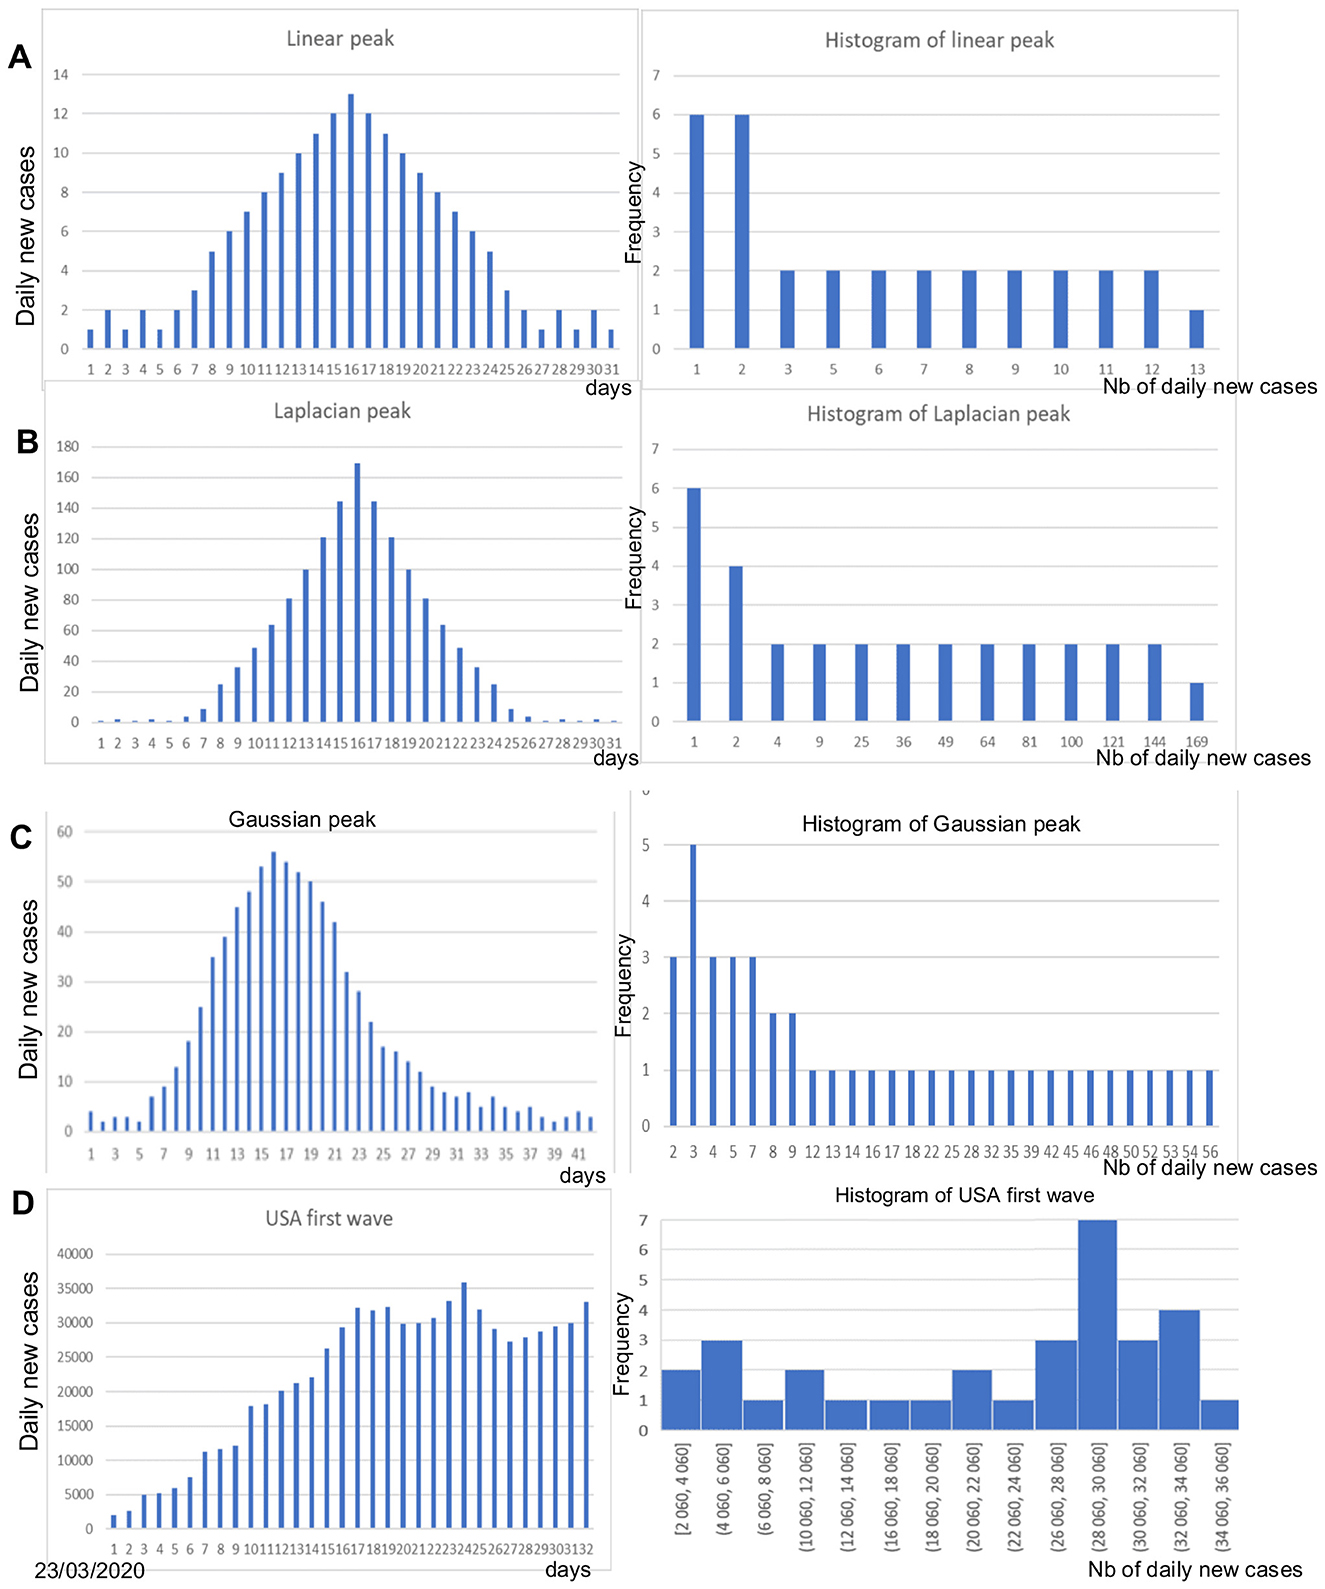
Figure 1. (A) Linear peak of daily new cases (left) and corresponding histogram (right); (B) Laplacian-shaped peak (left) and corresponding histogram (right); (C) Gaussian-shaped peak (left) and corresponding histogram (right); (D) Peak of the daily new cases of the COVID-19 fourth wave in the USA (left) and corresponding histogram.
The shape of epidemic peaks is much more effective in capturing the importance of such events in the general population, especially if the study of their occurrence is accompanied by a stratified analysis by age group, some groups being more likely than others to be infected. Modeling epidemic dynamics therefore remains essential, but the empirical distribution provides us with elements (such as its moments or other parameters, such as its entropy or its coefficient of variation) for understanding the infectious mechanism of another order: the examination of the different parameters linked to this distribution shows a significant change in the range of the distribution, which is all the more spread out as the peak is high. We therefore move from a probability law concentrated on a few values in the endemic phase to a law with a much higher value support. More than the shape of the distribution (e.g., its entropy), which can change at the endemic/epidemic transition, it is parameters such as expectation and variance that will vary greatly. We will show in the following sections, using concrete examples, that the ratio of these two quantities, variance to expectation, the dispersion index DI, can be a good predictor of epidemic peaks because it has a very early increase, detectable before the significant increase in new daily cases, e.g., 10–14 days before the peak.
2.3 Parameters of the empirical distribution of the daily number of new cases
2.3.1 Coefficient of variation (CV)
The daily number of new cases N is an integer variable valued in {N1,…,Nd}, and its histogram weights pi, {pi}i = 1, d, are defined as follows:
Then, the following formulas give the first moments and dispersion parameters of the empirical distribution {pi}i = 1, d:
We can remark that (i) the value of DI equals 0 for a constant random variable N and 1 for a Poisson variable and (ii) the value of the entropy E is maximum and equal to Log(d) when the empirical distribution is uniform, i.e., when any pi equals 1/d, and E is minimum and equal to 0 when N is constant.
2.4 Normality index
The normality index KStest is defined as the fitting criterion of the Kolmogorov–Smirnov test of adequation to the normal distribution N(E(N), σ(N)) with E(N) and σ(N) the expectation and standard deviation of the empirical distribution of N, respectively.
3 Results
We will now calculate the parameters defined in Section 2 to see concretely what their potential predictive power is in the case of two epidemics, COVID-19 and dengue. We will first study them in isolation and then jointly by looking for the most predictive linear combination of these parameters.
3.1 Empirical entropy in the COVID-19 outbreak
The data are obtained from Ref. [15]. Figure 2 shows the empirical distribution of new cases for the first wave in the USA.
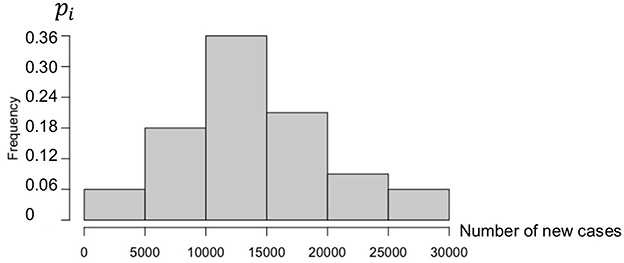
Figure 2. Histogram of new cases during the first wave in the USA (1 May to 31 May 2020).
The first wave empirical distribution of the new cases in the USA is defined by the following weights, calculated on a partition of the set of values of N in six intervals:
Then, if Ni denotes the central value of the ith interval, the first moments and CV are equal to as follows:
The direct mean of the new cases is equal to 13913.12 ~ E(N ).
The empirical entropy E is given by:
Figure 3 shows the empirical distribution of new cases for the third wave in Brazil.
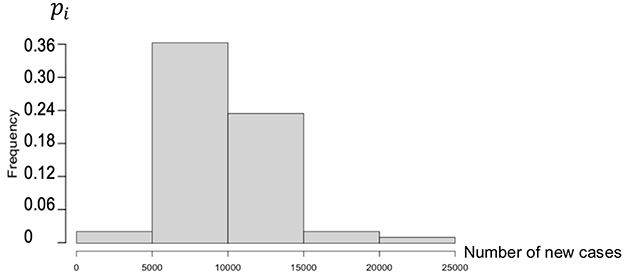
Figure 3. Histogram of new cases during the third wave in Brazil (25 December 2022 to 25 January 2023).
The empirical distribution of the new cases in Brazil during the third wave is defined by the following weights, calculated on a partition of the set of values of N in five intervals:
Then, if Ni denotes the central value of the ith interval, the expectation E(N) and the CV are equal to as follows:
The empirical entropy E is given by:
The entropy for Brazil is less than that for the USA because the empirical distribution is more concentrated.
3.2 Retro-prediction in the COVID-19 outbreak
For checking the predictive power of the parameters calculated in Section 3.1, we propose to retro-predict the evolution from an endemic state to an epidemic one in three examples: the fourth wave in France, the first wave in the USA, and the third wave in Brazil (data from [15]).
After choosing the same moving window length of 14 days for calculating CV and entropy, the parameter values are calculated in this window and reported at the end of the corresponding time interval, as given in Figure 4.
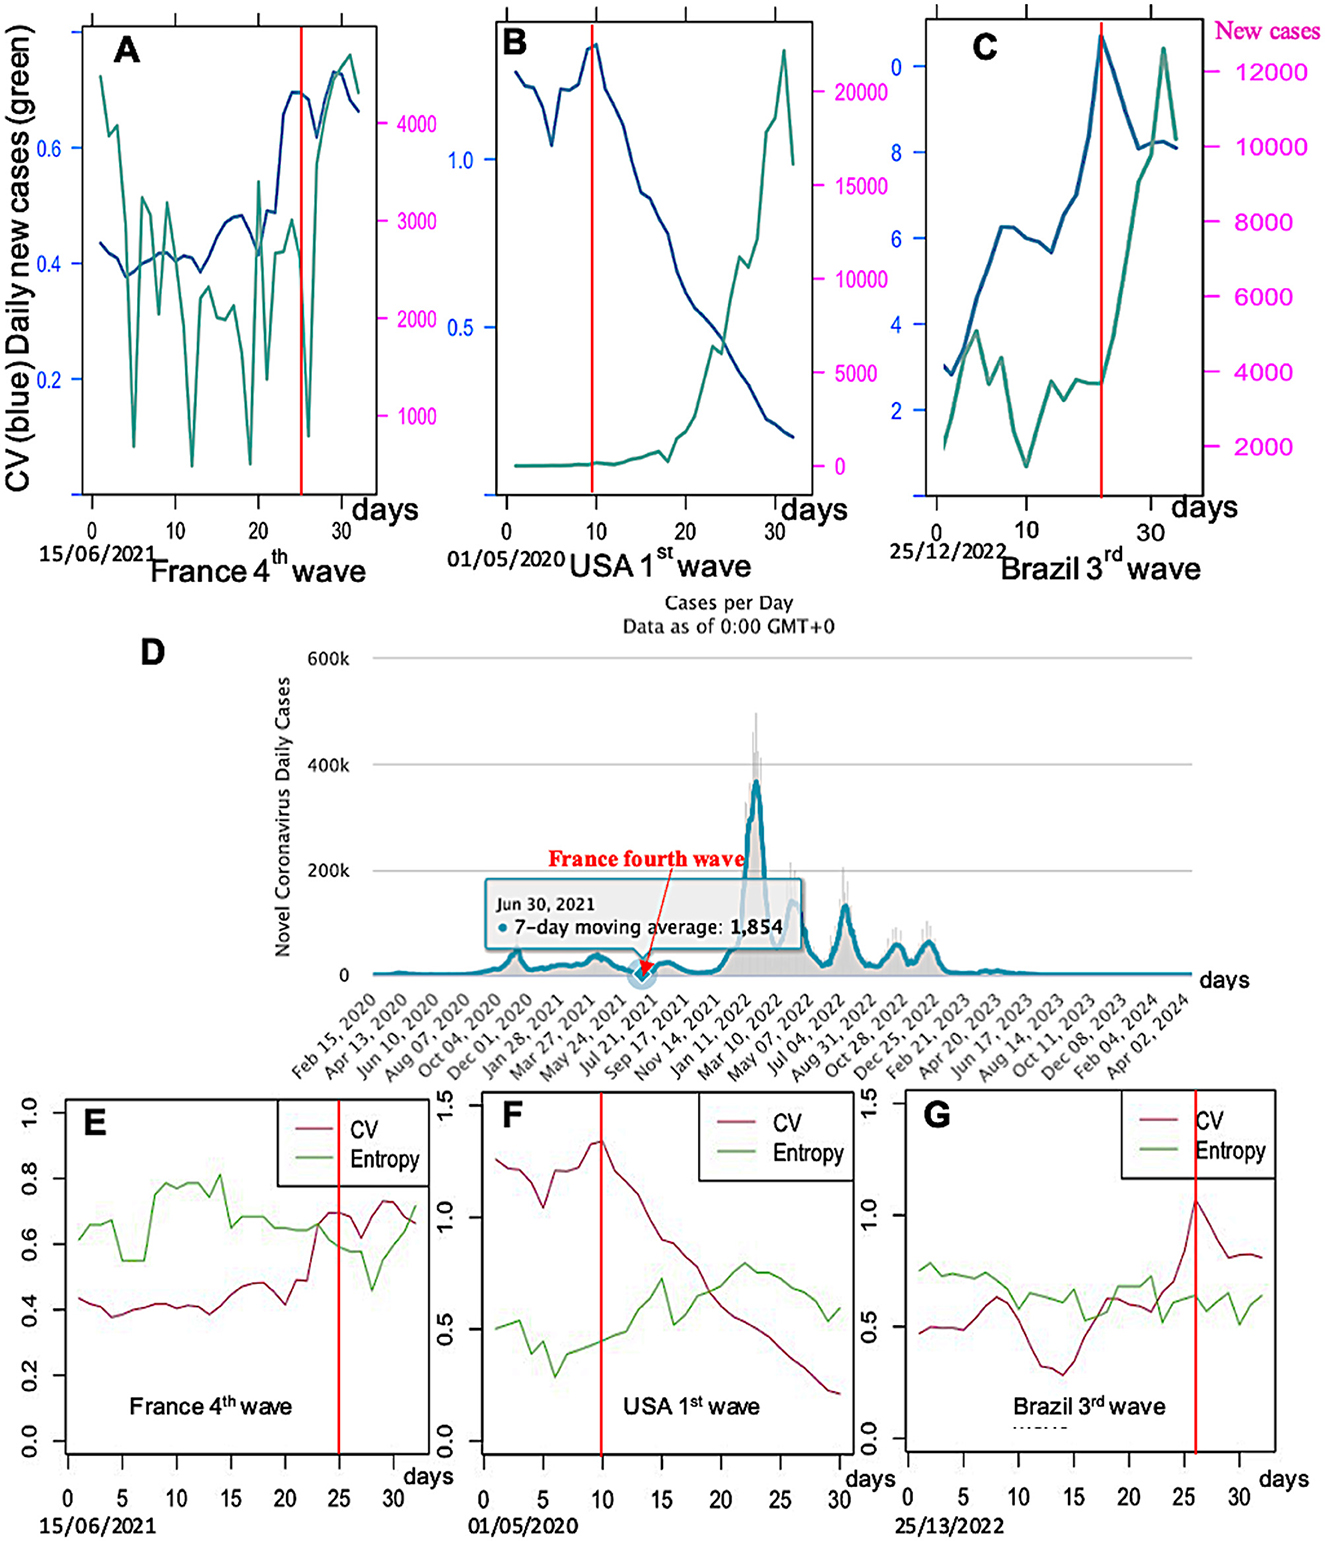
Figure 4. Daily new cases (green) and CV (blue) for three countries and epidemic waves: (A) France third wave, (B) USA first wave, and (C) Brazil third wave; (D) COVID-19 data for France from Waku et al. [10]; CV (red) and entropy (green) for the same countries and waves: (E) France fourth wave (data is averaged in a 7-day moving window), (F) USA first wave, and (G) Brazil third wave. Limits between the endemic and epidemic phases are indicated by a vertical full line in red.
The retro-prediction designed in Figures 4–6 proves indeed that it is possible to anticipate the occurrence of an epidemic wave by looking at three predictive events often observed:
1) The parameter coefficient of variation CV seems to have a transient increase before the epidemic peak, except for the fourth wave in France, corresponding probably to a local increase of the endemic standard deviation just before the increase of the empirical mean, corresponding to a local loss of stability of the stationary endemic regime.
2) The parameter entropy E has no increase (only slightly in Figure 4E) before the transition between the endemic and epidemic phases. This phenomenon, when it exists, could correspond to a diminution of the randomness of the daily new cases, which increases exponentially at the start of the epidemic peak, but with a residual noise around the exponential trend less important than during the previous endemic phase.
3) Then, because the tendencies shown by the parameters CV and entropy E are neither constant nor significant, we will study the predictive effect of all the other breakdown parameters, kurtosis, skewness, dispersion index DI, and KStest for the COVID-19 data (data from [15]).
Let us consider now the solution of the Bernoulli SI model, where mortality and fertility rates are negligible. Then, the inflection point equation is given in Demongeot et al. [11] and reported on the daily new cases curve (Figure 5).
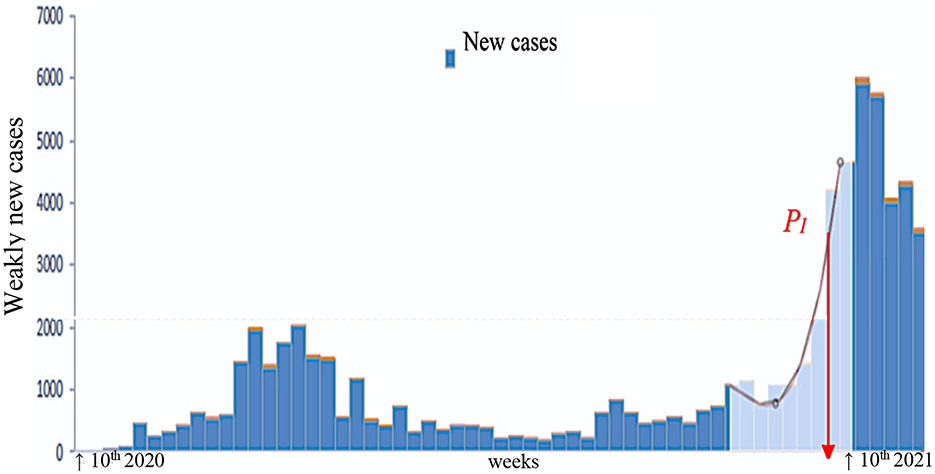
Figure 5. Determination of the inflection point PI of the daily new cases curve for the third wave of the COVID-19 outbreak in France (after [24]).
If I (resp. S) denotes the infected (resp. susceptible) number, the Bernoulli differential equations are given by the following formula:
where ν is the specific mortality rate due to the disease, β the disease transmission rate, S(t) the number of susceptible individuals, I(t) the number of infected individuals at time t≥ 0, and the initial conditions of the model are: S(0) = So > 0 and I(0) = 1. Let us consider the solution of the Bernoulli equation with ν = 0 (mortality rate, negligible in a short period of time) and a is a constant:
For any time t, we have:
If we consider that the epidemic wave starts at time 0, where I(0) = 1, we have:
Then, a is given by the following equation:
From Bernoulli equation, where ν = 0 ; we have:
The sufficient existence condition for a point of inflection of order 2 for I′(t) in the case that I(t) is three times continuously differentiable in a certain neighborhood of a point ti with I‴(ti) = 0 and I″(ti) ≠ 0. Then, I′(t) has an inflection point (PI) at time ti, and by differentiating I'(t) twice, we get:
Then, the equation giving β and a from its lowest root xi:
where xi depends on I(ti):
If we assume now I(0) = 100, then, from the same calculations, β and a are identified and the time ti of the inflection point PI is calculated from Equation 10 (see Figure 5).
If the dispersion index DI is close to 1, then the behavior is said to be Poisson-like (variance equals mean), which reflects a normal random distribution of the number of weekly cases. If it is less than 1, we speak of under-dispersion: the empirical variance of the distribution of the number of cases is less than the empirical mean of this distribution.
This is the case for an empirical distribution concentrated on neighboring values. If it is greater than 1, there is overdispersion, and the empirical variance of the empirical distribution of the number of new cases is greater than the empirical mean of this distribution.
This reflects a greater than expected variability of the dispersion index DI, often linked to unstable or exponential epidemic dynamics with very rapid growth, which allows the empirical distribution to cover a large data interval in a short period of time. A peak of DI may precede the epidemic peak because the concentration of the cases increases before the number of cases explode, which provokes a second phase of the decrease of DI (Figure 6B).
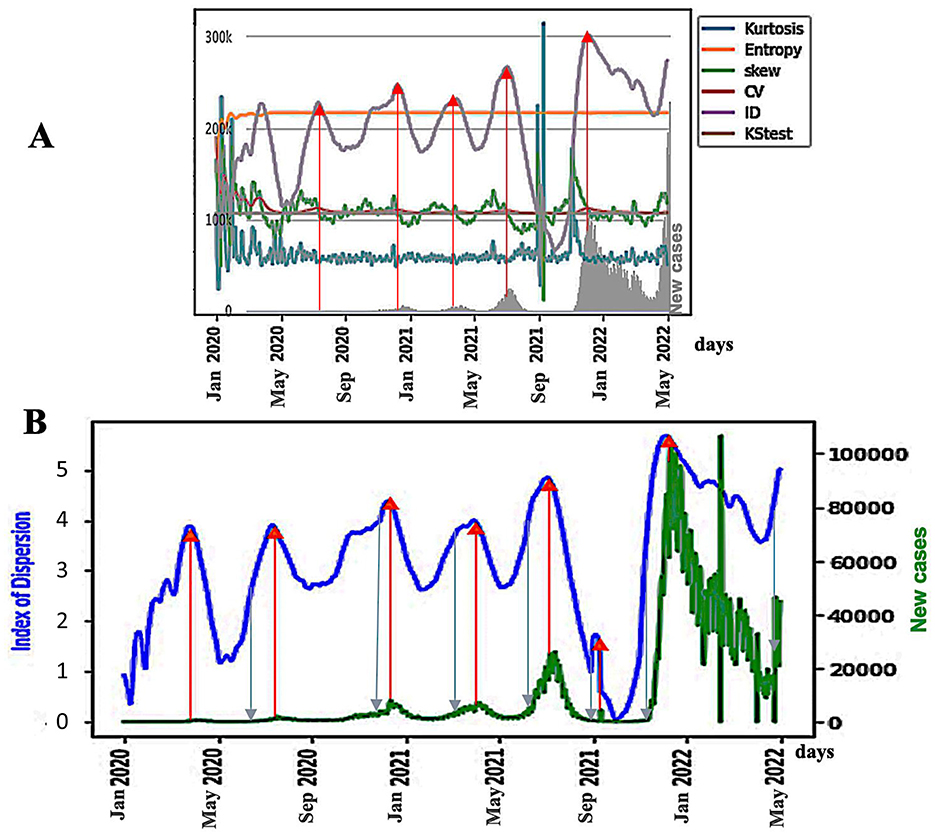
Figure 6. (A) Breakdown parameters and new cases (in gray on the bottom) in Japan during the COVID-19 outbreak. The blue arrows represent the points of inflection of the DI curve, and the red arrows represent the maxima of the DI peaks; (B) ID index (in blue) as a predictor of the epidemic waves for the Japan COVID-19 outbreak, with daily new cases superimposed (in green). The x-axis represents time. Blue arrows represent DI inflection points, and the red arrows represent DI peaks.
3.3 Retro-prediction of epidemic peaks of dengue in the French Antilles
By testing the generalizability of the predictive power of the dispersion index of dengue fever in the French Antilles [16], a disease with endemic and epidemic phases, we see in Figures 7, 9B, the limits of the exponential growths and decays of the epidemic peaks coming from the significant change of the KS index at the limits of the endemic phase. The anticipation done by the KS index is equal to approximately 2 weeks (the distance between the KS indices significantly changes, and the next new cases peak).
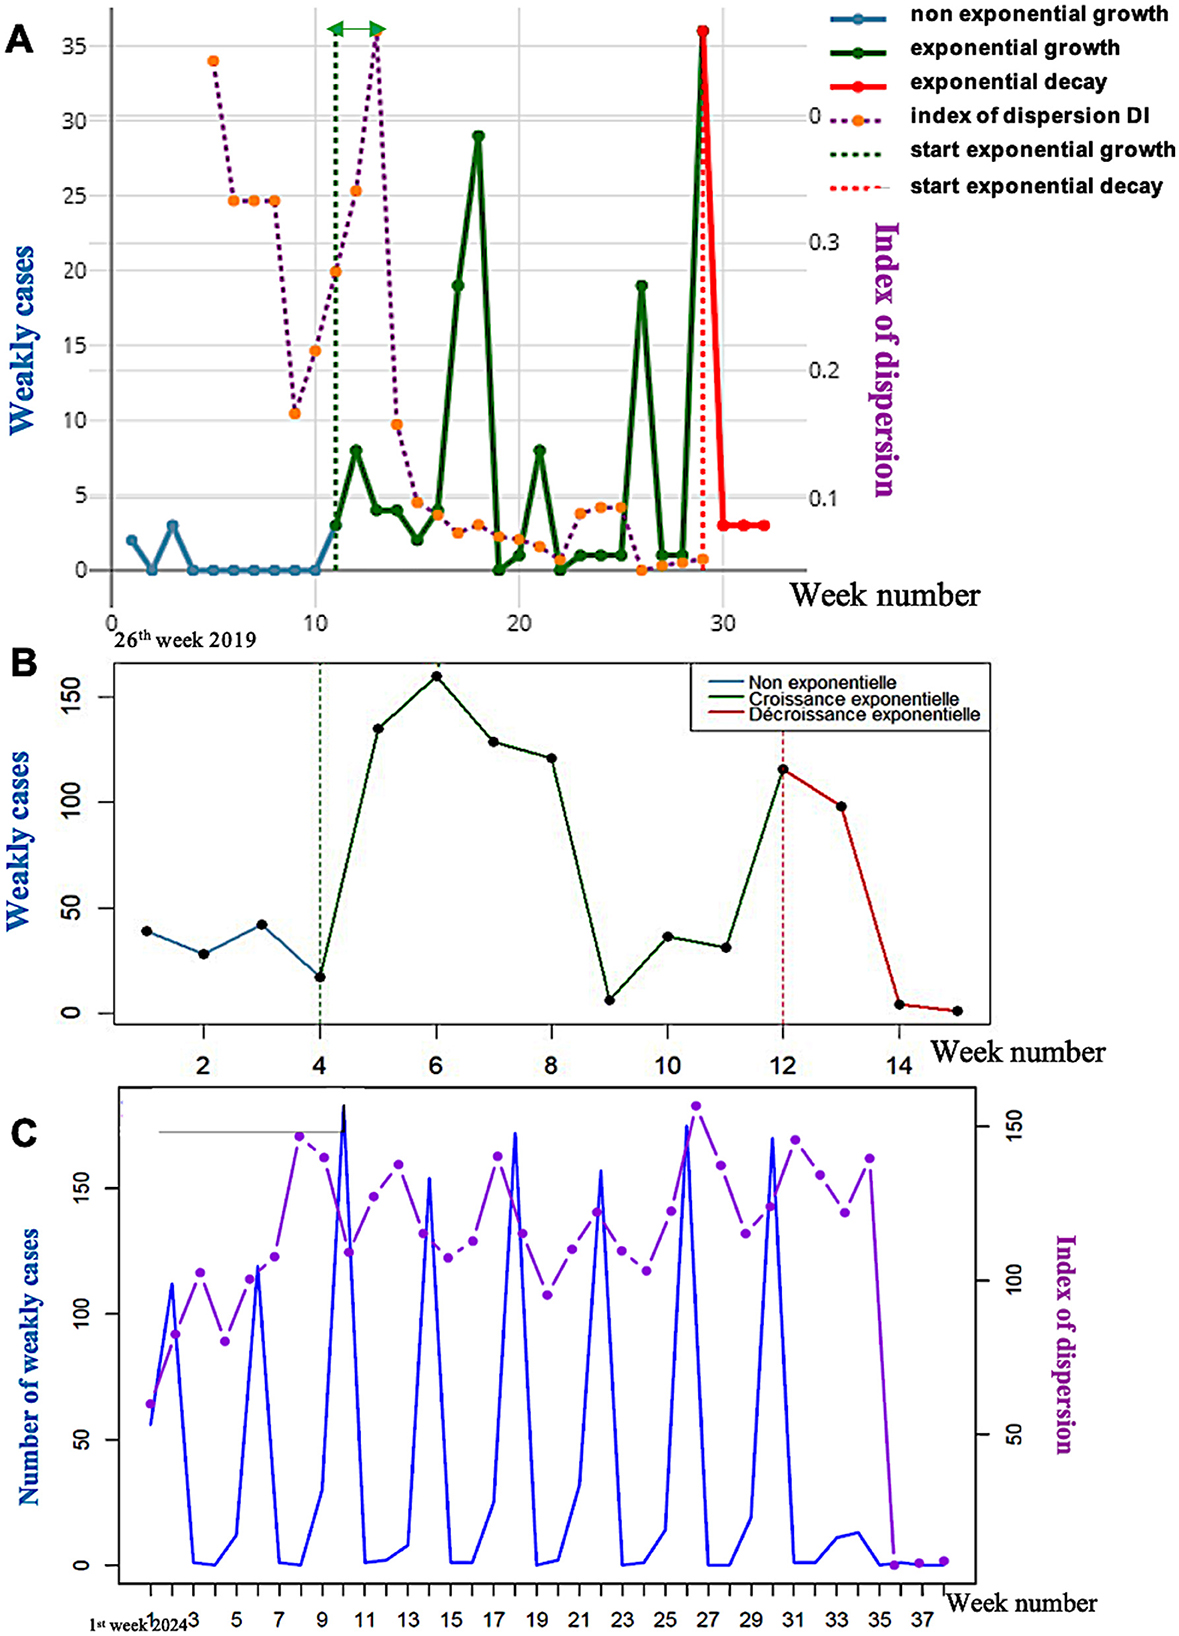
Figure 7. (A) Exponential dynamics of the weakly confirmed new cases of dengue in the French Antilles in 2019 with approximately 2 weeks of anticipation of the KS index significant threshold (green double arrow); (B) Exponential dynamics of the weakly new cases of dengue in 2013 in the French Antilles with approximately 2 weeks of anticipation of the KS index significant threshold (green double arrow); (C) Evolution of weakly new cases of dengue (in blue) and of the dispersion index DI (in violet) calculated on a moving window of 6 weeks in 2024 in the French Antilles.
In Figure 7A, the forecasting of the epidemic peaks by the dispersion index peaks in 2013 in the French Antilles is not very conclusive due to the existence of a shoulder in the first epidemic peak. Nevertheless, the presence of a peak in the DI curve located approximately 3 weeks before the peak of new confirmed cases (Figure 7B) is in favor of a predictive power greater than the empirical variance, which seems more decorrelated from the curve of new cases. In Figure 7C, DI peaks systematically precede the peaks of new confirmed cases, and their anticipation in 2024 by the DI peaks is approximately 2 weeks, but it becomes decorrelated after five peaks.
The interest of the epidemic forecasting lies in the fact that a predictive advantage is related to the ability to organize care logistics before the increase in new cases becomes too significant. Figure 8 shows that mobilization of emergency departments and then of hospital beds is highly correlated with the curve of new confirmed cases. Since the dispersion index curve anticipates the latter, any forecast of a sudden increase in cases allows emergency care personnel to mobilize and hospital staff, responsible for bed logistics, to prepare for the necessary future transfers between clinical services.
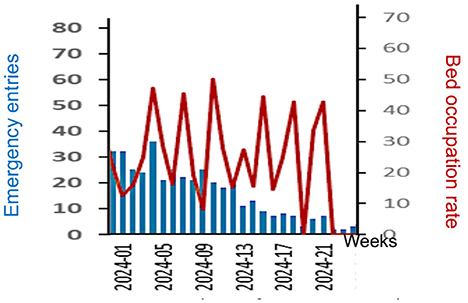
Figure 8. Evolution of weekly new emergency entries of Dengue patients (in blue) and hospital bed occupation rate (red) during the beginning of 2024 in the French Antilles.
3.4 Retro-prediction of epidemic peaks of COVID-19 in Senegal
By using a 10-day rolling window, the peaks of new cases of COVID-19 in Senegal [15], which started in March and October 2020, can be predicted from Figure 9A by the DI curve, which presents a peak reaching its maximum about 3 weeks before the new cases peak.
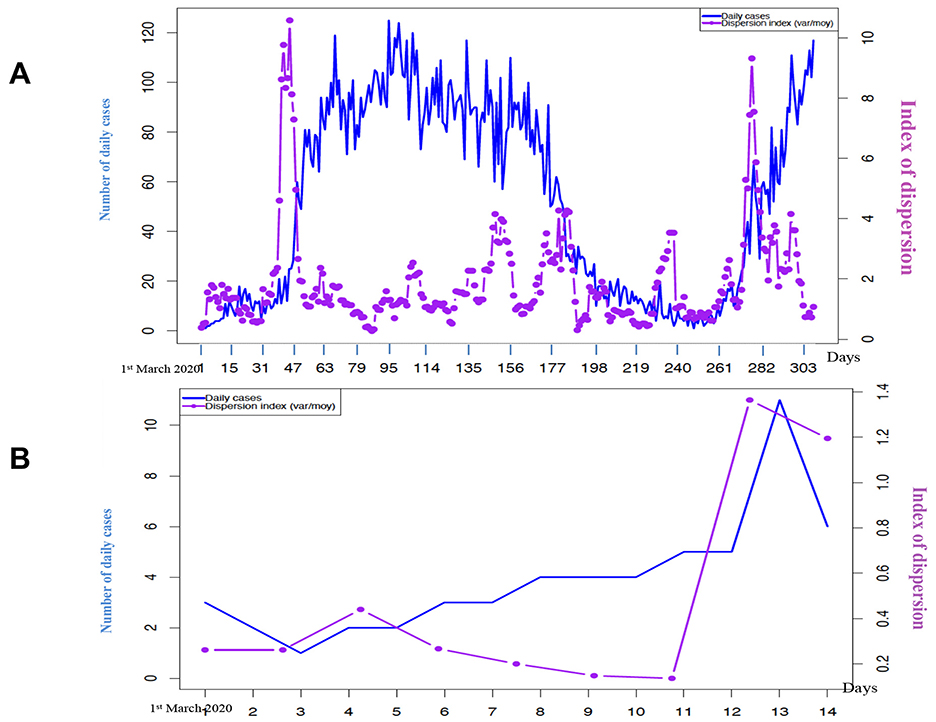
Figure 9. (A) Evolution of weekly new confirmed cases of COVID-19 in Senegal (in blue) and of the dispersion index DI (in violet) calculated on a moving window of 10 days in 2020; (B) Evolution of the confirmed new daily cases of COVID-19 in Senegal (in blue) and of the dispersion index DI (in violet) calculated in a moving window of 7 days (starting on 22 February 2020) during the 15 first days of March 2020.
3.5 Influence of the vaccination
The anticipatory power of the dispersion index can be reinforced by looking at the principal component analysis (PCA) on all the breakdown parameters able to predict the academic peaks (Figure 10), and whose first principal component, PC1, contains DI as the variable having the highest weight:
There is a notable difference between the prediction of an epidemic peak before and after vaccination. Indeed, in Figures 10A, B, on the right, we observe that the anticipation by the dispersion index DI decreases sharply. One explanation for this phenomenon could be the increasing heterogeneity of the population between its unvaccinated part and its part vaccinated one or more times. This phenomenon will be studied more systematically for other countries and other epidemics in a future study.
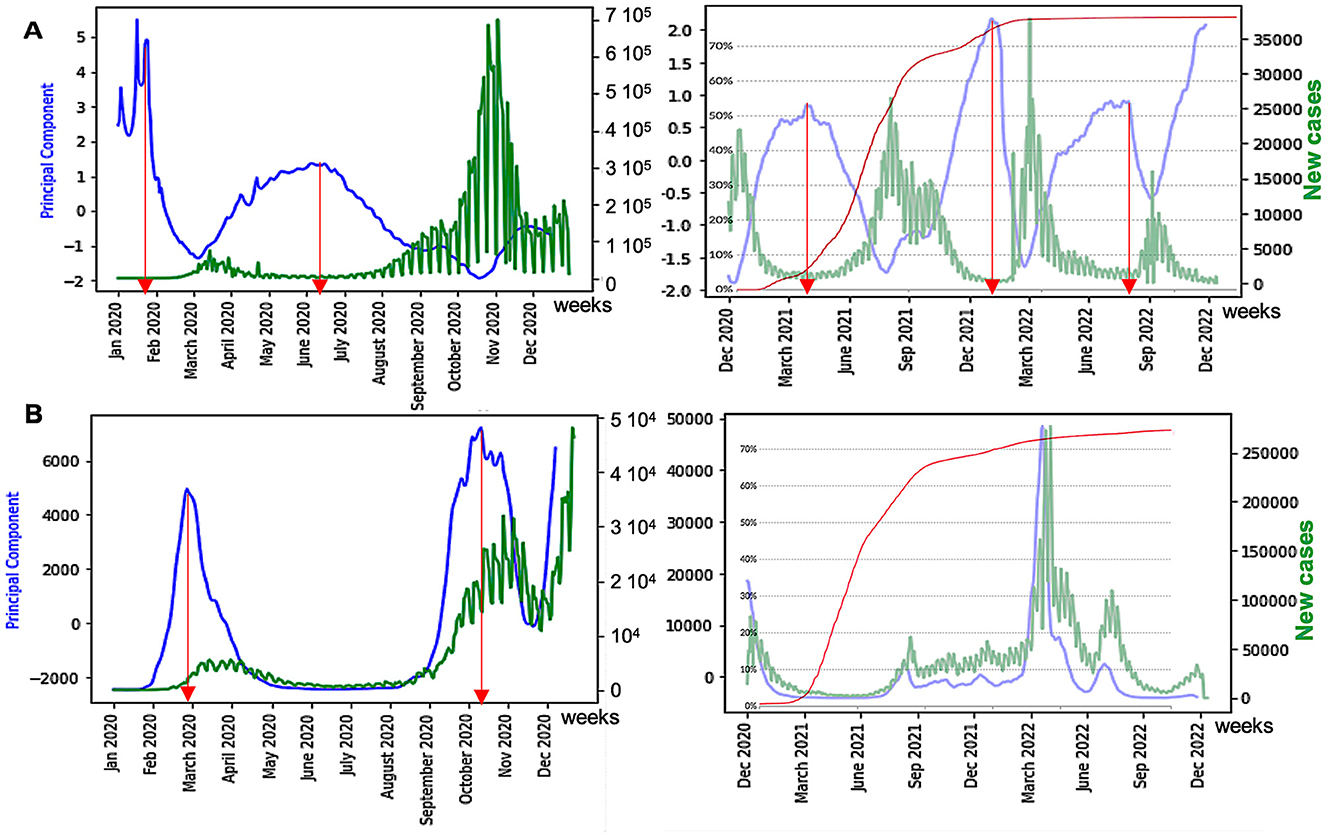
Figure 10. (A) Influence of vaccination on waves of France COVID-19 outbreak, with daily new cases (in green) before (left) and after (right) vaccination, with the percentage of fully vaccinated people superimposed (in red); (B) same as (A) for the United Kingdom. The x-axis represents the time (in months). The red arrows correspond to local maxima of the first principal component curve, and the blue ones represent its inflection points.
4 Discussion
We can explain the behavior of the DI curves in previous examples by considering simple cases of empirical distribution for the random variable N, which is equal to the number of new cases of a contagious disease. In the endemic phase, let us suppose that this distribution is either uniform on the interval [a,b], U(a,b), or Poisson of parameter λ, P(λ) [17].
In the uniform continuous case, DI = (b – a)2/6(b + a) {or DI = [(b – a+1)2 – 1]/6(b + a) in the uniform discrete case}. Then, if a = 0, DI = b/6 and if b starts to increase, DI increases. In the Poisson case, DI = 1 and only a change of distribution type can cause an increase of DI, as in Figure 11, for the epidemic peaks of dengue in 2013 in the French Antilles of dengue in March 2013, and of COVID-19 in April 2020 in Senegal.
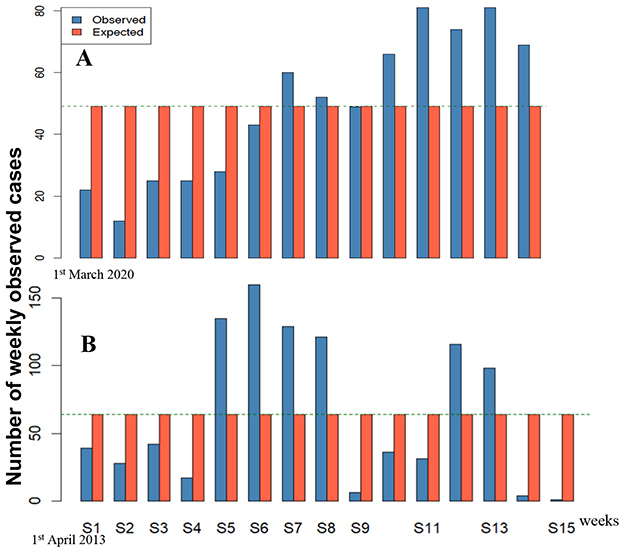
Figure 11. Comparison with a uniform distribution of new weekly cases of (A) COVID-19 in March 2020 in Senegal and (B) dengue in April 2013 in the French Antilles.
In the epidemic peak case, there is a progressive shift from a uniform or Poisson distribution [17] to the geometric one G(p) during the growth, with a change of the value of its parameter p after the inflection of the exponential growth curve. During the transition from the endemic to the epidemic phase, let us suppose that the parameters a and b of the uniform distribution U(a,b) change as follows: a(t) = ekt and b(t) = ek(t+τ), where τ represents the duration of the time window on which the empirical distribution is calculated. If we denote R(t) = b(t)/a(t), we observe in the first exponential phase of growth of the new cases N that R(t) equals ekτ. Then, at the transition between the endemic phase and the epidemic one, if the empirical distribution remains close to the uniform law U(a(t),b(t)), the dispersion index DI(t) increases when τ is large until the following value is obtained:
When the range of new cases value is translated toward high values but keeps the same width, variance remains constant, but expectation increases, and then DI diminishes.
If the empirical distribution becomes geometric G(p) during the first exponential phase of the growth curve of N, DI(t) = 1/p −1, the value is reached before the inflection point of the growth curve of N. In the neighborhood of PI, if the growth of N is quasi-linear, then the empirical distribution is uniform, with R(t) constant. After passing PI, the new cases curve can be represented by the solution of the SI Bernoulli Equation 3, where k is the exponential growth parameter:
where S(0) is the expectation of the susceptible number during the endemic phase. Hence, I(t) progressively saturates at value S(0) and R(t) tends to 1, causing the decrease of DI(t).
In the stochastic case, we can consider the number X(t) of new cases at time t. X(t) is a solution of the Bernoulli equation having an additional noise W(t) of mean 0 and variance σ.
At the transition between endemic and epidemic states, DI = V/E = σ2/X(t) increases because E remains constant and V increases due to the widening of the range of values of W. Then, DI(t) decreases before the peak because X(t) increases, with the width of the range of its values remaining constant. In any case (stochastic or deterministic), the temporal behavior of DI(t) corresponds to a peak of the dispersion index curve with a maximum before the inflection point of the new cases curve, and then the dispersion peak anticipates the epidemic one.
We used data from one of the most reliable and comprehensive database available (Worldometer) based solely on official data from the ministries of health of worldwide countries and practically identical to the WHO peer reviewed data, and we observed no differences in our work between models based on data from countries with highly organized health surveillance systems (France, the United Kingdom, and the USA) and data from emerging/developing countries (Brazil, Senegal), which leads us to believe that the impact of delayed or missing data on the quality of the demonstration remains moderate or even modest. Many other forecasting methods have been proposed. For example, on data from the COVID-19 pandemic in France, functional estimation or ARIMA (Autoregressive Integrated Moving-Average model) predictions allow extrapolation over a week [18], but with generally underestimated results (Figure 12A). Neural networks, for example, deep learning methods, such as GRU (Gated Recurrent Unit), have also been used, often with an underestimation at the boundary between the endemic phase and the epidemic phase (Figure 12B) due to the weight of endemic data in the learning process near the boundary [19]. In the cases cited above, the prediction by the dispersion index DI is earlier (Figure 10A), even if it does not give a precise indication of the magnitude of the predicted epidemic peak.
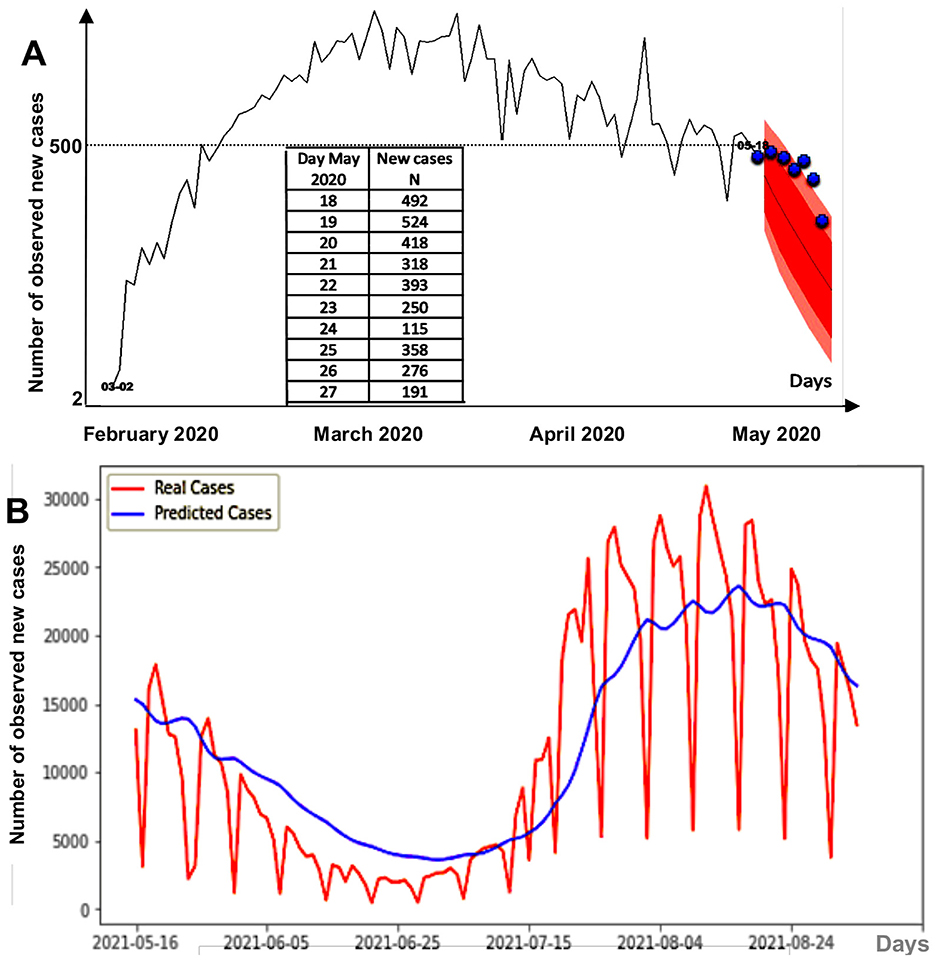
Figure 12. (A) 1 week forecast during the first COVID-19 peak in France. Pink regions correspond to the 90%- (red) and 95%- (pink) confidence sets for the predicted new cases, and the blue points correspond to real observed cases. (B) GRU deep learning forecasting method for daily new cases between 16/05/2021 and 24/08/2021 in France.
One limitation of this study is that it is based on official data that is sometimes affected by changes in health policies (recommendations, monitoring indicators, data collection methods, etc.), but we believe that the impact on the quality of the demonstration remains moderate or even modest. This gives us the opportunity to point out that the basic principles of health surveillance and intervention epidemiology are not always respected by the experts and institutions that should be ensuring compliance, especially in crises. Indeed, it is during health crises that we must be most rigorous in applying methods and best practices so as not to add confusion to contextual uncertainties, regardless of the pressures of any kind that may be exerted (political, economic, etc.).
5 Conclusion and perspectives
We have described a method for predicting the occurrence of epidemic peaks after endemic periods based on surveillance of new disease cases. Other approaches are possible, including those using Web traffic data [20] (Figure 13) and disease vector (e.g., Aedes albopictus) surveillance [18, 19, 21, 22] (Figure 14).
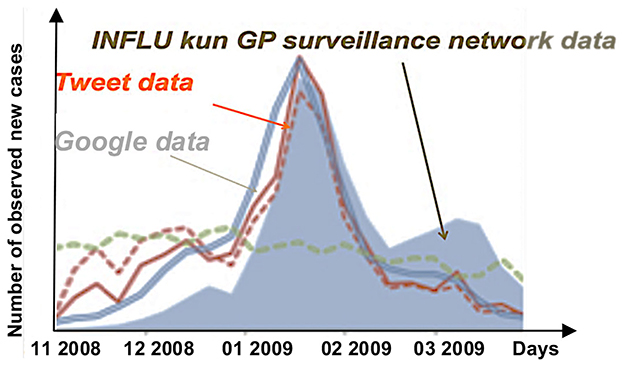
Figure 13. Comparison between curves of the number of reports by general practitioners (GPs) of influenza cases in Japan (gray), the number of tweets reporting influenza cases (red), and the number of Google accesses to query information on influenza.
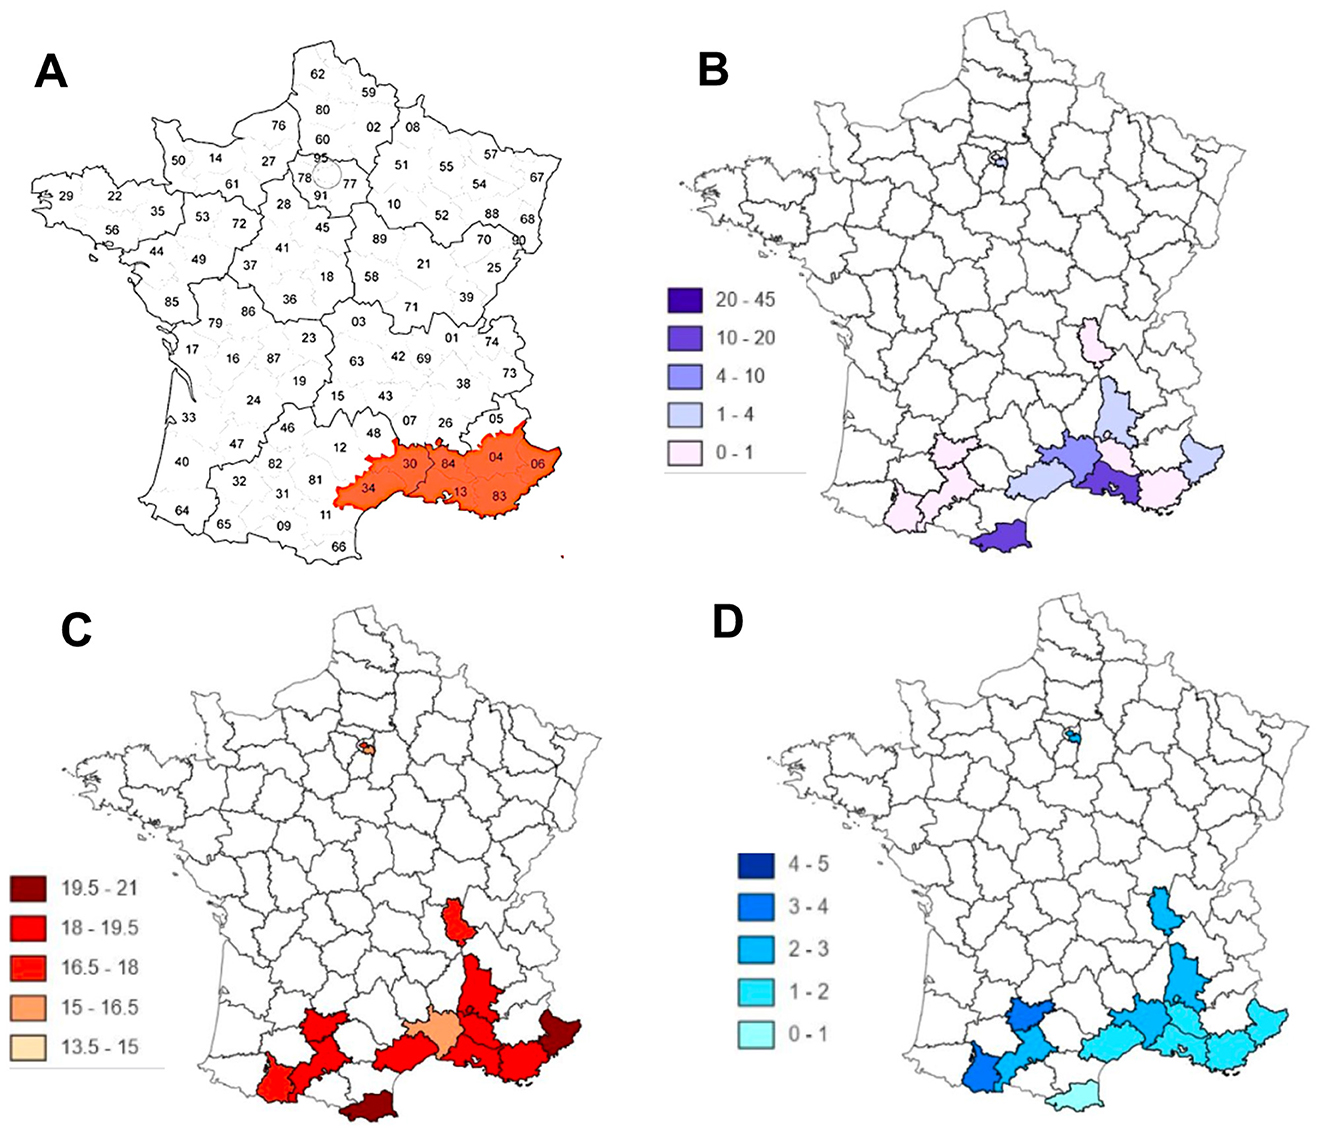
Figure 14. Comparison between (A) the French departments in which Aedes albopictus appeared in 2011 [21]; (B) the occurrence of cases of Dengue, Zika, and Chikungunya [22]; (C) mean annual temperature; (D) rainfall level.
In the case of the Web traffic data, it can be noted that despite the effectiveness of the INFLU kun sentinel network of general practitioners in Japan, the existence of alerts, which anticipate the occurrence of a flu epidemic by a few days, is based on the number of tweets concerning the exchange of information on the Web between potential patients [19]. Concerning the surveillance of a possible vector of the disease, such as the tiger mosquito Aedes albopictus (in the case of the diseases it carries, such as the dengue, the zika, and the chikungunya [23–27]), combined with the monitoring of geo-climatic factors favoring the reproduction of the vector, the anticipation time interval is important, but less reliable, given the very long delay in the constitution of a reservoir of infected hosts large enough for the vector to become very infectious. In this case, the surveillance of the chronic endemic cases remains an excellent means of predicting the occurrence of epidemic peaks. Combined with global monitoring of web traffic by searching for keywords exchanged concerning the disease, but without intrusion into individual exchanges, the dispersion index method proposed in this article could be a good tool for predicting outbreaks of infectious diseases, such as COVID-19. The monitoring of epidemic aftershocks, which remain, is a major public health challenge.
Data availability statement
Publicly available datasets were analyzed in this study. This data can be found here: https://www.worldometers.info/coronavirus/.
Author contributions
JD: Conceptualization, Data curation, Formal analysis, Funding acquisition, Investigation, Methodology, Project administration, Resources, Software, Supervision, Validation, Visualization, Writing – original draft, Writing – review & editing. HO: Data curation, Formal analysis, Investigation, Methodology, Software, Validation, Writing – review & editing. MD: Conceptualization, Investigation, Methodology, Resources, Validation, Writing – review & editing. LG-L: Conceptualization, Formal analysis, Investigation, Methodology, Validation, Writing – original draft, Writing – review & editing.
Funding
The author(s) declare that no financial support was received for the research and/or publication of this article.
Acknowledgments
The authors thank Pierre Magal and Kayode Oshinubi for their many helpful discussions and advice.
Conflict of interest
The authors declare that the research was conducted in the absence of any commercial or financial relationships that could be construed as a potential conflict of interest.
Generative AI statement
The author(s) declare that no Gen AI was used in the creation of this manuscript.
Any alternative text (alt text) provided alongside figures in this article has been generated by Frontiers with the support of artificial intelligence and reasonable efforts have been made to ensure accuracy, including review by the authors wherever possible. If you identify any issues, please contact us.
Publisher's note
All claims expressed in this article are solely those of the authors and do not necessarily represent those of their affiliated organizations, or those of the publisher, the editors and the reviewers. Any product that may be evaluated in this article, or claim that may be made by its manufacturer, is not guaranteed or endorsed by the publisher.
References
1. Jones DS, Podolsky SH, Greene JA. The burden of disease and the changing task of medicine. N Engl J Med. (2012) 366:2333–8. doi: 10.1056/NEJMp1113569
2. Dawood FS, Iuliano AD, Reed C, Meltzer MI, Shay DK, Cheng PY, et al. Estimated global mortality associated with the first 12 months of 2009 pandemic influenza A H1N1 virus circulation: a modelling study. Lancet Infect Dis. (2012) 12:687–95. doi: 10.1016/S1473-3099(12)70121-4
3. Bernoulli D. Essai d'une nouvelle analyse de la mortalité causée par la petite vérole, et des avantages de l'inoculation pour la prévenir. Paris: Histoire et Mémoires de l'Académie Royale des Sciences de Paris (1760, 1766), 1–45.
4. d'Alembert J. Onzième Mémoire: sur l'application du calcul des probabilités à l'inoculation de la petite vérole; notes sur le mémoire précédent; théorie mathématique de l'inoculation In Opuscules mathématiques. Paris: David (1761).
5. Ross R. An application of the theory of probabilities to the study of a priori pathometry. Proc R Soc Series A. (1916) 92:204–30. doi: 10.1098/rspa.1916.0007
6. McKendrick AG. Applications of mathematics to medical problems. Proc Edinburgh Math Soc. (1925) 44:1–34. doi: 10.1017/S0013091500034428
7. Griette Q, Demongeot J, Magal P. A robust phenomenological approach to investigate COVID-19 data for France. Math Appl Sci Eng. (2021) 3:149–60. doi: 10.5206/mase/14031
8. Demongeot J, Magal P. Data-driven mathematical modeling approaches for COVID-19: a survey. Phys Life Rev. (2024) 50:166–208. doi: 10.1016/j.plrev.2024.08.004
9. Oshinubi K, Al-Awadhi F, Rachdi M, Demongeot J. Data analysis and forecasting of COVID-19 pandemic in Kuwait. Kuwait J Sci. (2021) 9:1–28. doi: 10.1101/2021.07.24.21261059
10. Waku J, Oshinubi K, Adam UM, Demongeot J. Forecasting the endemic/epidemic transition in COVID-19 in some countries: influence of the vaccination. Diseases. (2023) 11:135. doi: 10.3390/diseases11040135
11. Demongeot J, Magal P, Oshinubi K. Forecasting the frontier between endemic and epidemic states of a contagious disease, with example of COVID-19. Math Med Biol: J IMA. (2024) 42:dqae012. doi: 10.1093/imammb/dqae012
14. Kolmogorov A. Sulla determinazione empirica di una legge di distribuzione. Giornale dell'Istituto Italiano degli Attuari. (1933) 4:83–91.
15. Worldometer. Available online at: https://www.worldometers.info/coronavirus/ (Accessed May 10, 2025).
16. Santé Publique Antilles. Available online at: https://www.santepubliquefrance.fr/ (Accessed May 10, 2025).
17. Aramaki E, Maskawa S, Morita M. Twitter catches the flu: detecting influenza epidemics using Twitter. In:Merlo P, , editor. EMNLP 2011 (Empirical Methods on Natural Language Processing). Stroudsburg: ACL (2011). p. 1568–76.
18. Demongeot J, Oshinubi K, Rachdi M, Hobbad M, Alahiane M, Iggui S, et al. The application of ARIMA model to analyse COVID-19 incidence pattern in several countries. J Math Comput Sci. (2022) 12:10. doi: 10.28919/jmcs/6541
19. Li Y, Su X, Zhou G, Zhang H, Puthiyakunnon S, Shuai S, et al. Comparative evaluation of the efficiency of the BG-Sentinel trap, CDC light trap and Mosquito-oviposition trap for the surveillance of vector mosquitoes. Parasit Vect. (2016) 9:446. doi: 10.1186/s13071-016-1724-x
20. Hilton J, Hall I. A beta-Poisson, model for infectious disease transmission. PLoS Comput Biol. (2024) 20:e1011856. doi: 10.1371/journal.pcbi.1011856
21. Liu QM, Gong ZY, Wang Z. A review of the surveillance techniques for Aedes albopictus. Am J Trop Med Hyg. (2022) 108:245–51. doi: 10.4269/ajtmh.20-0781
22. Acero-Sandoval MA, Palacio-Cortés AM, Navarro-Silva MA. Surveillance of Aedes aegypti and Aedes albopictus (Diptera: Culicidae) as a method for prevention of arbovirus transmission in urban and seaport areas of the Southern Coast of Brazil. J Med Entomol. (2023) 60:73–184. doi: 10.1093/jme/tjac143
23. Oshinubi K, Ibrahim F, Rachdi M, Demongeot J. Functional data analysis: application to daily observation of COVID-19 prevalence in France. AIMS Math. (2022) 7:5347–85. doi: 10.3934/math.2022298
24. Waku J, Oshinubi K, Demongeot J. Maximal reproduction number estimation and identification of transmission rate from the first inflection point of new infectious cases waves: COVID-19 outbreak example. Math Comput Simul. (2022) 198:47–64. doi: 10.1016/j.matcom.2022.02.023
25. Pasteur. Répartition du moustique tigre (Aedes albopictus) en France métropolitaine de 2004 à 2022. Available online at: https://www.youtube.com/watch?v=5WpCdLV5Yfs (Accessed June 8, 2025).
26. Santé Publique France. Available online at: https://www.santepubliquefrance.fr/maladies-et-traumatismes/maladies-a-transmission-vectorielle/chikungunya/articles/donnees-en-france-metropolitaine (Accessed June 8, 2025).
27. Isere. Available online at: https://www.isere.gouv.fr/Actualites/Actualites/Chikungunya-point-de-situation-en-Isere (Accessed September 1, 2025).
Keywords: epidemic forecasting, COVID-19, dengue, endemic/epidemic transition, outbreakmodelling, empirical distribution, index of dispersion
Citation: Demongeot J, Ouangko HA, Diarra M and Gofti-Laroche L (2025) Forecasting epidemic peaks with the index of dispersion of new cases. Front. Appl. Math. Stat. 11:1670077. doi: 10.3389/fams.2025.1670077
Received: 21 July 2025; Accepted: 09 October 2025;
Published: 04 November 2025.
Edited by:
Khalid Hattaf, Centre Régional des Métiers de l'Education et de la Formation (CRMEF), MoroccoReviewed by:
Arindam Fadikar, Argonne National Laboratory (DOE), United StatesJanet Agbaje, Oak Ridge City School District, United States
Copyright © 2025 Demongeot, Ouangko, Diarra and Gofti-Laroche. This is an open-access article distributed under the terms of the Creative Commons Attribution License (CC BY). The use, distribution or reproduction in other forums is permitted, provided the original author(s) and the copyright owner(s) are credited and that the original publication in this journal is cited, in accordance with accepted academic practice. No use, distribution or reproduction is permitted which does not comply with these terms.
*Correspondence: Jacques Demongeot, amFjcXVlcy5kZW1vbmdlb3RAdW5pdi1ncmVub2JsZS1hbHBlcy5mcg==