 Ozge Demirkale
 Naime Irem Duran2
 Onur Seyranlioglu
- 1Istanbul Aydin University, Faculty of Economics and Administrative Sciences, Department of Business Administration, Istanbul, Türkiye
- 2Beykent University, Faculty of Economics and Administrative Sciences, Department of Capital Markets, Istanbul, Türkiye
- 3Econometrician/Independent Researcher, Malatya, Türkiye
- 4Giresun University, Faculty of Economics and Administrative Sciences, Department of Business Administration, Giresun, Türkiye
This study aims to examine the effects of FinTech development and financial inclusion on green growth in ASEAN-5 countries (Indonesia, Malaysia, the Philippines, Singapore, and Thailand) over the period 1995–2023. Using PMG, Panel FMOLS, and Panel DOLS estimators alongside wavelet coherence analysis, we investigate both the individual and interaction-based impacts of FinTech and financial inclusion. PARDL-PMG, Panel DOLS and Panel FMOLS results indicate that FinTech development and financial inclusion each exert a significant positive effect on green growth. At the same time, their interaction term highlights the complementary benefits of an inclusive digital financial (DF) ecosystem. Dumitrescu–Hurlin causality tests confirm a bidirectional relationship between green growth and the FinTech–inclusion interaction, as well as a unidirectional causality running from FinTech to green growth. Wavelet coherence analyses reveal particularly strong time–frequency co-movement patterns in Singapore, Indonesia, and the Philippines. Overall, the results suggest that digital financial ecosystems can support green growth, provided that targeted policies address structural asymmetries. This study fills a gap in the literature as the first comprehensive analysis of the long-run, time–frequency effects of the FinTech–financial inclusion interaction in the ASEAN-5 region. Given the contribution of digital financial systems to green growth, it is essential that policymakers develop inclusive, coherent, and structurally sensitive digital finance policies in order to fully realize this potential. These findings imply that policymakers should design inclusive digital-finance frameworks that balance innovation with sustainability.
JEL Classification: O16, Q56, G21, C33.
1 Introduction
The relationships among financial inclusion, FinTech, and green growth have emerged as a critical focus of academic research due to their potential to simultaneously support sustainable economic development and promote environmental improvement [1, 2]. In this context, financial inclusion is defined as the ability of individuals and businesses to access secure, affordable, and accessible financial products and services—such as transactions, payments, savings, credit, and insurance—that meet their needs. When delivered in an ethical and sustainable manner, these services can enhance financial wellbeing and support economic growth [3, 4]. Although financial inclusion is vital for promoting economic growth and social equity, systemic risks and digital divides pose challenges to ensuring universal access to these services [5–7]. Common obstacles include geographical constraints, low financial literacy, and limited access to digital financial (DF) services. Many individuals remain unbanked or underbanked, relying instead on alternative financial services. At this point, FinTech emerges as a transformative force in expanding access to financial services and plays a critical role in promoting financial inclusion through effective policy frameworks and the participation of diverse financial institutions [3, 8]. In other words, FinTech refers to the use of computers and related digital technologies in financial services, fundamentally reshaping the functioning of traditional financial institutions [9]. Innovations such as blockchain-based transactions, AI-driven risk assessments, digital banking applications, and mobile payment systems have transformed the operations of traditional financial institutions and significantly influenced their profitability, risk profiles, and market stability [10–12]. All these developments demonstrate that financial inclusion and FinTech not only impact economic and social prosperity but may also play a critical role in supporting environmental sustainability and achieving green growth objectives [13–17]. Over the past few decades, significant increases in greenhouse gas emissions and other forms of pollution have prompted shifts in the global economic growth narrative. At the same time, various technological developments have been recorded that positively impact the environment by reducing emissions, preventing pollution, and decreasing energy consumption and waste generation. This trajectory has led to the concept of green growth, defined as “the process of transition toward a low-carbon and resource-efficient society with economic development that safeguards the functioning of ecosystems and enhances human wellbeing and social equality” [1, 18].
Rising environmental risks at the global level have elevated the concept of green growth to a central position within economic development strategies. Traditional growth models, which often neglect environmental constraints, have contributed to ecological degradation, thereby hindering progress toward sustainable development goals. The needs of the present moment call for comprehensive strategies designed to curb the ecological impacts of economic activity. For emerging economies, steering growth onto a “green” trajectory is indispensable not only for safeguarding natural systems but also for broadening economic participation through digitalisation, expanded financial access, and technological innovation. Against this backdrop, the rapid diffusion of financial-technology solutions and the widening reach of financial services have come to occupy a central position in the scholarly and policy debate on sustainable development [19, 20].
Financial-technology solutions, grounded in ongoing advances in digital innovation, streamline financial intermediation while opening new avenues for eco-conscious investment, the trading of carbon credits, and cost-effective green finance [21, 22]. Recent studies report tangible sustainability gains tied to digital payment networks, online investment platforms, and peer-to-peer lending tools [19, 23]. These benefits arise through multiple pathways: FinTech encourages clean-tech R&D, speeds up the shift to low-carbon energy sources, and lessens information asymmetries in green-finance markets [24, 25]. Nevertheless, another line of research cautions that the rapid expansion of FinTech can, at least initially, elevate resource use and emissions by fuelling economic activity [26, 27].
Expanding access to formal finance can also serve as a catalyst for environmentally oriented investment. When households and firms are able to tap regulated savings products, credit lines, and insurance on equitable terms, the financial hurdles to launching or adopting green projects fall markedly [28, 29]. This is especially game-changing for lower-income groups, who can draw on affordable funding to acquire clean technologies or start eco-friendly businesses. Empirical work finds that, given a supportive policy environment, broader financial outreach is linked to faster uptake of renewables and better ecological indicators [17, 30]. Yet other studies raise red flags: if credit growth runs ahead of effective oversight, spending-driven surges in activity can lift energy use and CO2 emissions, eroding sustainability gains [31, 32]. Overall, the evidence implies that the green payoff from financial inclusion depends heavily on a country's regulatory architecture, the design of inclusion tools, and the quality of governance.
Recent scholarship has begun to zero in on how digitally delivered financial services influence environmentally sustainable development. Case studies from China, for example, show that digital-inclusive finance encompassing mobile payments, online lending, and data-driven insurance can stimulate green growth by fuelling innovation, fostering entrepreneurship, and accelerating industrial upgrading [16, 17, 33]. By contrast, the evidence for more traditional forms of financial inclusion is patchier, with outcomes differing widely across regions and institutional contexts. Consequently, a clear gap remains: few studies treat FinTech expansion and broadened financial access as interlinked facets of the digital transition and assess their joint impact on sustainability goals.
Spanning 1995–2023, this investigation probes how two facets of the digital financial revolution FinTech expansion and broadened financial outreach have influenced environmentally minded growth in Indonesia, Malaysia, the Philippines, Singapore and Thailand (the ASEAN-5). Over these years, smartphones, e-wallets and app-based lending have redrawn the financial landscape, promising to democratize capital flows and lower the cost of green investment. Yet their ecological footprint remains uncertain. The same nations contend with intensifying climate risks and resource bottlenecks, underscoring the need for creative mechanisms such as digitally delivered green finance that can reconcile development with environmental stewardship. Against a backdrop of the Asian and global financial crises, the COVID-19 shock and tightening climate policies, we employ panel techniques to gauge whether the twin forces of FinTech proliferation and financial inclusion have measurably shifted sustainability indicators across the bloc [28, 34–38]. In terms of FinTech and financial inclusion indicators, ASEAN-5 countries provide long-term, comprehensive, and internationally comparable data, while also constituting the majority of the region's GDP and serving as the main backbone of its digital financial ecosystem [39–42]. For the other five ASEAN members (Brunei, Cambodia, Laos, Myanmar, and Vietnam), FinTech development and financial inclusion indicators are not particularly suitable for long-term and international comparison. A consistent and complete dataset covering a long period such as 1995–2023 is accessible only for the ASEAN-5 countries. In particular, in the strategic documents of the ASEAN Secretariat, these five countries are predominantly referenced as the leading nations in the integration of FinTech and sustainability [43]. Therefore, analyses conducted on the ASEAN-5 can serve as a guiding framework for the region in terms of policy implications. Focusing the analyses on this core group of countries thus provides the most suitable framework in terms of both methodological consistency and policy applicability.
This study investigates the impact of FinTech development and financial inclusion on green growth across ASEAN-5 economies over the period 1995–2023. The period 1995–2023 is chosen as the most suitable starting point for long-term and comparable analyses due to limited data availability prior to 1995. Although early FinTech adoption was limited, the data reliably capture the long-term dynamics of financial inclusion and macroeconomic shocks on green growth. In the baseline empirical specification, green growth is designated as the dependent variable, while FinTech, financial inclusion, and their interaction term (FinTech × financial inclusion) are incorporated as the key explanatory variables. To account for macroeconomic and environmental dynamics, foreign direct investment, renewable energy consumption, and inflation are included as control variables. The empirical strategy employs the Westerlund [44] Durbin–Hausman panel cointegration test, the PARDL-PMG estimator, Panel FMOLS and Panel DOLS estimators, the Dumitrescu-Hurlin panel causality test, and wavelet-based analysis. In line with the empirical scope and theoretical framework of this study, the following five core research questions have been developed to investigate the effects of FinTech and financial inclusion on green growth in ASEAN-5 countries using a multidimensional approach:
• Research Question 1: To what extent does the development of digital financial technologies impact green growth in ASEAN-5 countries?
• Research Question 2: Can financial inclusion effectively promote green growth in the ASEAN-5 region?
• Research Question 3: Does the interaction between FinTech development and financial inclusion generate a composite and synergistic effect on green growth?
• Research Question 4: Is there a causal relationship between FinTech development, financial inclusion, and green growth?
• Research Question 5: Do the effects of the interaction between FinTech development and financial inclusion on green growth vary across countries, and do these effects exhibit variability over time and frequency domains?
These research questions provide a holistic analytical framework aimed at understanding the impacts of digital financial transformation on environmental sustainability at both temporal and structural levels.
Given the possibility of bidirectional linkages between FinTech development, financial inclusion, and green growth, the study employs causal and time–frequency approaches to provide a comprehensive understanding of these relationships. While the long-run estimators (PMG, FMOLS, and DOLS) capture equilibrium associations, the causality framework identifies directional dynamics across horizons. Furthermore, the wavelet coherence analysis allows us to explore scale-dependent interactions that may vary across short-, medium-, and long-term cycles, thereby uncovering how synchronization between financial and environmental dynamics evolves over time.
The remainder of this paper is structured as follows: the second section presents the theoretical framework focusing on the relationship between FinTech development, financial inclusion, and green growth. In this context, it provides a comprehensive review of recent empirical studies in the literature, clearly identifies the research hypotheses, and highlights the existing research gap. The third section introduces the dataset used in the analysis, defines the variables, and explains the econometric methods in detail. The fourth section is dedicated to the presentation and evaluation of the empirical findings. In the fifth section, a comparative discussion is conducted in light of the obtained results and relevant literature. Finally, the sixth section summarizes the main findings of the study, evaluates the validity of the hypotheses, offers policy recommendations, discusses the study's limitations, and provides directions for future research.
2 Theoretical background, literature, and hypotheses
2.1 The impact of Fintech development on green growth
All scientific, technological, financial, and commercial processes necessary for the development of new products and services are considered within the scope of innovation [45]. The theorist Schumpeter, who introduced the concept of creative destruction, was among the first to emphasize technological progress as a determining factor in economic processes. According to Schumpeter, the main driving force of economic growth is the entrepreneur introducing new combinations through innovation, thereby dismantling the existing economic structure and replacing it with a more advanced one [46]. The role of technology in driving growth in the modern economics literature is largely based on the work of Robert Solow. Solow's theoretical growth model explains growth through physical inputs such as labor and capital, as well as a variable that reflects technological change [47]. Inspired by Solow, another line of research explores the relationship between finance and growth. Empirically, the works of researchers such as Ross Levine and Sara Zervos provide consistent evidence that financial markets offer crucial services that enhance a country's long-term economic growth [48]. In this context, all elements that make the financial system more efficient, improve the flow of information, and enhance payment mechanisms can be defined as financial innovation [49–51]. Today, technology is fundamentally transforming how the financial sector operates, leading to the widespread use of the term “financial technology” or simply “FinTech.” The term “financial technology” has existed for nearly 50 years and was likely first used in a research report published by Hanover Trust in 1972 [52]. Within this framework, FinTech is a structure born from the convergence of finance and technology, and it also represents a form of technological innovation. Emerging evidence indicates that financial-technology platforms have begun to act as engines of sustainable growth [22]. By streamlining intermediation and trimming transaction frictions, these digital systems are now viewed as practical tools for advancing environmental objectives [53]. They can, for example, channel funds into renewable-energy projects, facilitate electronic carbon-credit trading and enlarge the overall flow of climate-finance capital [54]. Because FinTech solutions lower borrowing costs and ease information bottlenecks, they widen access to affordable funding and broaden the menu of green investment opportunities for firms and households alike [55–57]. Taken together, these features position FinTech as a pivotal driver of green finance helping to bridge financing gaps for environmentally innovative projects by making credit cheaper and capital allocation more transparent [58].
Wu et al. [19] used machine-learning algorithms on a panel of 287 Chinese cities (2011–2021) to explore how digital-finance expansion shapes environmentally sustainable development. They conclude that FinTech growth strengthens inclusive green growth, with the largest benefits appearing in digital payments, investment services and credit provision. These gains arise because FinTech deepens employment in financial services, broadens the supply of capital and spurs eco-oriented technological innovation. Lou and Li [59] examined the impact of gold, silver, and oil prices along with FinTech on green growth in E-7 countries (Brazil, China, India, Indonesia, Mexico, Russia, and Türkiye) using the Method of Moments Quantile Regression (MMQR). The results indicated that FinTech improves the traditional economic cycle and promotes green growth. Li et al. [60] investigated the effects of FinTech, renewable energy production, and natural resource utilization on environmental sustainability in Belt and Road Initiative countries. Using CS-ARDL models and data from 1990 to 2020, they found that FinTech development positively influences carbon emission reduction by lowering the cost of financial services and increasing financial inclusion. Aziz et al. [21] analyzed the impact of FinTech on green growth in China by using energy transition as a mediating variable. The study revealed that FinTech enhances green growth both directly and indirectly by supporting energy transition. Drawing on panel data for 25 EU member states over 1990–2020, Ahmad et al. [24] show that wider FinTech adoption fosters the shift to clean energy, which in turn helps shrink countries' ecological footprints. Using province-level information for China (2011–2021), Xu et al. [61] report that FinTech progress bolsters green-finance activity largely by raising financial-sector efficiency and stimulating eco-innovation with the strongest gains occurring in regions that already possess deeper financial markets. Firm-level evidence from the Shanghai and Shenzhen exchanges (2013–2023) presented by Ren and Han [23] indicates that companies integrating FinTech more intensively tend to invest more in green technologies and, as a result, chart superior trajectories for environmentally adjusted productivity. Complementing these findings, Huang [25] employs a Quantile ARDL framework for China (1995-2021) and concludes that FinTech advances enhance the efficient use of natural resources, widen trade openness, and strengthen recycling and waste-management performance across both short and long horizons. Xu et al. [62], in a study covering the 2000-2022 period, used data from CIVETS countries (Colombia, Indonesia, Vietnam, Egypt, Türkiye, and South Africa) to analyze whether natural resource abundance promotes economic growth using next-generation methods such as CUPFM (Cross-sectionally Augmented Panel Fully Modified) and CUPBC (Cross-sectionally Augmented Panel Bias Corrected). Their findings revealed that digitalization and FinTech development contribute to reducing carbon emissions. Liu and You [63], using data from publicly listed polluting companies from 2012 to 2021, found that FinTech positively affects the development of green credit by reducing information asymmetry and improving credit allocation efficiency. Nenavath and Mishra [64] conducted a study using 2010–2021 data from Indian states and applied the two-step Generalized Method of Moments (GMM) to analyze the contribution of FinTech and green finance to sustainable economic growth. Their results indicated that FinTech supports green finance and contributes to environmental protection. Udeagha and Muchapondwa [65], using 1990–2020 data from BRICS countries, found support for the Environmental Kuznets Curve (EKC) hypothesis and concluded that green finance, FinTech, and energy innovation promote environmental sustainability. Wei [66] emphasized that FinTech development in China improves green economic efficiency and showed that FinTech integrated with mobile internet and big data enhances environmental efficiency. Zhou et al. [22], using provincial panel data from China for the 2011–2018 period, examined the effects of FinTech and green finance on green growth. Their results demonstrated that both FinTech and green finance significantly promote green economic growth. Some studies in the literature, however, suggest that FinTech may have varying effects on green growth indicators. For instance, Razzaq et al. [26], using Structural Equation Modeling with data from 81 countries, found that while FinTech promotes economic growth, it also increases CO2 emissions, thereby reducing environmental quality. These results highlight the challenge of balancing technological and economic advancements with environmental sustainability. Topaloglu et al. [27] using ARDL bounds testing with data from Türkiye between 2005 and 2023, found that FinTech development has a positive short-term effect but a negative long-term impact on the environment. Megat et al. [67] surveyed 247 respondents in Malaysia and found that FinTech factors such as green finance and green investment significantly impact green growth sustainability. However, blockchain-based smart contracts were found to play no significant role in the relationship between FinTech factors and green growth sustainability.
The findings from the empirical literature reveal that FinTech development supports green growth and environmental sustainability through both direct and indirect channels. In particular, FinTech has shown positive environmental impacts through mechanisms such as enabling green finance, accelerating energy transition, promoting technological innovation, and enhancing financial inclusion. However, some studies also indicate that FinTech may trigger negative environmental consequences by accelerating economic growth, highlighting the potential for FinTech to exert dual effects. Based on this context and the relevant literature, the following hypothesis is tested in this study:
H1: FinTech development has a positive and significant effect on green growth in ASEAN-5 countries.
2.2 The Impact of financial inclusion on green growth
Financial inclusion, whose guiding principle is to provide every household and business with affordable, reliable and commercially viable access to formal financial products, can act as a lever for environmentally sustainable growth. First, by making credit, savings and insurance widely available, inclusive finance allows firms and individuals to invest in machinery and practices that minimize waste and raise resource productivity an outcome emphasized by the resource-efficiency view [68, 69]. Second, easier access to capital lowers the barrier to research and development, speeds up the rollout of clean technologies and thus reinforces green-growth dynamics, as argued by the innovation-and-diffusion perspective [20]. Third, the market-development lens suggests that greater purchasing power enlarges demand for eco-friendly goods, which motivates producers to expand their sustainable product lines, creating a virtuous cycle of greener consumption and production [20, 70].
A growing strand of empirical work links conventional financial-access measures to greener economic outcomes. Putra and Oktora [28], drawing on 2010–2021 data for 10 ASEAN economies, report that wider use of formal banking services coincides with stronger green-growth performance across the bloc. Using a Bayesian framework for 25 countries over 2005–2019, Oanh [71] likewise finds that broader financial outreach bolsters national green-finance activity and, by extension, sustainable development. Evidence from Dai et al. [29] shows a similar pattern for Regional Comprehensive Economic Partnership members: between 2004 and 2019, greater financial inclusion improved renewable-energy efficiency and secured more reliable low-energy inputs. Finally, Benedicta et al. [30] employ system-GMM on 19 OIC countries and reveal that Islamic-banking-driven inclusion reinforces green-growth momentum. Together, these studies suggest that when people and firms gain affordable, regulated financial access, the resulting capital flows can accelerate the transition toward cleaner, more resource-efficient economies. Unlike conventional banking, this effect was found to be statistically significant. The findings from these studies suggest that, when implemented with the right instruments and policies, financial inclusion can positively affect environmental performance. On the other hand, some studies argue that financial inclusion may negatively impact green growth indicators. For instance, Ahmad et al. [31] found that financial inclusion contributed to environmental degradation in BRICS countries using data from 2004 to 2018. Murtaza et al. [72], using data from 121 countries covering the period 2003–2022, found that financial inclusion, along with military expenditures, significantly increased ecological footprints. Said [73], in a study on 23 Sub-Saharan African countries; Mehmood [74], on South Asian countries such as Pakistan, India, Bangladesh, and Sri Lanka; Lin and Wu [75], in the Emerging Seven (E7) economies; Hussain et al. [76], on 26 Asian countries; and Le et al. [77], on 31 Asian countries, all reported that financial inclusion increases CO2 emissions. Furthermore, Abbas et al. [20], using FMOLS coefficient estimates in 12 developing countries showed that financial inclusion negatively affects green growth. Arsene [32] also examined the impact of financial inclusion and information diffusion on green growth in 36 Sub-Saharan African countries using data from 2004 to 2018. The findings revealed that financial inclusion, along with R&D and internet usage, increased CO2 emission intensity from production, thereby negatively affecting green growth.
Some studies in the literature have focused on digital financial (DF) inclusion and green growth indicators. Among these, Peng and Zeng [17] examined the impact of digital inclusive finance on green growth using data from 270 cities in China over the period 2011–2021. Their findings showed that digital inclusive finance strengthens regional green growth by promoting green technological innovation, increasing entrepreneurship, and transforming industrial structure. Wu et al. [15] analyzed 38 countries using the GMM method and found a significant positive relationship between DF inclusion and green growth. Ai et al. [78] studied 30 provinces in China with data from 2011 to 2020 and found that DF inclusion significantly increases green development, largely driven by technological progress channels. Song et al. [16], examining 265 Chinese cities during 2010–2017, reported that DF inclusion promotes green economic growth and has a notable positive spillover effect. Shen et al. [33], using data from 26 cities in China's Yangtze River Delta region between 2012 and 2018, found that DF inclusion improves agricultural green productivity, with technological progress playing a leading role in this increase; furthermore, digital and traditional financial inclusion were found to complement each other. Cao et al. [13] and Zheng and Li [14] also stand out as studies confirming a positive relationship between DF inclusion and green growth indicators in China. While research focusing on digital financial inclusion is largely concentrated on Chinese samples, these findings consistently support the positive effect of digital financial inclusion on green growth. Overall, the literature suggests that DF inclusion holds significant potential to support green growth and environmental objectives, whereas the impact of traditional financial inclusion on green growth is more complex. Within this framework, based on the relevant literature, the following hypothesis is tested in this study:
H2: Financial inclusion has a positive and statistically significant effect on green growth in the ASEAN-5 countries.
2.3 Research gap
Although there is a considerable number of empirical studies focusing on the relationships between FinTech development, financial inclusion, and green growth, comprehensive analyses specifically targeting the ASEAN countries are quite limited. Existing research generally examines the impact of FinTech on green growth [e.g., [19, 23, 59]] or the role of financial inclusion in environmental sustainability [e.g., [28, 29, 32]] individually; however, a holistic framework simultaneously assessing the interaction of these two variables remains unexplored. Moreover, the majority of studies addressing the relationship between FinTech development, financial inclusion, and green growth are based on country samples primarily from China, as well as India, Türkiye, and Malaysia. Regional or country group studies mainly focus on E-7, the European Union, BRICS, CIVETS, RCEP, OIC, and African countries. The only study addressing ASEAN countries is by Putra and Oktora [28], which investigates the individual effect of financial inclusion on green growth across 10 countries. This study aims to fill this gap by examining the effects of FinTech development and financial inclusion on green growth—both individually and interactively—using a long-term panel dataset covering the ASEAN-5 countries from 1995 to 2023. Advanced panel data methods that allow analysis of both long-term relationships and short-term dynamics (PARDL-PMG, Panel FMOLS, and Panel DOLS) are applied. Additionally, to reveal the temporal and frequency-based differences in the relationships between variables, country-level wavelet coherence analysis is conducted, providing a novel methodological contribution to the literature.
3 Data, model specifications, and methodology
3.1 Data
The variables included in the study, along with their definitions, measurement methods, and data sources, are summarized in Table 1.
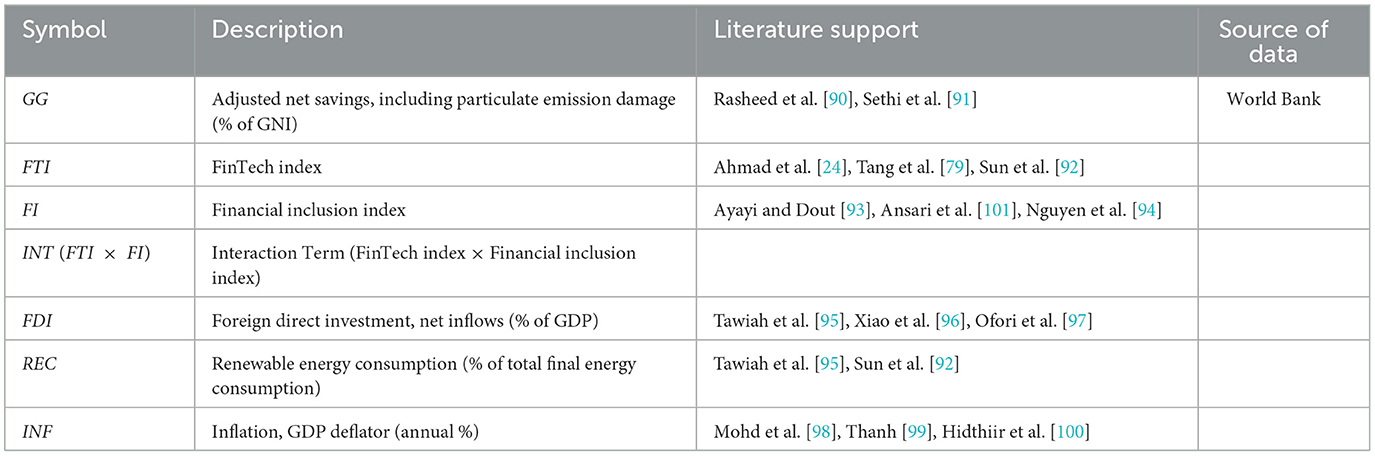
Table 1. Variables and sources.
The variables presented in Table 1 were determined by considering sustainable growth, FinTech, financial inclusion, and ASEAN-5-based studies. Composite indices representing FinTech and financial inclusion were constructed by the authors using the Principal Component Analysis (PCA) method. By applying PCA, multicollinearity among variables was reduced, minimizing information loss and ensuring the creation of indices with high representational power. The FinTech index (FTI) is based on indicators such as mobile phone subscription rate, internet user rate, and fixed broadband access. The main reason for using infrastructure based indicators for the FTI variable is that direct FinTech indicators such as e wallet penetration, the number and value of digital payments, and mobile account usage are not consistently available across countries and years. Including these indicators in the analysis could have led to an unbalanced panel and data loss, thereby potentially weakening the statistical power of the estimations. Therefore, to avoid observation loss and preserve the integrity of the panel structure, FinTech development was measured through infrastructure proxies such as internet usage, mobile subscriptions, and fixed broadband penetration. The financial inclusion index (FI) includes the number of ATMs per 100,000 people, bank branch density, the rate of individuals owning bank accounts, and bank credits provided to the private sector. The study employs annual data for Indonesia, Malaysia, the Philippines, Thailand, and Singapore over the period 1995–2023, obtained entirely from the World Bank database, forming a balanced panel dataset across all countries and variables.
While the FinTech index primarily relies on infrastructure-based indicators (mobile subscriptions, internet usage, and fixed broadband access), this methodological choice reflects the limited availability of consistent and comparable FinTech transaction data across ASEAN-5 economies. Similar proxies have been adopted in prior cross-country studies [24, 79] to capture enabling digital conditions that facilitate FinTech diffusion and financial digitalization. Although these indicators reflect the broader digital ecosystem rather than direct FinTech applications, the robustness of the PCA-based composite index—verified through alternative equal-weight and sensitivity analyses confirms its validity for regional comparison.
Likewise, Adjusted Net Savings (% of GNI) is employed as a long-term proxy for green growth. Although this indicator measures weak rather than absolute sustainability, it provides the most harmonized, continuous, and internationally comparable dataset available for ASEAN-5 over the 1995–2023 period. Its use allows the study to capture long-run sustainability dynamics while maintaining data consistency across economies. Finally, during the preprocessing stage, the FTI and FI indices were z-standardized (mean = 0, SD = 1) before entering the interaction term. This standardization enables the coefficients to be interpreted as standardized effects and facilitates the analysis of marginal effects, while all other variables were included in their original form.
3.2 . Definition of the model
The model established in the study is expressed as follows:
In the equation, GGit represents the green growth indicator, FTIit represents FinTech development, FIit represents financial inclusion, and (FTIxFI)it represents the interaction effect of these two factors. Direct foreign investment (FDIit), renewable energy use (RECit), and inflation (INFit) were included in the model as control variables. In the study, the FDI, REC, and INF variables were included in the model as control variables because they are fundamental macroeconomic factors that can influence green growth. FDI can influence green growth through sustainable investments and technology transfer. REC has the potential to influence environmental sustainability. INF was included in the model based on studies in the literature suggesting that it could create indirect effects on investment decisions and green growth by influencing macroeconomic stability.
Before proceeding with the model estimation, the Principal Component Analysis (PCA) was applied to clarify the representational power of the variables in the model and to combine highly correlated indicators into a single composite measure. Through this method, information loss is minimized by reducing dimensionality, thereby enhancing the representational power of the variables.
Before conducting the Principal Component Analysis (PCA), the Kaiser–Meyer–Olkin (KMO) and Bartlett's tests were performed to determine whether the data were suitable for this analysis, and the test results are reported in Table 2.

Table 2. KMO and Bartlet results.
According to the Kaiser–Meyer–Olkin (KMO) test results reported in Table 2, the KMO values calculated for the FTI and FI variables are 0.78 and 0.74, respectively. Although these values are classified as average according to the KMO interpretation scale, both exceed the 0.70 threshold, indicating an adequate level of sampling adequacy for conducting factor analysis. In addition, Field [80] stated that the minimum acceptable limit for the KMO value is 0.50, below which the dataset cannot be factorable. Therefore, the KMO values obtained for both variables are considered adequate and suitable for the PCA application. In addition, when examining the results of the Bartlett's test, the null hypothesis suggesting that the variables are independent was rejected for both variables, indicating that the Principal Component Analysis (PCA) could be appropriately conducted.
After confirming that the variables were suitable for Principal Component Analysis (PCA), the analysis was conducted, and the results are presented in Tables 3, 4, which report the PCA performed for the Financial Technology (FTI) and Financial Inclusion (FI) variables and the corresponding outcome.

Table 3. PCA results of FTI and FI variables.

Table 4. Factor loadins of PCA.
According to the PCA results presented in Tables 3, 4, the first principal component for the FTI index has an eigenvalue of 2.93, explaining 97.7% of the total variance. This indicates that the variables representing mobile subscription rate, internet usage, and fixed broadband access are strongly correlated with each other and jointly capture a common dimension of digital financial infrastructure. The factor loadings (0.997, 0.982, and 0.987) further show that these indicators contribute almost equally to the FinTech index. For the FI index, the first component has an eigenvalue of 3.36, explaining 83.9% of the total variance. Examining the factor loadings reveals that ATM density (0.912) and deposit account ownership (0.939) contribute nearly equally, while bank branch density exhibits a negative loading (−0.977). This negative coefficient can be interpreted as a sign of structural transformation in financial inclusion, reflecting a shift from traditional branch-based systems toward more digital and accessible financial services.
After conducting the Principal Component Analysis (PCA), a sensitivity analysis was performed to test the robustness of the constructed indices, and the results are presented in Table 5.
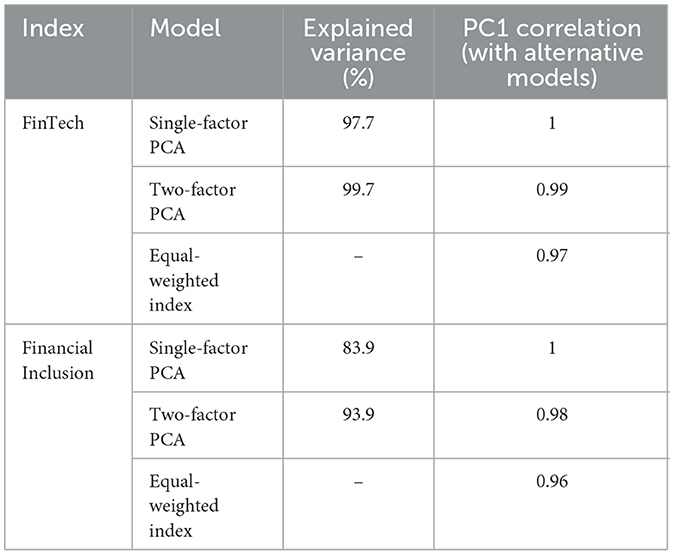
Table 5. Sensitivity analysis results.
According to the sensitivity analysis results presented in Table 6, the single-factor PCA models explain 97.7% of the total variance for FTI and 83.9% for FI, and exhibit strong correlations with alternative model specifications. These findings confirm that the single-factor PCA structure is statistically sufficient and reliable for both indices.

Table 6. Descriptive statistics.
3.3 Methodology
To meet the necessary prerequisites in panel data analysis, a cross-sectional dependence test was first applied. The CD test developed by Pesaran [81] is expressed as follows:
Here, N represents the number of units in the panel, T represents the time dimension, and K represents the number of estimated parameters. represents the correlation coefficient between error terms, represents the expected value of this coefficient, and vTij represents its variance.
To test the homogeneity of slopes, the Δ and corrected Δ (Δadj) statistics proposed by Pesaran and Yamagata [82] were used:
In these formulas, denotes Swamy's slope difference criterion, n denotes the number of parameters, v(T, n) denotes the sampling variance, and Δ and Δadj denote the original and adjusted test statistics, respectively.
Taking into account cross-sectional dependence and slope heterogeneity, one of the second-generation panel unit root tests, the CIPS (Cross-sectionally Augmented IPS) test, was applied. The test equation is as follows [83]:
Here, represents the horizontal section averages. CIPS (Cross-sectionally Augmented Dickey-Fuller) results were obtained using the following equation [83]:
Here, CADFi represents the augmented ADF test statistic calculated for each panel unit, and N denotes the total number of panel units.
To test for a long-term relationship among the panel series, the Durbin-Hausman panel cointegration test proposed by Westerlund [44] was applied. The test statistics at the group and panel levels are formulated as follows:
In these expressions, Ŝi and denote scaling factors, and denote long-term coefficient estimates, and êit−1 denotes lagged values of error terms.
To analyze both short- and long-term relationships, the PMG (Pooled Mean Group) estimator based on the ARDL model proposed by Pesaran et al. [84] was used. The general form of the panel ARDL model is given below:
In this model, the dependent variable Xit represents the lagged values of the independent variable (Zi)t−l, the coefficients πil and ξil represent the error term εit.
The error correction form of the model is specified as follows:
Here, λi represents the error correction coefficient, and Δ represents the difference operator; this term reflects short-term dynamics.
Finally, to test the causal relationships among the variables, the panel causality test developed by Dumitrescu and Hurlin [85] was applied. The model is defined as follows:
In this equation, Yi, t represents the dependent variable, Xi, t−k represents the lagged values of the independent variable, αi represents the constant term, and represent the lag coefficients, and ei, t represents the error term. This test analyzes whether X has a causal effect on Y.
Stock and Watson's [86] Dynamic Ordinary Least Squares (DOLS) and Park's [87] Canonical Cointegrating Regression (CCR) are widely selected because both estimators tackle the bias that endogeneity introduces into long-run cointegration models. DOLS achieves this by augmenting the regression with leads and lags of first-differenced regressors, which filters out endogeneity and serial correlation to produce more dependable coefficients. CCR, in contrast, applies data transformations that remove the non-stationary components and orthogonalise the error term from the regressors, delivering greater efficiency and enabling standard asymptotic χ2 tests.
Wavelet coherence analysis (WCA) provides an effective framework for assessing how two non-stationary series co-vary across time and frequency. It rests on the Continuous Wavelet Transform (CWT), which projects each series onto a joint time–frequency plane via wavelet functions that are simultaneously localized in both domains. The coherence statistic is derived by normalizing the cross-wavelet spectrum, yielding a scale-specific measure of correlation between the two signals.
In this formulation, S is a two-dimensional smoothing operator that averages along both the temporal axis and the scale axis [88]. The normalized coherence statistic, R2(a, b), is bounded between 0 and 1 and expresses the intensity of the linear association between the two series at every time–frequency coordinate. Values approaching 1 indicate pronounced synchrony, whereas values near 0 point to an absence of systematic linkage [89]. The accompanying phase angle, derived from the complex coherence, reveals the lead–lag relationship and relative timing between the signals.
The phase shift is represented by the function as follows:
Equations 11, 12 show that the real (Re) and imaginary (Im) parts of the smoothed cross-spectrum capture different signal features. Their ratio yields the phase angle ϕxγ, which conveys both the strength of association and the temporal ordering between the two series. In the wavelet power plot, right-pointing arrows ( → ) mark in-phase, positive co-movement, whereas left-pointing arrows (←) indicate out-of-phase, negative co-movement. A vector angled upward to the right (↗) signals that x(t) leads y(t), while one angled downward to the left (↙) shows that y(t) leads x(t) [88].
3.4 Econometric techniques
The empirical analysis in this study begins with the presentation of the descriptive statistics of the variables. To check for the severity of multicollinearity in the model, the Variance Inflation Factor (VIF) was used. Subsequently, Pesaran's [81] CD test was applied, followed by the Pesaran [83] CIPS test to examine the stochastic properties of the series. For empirical estimation, this study employed the PARDL-PMG estimator, which allows for the simultaneous analysis of long-run relationships and short-run dynamics. As a robustness check, the Panel FMOLS method was first used to estimate long-run coefficients. In the second stage, Panel Dynamic Ordinary Least Squares (DOLS) regressions were conducted to further assess the robustness of long-term relationships. Additionally, to test for causal relationships among the variables, the Dumitrescu and Hurlin [85] DH causality test was applied. Finally, to investigate the time- and frequency-dependent dynamics of the relationship between green growth and the FinTech–financial inclusion interaction (INT) variable at the country level, a wavelet coherence analysis was conducted. The tests applied in the study are illustrated in the flowchart presented in Figure 1.

Figure 1. Econometric techniques.
4 Econometric findings
Descriptive statistics of the variables including mean, standard deviation, skewness, kurtosis, and distribution characteristics are summarized in Table 6.
The descriptive statistics indicate notable differences in distribution among the variables. GG and FDI exhibit relatively lower skewness, whereas the INF variable stands out with high skewness and kurtosis values. The standardized indices, FTI and FI, display a more symmetric and balanced distribution. REC, on the other hand, is among the variables with the highest level of variability. According to the Jarque-Bera test results, all variables except for REC deviate from the normal distribution. To test for the presence of multicollinearity in the model, a VIF analysis was conducted. Examining Table 7, which presents the results, all VIF values are found to be below the critical threshold of 5. This result indicates that there is no multicollinearity among the independent variables.

Table 7. VIF results.
Subsequently, the Pesaran CD test was applied to determine whether there is cross-sectional dependence in the panel. The test results are reported in Table 8. The findings led to the rejection of the null hypothesis of cross-sectional independence, indicating a significant level of cross-sectional dependence among the series.

Table 8. Pesaran CD test results.
Within the framework of the CD test results, the CIPS test [102], one of the second-generation unit root tests, was used to analyze the stationarity levels of the variables, and the results are presented in Table 9. According to these results, the variables are not stationary at the level but become stationary after taking the first differences.

Table 9. CIPS unit root test results.
To test whether the slope coefficients in the model are homogeneous, the Delta and adjusted Delta tests developed by Pesaran and Yamagata [82] were applied. The results of these tests are presented in Table 10. Upon examining Table 10, the null hypothesis of slope homogeneity is rejected; therefore, it is concluded that there is slope heterogeneity (variation) in the model.

Table 10. Slope homogeneity test.
To determine whether there is a long-term relationship among the panel series, the Durbin-Hausman panel cointegration test developed by Westerlund [44] was applied. The test results are reported in Table 11. The rejection of the null hypothesis indicates the existence of a long-term cointegration relationship among the variables.

Table 11. Westerlund [44] Durbin-Hausman panel cointegration test results.
Within the scope of the empirical analysis, the Panel ARDL model was estimated to simultaneously analyze short- and long-term effects in the established model. The PARDL-PMG results are presented in Table 12.

Table 12. PARDL-PMG estimation results.
Lag lengths were selected using the Akaike Information Criterion (AIC) with a maximum of two lags. All models include country-specific intercepts but exclude deterministic trends. Long-run coefficients are constrained to be homogeneous, whereas short-run dynamics and intercepts are heterogeneous across countries. The Error-Correction Term (ECT) reflects the average adjustment speed toward equilibrium. Examining the PARDL-PMG estimation results presented in Table 12, the error correction term (ECT), which tests the existence of a long-term relationship, is found to be negative and statistically significant. This indicates that short-term imbalances in the model decrease by approximately 27% each year, returning to the long-term equilibrium. Looking at the long-term coefficients, a one-unit increase in the FTI variable raises GG by 0.769 units, demonstrating that digital financial services support environmental sustainability. The FI variable's contribution of 0.398 units indicates that financial inclusion promotes green investments. The positive coefficient of the interaction term INT shows that the impact of digitalization is strengthened through inclusive financial systems. Among the variables, REC has the strongest positive effect on GG (0.914), while INF has a limited but negative effect (−0.015), confirming the importance of macroeconomic stability for sustainability. The effect of FDI is positive but weak (0.006), indicating a limited impact of foreign direct investment on green growth. The short-term results for FTI, FI, INT, and REC variables show similarity in magnitude to the long-term findings, whereas FDI and INF variables differ. In the short term, increases in FDI reduce green growth, while INF increases it. In line with these findings, the marginal effects of FTI were calculated at low, medium, and high levels of FI to economically interpret the coefficient of the interaction term (INT). Since both FI and FTI variables were standardized in the analysis, the low FI level corresponds to one standard deviation below the mean (−1 SD), the medium level to the mean (0 SD), and the high level to one standard deviation above the mean (+1 SD). Accordingly, the marginal effect of FTI on green growth was estimated as −0.11 (0.769 + 0.879 × −1) at low FI, 0.77 (0.769 + 0.879 × 0) at medium FI, and 1.65 (0.769 + 0.879 × 1) at high FI levels. In addition to these findings, 95% confidence intervals were computed using the delta method to account for estimation uncertainty. The results show that the marginal effect of FinTech on green growth is statistically insignificant when financial inclusion is low (−1 SD), estimated at −0.11 [95% CI: (−0.51, 0.29)]. However, the effect becomes positive and statistically significant at and above the mean level of inclusion-−0.77 [95% CI: (0.50, 1.04)] at the mean (0 SD) and 1.65 [95% CI: (1.24, 2.06)] at high inclusion levels (+1 SD).
These marginal effects reveal that the impact of FTI on green growth shifts from weak to strong positive values as financial inclusion increases. In other words, when financial inclusion is low, an increase in FTI slightly reduces green growth (−0.11), whereas at high levels of inclusion, a one-unit rise in FTI enhances green growth by 1.65 units.
To test the robustness of the study results, the Panel FMOLS method was applied in the first stage, and the obtained results are presented in Table 13.

Table 13. Panel FMOLS.
The robustness tests conducted using the Panel FMOLS method were found to be largely consistent with the PARDL-PMG estimates. Both approaches show that the FTI, FI, and INT variables have a positive long-term effect on green growth. To further support the main estimates and more thoroughly assess the robustness of the long-term relationships, Panel DOLS regressions were applied. These regressions were performed within both trend-included and trend-excluded model structures. The results indicate that including a deterministic trend in the model did not provide a statistically significant improvement. This finding suggests that the core relationships are better captured without a linear trend component. Furthermore, the model was estimated using both one-lag and two-lag structures. The model was estimated under both one-lag and two-lag structures. Based on a comprehensive model evaluation using the Akaike Information Criterion (AIC), the one-lag, trend-excluded Panel DOLS model was identified as the most appropriate specification. Accordingly, the final interpretations are based on the one-lag, trend-excluded model, which aligns more closely with theoretical expectations and provides greater statistical reliability. As in the PARDL-PMG model, since the FI and FTI variables were standardized in the analysis, the low FI level corresponds to one standard deviation below the mean (−1 SD), the medium level to the mean (0 SD), and the high level to one standard deviation above the mean (+1 SD). According to this definition, when financial inclusion is low, a one-unit increase in FTI raises green growth by 0.46 units, by 0.68 units at the medium level, and by 0.90 units at the high level of financial inclusion. In addition to these findings, 95% confidence intervals were computed using the delta method to account for estimation uncertainty. According to the results, when financial inclusion is low (−1 SD), (0.16–0.75). At the mean level (0 SD), the effect becomes more pronounced (0.39–0.96), and at high inclusion levels (+1 SD), FinTech exerts a strong and economically meaningful influence on green growth (0.61–1.19). The corresponding results obtained from the Panel DOLS estimations are presented in Table 14 below.

Table 14. Panel DOLS estimation results: one-lag specification without deterministic trend.
The robustness tests conducted using the Panel FMOLS method were found to be largely consistent with the PARDL-PMG estimates. Both approaches show that the FTI, FI, and INT variables have a positive long-term effect on green growth. To further support the main estimates and assess the robustness of the long-term relationships, Panel DOLS regressions were applied. The model was estimated with one lag (k = 1), no deterministic trend, and country intercepts included.
According to the panel DOLS estimation results presented in Table 15, all coefficients are statistically significant at the 1% level. The variables FTI, FI, INT, FDI, and REC exert a positive effect on green growth. The positive sign of FTI indicates that the development of financial technologies enhances resource-use efficiency and thereby promotes green growth. Similarly, the positive coefficient of FI suggests that financial inclusion facilitates access to green finance and investment opportunities, strengthening the transition toward a sustainable economy. The interaction term (INT = FTI × FI) also exhibits a positive and significant impact, implying that the combined effect of financial technology and financial inclusion amplifies the contribution to green growth. This finding indicates that when digital financial tools become more accessible to a broader population, environmentally friendly investments are encouraged. Furthermore, foreign direct investment (FDI) promotes eco-friendly production through technology transfer and capital inflows, while renewable energy consumption (REC) reduces carbon intensity and supports sustainable growth. In contrast, the inflation variable (INF) negatively affects green growth, as price instability weakens investment confidence and disrupts long-term green financing channels. Overall, the coefficients align with theoretical expectations, and the estimated signs are consistent with those obtained from the MG and FMOLS models, reinforcing the robustness of the empirical findings. The marginal effects were also calculated for this model, as in the other estimations. In the calculation, the low FI level corresponds to one standard deviation below the mean (−1 SD), the medium level to the mean (0 SD), and the high level to one standard deviation above the mean (+1 SD). According to this calculation, when the level of financial inclusion is low, a one-unit increase in financial technology reduces green growth by 8.30 units. When financial inclusion is at the average level (0 SD), the same increase raises green growth by 1.42 units, and when financial inclusion is high (+1 SD), the effect rises to 11.14 units. This finding indicates that the impact of financial technology on green growth varies across different levels of financial inclusion. In addition to these findings, 95% confidence intervals were computed using the delta method to account for estimation uncertainty When financial inclusion is low (−1 SD), the marginal effect is negative and statistically significant (−8.50, −8.10), implying that FinTech expansion without sufficient inclusion may not translate into sustainable outcomes. At the mean level (0 SD), the effect becomes positive (1.33, 1.51), and at high inclusion levels (+1 SD), FinTech exerts a strong positive influence on green growth (10.94, 11.34). The long-term estimation results of the study are visualized in Figure 2.

Table 15. Dumitrescu-Hurlin panel causality test results.

Figure 2. Long-run estimation results.
To support the long-term estimation results, a panel causality analysis was conducted, and the results are presented in Table 15.
The panel causality analysis results presented in Table 11 indicate a bidirectional causal relationship between GG and both INT and REC variables. This finding suggests that the interaction between FinTech development and financial inclusion mutually influences green growth processes. Similarly, renewable energy consumption is also in a reciprocal interaction with green growth indicators. In addition, unidirectional causality is found from FTI and INF to GG, implying that advancements in financial technologies and fluctuations in price levels are among the driving forces of green growth. On the other hand, the observed unidirectional causality from GG to FDI suggests that trends in sustainable growth may enhance the attractiveness of economies to foreign investors.
To further explore the dynamic interaction between FinTech, financial inclusion, and green growth, wavelet coherence analysis was employed. This method enables the examination of how the strength and direction of relationships between variables evolve over both time and frequency domains, revealing short-, medium-, and long-term synchronization patterns across ASEAN-5 economies. It is important to note that wavelet coherence measures localized co-movement and lead–lag phase relations rather than statistical causality in the Granger sense. Therefore, the directional arrows in the plots indicate the relative phase differences between variables where one variable tends to lead or lag the other without implying formal predictive causality.
To further explore the time- and frequency-dependent dynamics of the relationship between green growth and financial inclusion, a wavelet coherence analysis was conducted. While traditional panel causality tests capture average effects across countries, the wavelet approach allows for the identification of country-specific co-movement patterns across different time periods and frequency bands. This method is particularly valuable for detecting the evolving nature of relationships under conditions of structural breaks, policy shifts, or external shocks.
Initially, the wavelet coherence analysis was performed using the level series of GG and INT. However, this approach encountered several technical limitations, particularly in implementing Monte Carlo–based significance testing. In certain cases, significance contours did not emerge, and the results lacked stability. These issues were directly associated with the non-stationarity (I[1]) of the level series and the presence of common stochastic trends, which violated key assumptions of wavelet analysis and compromised the statistical reliability and validity of the significance tests. To address these limitations, the analysis was conducted using the first-differenced series (ΔGG and ΔINT), thereby ensuring stationarity and enhancing the statistical robustness and interpretability of the observed co-movement structures. The wavelet coherence estimations were carried out individually for each ASEAN-5 country, allowing for country-specific insights and inferences. The statistical significance of the wavelet coherence estimates was assessed through Monte Carlo simulations based on 1,000 random permutations, following the methodology proposed by Torrence and Compo [88]. Under this framework, the null hypothesis posits no local relationship between the series at each time-frequency point. In the wavelet coherence plots, regions enclosed by bold black contours denote statistically significant coherence at the 5% level.
The wavelet coherence analysis employed the complex Morlet mother wavelet (ω0 = 6) with an AR[1] red-noise null baseline and 1,000 Monte Carlo permutations to compute significance contours. The color bar is fixed within [0, 1] across Figures 3–7 to allow cross-country comparison. Shaded regions outside the Cone of Influence (COI) indicate areas subject to edge effects and are therefore excluded from inference. Arrow directions follow the standard convention: → in-phase; ← anti-phase; ↗ x leads y; ↙ y leads x.

Figure 3. Wavelet coherence between ΔGG and ΔINT in Indonesia. Statistically significant regions at the 5% level are enclosed by black contours. Arrows indicate phase differences.

Figure 4. Wavelet coherence between ΔGG and ΔINT in Malaysia.

Figure 5. Wavelet coherence between ΔGG and ΔINT in Philippines.

Figure 6. Wavelet coherence between ΔGG and ΔINT in Thailand.

Figure 7. Wavelet coherence between ΔGG and ΔINT in Singapore.
As emphasized in Section 4, wavelet coherence detects localized time–frequency co-movements and phase leads rather than structural or Granger causality. Directionality is formally tested through the Dumitrescu–Hurlin panel-causality framework (Table 15). In that test, lag order was selected by the BIC with a maximum lag of 2, and cross-sectional dependence and heteroskedasticity were accounted for via bootstrap-adjusted critical values.
In Figure 3, the wavelet coherence graph for Indonesia reveals a statistically significant region of co-movement concentrated in the 2–4 year periodic band between 1998 and 2005. This region is depicted by the red area enclosed by thick black contours and is significant at the 5% level. The southwest-pointing phase arrows within this region indicate that changes in financial interaction (ΔINT) Granger-caused fluctuations in green growth (ΔGG) during this period. This finding suggests that developments in digital financial systems and shifts in financial inclusion mechanisms—such as the liberalization of capital flows or policy reforms in the early 2000s—may have played a leading role in shaping sustainable growth patterns. The observed out-of-phase relationship, where ΔINT leads, confirms that financial factors were influential in determining sustainability outcomes during that time frame. In contrast, outside the statistically significant period, co-movement appears generally weak, and no long-term or persistent synchronization is observed after 2010.
The wavelet coherence graph for Malaysia presented in Figure 4 does not exhibit any statistically significant region enclosed by thick black contours. Throughout the observed period, there is no clear time-frequency-based co-movement between the ΔGG and ΔINT variables. Although a moderate level of coherence—visually transitioning from orange to yellow—appears within the 2–4 year periodic band between 2015 and 2022, the absence of significance contours indicates that this relationship does not exceed the 5% significance threshold under Monte Carlo simulations. Therefore, the observed relationship lacks causal interpretability. This suggests that, over the past 30 years in Malaysia, the interaction dynamics between financial technology and financial inclusion have not systematically or temporally influenced green growth in a statistically or frequency-specific manner.
The wavelet coherence graph for the Philippines presented in Figure 5 reveals two statistically significant regions. The first region appears within the 2–4 year periodic band between 2015 and 2021, while the second emerges in the lower-frequency 6–8 year band spanning from 2013 to 2020. Both regions are enclosed by thick black contours, indicating significance at the 5% level. The phase arrows within these regions predominantly point to the southeast (↘), suggesting that changes in green growth (ΔGG) precede changes in financial interaction (ΔINT), implying a reverse-direction Granger causality dynamic. These findings suggest that green growth may act as a driving factor in the development of the financial system. Consequently, policies aimed at sustainable development could potentially trigger financial digitalization and inclusion processes, indicating that green growth initiatives may have a transformative impact on the financial system.
The wavelet coherence graph for Thailand presented in Figure 6 does not reveal any statistically significant region of co-movement. The absence of thick black contour lines clearly indicates this result. Although some medium-level coherence areas—visually indicated by a yellow-to-orange gradient—can be observed within the 2–4 year periodic band between 1997 and 2010, these regions do not exceed the 5% significance threshold under the Monte Carlo simulation framework. The lack of statistically significant time-frequency coherence suggests that there has not been a consistent co-movement relationship between green growth (ΔGG) and financial interaction (ΔINT) over the past 30 years. Moreover, the absence of phase arrows on the graph supports the conclusion that no directional or dynamic relationship can be inferred between the two series. In the case of Thailand, there has been no statistically significant and consistent synchronization between green growth and financial interaction over the past three decades. This implies that sustainable development policies have not been sufficiently integrated with the financial sector and that strategic alignment remains weak.
The wavelet coherence graph for Singapore presented in Figure 7 reveals two statistically significant regions. The first region is observed between 1997 and 2000 within the 2–3 year periodic band, while the second region appears between 2018 and 2022 within the 4–6 year band. Both regions are indicated by red areas outlined with thick black contours, denoting statistical significance at the 5% level. During the first period (1997–2000), the phase arrows predominantly point to the northwest (↖), indicating that changes in financial interaction (ΔINT) preceded changes in green growth (ΔGG), and that the two series exhibited an inverse phase relationship. This suggests that increased financial interaction during 1997–2000 in Singapore may have negatively impacted sustainable development efforts, leading to a decline in green growth. In contrast, during the second period (2018–2022), the phase arrows mostly point to the southeast (↘), indicating that changes in green growth preceded changes in financial interaction. This finding implies that, particularly during a time of intensified sustainability efforts, changes in green growth driven by sustainability initiatives began to influence financial interaction in Singapore.
5 Discussion
In this study, the effects of FinTech development and financial inclusion on green growth in ASEAN-5 countries were analyzed. Both short- and long-term estimates were conducted using the PARDL-PMG method, while long-term estimates were additionally carried out using Panel FMOLS and DOLS methods. According to the long-term findings obtained from these three methods, FinTech development, financial inclusion, the interaction between FinTech and financial inclusion, foreign direct investment, and renewable energy consumption have a positive effect on green growth, whereas inflation has a negative effect. The coefficient signs obtained from the Panel DOLS estimations are consistent with those derived from the FMOLS and PMG models. This consistency indicates that different econometric approaches reveal similar long-term relationships, confirming the robustness and methodological coherence of the results. Accordingly, the discussion section of the study is based on the common findings derived from the three estimators. When the marginal effects are interpreted collectively, it can be stated that the impact of FinTech on green growth depends on the level of financial inclusion across all models. In cases where inclusion is low, the effect of FinTech is weak or negative; however, once inclusion reaches and exceeds its average level, the marginal effect becomes positive and significant in all models. This suggests that the contribution of FinTech to green growth emerges only after financial inclusion surpasses a certain threshold level. However, minor variations in coefficient magnitudes across estimators may arise from differences in lag length and endogeneity correction procedures. In addition, structural and institutional heterogeneity among ASEAN-5 economies can partially explain the divergences observed across methods. Countries with mature regulatory frameworks and deeper digital-finance ecosystems (such as Singapore and Malaysia) are likely to experience more stable environmental outcomes, whereas early-stage markets with weaker institutional quality (such as Indonesia and the Philippines) may face transitional inefficiencies or temporary volatility during digital transformation. These asymmetries highlight that the strength and direction of FinTech–green growth linkages depend on the stage of digital and financial maturity across economies. Minor differences in coefficient magnitudes across estimators arise mainly from methodological heterogeneity and distinct normalization procedures, rather than inconsistent data preprocessing.
The long- and short-term results obtained through the PARDL-PMG, Panel FMOLS, and Panel DOLS methods in this study reveal a positive relationship between FinTech development and green growth indicators. These findings are consistent with numerous studies in the literature. For example, Wu et al. [19] found that FinTech promotes green growth in Chinese cities through payment systems, investment management, and lending; Lou and Li [59] reported that FinTech contributes to green growth in E-7 economies; Li et al. [60] showed that FinTech development reduces carbon emissions in Belt and Road Initiative countries. Aziz et al. [21] indicated that FinTech positively affects green growth in China by influencing energy transition as a mediating variable; Ahmad et al. [24], using data from 25 EU countries from 1990 to 2020, stated that FinTech facilitates green energy transition, indirectly reducing the ecological footprint. Ren and Han [23] found that between 2013 and 2023, the level of FinTech in companies listed on China's Shanghai and Shenzhen stock exchanges significantly promoted green technology innovation and increased green productivity. Xu et al. [62], using CIVETS countries' data from 2000 to 2022, showed that digitalization and FinTech development reduce carbon emissions; Nenavath and Mishra [64], with data from Indian states for 2010–2021, demonstrated that FinTech and green finance contribute to sustainable economic growth. Udeagha and Muchapondwa [65], using data from BRICS countries for 1990–2020, found that FinTech, green finance, and energy innovation promote environmental sustainability; Wei [66] reported that FinTech development enhances green economic efficiency in China; Zhou et al. [22], with provincial-level data from China (2011–2018), revealed the positive effects of FinTech and green finance on green growth. However, some studies have reached different conclusions from those of this research. For instance, Razzaq et al. [26], covering 81 countries, found that while FinTech promotes economic growth, it reduces environmental quality; Topaloglu et al. [27], analyzing Türkiye's data from 2005 to 2023, indicated that FinTech development has negative long-term but positive short-term effects on the environment.
The findings obtained through the PARDL-PMG, Panel FMOLS, and Panel DOLS methods in this study also reveal that financial inclusion is positively related to green growth indicators in both the long and short term. These results align with studies in the literature, such as those by Putra and Oktora [28] covering 10 ASEAN countries, Oanh [71] examining 25 countries, and Benedicta et al. [30] focusing on 19 OIC countries, all of which demonstrate the positive impact of traditional financial inclusion on green growth. Similarly, studies by Wu et al. [15] with a sample of 38 countries; Peng and Zeng [17], Ai et al. [78], Song et al. [16], Shen et al. [33], Cao et al. [13], and Zheng and Li [14] focusing on China also reveal the positive effects of digital financial inclusion on green growth indicators, supporting the findings of this research. On the other hand, some studies suggest that traditional financial inclusion has a negative impact on green growth. In this context, Ahmad et al. [31] for BRICS countries, Murtaza et al. [72] for 121 countries, Said [73] for 23 Sub-Saharan African countries, Mehmood [74] for South Asian countries, Lin and Wu [75] for E7 economies, Hussain et al. [76] for 26 Asian countries, Le et al. [77] for 31 Asian countries, Abbas et al. [20] for 12 developing countries, and Arsene [32] for 36 Sub-Saharan African countries report a negative effect of financial inclusion on green growth indicators, which contradicts the findings of the present study.
In light of this discussion, while FinTech and financial inclusion are strongly demonstrated as key tools supporting green growth, the varying results in the literature highlight the complexity of this field and the importance of regional and temporal dynamics. Future studies should carefully consider this diversity to develop policy recommendations that are more precise and context-specific.
6 Conclusion and policy implications
This study examines the impact of digital financial infrastructure and financial inclusion on green growth in ASEAN-5 countries using a multidimensional panel data approach. The findings indicate that digital finance and financial access support environmental sustainability. The PARDL-PMG estimator reveals a stable long-run equilibrium relationship, with short-term deviations corrected at an annual rate of 27%. FinTech development and financial inclusion have significant positive effects on green growth; a one-unit increase in the FinTech index raises green growth by 0.769 units, while financial inclusion increases it by 0.398 units. Additionally, the interaction between FinTech and financial inclusion further enhances environmental benefits. The results from the PARDL-PMG, Panel FMOLS, and Panel DOLS estimators consistently support the H1 and H2 hypotheses regarding the positive effects of FinTech development and financial inclusion on green growth.
The consistency across these three estimators confirms that different econometric approaches capture similar long-term dynamics between digital finance and green growth. This finding strengthens the empirical evidence that FinTech development and inclusive financial systems act as critical enablers of sustainable economic transformation. The positive and significant coefficients on foreign direct investment and renewable energy consumption further highlight the importance of international capital flows and energy transition for environmentally sustainable growth. Meanwhile, the insignificant inflation term indicates that price fluctuations exert little leverage over long-run environmental outcomes.
Dumitrescu–Hurlin panel-causality tests point to a two-way feedback loop between green growth and (i) the combined FinTech–financial-inclusion indicator and (ii) renewable-energy use. Put differently, digital-finance expansion and broader financial access not only foster environmentally friendly expansion but are themselves reinforced by it. The analysis also uncovers one-directional effects running from FinTech progress and from inflation toward green growth, highlighting the roles of digital financial technologies and price dynamics in shaping ecological outcomes. Conversely, causality that travels from green growth to inward foreign direct investment implies that economies charting more sustainable paths tend to become more attractive to international investors.
Wavelet-coherence results confirm that the strength and timing of the links uncovered in the panel regressions differ markedly across the five ASEAN economies. In Thailand and Malaysia, the FinTech–inclusion composite shows little or no synchronization with green-growth fluctuations, underscoring the fact that country-specific structures and policy regimes can deviate from the panel's average pattern. By contrast, Singapore, Indonesia, and the Philippines display pronounced, scale-dependent co-movement, suggesting that these three economies account for much of the panel-level signal.
Taken together, the evidence positions digital financial infrastructure and broad-based financial access as pivotal contributors to environmentally sound growth in the region. Policymakers should therefore widen the reach of digital financial services while pairing that expansion with strong programs in digital literacy and consumer protection. Because FinTech–inclusion synergies may also create potential sustainability trade-offs, supervisory frameworks need to monitor emerging systemic vulnerabilities closely. Targeted tools—such as green micro-loans and dedicated environmental credit facilities—can deepen inclusion without compromising ecological goals. The positive association between inward FDI and sustainability underscores the need to align investment-screening criteria with ecological priorities. Likewise, renewable-energy strategies must be customized to each country's infrastructure profile to ensure efficient transitions. Overall, a flexible policy mix that recognizes national structural differences will yield the greatest payoff, and governments should treat robust environmental performance as a core element of their strategy to attract foreign capital.
In line with these findings, the wavelet coherence results reveal heterogeneous patterns across ASEAN-5 economies. Singapore, Indonesia, and the Philippines exhibit strong and scale-dependent synchronization between FinTech–inclusion dynamics and green growth, suggesting that policies should prioritize advanced digital-literacy programs, cybersecurity frameworks, and green-finance innovations to maintain this synergy. In contrast, Thailand and Malaysia display weaker or short-term synchronization, indicating that foundational efforts—uch as improving broadband infrastructure, enhancing consumer protection, and expanding access to basic digital financial services—should be prioritized before expecting environmental co-benefits. Tailoring national strategies to these heterogeneity patterns can enhance the region's collective progress toward inclusive and sustainable digital transformation.
This study analyzes the impact of FinTech development and financial inclusion on green growth in ASEAN-5 countries using panel data techniques. However, several limitations should be acknowledged when interpreting the findings. First, the analysis is geographically confined to ASEAN-5 economies, which may limit the generalizability of the results to other regional or economic contexts. Future research could expand this framework by incorporating both qualitative and quantitative indicators that reflect the institutional, social, and cultural dimensions of digital financial transformation. Moreover, the green growth indicator employed in this study may not fully capture cross-country differences due to variations in data coverage and accounting methodologies, and it may contain a certain degree of accounting heterogeneity. Future studies could enhance the comprehensiveness of environmental sustainability assessment by incorporating complementary indicators such as the negative of per-capita CO2 emissions, renewable energy share, green total factor productivity (TFP), or the Environmental Performance Index (EPI). In addition, since the panel estimation techniques used in this study emphasize cross-country average effects, they may not fully capture country-specific structural shocks or disturbances. Although common-factor robust estimators such as CCE-PMG and CS-ARDL could not be fully implemented due to data and sample limitations, future research with longer time-series coverage could benefit from employing these models to further validate the long-run relationships identified in this study. In addition, the Johnson–Neyman (J–N) technique, which allows for a more precise identification of significance regions in interaction effects, may be applied in future research. In this regard, the application of structural vector autoregressive (SVAR) models in future analyses is also recommended to provide a more nuanced understanding of heterogeneous national dynamics. Although potential endogeneity and reverse causality cannot be fully ruled out in this study, the comprehensive methodological framework employed provides robust support for the overall direction of the findings. Nevertheless, the estimates should be interpreted with caution due to possible biases arising from endogeneity and reverse causality.
Data availability statement
The original contributions presented in the study are included in the article/supplementary material, further inquiries can be directed to the corresponding author.
Author contributions
OD: Methodology, Writing – original draft, Writing – review & editing. ND: Methodology, Writing – original draft, Writing – review & editing. AH: Methodology, Writing – original draft, Writing – review & editing. OS: Methodology, Writing – original draft, Writing – review & editing.
Funding
The author(s) declare that no financial support was received for the research and/or publication of this article.
Conflict of interest
The authors declare that the research was conducted in the absence of any commercial or financial relationships that could be construed as a potential conflict of interest.
Generative AI statement
The author(s) declare that no Gen AI was used in the creation of this manuscript.
Any alternative text (alt text) provided alongside figures in this article has been generated by Frontiers with the support of artificial intelligence and reasonable efforts have been made to ensure accuracy, including review by the authors wherever possible. If you identify any issues, please contact us.
Publisher's note
All claims expressed in this article are solely those of the authors and do not necessarily represent those of their affiliated organizations, or those of the publisher, the editors and the reviewers. Any product that may be evaluated in this article, or claim that may be made by its manufacturer, is not guaranteed or endorsed by the publisher.
References
1. Shashwat S, Chhabra M, Giri AK. Environmental externalities of digital financial inclusion: a green growth perspective. Discov Sustain. (2025) 6:81. doi: 10.1007/s43621-025-00862-1
2. Iftikhar H, Ullah A, Pinglu C. From regional integrated development toward sustainable future: evaluating the Belt and Road Initiative's spillover impact between tourism, Fintech and inclusive green growth. Clean Technol Environ Policy. (2025) 27:1427–54. doi: 10.1007/s10098-024-02890-3
3. Birkenmaier J, Despard M, Friedline T, Huang J. Financial inclusion and financial access. In: Oxford Research Encyclopedia of Social Work. Oxford, UK: Oxford University Press (2019). doi: 10.1093/acrefore/9780199975839.013.1331
4. Sapre N. Financial inclusion: philosophical and methodological underpinnings. Qual Res Financ Mark. (2023) 15:445–52. doi: 10.1108/QRFM-10-2022-0179
5. Arner DW, Buckley RP, Zetzsche DA, Veidt R. Sustainability, FinTech and financial inclusion. Eur Bus Organ Law Rev. (2020) 21:7–35. doi: 10.1007/s40804-020-00183-y
6. Tay LY, Tai HT, Tan GS. Digital financial inclusion: a gateway to sustainable development. Heliyon. (2022) 8:e09766. doi: 10.1016/j.heliyon.2022.e09766
7. Mishra D, Kandpal V, Agarwal N, Srivastava B. Financial inclusion and its ripple effects on socio-economic development: a comprehensive review. J Risk Financ Manag. (2024) 17:105. doi: 10.3390/jrfm17030105
8. Damayanthi NMM. Financial inclusion: does it play an important role in a country? Review of the literature. J Account Financ. (2024) 11:35–56. doi: 10.57075/jaf1112403
9. Sangwan V, Harshita Prakash P, Singh S. Financial technology: a review of extant literature. Stud Econ Finance. (2020) 37:71–88. doi: 10.1108/SEF-07-2019-0270
10. Lee I, Shin YJ. Fintech: ecosystem, business models, investment decisions, and challenges. Bus Horiz. (2018) 61:35–46. doi: 10.1016/j.bushor.2017.09.003
11. King T, Lopes FSS, Srivastav A, Williams J, editors. Disruptive Technology in Banking and Finance: An International Perspective on FinTech. Cham: Palgrave Macmillan (2021). doi: 10.1007/978-3-030-81835-7
12. Bajwa FA, Fu J, Bajwa IA, Ahmad S, Mahmood F. Factors influencing usage and loyalty for payment app customers in Saudi Arabia. Acta Psychol. (2025) 255:104961. doi: 10.1016/j.actpsy.2025.104961
13. Cao J, Law SH, Wu D, Tang X, Yang X. Effect of digital financial inclusion on dredging the path of green growth—new evidence from front-end and back-end perspectives. Front Environ Sci. (2022) 10:865229. doi: 10.3389/fenvs.2022.865229
14. Zheng H, Li X. The impact of digital financial inclusion on carbon dioxide emissions: empirical evidence from Chinese provinces data. Energy Rep. (2022) 8:9431–40. doi: 10.1016/j.egyr.2022.07.050
15. Wu S, Wang Z, Su C, Zhang W. Digital media and green development path in Asia: does digital financial inclusion matter?. Sustainability. (2023) 15:11359. doi: 10.3390/su151411359
16. Song C, Qiu Z, Yang L. How does digital financial inclusion affect green economic development? A perspective from regional competitions. Elem Sci Anthropocene. (2023) 11:00090. doi: 10.1525/elementa.2022.00090
17. Peng R, Zeng B. Digital financial inclusion and inclusive green growth: evidence from China's green growth initiatives. Int J Financ Stud. (2025) 13:2. doi: 10.3390/ijfs13010002
18. Lyytimäki J, Antikainen R, Hokkanen J, Koskela S, Kurppa S, Känkänen R, et al. Developing key indicators of green growth. Sustain Dev. (2018) 26:51–64. doi: 10.1002/sd.1690
19. Wu B, Ding Y, Xie B, Zhang Y. FinTech and inclusive green growth: a causal inference based on double machine learning. Sustainability. (2024) 16:9989. doi: 10.3390/su16229989
20. Abbas S, Dastgeer G, Nasreen S, Kousar S, Riaz U, Arsh S, et al. How financial inclusion and green innovation promote green economic growth in developing countries. Sustainability. (2024) 16:6430. doi: 10.3390/su16156430
21. Aziz G, Sarwar S, Waheed R, Anwar H, Khan MS. Relevance of fintech and energy transition to green growth: empirical evidence from China. Heliyon. (2024) 10:e33315. doi: 10.1016/j.heliyon.2024.e33315
22. Zhou G, Zhu J, Luo S. The impact of fintech innovation on green growth in China: mediating effect of green finance. Ecol Econ. (2022) 193:107308. doi: 10.1016/j.ecolecon.2021.107308
23. Ren Z, Han L. Analysis of the impact and mechanism of financial technology levels on green productivity. J Educ Human Soc Sci. (2024) 46:35–47. doi: 10.54097/k13q5y37
24. Ahmad M, Pata UK, Ahmed Z, Zhao R. Fintech, natural resources management, green energy transition, and ecological footprint: empirical insights from EU countries. Res Policy. (2024) 92:104972. doi: 10.1016/j.resourpol.2024.104972
25. Huang L. Fintech inclusion in natural resource utilization, trade openness, resource productivity, recycling and minimizing waste generation: does technology really drive economies toward green growth?. Res Policy. (2024) 90:104855. doi: 10.1016/j.resourpol.2024.104855
26. Razzaq A, Shaheen WA, Salam A, Afzal K. FinTech's double-edged sword: economic growth and CO2 emissions–a panel data analysis. J Soc Organ Matters. (2024) 3:68–91. doi: 10.56976/jsom.v3i2.69
27. Topaloglu EE, Nur T, Ege. I. Exploring the impact of financial development, financial inclusion and renewable energy on sustainable development: the leading role of Fintech in Turkiye. Istanbul Nişantaşi Univ J Soc Sci. (2024) 12:144–61. doi: 10.52122/nisantasisbd.1543701
28. Putra AAKAD, Oktora SI. The effect of financial inclusion and economic integration on green growth in ASEAN. J Econ Dev. (2024) 26:189–205. doi: 10.1108/JED-09-2023-0169
29. Dai X, Qian S, Zhang J. Sustainable financial inclusion as a source of green environment? Evidence from selected regional comprehensive economic partnership countries. Econ Res Ekon IstraŽ. (2022) 35:5719–38. doi: 10.1080/1331677X.2022.2035244
30. Benedicta YH, Lacheheb Z, Jamaludin HB, Zainudin DB. Islamic and conventional financial inclusion-green GDP nexus: Case of OIC countries. Int J Acad Res Econ Manag Sci. (2024) 13:108–20. doi: 10.6007/IJAREMS/v13-i3/21388
31. Ahmad M, Ahmed Z, Bai Y, Qiao G, Popp J, Oláh J. Financial inclusion, technological innovations, and environmental quality: analyzing the role of green openness. Front Environ Sci. (2022) 10:851263. doi: 10.3389/fenvs.2022.851263
32. Arsene MF. Financial inclusion and knowledge diffusion for green growth in Sub-Saharan African countries. Asian J Empir Res. (2024) 14:96–113. doi: 10.55493/5004.v14i4.5238
33. Shen Z, Hong T, Blancard S, Bai K. Digital financial inclusion and green growth: Analysis of Chinese agriculture. Appl Econ. (2024) 56:5555–73. doi: 10.1080/00036846.2023.2257038
34. Fernandez D, Rakotomalala M. Financial Technology and Inclusion in ASEAN. Singapore: Singapore Management University (2020). p. 1–49. Available online at: https://ink.library.smu.edu.sg/lkcsb_research/6714 (Accessed June 15, 2025).
35. Imam T, McInnes A, Colombage S, Grose R. Opportunities and barriers for FinTech in SAARC and ASEAN countries. J Risk Financ Manage. (2022) 15:77. doi: 10.3390/jrfm15020077
36. Wang CN, Nhieu NL, Liu WL. Unveiling the landscape of Fintech in ASEAN: assessing development, regulations, and economic implications by decision-making approach. Human Soc Sci Commun. (2024) 11:1–16. doi: 10.1057/s41599-023-02581-2
37. Warokka A, Setiawan A, Aqmar AZ. Key factors influencing Fintech development in ASEAN-4 countries: a mediation analysis. FinTech. (2025) 4:17. doi: 10.3390/fintech4020017
38. Ha D, Nguyen M, Nguyen K, Sensoy A. Unveiling financial inclusion dynamics: Fintech's resonance in Association of Southeast Asian Nations (ASEAN). Int J Financ Econ. (2025) 30:1348–71. doi: 10.1002/ijfe.2963
39. Loo MKL. Enhancing financial inclusion in ASEAN: identifying the best growth markets for fintech. J Risk Financ Manag. (2019) 12:181. doi: 10.3390/jrfm12040181
40. Malarvizhi CAN, Zeynali Y, Mamun AA, Ahmad GB. Financial development and economic growth in ASEAN-5 countries. Glob Bus Rev. (2019) 20:57–71. doi: 10.1177/0972150918802684
41. Winarni R, Akbar TSW. Digital transformation in the financial system: a comprehensive review of the literature on fintech and financial inclusion. Priviet Soc Sci J. (2025) 5:100–14. doi: 10.55942/pssj.v5i8.479
42. Bajwa FA, Fu J, Bajwa IA, Rehman M, Abbas K. Digital financial inclusion and its dual impact on economic and environmental outcomes in ASEAN countries. Data Science in Finance and Economics (2025). doi: 10.3934/DSFE.2025004
43. The Association of Southeast Asian Nations (ASEAN). ASEAN Digital Masterplan 2025. (2025). Available online at: https://asean.org/wp-content/uploads/2021/08/ASEAN-Digital-Masterplan-2025.pdf (Accessed June 29, 2025).
44. Westerlund J. Panel cointegration tests of the Fisher effect. J Appl Econom. (2008) 23:193–223. doi: 10.1002/jae.967
45. Jänicke M. Green growth: from a growing eco-industry to economic sustainability. Energy Policy. (2012) 48:13–21. doi: 10.1016/j.enpol.2012.04.045
46. Schumpeter JA. The Theory of Economic Development with a New Introduction by John E. Elliott. Cambridge, UK: Harvard University Press (2012).
47. Solow RM. Technical change and the aggregate production function. Rev Econ Stat. (1957) 39:312–20. doi: 10.2307/1926047
48. Levine R, Zervos S. Stock markets, banks, and economic growth. Am Econ Rev. (1998) 88:537–58. doi: 10.1596/1813-9450-1690
49. Zhang D, Mohsin M, Rasheed AK, Chang Y, Taghizadeh-Hesary F. Public spending and green economic growth in BRI region: mediating role of green finance. Energy Policy. (2021) 153:112256. doi: 10.1016/j.enpol.2021.112256
50. Zhang S, Wu Z, Wang Y, Hao Y. Fostering green development with green finance: an empirical study on the environmental effect of green credit policy in China. J Environ Manag. (2021) 296:113159. doi: 10.1016/j.jenvman.2021.113159
51. Liu D, Zhang Y, Hafeez M, Ullah S. Financial inclusion and its influence on economic-environmental performance: demand and supply perspectives. Environ Sci Pollut Res. (2022) 29:58212–21. doi: 10.1007/s11356-022-18856-1
52. Bettinger A. Fintech: a series of 40 time shared models used at manufacturers Hanover Trust Company. Interfaces. (1972) 2:62–3.
53. Lee CC, Li X, Yu CH, Zhao J. Does fintech innovation improve bank efficiency? Evidence from China's banking industry. Int Rev Econ Financ. (2021) 74:468–83. doi: 10.1016/j.iref.2021.03.009
54. Tao R, Su CW, Naqvi B, Rizvi SKA. Can Fintech development pave the way for a transition towards low-carbon economy: a global perspective. Technol Forecast Soc Change. (2022) 174:121278. doi: 10.1016/j.techfore.2021.121278
55. Zhong J, Wang M, Drakeford B, Li T. Spillover effects between oil and natural gas prices: evidence from emerging and developed markets. Green Finance. (2019) 1:30–45. doi: 10.3934/GF.2019.1.30
56. Liao G, Drakeford B. An analysis of financial support, technological progress and energy efficiency: evidence from China. Green Finance. (2019) 1:174–87. doi: 10.3934/GF.2019.2.174
57. Zhong J, Li T. Impact of financial development and its spatial spillover effect on green total factor productivity: evidence from 30 Provinces in China. Math Prob Eng. (2020) 2020:5741387. doi: 10.1155/2020/5741387
58. Yao Y, Hu D, Yang C, Tan Y. The impact and mechanism of Fintech on green total factor productivity. Green Finance. (2021) 3:198. doi: 10.3934/GF.2021011
59. Luo C, Li Y. Asymmetric influence of fintech, oil prices, and precious metals on green growth of emerging seven countries. Res Policy. (2024) 92:104956. doi: 10.1016/j.resourpol.2024.104956
60. Li Y, Liu CYN, Lao U, Dang J. Navigating the path to environmental sustainability: exploring the role of fintech, natural resources and green energy in Belt and Road countries. Res Policy. (2024) 88:104485. doi: 10.1016/j.resourpol.2023.104485
61. Xu J, Li T, Chen F, Quan Y. Does Fintech foster the development of green finance? Emerg Markets Financ Trade. (2024) 61:1771–81. doi: 10.1080/1540496X.2024.2430500
62. Xu H, Yang C, Li X, Liu R, Zhang Y. How do fintech, digitalization, green technologies influence sustainable environment in CIVETS nations? An evidence from CUP FM and CUP BC approaches. Res Policy. (2024) 92:104994. doi: 10.1016/j.resourpol.2024.104994
63. Liu Q, You Y. Fintech and green credit development—evidence from China. Sustainability. (2023) 15:5903. doi: 10.3390/su15075903
64. Nenavath S, Mishra S. Impact of green finance and fintech on sustainable economic growth: empirical evidence from India. Heliyon. (2023) 9:e16301. doi: 10.1016/j.heliyon.2023.e16301
65. Udeagha MC, Muchapondwa E. Green finance, fintech, and environmental sustainability: fresh policy insights from the BRICS nations. Int J Sustain Dev World Ecol. (2023) 30:633–49. doi: 10.1080/13504509.2023.2183526
66. Wei X. Research on the development of Fintech and green economy efficiency. Inform Syst Econ. (2023) 4:24–30. doi: 10.23977/infse.2023.040904
67. Megat PA, Khairudin MN, Haniffah NJ, Paramasivam G. Relationship of Fintech innovation with green growth sustainability moderated by blockchain smart contracts among small and medium sized enterprise in Selangor, Malaysia. Int J Econ Bus Admin. (2024) 12:51–81. doi: 10.35808/ijeba/853
68. Koh SCL, Morris J, Ebrahimi SM, Obayi R. Integrated resource efficiency: measurement and management. Int J Operat Prod Manag. (2016) 36:1576–600. doi: 10.1108/IJOPM-05-2015-0266
69. Kirikkaleli D. Resource efficiency, energy productivity, and environmental quality in Japan. Res Policy. (2023) 85:104006. doi: 10.1016/j.resourpol.2023.104006
70. Peet R, Watts M. Introduction: development theory and environment in an age of market triumphalism. Econ Geogr. (1993) 69:227–53. doi: 10.2307/143449
71. Oanh TTK. Sustainable development: driving force from the relationship between finance inclusion, green finance and green growth. Sustain Dev. (2024) 32:2811–29. doi: 10.1002/sd.2808
72. Murtaza MR, Hongzhong F, Magdalena R, Javed H, Ileana SC. Nexus of green energy, financial inclusion, militarization, and environmental sustainability: a global perspective. PLoS ONE. (2024) 19:e0301122. doi: 10.1371/journal.pone.0301122
73. Said R. Financial inclusion and environmental pollution in sub-Saharan Africa: moderating effects of economic growth and renewable energy. Environ Sci Pollut Res. (2024) 31:55346–360. doi: 10.1007/s11356-024-34785-7
74. Mehmood U. Examining the role of financial inclusion towards CO2 emissions: presenting the role of renewable energy and globalization in the context of EKC. Environ Sci Pollut Res. (2022) 29:15946–54. doi: 10.1007/s11356-021-16898-5
75. Lin S, Wu R. On the nexus between energy efficiency, financial inclusion and environment: evidence from emerging seven economies using novel research methods. Econ Res Ekon IstraŽ. (2022) 35:6756–79. doi: 10.1080/1331677X.2022.2053362
76. Hussain S, Jawad S, Shahzad H. Financial inclusion and CO2 emissions in Asia: implications for environmental sustainability. Econ Polit Stud. (2021) 12:88–104. doi: 10.1080/20954816.2023.2273003
77. Le TH, Le HC, Taghizadeh-Hesary F. Does financial inclusion impact CO2 emissions? Evidence from Asia. Financ Res Lett. (2020) 34:101451. doi: 10.1016/j.frl.2020.101451
78. Ai X, Guo K, Zhang H. Can digital financial inclusion affect green development? An empirical analysis based on China's provinces. Adv Manag Appl Econ. (2023) 13:163–87. doi: 10.47260/amae/1336
79. Tang P, Ma H, Sun Y, Xu X. Exploring the role of Fintech, green finance and natural resources towards environmental sustainability: a study on ASEAN economies. Res Policy. (2024) 94:105115. doi: 10.1016/j.resourpol.2024.105115
80. Field A. Discovering Statistics Using SPSS for Windows. London, UK; Thousand Oaks, CA; New Delhi, India: Sage Publications (2000).
81. Pesaran MH. General diagnostic tests for cross section dependence in panels. Cambridge Working Papers in Economics, 0435, Faculty of Economics, University of Cambridge (2004). doi: 10.2139/ssrn.572504
82. Pesaran MH, Yamagata T. Testing slope homogeneity in large panels. J Econom. (2008) 142:50–93. doi: 10.1016/j.jeconom.2007.05.010
83. Pesaran MH. A simple panel unit root test in the presence of cross-section dependency. Cambridge Working Papers in Economics (2006).
84. Pesaran MH, Shin Y, Smith RJ. Poled mean group estimation of dynamic heterogeneous panels. J Am Stat Assoc. (1999) 94:621–34. doi: 10.1080/01621459.1999.10474156
85. Dumitrescu EI, Hurlin C. Testing for Granger noncausality in heterogeneous panels. Econ Model. (2012) 29:1450–60. doi: 10.1016/j.econmod.2012.02.014
86. Stock JH, Watson MW. A simple estimator of cointegrating vectors in higher order integrated systems. Econometrica. (1993) 61:783–820. doi: 10.2307/2951763
87. Park JY. Canonical cointegrating regressions. Econometrica. (1992) 60:119–43. doi: 10.2307/2951679
88. Torrence C, Compo GP. A practical guide to wavelet analysis. Bullet Am Meteorol Soc. (1998) 79:61–78. doi: 10.1175/1520-0477(1998)079 < 0061:APGTWA>2.0.CO;2
89. Grinsted A, Moore JC, Jevrejeva S. Application of the cross wavelet transform and wavelet coherence to geophysical time series. Nonlinear Process Geophys. (2004) 11:561–6. doi: 10.5194/npg-11-561-2004
90. Rasheed MQ, Ahad M, Shahzad K, Imran ZA. Economic policy uncertainty and green growth in IEA member countries: a role of environmental stringency policy. Nat Res Forum. (2025) 49:44–66. doi: 10.1111/1477-8947.12376
91. Sethi L, Pata UK, Behera B, Sahoo M, Sethi N. Sustainable future orientation for BRICS+ nations: green growth, political stability, renewable energy and technology for ecological footprint mitigation. Renew Energy. (2025) 244:122701. doi: 10.1016/j.renene.2025.122701
92. Sun Y, Li T, Mehmood U. Balancing acts: assessing the roles of renewable energy, economic complexity, Fintech, green finance, green growth, and economic performance in G-20 countries amidst sustainability efforts. Appl Energy. (2025) 378:124846. doi: 10.1016/j.apenergy.2024.124846
93. Ayayi AG, Dout H. The dynamics of the financial inclusion index for developing countries: lessons learned. J Financ Econ Policy. (2024) 16:383–403. doi: 10.1108/JFEP-01-2023-0029
94. Nguyen AHT, Pham VQ, Phan HT. Applying Bayesian methods to measure the impact of financial inclusion on banking performance: an empirical analysis for selected countries in Asia. J Econ Finance. (2025) 49,493–510. doi: 10.1007/s12197-025-09713-1
95. Tawiah V, Zakari A, Adedoyin FF. Determinants of green growth in developed and developing countries. Environ Sci Pollut Res. (2021) 28:39227–42. doi: 10.1007/s11356-021-13429-0
96. Xiao D, Gao L, Xu L, Wang Z, Wei W. Revisiting the green growth effect of foreign direct investment from the perspective of environmental regulation: evidence from China. Int J Environ Res Public Health. (2023) 20:2655. doi: 10.3390/ijerph20032655
97. Ofori IK, Figari F, Ojong N. Towards sustainability: the relationship between foreign direct investment, economic freedom and inclusive green growth. J Clean Product. (2023) 406:137020. doi: 10.1016/j.jclepro.2023.137020
98. Mohd SH, Baharumshah AZ, Fountas S. Inflation, inflation uncertainty and output growth: recent evidence from ASEAN-5 countries. Singap Econ Rev. (2013) 58:1350030. doi: 10.1142/S0217590813500306
99. Thanh SD. Threshold effects of inflation on growth in the ASEAN-5 countries: a panel smooth transition regression approach. J Econ Financ Admin Sci. (2015) 20:41–8. doi: 10.1016/j.jefas.2015.01.003
100. Hidthiir MHB, Ahmad Z, Junoh MZM, Yusof MFB. Dynamics of economic growth in ASEAN-5 countries: A panel ARDL approach. Discov Sustain. (2024) 5:145. doi: 10.1007/s43621-024-00351-x
101. Ansari A, Qureshi SA. Financial inclusion index for Pakistan from 2008 to 2022 using three-staged PCA analysis. UW J Manage Sci. (2024) 8. doi: 10.56220/uwjms.v8i2.238
Keywords: FinTech, financial inclusion, green growth, ASEAN-5, panel data analysis, wavelet coherence analysis
Citation: Demirkale O, Duran NI, Han A and Seyranlioglu O (2025) FinTech, financial inclusion, and green growth in ASEAN-5 countries: evidence from multidimensional panel analysis methods. Front. Appl. Math. Stat. 11:1679956. doi: 10.3389/fams.2025.1679956
Received: 05 August 2025; Revised: 27 October 2025;
Accepted: 24 November 2025; Published: 11 December 2025.
Edited by:
Qasim Raza Syed, National Tariff Commission, PakistanReviewed by:
Alladoumbaye Ngueilbaye, Shenzhen University, ChinaJianzheng Shi, Singapore University of Social Sciences, Singapore
Farooq Bajwa, Hainan University, China
Copyright © 2025 Demirkale, Duran, Han and Seyranlioglu. This is an open-access article distributed under the terms of the Creative Commons Attribution License (CC BY). The use, distribution or reproduction in other forums is permitted, provided the original author(s) and the copyright owner(s) are credited and that the original publication in this journal is cited, in accordance with accepted academic practice. No use, distribution or reproduction is permitted which does not comply with these terms.
*Correspondence: Ozge Demirkale, b3pnZWRlbWlya2FsZUBheWRpbi5lZHUudHI=