 Taha Hussein Ali
 Hutheyfa Hazem Taha
 Bekhal Samad Sedeeq1
 Heyam A. A. Hayawi
- 1Department of Statistics and Informatics, College of Administration and Economics, Salahaddin University, Erbil, Iraq
- 2Department of Operations Research and Intelligent Techniques, College of Computer Science and Mathematics, University of Mosul, Mosul, Iraq
- 3Department of Statistics and Informatics, College of Computer and Mathematical Science, University of Mosul, Mosul, Iraq
Introduction: Statistical Process Control (SPC) charts are widely used to detect process shifts, yet classical Shewhart X̄ charts often fail in the presence of outliers and non-normal data distributions. To address these shortcomings, we propose a hybrid approach that integrates discrete wavelet decomposition with support vector machine (SVM) classification for enhanced outlier detection.
Methods: The proposed Dynamic Wavelet-SVM X̄ Chart (DWS-X̄) combines multi-resolution wavelet feature extraction with an SVM classifier to distinguish between in-control and out-of-control states. Its performance was assessed through extensive simulations varying subgroup size, number of subgroups, and contamination levels. Key metrics included Detection Rate (DR), False Alarm Rate (FAR), and Average Run Length (ARL).
Results: Simulation results consistently demonstrated the superiority of the DWS-X̄ chart compared to the traditional X̄ chart. The hybrid chart achieved higher detection rates (above 96%), lower false alarm rates (below 1-6% depending on variability), and shorter ARLs (1.6-5.1). Application to real neonatal heart rate data further confirmed its enhanced sensitivity in identifying abnormal cardiac patterns.
Discussion: The findings indicate that the proposed DWS-X̄ chart provides more reliable monitoring under contamination and high variability, offering earlier detection of abnormal signals with fewer false alarms. This hybrid method holds promise for both industrial quality control and healthcare process monitoring.
1 Introduction
Production processes and healthcare supervision systems must be kept straight in industry as well as under clinical conditions. The use of Statistical Process Control or SPC charts to detect when a process mean has shifted, particularly via the well-known Shewhart X̄ chart, is not new. But they fail in cases of non-normal distributions of the data, when there are outliers, or with small variations in the process, because they are not designed for that purpose, resulting in a later detection of the problem as well as reduced reliability of the process (1). These shortcomings have been taken into consideration, and more recently, attempts have been made to enhance traditional control charts using more sophisticated data processing tools, such as wavelet transformation and machine learning algorithms.
Wavelet analysis is gaining popularity in quality control because it can detect information at both local and global scales in a data series. The DWT is particularly useful as it decomposes data into approximation and detail coefficients, which “better separate noise and help in detection of small or ephemeral changes in process behavior.” Particularly, Abdullah et al. proposed the use of a CUSUM control chart based on Symlets wavelets and proved that wavelet-based denoising yields control charts with greater sensitivity to small shifts in the process (2). Similarly, Ameen and Ali applied Haar wavelet coefficients to obtain separate charts of the low- and high-frequency process components and demonstrated the superior sensitivity of wavelet charts to detect minor shifts in the context of both simulated and actual data (3).
In addition to wavelet-based methods, various Bayesian and machine learning methods have been incorporated into SPC. Tareq et al. performed a comparison of classical Shewhart and Bayesian control charts for monitoring blood glucose in newborns (4). Their results showed that the Bayesian chart produced earlier signals of detection and had a lower false alarm rate than its classical counterpart, which demonstrated the possibilities of data-driven techniques for increasing the accuracy of process monitoring.
Given these trends, there will still be the need for hybrid models that exploit the advantages of the wavelet transforming algorithm’s robustness to noise and the power of modern machine learning classification algorithms. The present work is one attempt to fill this gap by proposing a novel hybrid control chart based on discrete wavelet decomposition and the SVM classifier that improves outlier detection and the process monitoring shift. The advantages of the traditional X̄ chart in the expected detection capability of this approach versus the traditional approach are discussed using both simulated data as well as actual neonatal heart rate data.
This study makes two contributions. First, it proposes the use of a DWS-X̄ type control chart that merges DWS signal classification using wavelets with an SVM classifier that seeks to minimize false alarms while increasing the detection rate. Second, it demonstrates the advantages of this strategy through a set of simulated experiments and a case study of real data in a clinic.
More recent studies showed the employment of machine learning and wavelet-based techniques for improved sensitivity of control charts (2, 5–7).
2 Methodology
2.1 Classical-X̄ chart
The X̄ chart is one of the most basic of the statistical process control charts and is designed to identify when the process mean is out of control. It assumes that observations are taken in subgroups of size n, and that the process variation is normally distributed (8).
Given observations Xij where i = 1, 2, …, m denotes the subgroup and j = 1, 2, …, n denotes the sample within the subgroup, the subgroup mean is calculated as shown in Equation 1:
The overall mean process is (Target Line) estimated by Equation 2:
The process of standard deviation 𝜎 is either known or estimated from the sample data. Using the standard deviation, the control limits are defined according to the 3-sigma rule is determined using Equation 3 (9):
The lower control limit is defined by Equation 4, completing the three-sigma boundaries for process monitoring.
These limits represent thresholds for monitoring the process average. Points outside these limits signal potential out-of-control conditions requiring investigation. If σ is unknown, it can be estimated by calculating the standard deviation of the subgroup means or from historical data. The Classical X̄ chart plots each subgroup mean sequentially. Its strength lies in detecting significant shifts in the process mean. However, it can be less effective for identifying small or gradual changes and is sensitive to the presence of outliers (10).
2.2 Proposed methodology
This study proposes a novel hybrid control chart, namely the Dynamic Wavelet-Support Vector Machine X̄ Chart (DWS-X̄ Chart), aimed at improving anomaly detection performance in process monitoring applications. The approach synergistically integrates discrete wavelet transform (DWT) based multi-resolution signal analysis with an SVM classifier, enabling enhanced sensitivity and specificity compared to traditional X̄ charts.
I. Sample Means: Let denote the j-th observation in the i-th subgroup, where 𝑖 = 1, 2, …, m and j = 1, 2, …, n. The sample mean for each subgroup is computed as in Equation 1. Here, n represents the subgroup size, while m corresponds to the total number of subgroups considered.
II. Discrete Wavelet Transform (DWT): To capture both temporal and frequency characteristics of the sequence The discrete wavelet transform is employed. The DWT decomposes the signal into its approximation and detail components across multiple resolution levels, thus facilitating the extraction of pertinent features associated with process shifts or anomalies (11). The discrete wavelet decomposition of the subgroup means is expressed in Equation 5, separating approximation and detail coefficients.
Where Al and Dl denote the approximation (low-frequency) and detail (high-frequency) coefficients, respectively.
I. Feature Extraction: From the wavelet coefficients obtained, feature vectors fi are constructed for each subgroup i. These features typically include statistical summaries such as the mean, standard deviation, and energy of the coefficients. The feature vector constructed from wavelet coefficients for each subgroup is formulated in Equation 6:
The mean and standard deviation operators, respectively, are μ(·) and σ(·).
I. Support Vector Machine Classification: A supervised SVM classifier is trained using the extracted feature vectors to differentiate between in-control and out-of-control states. The decision function of the SVM is expressed as in Equation 7 (12):
Where M is the number of support vectors, αk are learned coefficients, yk ∈ {−1, +1} are class labels, K (·, ·) is the kernel function (e.g., radial basis function), and b is the bias term. Subgroups are classified as out-of-control when g(f) = +1, and as in-control otherwise.
In this study, the Support Vector Machine classifier was implemented using the Radial Basis Function (RBF) kernel, as it demonstrated superior performance in non-linear classification problems. The kernel parameter γ and the penalty parameter C were optimized through grid search combined with 10-fold cross-validation on the training data. The grid search considered C values ranging from 0.1 to 100 and γ values between 0.001 and 10. The optimal parameters (C = 10, γ = 0.1) were selected based on the highest average classification accuracy across validation folds. The dataset was randomly split into training (70%) and testing (30%) subsets to ensure generalizability, and the SVM was trained exclusively on wavelet-derived feature vectors. To avoid potential bias due to imbalanced subgroup labeling, class weights were adjusted during training. The decision boundary produced by the trained SVM classifier was then applied to unseen subgroups to differentiate between in-control and out-of-control states.
I. Control Limits for the Hybrid Chart: The DWS-X̄ chart control limits are defined as in Equations 8 and 9:
Where Target and S denote the in-control process mean and standard deviation, respectively.
In the proposed hybrid approach, these control limits are applied exclusively to subgroups classified as in-control by the SVM for DWT coefficients. Any subgroup flagged as out-of-control by the classifier immediately triggers an alarm, thereby enhancing sensitivity.
2.3 Performance metrics
The proposed method’s performance is evaluated based on the following criteria:
I. The Detection Rate (DR) is computed as described in Equation 10, reflecting No. of in-control points falsely:
A higher detection rate is desirable, as it indicates the control chart’s ability to accurately identify out-of-control points (13).
I. The False Alarm Rate (FAR) is evaluated using Equation 11, reflecting in-control samples misclassified as out-of-control:
A lower false alarm rate is preferable, reflecting fewer in-control points mistakenly flagged as out-of-control (14).
I. The Average Run Length (ARL), representing the expected number of samples before an alarm is triggered, is estimated by Equation 12:
Lower ARL values under out-of-control conditions indicate a faster detection capability (11).
3 Discussion results
Analysis of real process data and simulation experiments. A series of simulation studies was conducted to evaluate the ability of the chart to identify changes in a controlled setting where the process is well understood. Shifts of varying magnitudes to the process mean were simulated to create different scenarios and enable direct comparisons between the new chart and the traditional X̄ Chart. Besides, a real dataset was employed to assess how the methods perform “in practice” as opposed to “in theory,” via a simulation study. This was a necessary step to ensure that the benefits shown in the simulation could also be realized under actual process monitoring. The use of both approaches guarantees that DWS-X̄ Chart evaluation is as broad and pertinent as possible.
3.1 Simulation experiments
To fully assess the proposed hybrid control chart, a set of simulation conditions was established by changing some of the most important features that influence the performance of monitoring processes. These included the number of outliers added to the data, the size of the subgroups (n), the total number of subgroups (m), and the standard deviation of the process (σ). Different combinations of these parameters were chosen to depict steady and disrupted processes. Subgroups of sizes 5 and 10 were used to evaluate the effect of sample size on the sensitivity of control charts. The number of subgroups ranged, similarly, between 20 and 100, with detection being tested in short and long sessions, always at an average of 20. An additional two levels of process variability (σ = 1 and σ = 2) were used, as well as two values of the proportion of outliers: 5% as representative of a small disturbance and 10% as a case where the process shifts are more evident.
Synthetic process data were created by selecting a given percentage of the data points and randomly altering those chosen to be the outliers. Both the X̄ chart and the new hybrid control chart were constructed to evaluate the generated data for each of the simulation’s scenarios. They then went ahead and evaluated and compared their performances, using the following three key indicators: DR, FAR and ARL, providing a clear measure of each chart’s ability to detect a shift in the process while remaining in control of false alarms. To obtain stable and reliable results, each simulation scenario was performed 1,000 times, and the average values of the performance metrics were obtained for further analysis. This approach allowed for a feasible assessment of the proposed chart’s performance in anomaly detection in varying scenarios, as well as a feasible comparison of the proposed chart’s performance to the classical X̄ chart’s performance under specific and controlled conditions.
The results of the first simulation case, in which the process was followed of 20 subgroups (m = 20) of 5 observations (n = 5), are shown in Figure 1, which compares the performance of the traditional X̄ chart and the proposed hybrid DWS-X̄ chart. Designed to test the robustness of each chart, the process standard deviation was σ = 1, and 5% of outliers were intentionally added. Referring to the top panel of the classical X̄ control chart, there are two subgroups whose means are above the UCL = 21.342, suggesting there may be a shift in the process. The control limits are relatively tight, with an LCL of 18.658. The narrow control range increases the capability of the chart to identify a shift but is associated with a higher risk of false alarms, as some random variation may also produce an out-of-control signal.
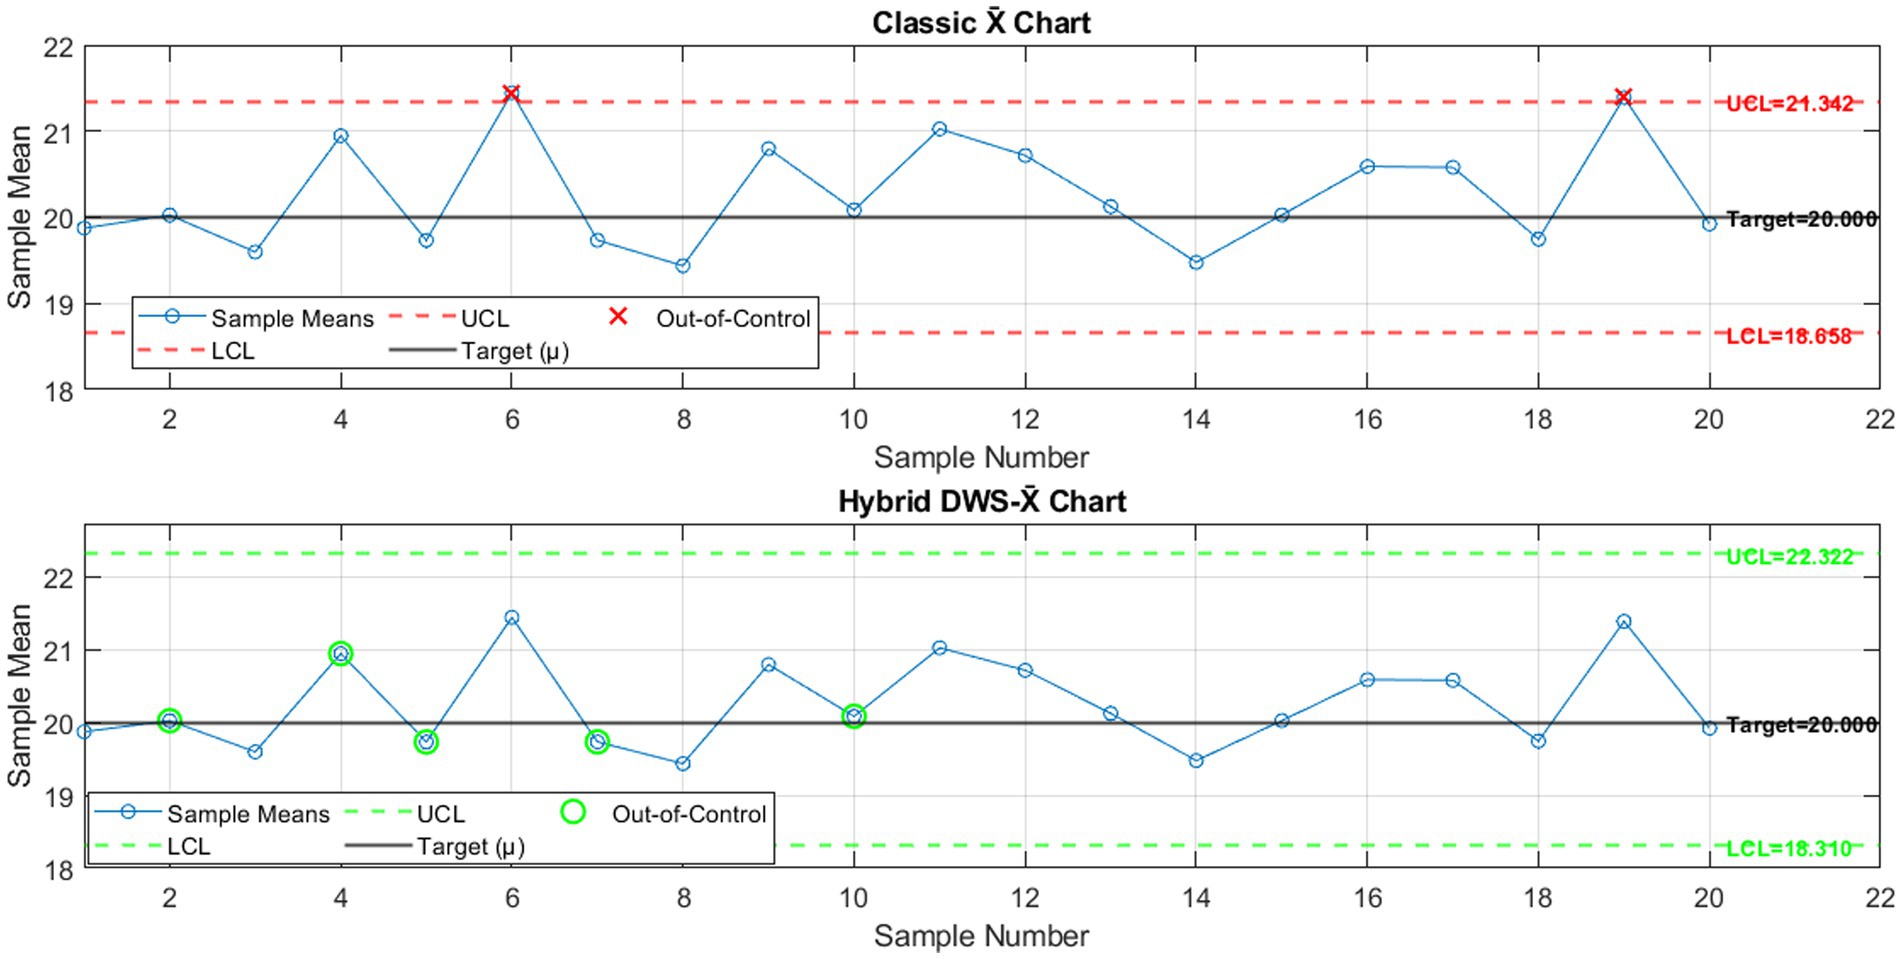
Figure 1. Classical X̄ chart versus hybrid DWS-X̄ chart for 20 subgroups (n = 5, σ = 1, Outliers = 5%).
On the contrary, the hybrid DWS-X̄ chart in the bottom panel implements the DWS-X̄ chart, which blends discrete wavelet decomposition with support vector machine classification for the detection improvement process. The resultant hybrid chart has upper and lower control limits, UCL = 22.322 and LCL = 18.310, which indicate a more forgiving boundary aimed at reducing false alarms without compromising detection strength. Despite the larger ranges, the hybrid representation remained sensitive in capturing important variations associated with the injected outliers.
In general, this comparison illustrates inherent sensitivity versus false alarm rate control chart design trade-off in control chart designs. Because of its narrower control limits, the standard X̄ chart is also more biased toward false positive results under outlier contaminations than the hybrid DWS-X̄ control chart, which achieves a more favorable compromise through employing wavelet filtering and machine learning based classification. Combining the two methods this way improves robustness and delivers a more reliable model when some data is anomalous.
Figure 2 displays the comparative results of 1,000 simulation runs for both the classical X̄ chart and the proposed hybrid DWS-X̄ chart across three key performance indicators: DR, FAR, and ARL. The top panel shows the DR for each simulation. The hybrid DWS-X̄ chart consistently achieved a higher DR, maintaining values close to 100% across nearly all simulations, while the classical X̄ chart exhibited considerable variability with lower and inconsistent detection rates.
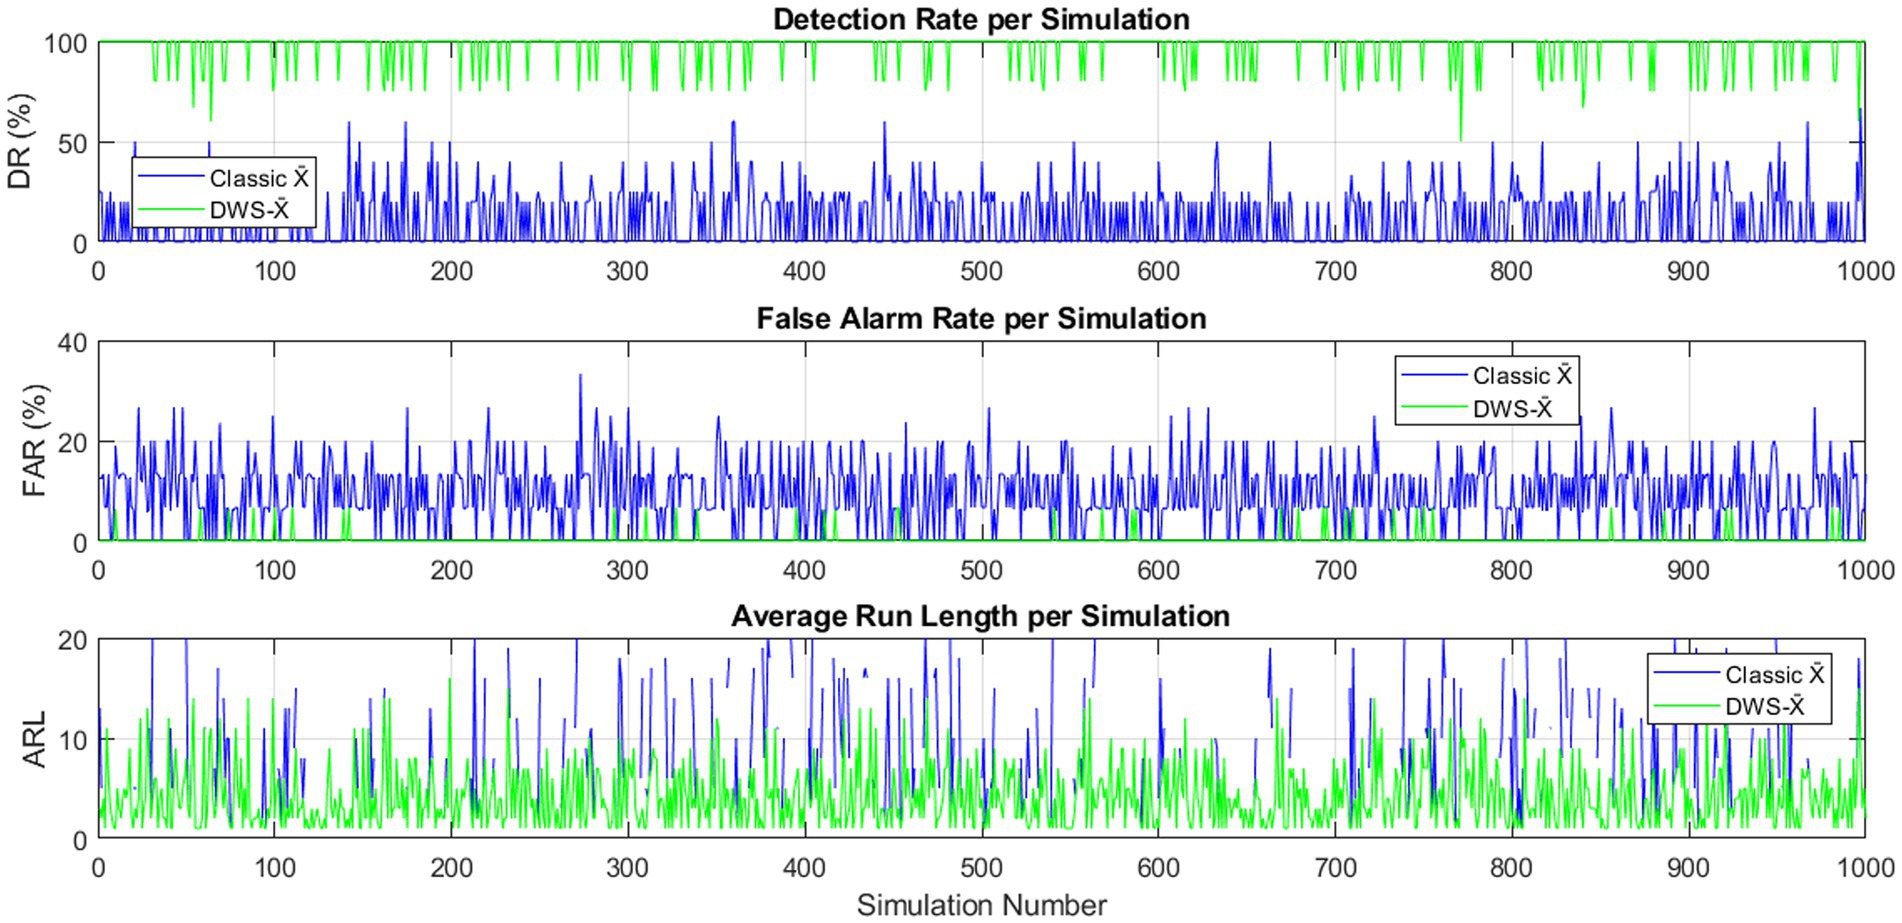
Figure 2. DR, FAR, and ARL for classical and hybrid DWS-X̄ charts across 1,000 simulations (n = 5, m = 20, σ = 1, Outliers = 5%).
The middle panel illustrates the FAR per simulation. Here, the classical X̄ chart frequently produced higher FAR, as indicated by the dense and scattered spikes throughout the simulations. The hybrid chart, on the other hand, showed a lower and more stable FAR, indicating better discriminatory power of normal vs. abnormal observations.
Lastly, the bottom panel shows the ARL of each simulation. The hybrid chart had significantly lower ARL in all the out-of-control scenarios, thus reacted more rapidly when there was a change in the process signals as opposed to the classical chart, which had more scattered and higher ARL values.
In general, it can be concluded that the efficiency and reliability of the hybrid control chart at detecting process aberrations while achieving improved control over false alarms is consistent and superior.
Figure 3 compares the classical X̄ chart and the hybrid DWS-X̄ chart for 50 subgroups (n = 5, σ = 1, outliers = 5%). The classical chart identified a small number of points outside the control limits, suggesting low sensitivity to outlier data points. On the contrary, the hybrid DWS-X̄ chart detected more significantly, and its signal detection pattern was dispersed and outperformed the remaining charts under contamination, thus proving to be a better tool in identifying shifts in the process.
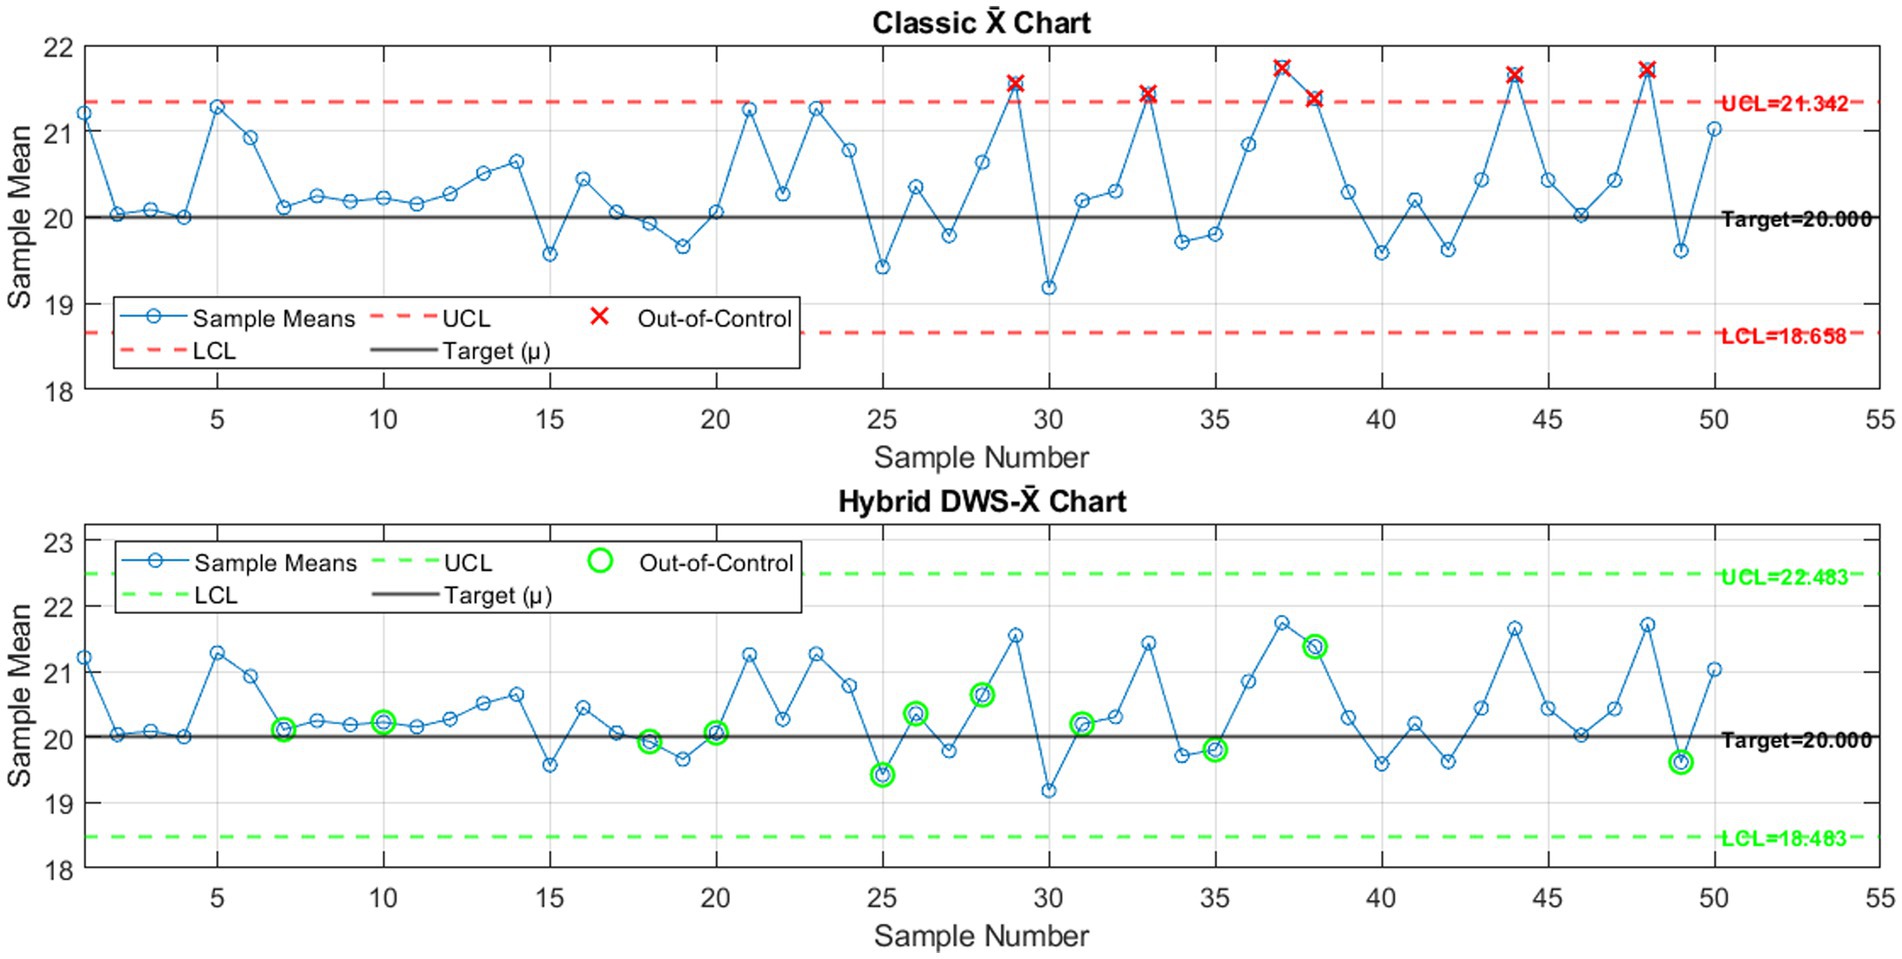
Figure 3. Classical X̄ chart versus hybrid DWS-X̄ chart for 50 subgroups (n = 5, σ = 1, Outliers = 5%).
Figure 4 illustrates the DR, FAR, and ARL for the classical and hybrid DWS-X̄ charts over 1,000 simulations (n = 5, m = 50, σ = 1, outliers = 5%). The hybrid chart consistently showed superior performance with higher DR, lower FAR, and reduced ARL compared to the classical chart. This confirms the enhanced effectiveness and reliability of the hybrid approach in detecting process shifts in the presence of outliers.
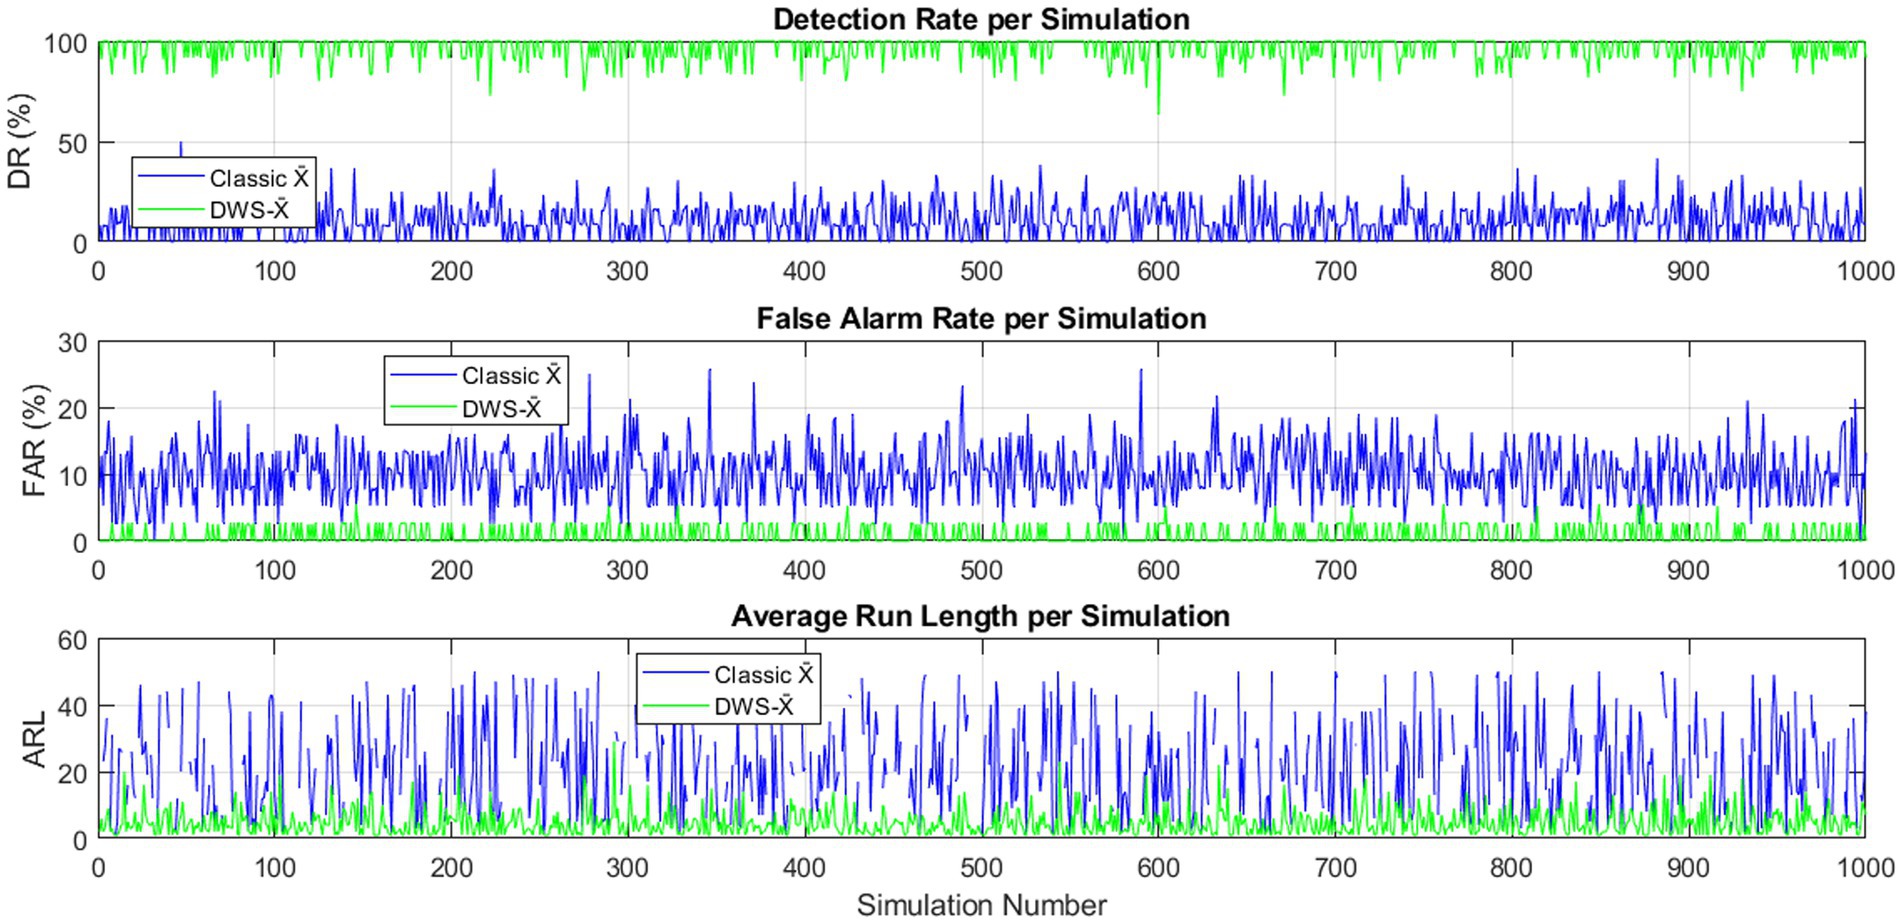
Figure 4. DR, FAR, and ARL for classical and hybrid DWS-X̄ charts across 1,000 simulations (n = 5, m = 50, σ = 1, Outliers = 5%).
Figure 5 compares the classical X̄ chart and the hybrid DWS-X̄ chart for 75 subgroups (n = 5, σ = 1, outliers = 5%). The classical chart showed limited detection ability, with few out-of-control signals and several undetected points. In contrast, the hybrid DWS-X̄ chart demonstrated higher sensitivity, identifying a greater number of out-of-control points and responding faster to shifts. This confirms the advantage of integrating wavelet decomposition and SVM filtering in improving detection performance under small sample sizes and moderate outlier presence.
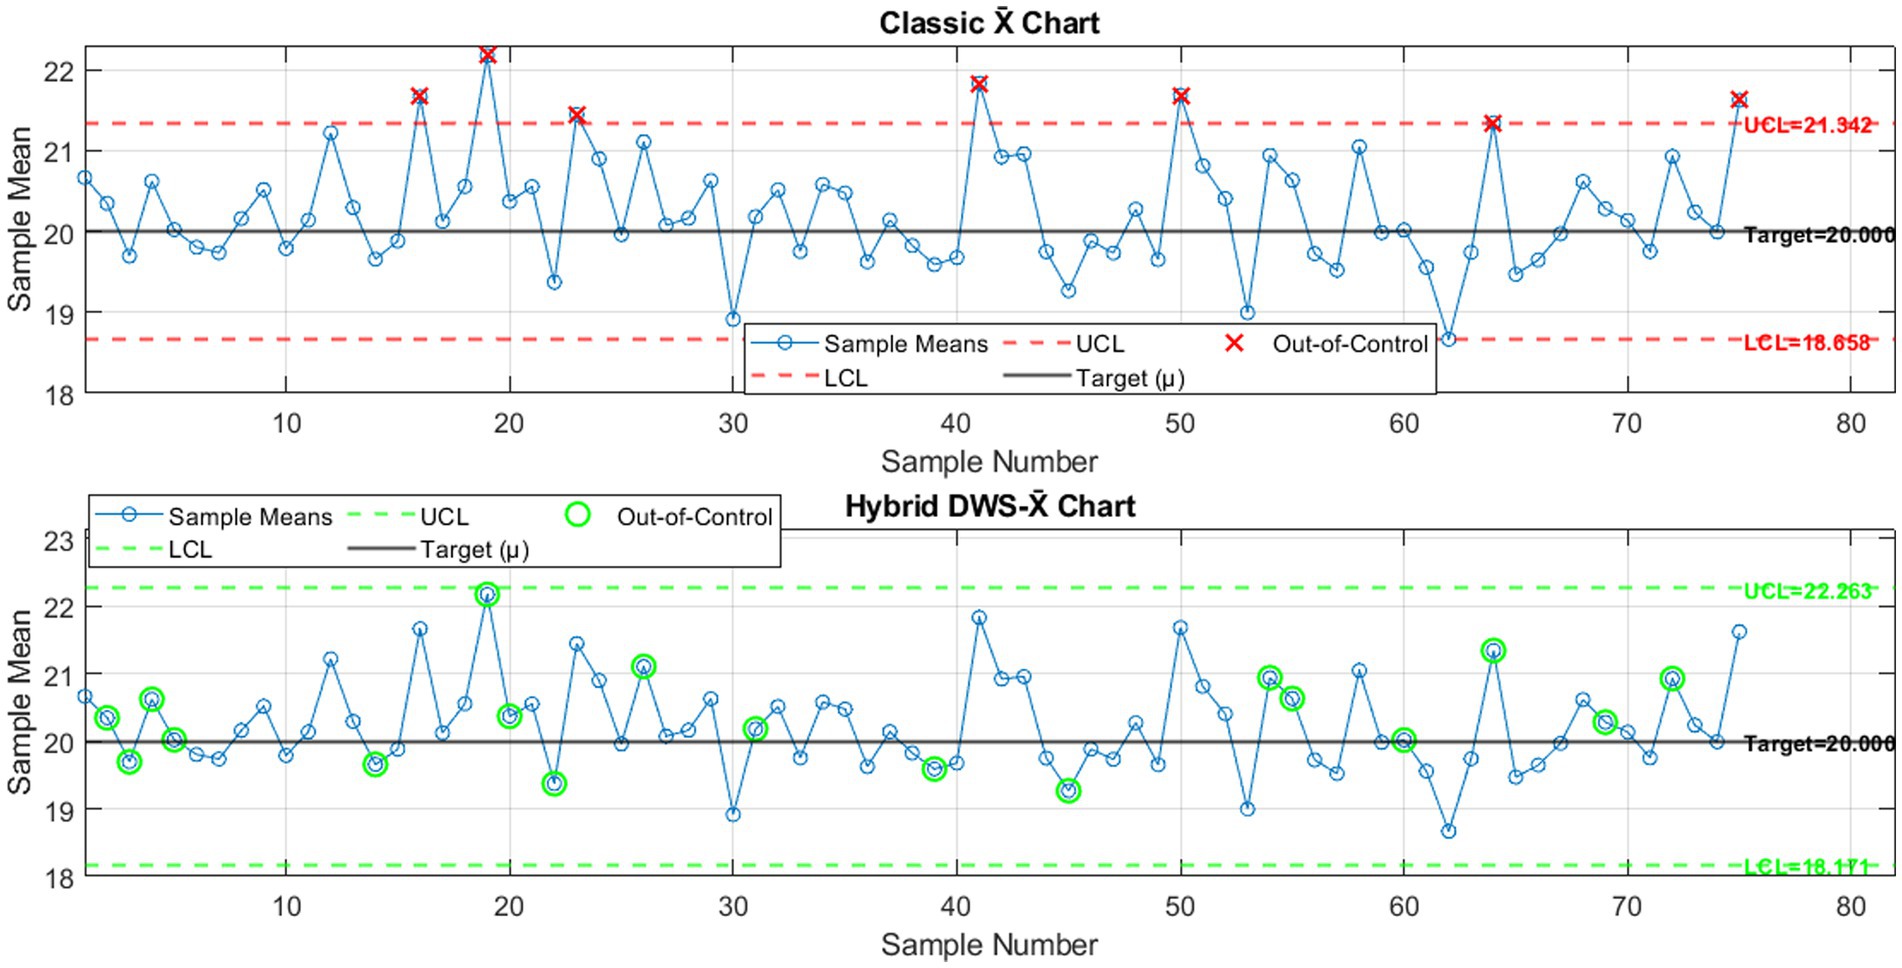
Figure 5. Classical X̄ chart versus hybrid DWS-X̄ chart for 75 subgroups (n = 5, σ = 1, Outliers = 5%).
Figure 6 illustrates the classical X̄ chart versus the hybrid DWS-X̄ chart in terms of the DR, FAR, and ARL from 1,000 simulation runs where n = 5, m = 75, σ = 1, and outliers = 5%. It was found that the hybrid chart has significantly higher DR and lower FAR than the classical chart. Also, the smaller ARL calculated for the hybrid DWS-X̄ chart suggests that it can identify shifts in the process more quickly. These results validate the improved efficiency and reliability of the new hybrid approach for handling outlier-contaminated data.
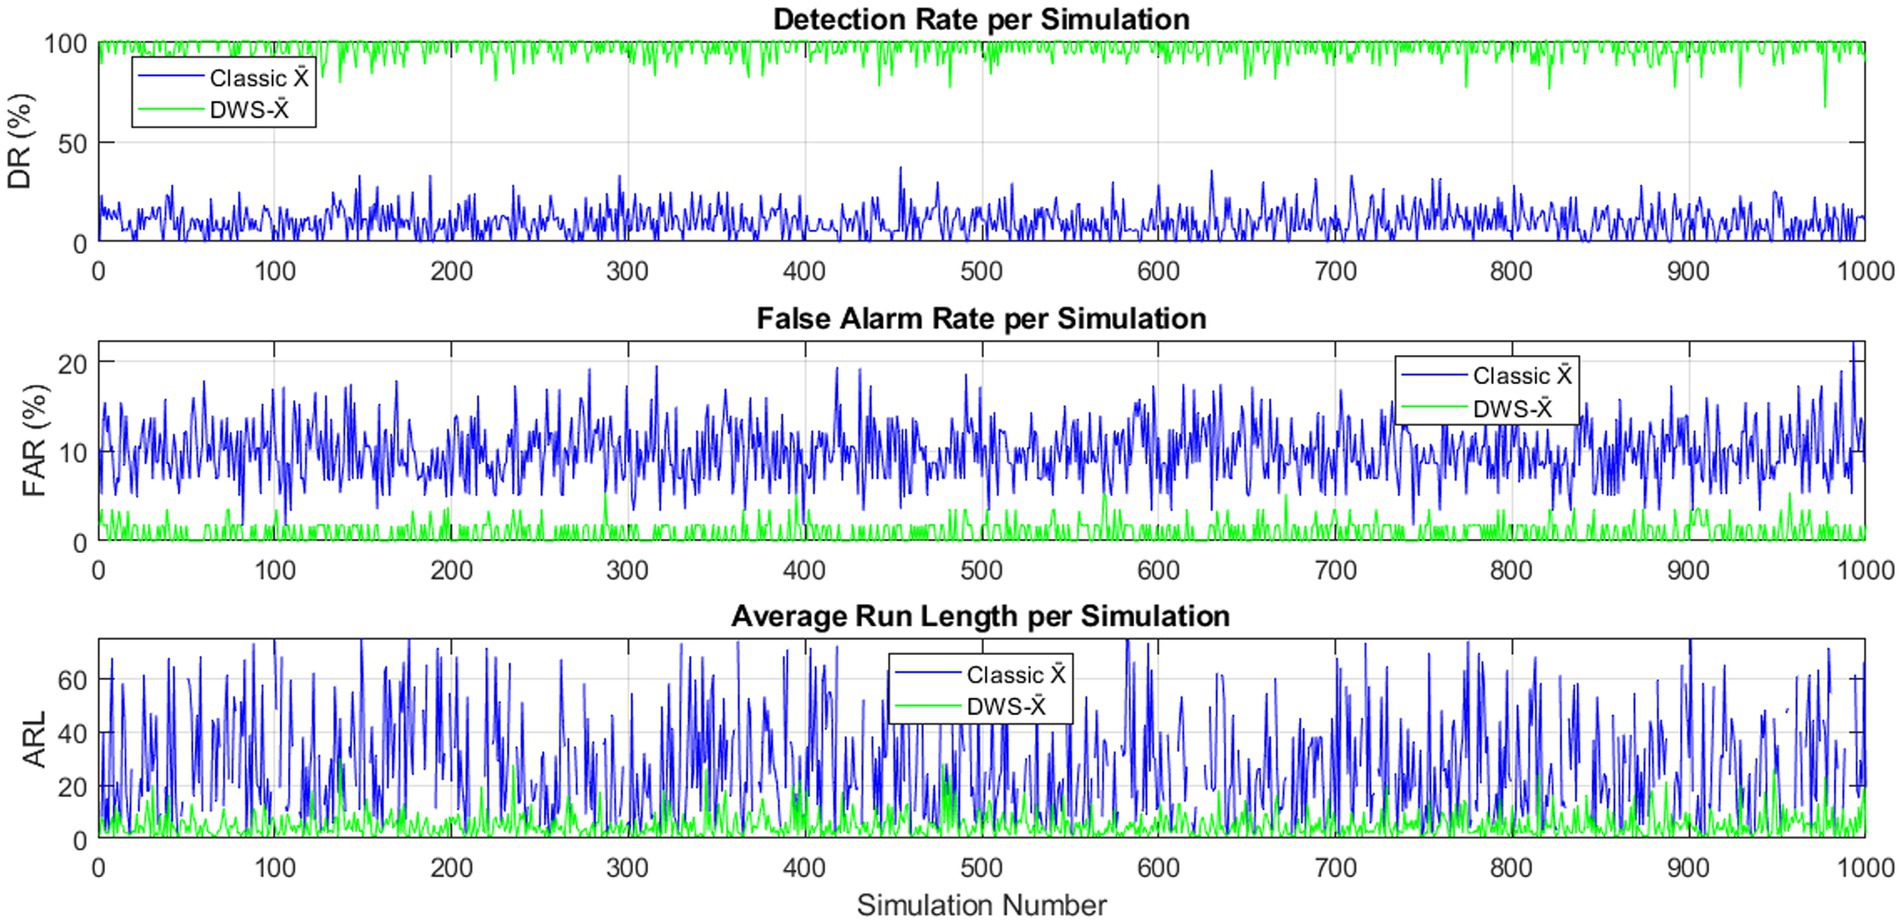
Figure 6. DR, FAR, and ARL for classical and hybrid DWS-X̄ charts across 1,000 simulations (n = 5, m = 75, σ = 1, Outliers = 5%).
Figure 7 displays the classical X̄ chart and the hybrid DWS-X̄ chart for 100 subgroups (n = 5, σ = 1, outliers = 5%). Like previous results, the classical chart detected a few out-of-control points, leaving several anomalies unnoticed. In contrast, the hybrid DWS-X̄ chart showed clearer signals and a higher number of out-of-control detections. The improved responsiveness of the hybrid chart highlights its capability in identifying process shifts more effectively under outlier contamination.
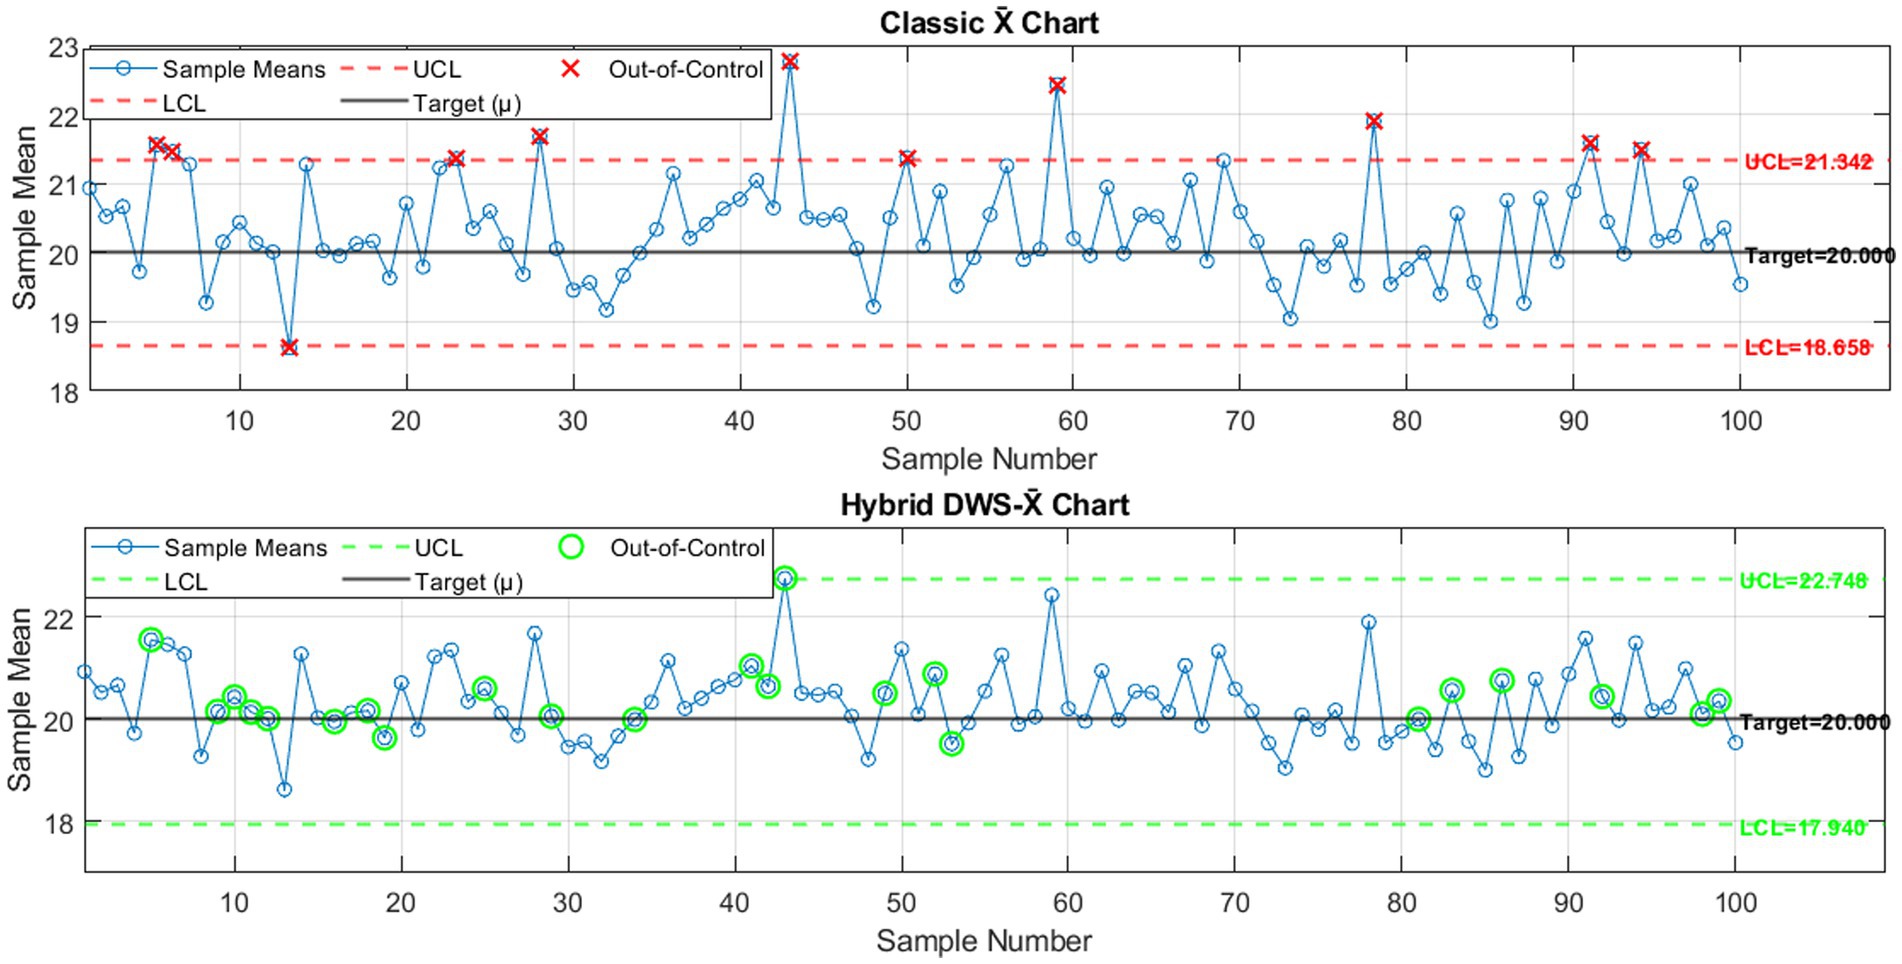
Figure 7. Classical X̄ chart versus hybrid DWS-X̄ chart for 100 subgroups (n = 5, σ = 1, Outliers = 5%).
Figure 8 compares the DR, FAR, and ARL of the classical and hybrid DWS-X̄ charts based on 1,000 simulation runs (n = 5, m = 100, σ = 1, outliers = 5%). The performance of the hybrid DWS-X̄ chart was superior to the traditional one in terms of having the highest DR and the lowest FAR and ARL. These findings support the higher sensitivity and accuracy of the hybrid chart in identifying changes in the process, even in the presence of outliers.
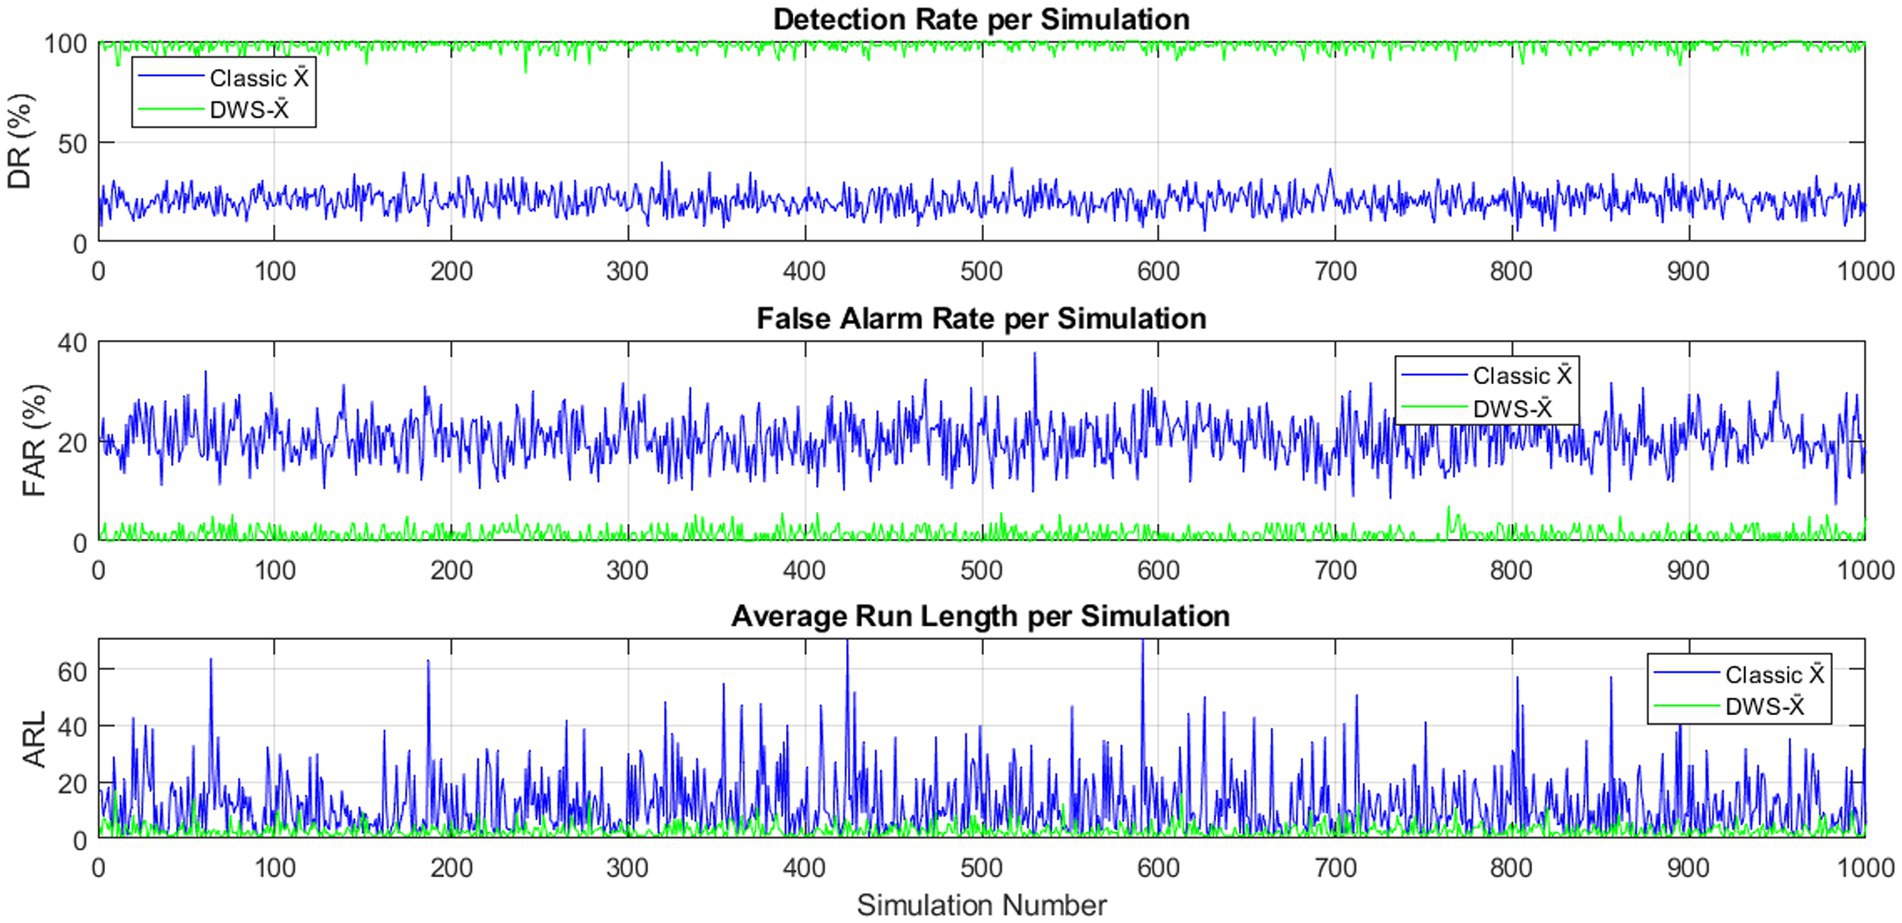
Figure 8. DR, FAR, and ARL for classical and hybrid DWS-X̄ charts across 1,000 simulations (n = 5, m = 100, σ = 1, Outliers = 5%).
To achieve a comprehensive comparison between the proposed hybrid DWS-X̄ chart and the traditional X̄ chart, a set of simulation experiments was devised that explores several scenarios of the process. The simulations differed in subgroup sizes of 5 and 10, process standard deviations of σ = 1 and σ = 2, and two levels of proportions of outliers at 10 and 15%. Given that, m varied between 20 and 100 to represent distinct tracking horizons. To determine LCL, UCL, DR, FAR, and ARL, 1000 simulations were run for each of the proposed scenarios. Results from each of these four conditions are summarized in the next four tables.
Table 1 compares the performance of the classical X̄ chart and the proposed hybrid DWS-X̄ chart across different numbers of subgroups (m = 20, 50, 75, 100) under identical process settings. Across all cases, the DWS-X̄ chart consistently achieved a significantly higher DR, exceeding 96% in all scenarios, while the classical X̄ chart maintained very low DR values around 10%. In terms of the FAR, the classical chart consistently recorded rates close to 10%, indicating a high risk of unnecessary alarms. In contrast, the hybrid chart maintained much lower FAR values, remaining under 1% in all cases. Regarding the ARL under out-of-control conditions, the DWS-X̄ chart demonstrated notably faster detection, with ARL values ranging between 4.10 and 5.06, compared to the classical chart, whose ARL values steadily increased with larger m, reaching 31.48 when m = 100. These results reflect the superior detection capability, lower false alarm rate, and quicker response of the proposed hybrid DWS-X̄ chart, confirming its robustness and reliability in process monitoring applications.
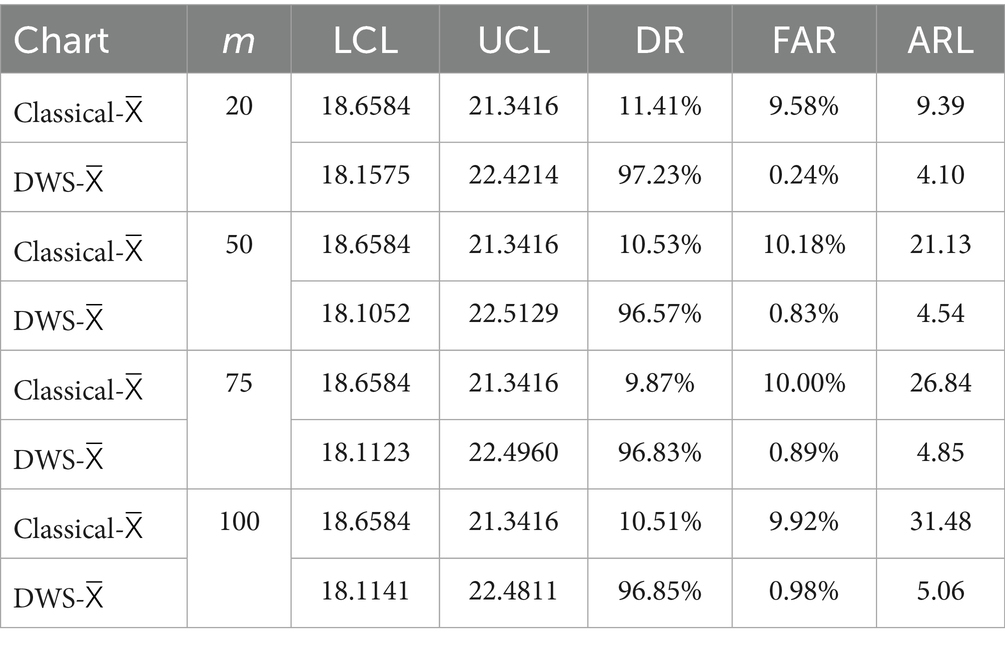
Table 1. Performance comparison between the classical X̄ chart and the proposed hybrid DWS-X̄ chart across n = 5, σ = 1, and Outliers = 5%.
Table 2 explains the results with n = 10; the hybrid DWS-X̄ chart consistently outperforms the classical chart. It achieves a much higher DR (~97.5% vs. ~11%) and significantly reduces the FAR (around 0.4–1.25% compared to ~11%). Additionally, the ARL for the hybrid chart is much shorter (around 2.5–2.9), indicating faster detection, while the classical chart shows ARL values between 9.6 and 21.3. The control limits of the hybrid chart are slightly wider, which likely contributes to its improved sensitivity and reliability. Overall, the proposed DWS-X̄ chart offers a more effective and timely detection of process shifts while minimizing false alarms compared to the classical approach.

Table 2. Performance comparison between the classical X̄ chart and the proposed hybrid DWS-X̄ chart across n = 10, σ = 1, and Outliers = 5%.
Table 3 presents a performance comparison between the classical X̄ chart and the hybrid DWS-X̄ chart with sample size n = 5, standard deviation σ = 2, and 10% outliers. The hybrid DWS-X̄ chart shows a clear advantage, achieving DR above 97.5%, while the classical chart remains around 17%. FAR for the hybrid method is substantially lower (under 1.25%) compared to the classical chart’s 16–17.5%. Additionally, the ARL for the hybrid chart is consistently low (approximately 2.5–2.8), reflecting rapid detection of process shifts. In contrast, the classical chart’s ARL ranges from 8.0 to 13.5, indicating a slower response. The wider control limits of the hybrid chart likely contribute to its improved ability to distinguish true changes from noise. Overall, the hybrid DWS-X̄ chart provides more accurate and timely monitoring under increased variability and contamination, outperforming the classical approach in all key metrics.
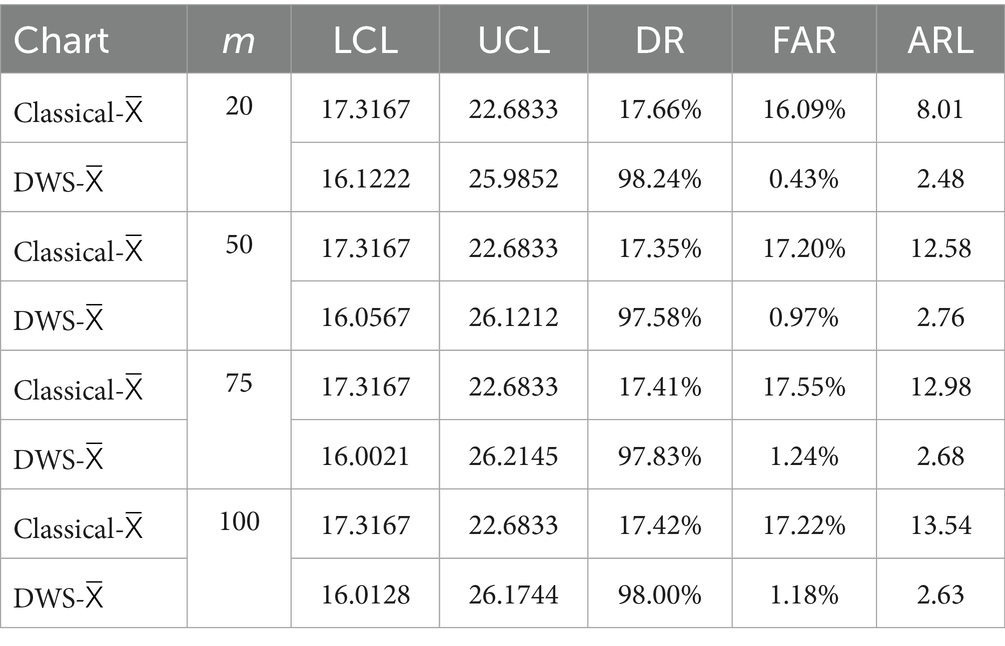
Table 3. Performance comparison between the classical X̄ chart and the proposed hybrid DWS-X̄ chart across n = 5, σ = 2, and Outliers = 10%.
Table 4 compares the classical X̄ chart with the proposed hybrid DWS-X̄ chart for a sample size of 10, a standard deviation of 2, and 10% outliers. The hybrid chart outperforms the classical one, achieving detection rates close to 99%, while the classical chart detects about 24% of shifts. Although the hybrid chart’s FAR is around 5–6%, it remains significantly lower than the classical chart’s high false alarm rate of nearly 24%. The difference is also evident in the ARL, where the hybrid chart responds faster with ARL values between 1.6 and 1.7, compared to 5.6 to 6.6 for the classical chart. This improved performance is likely due to the wider control limits in the hybrid chart, which enhance its ability to distinguish real process changes from noise, especially under high variability and contamination. Overall, the hybrid DWS-X̄ chart strikes a better balance between quick detection and fewer false alarms, outperforming the classical chart under challenging conditions.
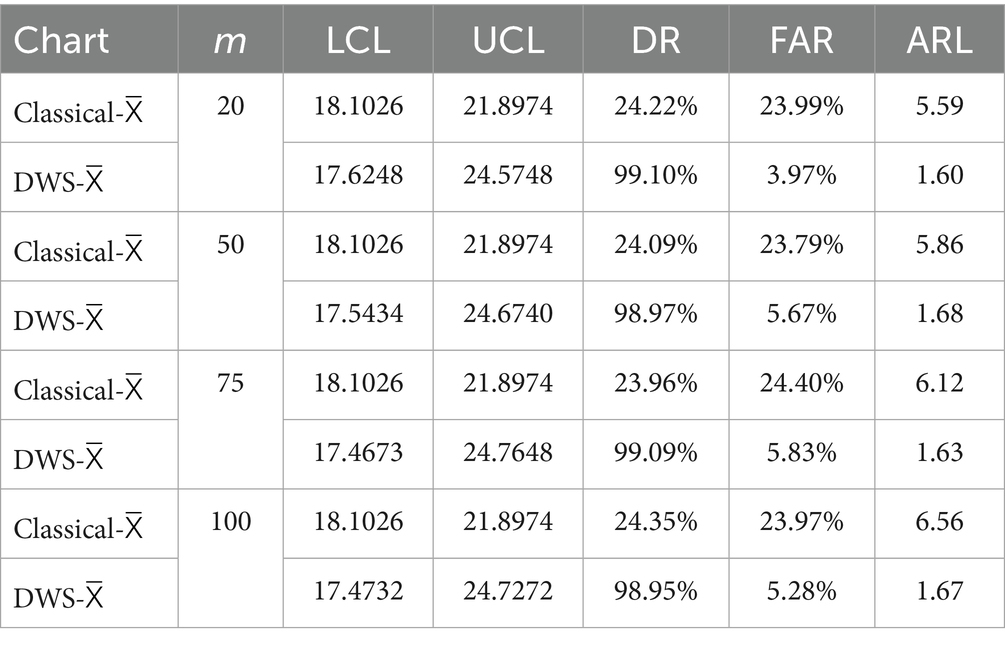
Table 4. Performance comparison between the classical X̄ chart and the proposed hybrid DWS-X̄ chart across n = 10, σ = 2, and Outliers = 10%.
As a summary of Tables 1–4, results obtained from the four simulations confirm the advantages of the developed hybrid DWS-X̄ chart over the conventional X̄ chart in different situations regarding the process. Regarding the detection rate, the DWS-X̄ chart showed very high values, between 96 and 99% in all scenarios. The traditional X̄ chart, on the other hand, had detection probabilities of about 10–24% depending on sample size, process variability, and percentage of outliers. This means that the hybrid chart is much more reliable in detecting a true shift in the process.
Looking at the FAR, the DWS-X̄ chart also showed low values in all the simulated scenarios. FAR did not exceed 1% for low process variation and increased to about 3–6% in the case of high process variation (σ = 2), remaining much lower than the classical chart. The traditional X̄ chart, on the other hand, tended to have false alarm percentages that exceeded 10%, and, in more challenging situations, even reached 24%. Considering average run length, the new hybrid DWS-X̄ chart was the fastest to indicate an out-of-control situation compared to the other charts. Its ARL ranged between 1.6 and 5.1, depending on the case, while the ARL of the classical one kept decreasing as the sample size and variability increased, and in some cases, it was more than 31. This highlights the benefit of the hybrid chart, which is that identifying a change in the process can be made faster, and being able to do this is essential in quality control. Performance was also dependent on sample size and variability of the process. The higher values of detection and ARL obtained by the DWS-X̄ chart when the sample size was doubled from 5 to 10 confirm these findings.
Although the hybrid chart FAR was marginally higher due to higher process variability and outlier percentage, the hybrid chart FAR was still consistently lower than the classical chart FAR in all metrics.
3.2 Real data application
This research uses a dataset consisting of anonymized neonatal heart rate measurements collected at Al-Khansa Maternity Hospital, East Mosul. The dataset included readings from 100 neonates, grouped into 20 subgroups (5 observations each). All data were fully de-identified before analysis, and no personal or identifiable information was available to the researchers. The study was conducted in accordance with institutional ethical guidelines. These indicators are also important measures of neonatal cardiac performance and cardiovascular stability. It sampled data at multiple sampling intervals so that statistical process control techniques could be used to detect heart rate beyond the expected range. This type of continuous monitoring is meant to help in making rapid clinical decisions, which may help improve outcomes in neonatal care. In the analysis, heart rate data were utilized to construct both traditional and proposed hybrid control charts. The dataset included readings from 100 neonates, which were grouped into 20 subgroups, with each subgroup comprising 5 observations. These subgroups provided the structure for chart construction and performance evaluation, with the resulting control charts illustrated in Figure 4.
Figure 9 compares two control charts for monitoring the average heart rate of newborns. The top chart illustrates the classical X̄ chart, whereas the bottom chart showcases the proposed hybrid chart that integrates wavelet-based techniques. In the classical chart, most sample means fall within the control limits (UCL = 157.25 bpm; LCL = 130.67 bpm). However, two points fall outside these limits: sample 10 exceeds the upper limit, and sample 16 falls below the lower limit. These points suggest potential outliers or unusual conditions that may require further investigation.
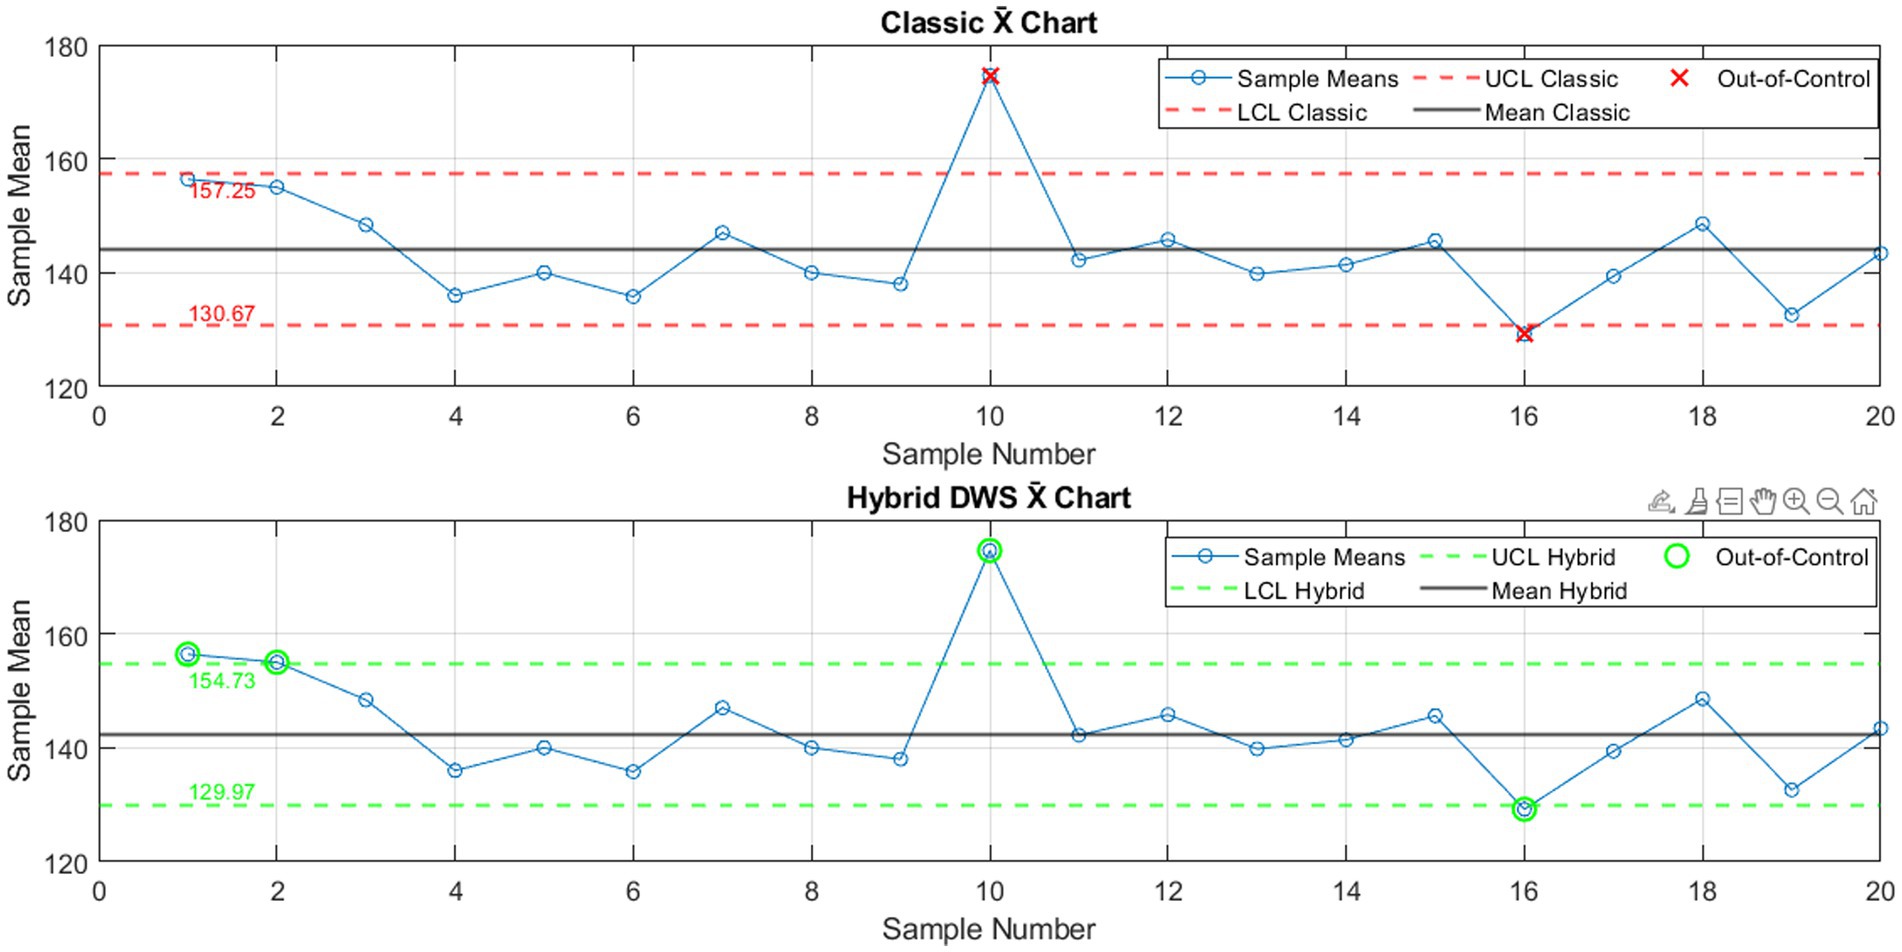
Figure 9. Classical and hybrid DWS charts for real data.
The hybrid DWS X̄ chart reveals a slightly different pattern. Here, four samples fall outside the control limits, samples 1, 2, and 10 surpass the upper limit (UCL = 154.73 bpm), and sample 16 remains below the lower limit (LCL = 129.97 bpm). This indicates that the hybrid chart is more sensitive, detecting an additional out-of-control point that the classical chart missed.
Overall, these results suggest that the hybrid wavelet-based control chart offers a more responsive and precise way to detect early changes in newborns’ heart rates. This increased sensitivity can help healthcare providers identify potential issues sooner, enabling quicker intervention and ultimately improving patient care.
Table 5 compares the standard X̄ chart with the new Hybrid DWS X̄ chart across several common performance measures. The data show that the two techniques differ clearly in sensitivity and overall control action. The standard chart picked up 2 out-of-control points, the first warning arising at sample 10. The hybrid version, however, marked 4 points beyond the limit, catching its earliest signal at sample 1. These figures imply that the hybrid scheme reacts faster when a shift or unusual trend appears. The two charts agreed on 2 points, yet the hybrid flagged 2 extra alarms that the classic method missed. This overlap, plus the additional detections, underlines the superior warning capability built into the new design.
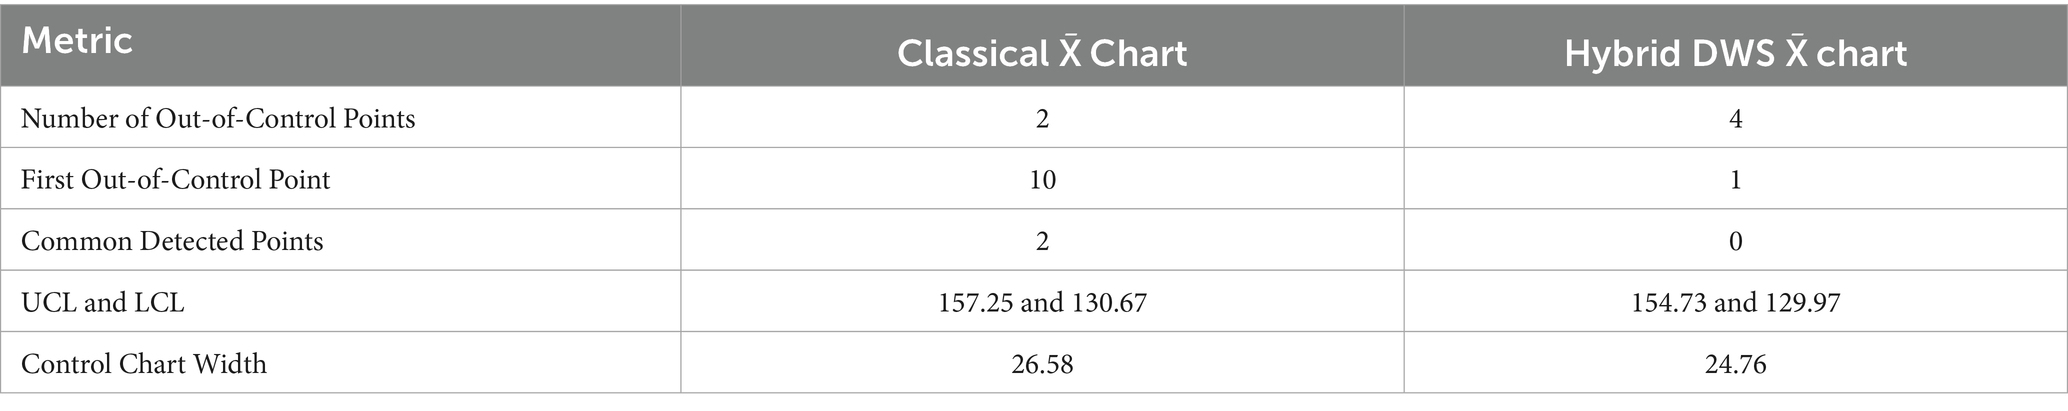
Table 5. Comparison of performance metrics between the classical and hybrid DWS X̄ charts for monitoring newborn heart rate.
For control limits, the standard X̄ chart sets an upper limit of 157.25 bpm and a lower limit of 130.67 bpm, giving a full width of 26.58 bpm. The Hybrid DWS version, by contrast, adopted marginally tighter bounds- UCL 154.73 bpm, LCL 129.97 bpm- resulting in a narrower span of 24.76 bpm and, therefore, closer oversight of the process.
The findings show the Hybrid DWS X̄ Chart spots small shifts in newborn heart rates faster than older methods, making it a handy tool for catching problems early and helping doctors act.
3.3 Comparison with other advanced control charts
The present study was designed to evaluate the performance of the proposed DWS–X̄ chart specifically against the traditional Shewhart X̄ chart, as the latter represents the most widely used baseline in statistical process control. More advanced methods, such as CUSUM, EWMA, and other hybrid control charts, are well established in the literature and are known to enhance sensitivity to small or gradual shifts. However, direct benchmarking with these approaches was beyond the scope of the current study and is left as an avenue for future research. Future work will extend the comparative evaluation of the DWS–X̄ chart by incorporating advanced methods under identical simulation settings, thereby providing a more comprehensive validation of its effectiveness.
3.4 Limitations
3.4.1 Limitations of the proposed approach
While the proposed DWS–X̄ chart demonstrates superior detection performance compared to the traditional X̄ chart, some inherent limitations must be acknowledged. First, the effectiveness of the method depends on the choice of wavelet family and decomposition level, which may influence sensitivity to different types of process shifts. Second, the classification accuracy of the SVM is strongly dependent on parameter tuning (e.g., C and γ for the RBF kernel), and inappropriate settings could reduce robustness. Finally, the study compares the proposed chart only with the classical X̄ chart. Although this establishes a baseline, a broader comparison with advanced control charting methods (e.g., CUSUM, EWMA, or robust charts) would provide a more comprehensive validation.
Moreover, the current simulation study was restricted to scenarios with outlier proportions of 5–15% and process variability levels of σ = 1 and σ = 2. The performance of the proposed DWS–X̄ chart under more challenging conditions, such as very low contamination levels (outliers < 2%) or lower process variability (σ < 0.5), was not explicitly investigated. Although it is expected that the hybrid design would still maintain a higher detection capability than the classical chart due to the wavelet–SVM integration, this remains to be validated. Future research will extend the simulation framework to encompass these extreme conditions, thereby confirming the robustness of the proposed approach.
3.4.2 Limitations in real data application
The real data validation conducted in this study was based on a relatively small dataset of 100 neonatal observations. While the proposed DWS–X̄ chart demonstrated improved detection capability over the traditional X̄ chart, the limited sample size restricts the generalizability of the results. Future research should incorporate larger and more diverse datasets, either from broader clinical populations or from industrial monitoring systems, to provide a stronger empirical validation of the proposed method.
Some simulation figures (e.g., Figures 3–7) illustrate similar performance patterns across different subgroup sizes. To improve clarity and reduce redundancy, these figures could be consolidated or partially replaced with summary tables in future work, while preserving the key insights on DR, FAR, and ARL.
4 Conclusion
The study yielded two sets of conclusions: one based on simulation experiments, confirming the superior performance of the proposed Hybrid DWS-X̄ chart under various outlier scenarios, and another derived from real neonatal heart rate data, highlighting the chart’s enhanced sensitivity and faster response in clinical monitoring applications.
4.1 Conclusions from simulation experiments
1. The proposed hybrid DWS-X̄ chart consistently demonstrated superior performance over the classical X̄ chart in all simulated scenarios.
2. It achieved notably higher detection rates, consistently exceeding 96% even under challenging conditions, while the classical chart’s DR remained comparatively low, often below 25%.
3. The hybrid chart maintained a substantially lower FAR compared to the classical chart.
4. In most cases, the DWS-X̄ chart recorded FAR values below 1% when variability and outlier contamination were moderate and remained within acceptable limits (5–6%) even in high-variance, high-outlier environments. In contrast, the classical chart frequently showed FAR rates above 10%, and sometimes exceeding 23%.
5. Average Run Length analysis confirmed the faster detection capability of the hybrid chart.
6. The DWS-X̄ chart achieved consistently lower ARL values, typically ranging from 1.6 to 5.1, while the classical chart’s ARL increased progressively with subgroup size and number of samples, sometimes reaching values over 31, indicating slower responsiveness.
7. Increasing the sample size (n) improved the performance of both charts, but the hybrid chart benefited more significantly.
8. Larger sample sizes enhanced the DR and slightly widened control limits for the hybrid chart, contributing to better detection of out-of-control conditions without notably raising the FAR.
9. Even with higher process variability (σ = 2) and a larger percentage of outliers (10%), the FAR of the hybrid chart was still higher, although it remained better than the other chart.
10. Even so, DWS-X̄ control charts showed significantly lower false alarm rate than classical control charts while achieving high detection efficiency.
11. The hybrid DWS-X̄ chart superiority in all process conditions demonstrates its robustness and flexibility.
12. It is useful in industrial process monitoring due to its high efficiency in processes with non-normal data, where it achieves good results in detecting online changes to the process while keeping false alarms low.
4.2 Conclusions from the real data analysis
1. There were two out-of-control points in the classical X̄ chart: sample 10 and sample 16, out of 20 subgroups. The hybrid DWS-X̄ plot presented samples 1, 2, 10, and 16 as being out-of-control, thus being more sensitive at identifying out-of-control conditions.
2. Though the first out-of-control signal was observed in sample 10 of the classical X̄ chart, the hybrid chart signaled in sample 01, indicating an early detection of a possible process shift.
3. Both charts agreed on two points (samples 10 and 16), but the hybrid chart captured two additional signals missing from the classical chart.
4. The control limits in the hybrid DWS-X̄ chart were narrower (UCL = 154.73 bpm, LCL = 129.97 bpm) compared to the classical-X̄ chart (UCL = 157.25 bpm, LCL = 130.67 bpm), resulting in tighter process monitoring.
5. The control chart width was reduced in the hybrid chart (24.76 bpm) relative to the classical chart (26.58 bpm), contributing to improved detection accuracy without increasing false alarms.
6. These outcomes demonstrate that integrating wavelet decomposition with SVM classification enhances early detection of abnormal heart rate patterns in neonatal monitoring.
7. The proposed hybrid control chart offers a practical and reliable decision-support tool for clinical settings, enabling faster identification of at-risk cases and supporting timely medical interventions.
Data availability statement
The datasets generated and analyzed during the current study are included in the article and its supplementary material. Further inquiries can be directed to the corresponding author.
Ethics statement
The neonatal heart rate data used in this study were fully anonymized before analysis. No identifiable patient information was collected, stored, or accessed by the authors. Data collection and provision were conducted under the supervision and permission of Al-Khansa Maternity Hospital, East Mosul. Because the dataset was anonymized and used with institutional permission, no formal ethics approval was required. This research involves no direct human subjects and poses no risk to patient confidentiality.
Author contributions
TA: Writing – original draft, Methodology, Supervision. HT: Conceptualization, Writing – original draft, Formal analysis, Data curation. BS: Software, Writing – original draft, Resources. HH: Writing – original draft, Writing – review & editing, Validation, Project administration.
Funding
The author(s) declare that no financial support was received for the research and/or publication of this article.
Conflict of interest
The authors declare that the research was conducted in the absence of any commercial or financial relationships that could be construed as a potential conflict of interest.
Generative AI statement
The authors declare that no Gen AI was used in the creation of this manuscript.
Any alternative text (alt text) provided alongside figures in this article has been generated by Frontiers with the support of artificial intelligence and reasonable efforts have been made to ensure accuracy, including review by the authors wherever possible. If you identify any issues, please contact us.
Publisher’s note
All claims expressed in this article are solely those of the authors and do not necessarily represent those of their affiliated organizations, or those of the publisher, the editors and the reviewers. Any product that may be evaluated in this article, or claim that may be made by its manufacturer, is not guaranteed or endorsed by the publisher.
References
2. Abdullah, DF, Qadir, JR, Ramadhan, DL, and Ali, TH. CUSUM control chart for Symlets wavelet to monitor production process quality. Iraqi J Stat Sci. (2024) 21:54–63. doi: 10.33899/iqjoss.2024.185240
3. Ameen, SB, and Ali, TH. Proposed quality control charts using Haar wavelet coefficients for enhanced production monitoring. Iraqi J Stat Sci. (2025) 22:127–40. doi: 10.33899/iqjoss.2025.187765
4. Tareq Hasan, M, Ali, TH, and Sedeek Kareem, NH. Multivariate CUSUM Daubechies discrete wavelet transformation coefficients charts for quality control. Passer J Basic Appl Sci. (2025) 7:533–46. doi: 10.24271/psr.2025.491277.1834
5. Zhang, Y, Wang, H, and Li, J. A hybrid control chart integrating outlier filtering and robust regression for healthcare monitoring. Comp Ind Eng. (2022) 167:108037. doi: 10.1016/j.cie.2022.108037
6. Liu, X, Chen, J, and Zhang, Y. Machine learning–based adaptive control charts for complex process monitoring. Qual Reliab Eng Int. (2023) 39:567–84. doi: 10.1002/qre.3250
7. Taher, MM, Al-Hasso, TA, and Ali, TH. A novel Dmey wavelet charts for controlling and monitoring the average and variance of quality characteristics. Stat Optim Inform Comput. (2025) 10:2621. doi: 10.19139/soic-2310-5070-2621
8. Ali, TH, Sedeeq, BS, Saleh, DM, and Rahim, AG. Robust multivariate quality control charts for enhanced variability monitoring. Qual Reliab Eng Int. (2024) 40:1369–81. doi: 10.1002/qre.3472
9. Hawkins, DM, and Deng, Q. Regression process control charts for mean and variance shifts. J Qual Technol. (2010) 42:373–87.
11. Elias, II, and Ali, TH. VARMA time series model analysis using discrete wavelet transformation coefficients for Coiflets wavelet. Passer J Basic Appl Sci. (2025) 7:657–77. doi: 10.24271/PSR.2025.512121.2011
12. Cortes, C, and Vapnik, V. Support-vector networks. Mach Learn. (1995) 20:273–97. doi: 10.1007/BF00994018
13. Pearson, RK, et al. Hampel filter-based outlier detection for control charts. Qual Reliab Eng Int. (2016) 32:755–65. doi: 10.1002/qre.1802
Keywords: statistical process control, X̄ chart, discrete wavelet transform, support vector machine, outlier detection
Citation: Ali TH, Taha HH, Sedeeq BS and Hayawi HAA (2025) An innovative hybrid control chart combining wavelet decomposition and support vector machine for effective outlier detection. Front. Appl. Math. Stat. 11:1682448. doi: 10.3389/fams.2025.1682448
Edited by:
Massimiliano Bonamente, University of Alabama in Huntsville, United StatesReviewed by:
Anamaria Popescu, Universitatea Din Petrosani, RomaniaSamuel Su, Tamkang University, Taiwan
Copyright © 2025 Ali, Taha, Sedeeq and Hayawi. This is an open-access article distributed under the terms of the Creative Commons Attribution License (CC BY). The use, distribution or reproduction in other forums is permitted, provided the original author(s) and the copyright owner(s) are credited and that the original publication in this journal is cited, in accordance with accepted academic practice. No use, distribution or reproduction is permitted which does not comply with these terms.
*Correspondence: Taha Hussein Ali, dGFoYS5hbGlAc3UuZWR1LmtyZA==