 Maeti Antoinette George
- National University of Lesotho, Maseru, Lesotho
Global climate change affects human populations, as well as aquatic and terrestrial ecosystems, highlighting the interconnected nature of the intervention strategies that seek to improve human health. Statistical applications and mathematical modeling are pivotal and crucial for quantifying the future outcomes and understanding the effects of climate change on diseases. The study was intended to identify the extent to which predictive modeling was utilized in Lesotho in relation to the impact of drought on the spread of disease in human beings. This was a systematic review of literature focused on projections and predictions related to impacts on ecosystems and biodiversity in vulnerable communities, and ultimately on human health. Furthermore, the extent of research regarding the utilization of models in an attempt to curb the spread of climate-related diseases and their effectiveness, so that countries can respond promptly, was reviewed. It has been concluded that predictive modeling has not been applied in Lesotho, and this risks crop failure, disease spread, anxiety and mental health problems for the affected communities. If used, statistical and predictive disease modeling and predictions along the interconnected threats brought by drought would enable an understanding of how and when diseases may spread, and how their spread can be controlled. The review recommends that southern African countries should develop predictive models using available hydrological parameters, meteorological and disease data. Decision-makers should also use climate and disease forecasts, provided they are supported by available climate and health data.
1 Introduction
Drought is categorized as meteorological, agricultural, hydrological and socio-economic drought [1]. Meteorological drought occurs as a result of insufficient precipitation for an extended period, such that this ends up compromising crop production and associated activities like animal watering, hence the existence of agricultural drought [2, 3]. Hydrological drought marks a deficiency of water in hydrological systems, and this affects food security and wellbeing of communities, hence socio-economic drought [4, 5]. Inadequate supply of water has been associated with poor hygiene, food insecurity (also due to agricultural drought), and a decline in socio-economic aspects of communities, which might cause anxiety and mental health problems.
Countries are faced with a shift in climatic patterns and zones, which sometimes lead to extreme weather events like drought, severe cold or snowstorms, tropical cyclones, wildfires, and floods. Each one of these conditions has drastic health impacts for communities, subsequently burdening the health sector and other planning departments. Floods sometimes provide a suitable environment or breeding ground for breeding of disease vectors, risking emergence and transmission of climate-driven diseases.
Some pathogenic diseases are driven by climatic variations, and these depend on the pathogen in question, health status and age of the person [6] and individual's resistance to the pathogen [7]. Furthermore, a combination of various climate factors with that of pathogens explicitly demonstrates that these interactions have a potential to aggravate disease spread. However, past studies have focused on limited sets of pathogens; hazards (floods and drought), types of disease transmission, that is, whether transmissions were vector-borne, water-borne [8, 9], or food-borne [8].
Disease outbreaks are disrupting countries' economies and causing societal upheaval. Furthermore, countries are faced with other challenges like disease surveillance, preparedness, adaptation and modeling of climate factors together with measures to be taken to contain disease spread and reduce mortalities. Modeling information includes location, extent or magnitude, and when disasters will occur. The complicated nature of spread of various diseases needs to be modeled to predict their spread in space and time. This will best inform the public health sector, other stakeholders and policymakers, leading to implementation of the most effective, suitable, cost-effective interventions. In a study by Huang et al. [10], a two-dimensional model was developed for spatial epidemics and temporal distribution of confirmed cases, but focused on COVID-19 in China. In this model, the spread of infectious diseases is characterized in various regions, where control measures, seasonal changes that may affect infection rates, and vaccination are incorporated as parameterisation schemes. This contributes by giving a direction and understanding of the dynamics of disease spread.
Climatic variations impact the environment, which may directly and indirectly affect human health (Figure 1). For instance, extreme temperatures directly affect human beings' respiratory systems and through cardiovascular complications and stress [11]. Extreme heat also dries up water bodies, and, apart from causing water scarcity, water pollution is threatened. During this period, communities lose their crops and sometimes animals, contributing toward food insecurity, famine and malnutrition. During malnutrition, people become vulnerable to other diseases due to the inability of their bodies to naturally fight germs and other disease-causing bacteria and/or viruses. Disease vectors which are tolerant to drought may also cause water-borne diseases [12–14], which would be already common from water pollution that is driven by excessive evaporation.
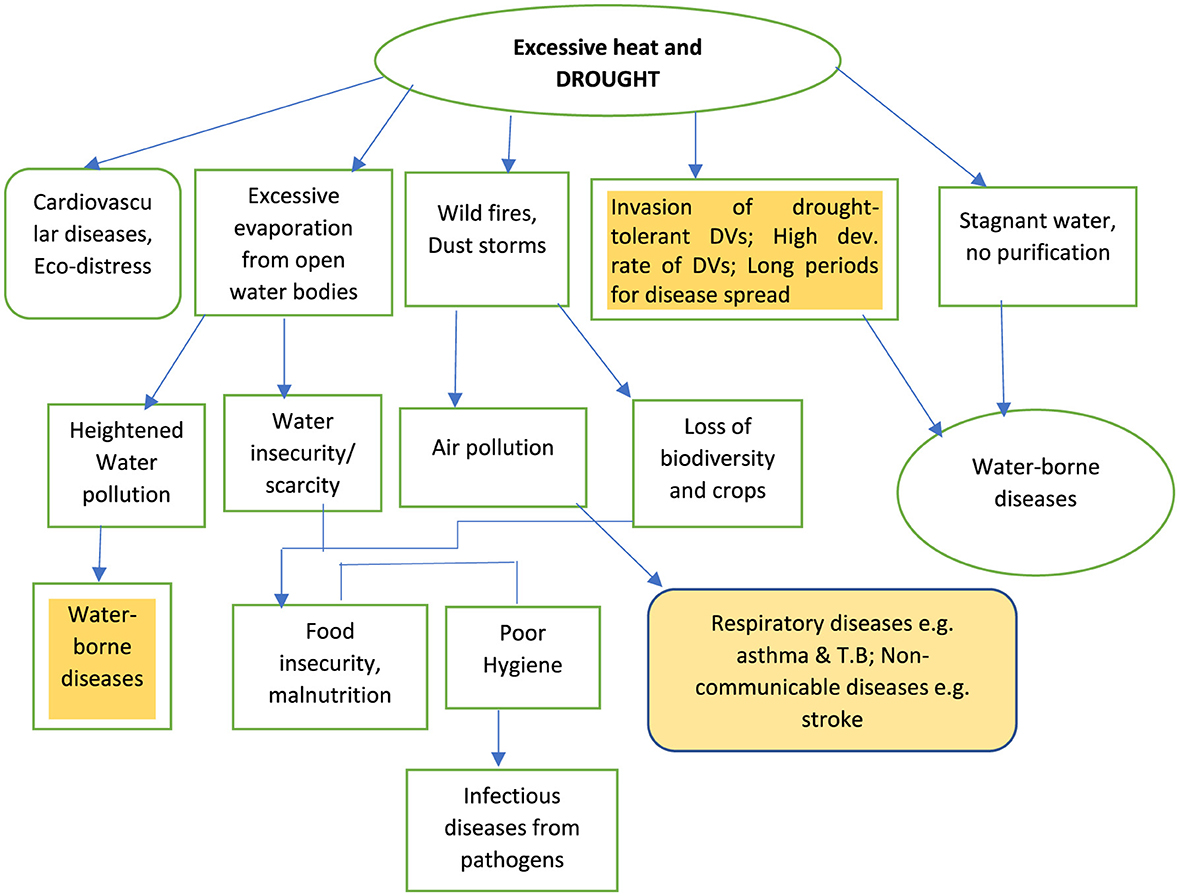
Figure 1. Conceptual model on the relationship between drought, human health and diseases.
Wildfires and dust storms are events experienced due to extreme heat incidences, and subsequently exacerbate air pollution, ultimately heightening respiratory diseases and heart diseases [6, 15, 16]. PM2.5 is the common contributor of air pollution-related health problems [15, 17–19]. Stroke has recently been associated with air pollutants [20–24]. Other direct impacts of excessive heat on humans include anxiety or eco-distress [25, 26] and eventually mental health, and this emanates from helplessness and hopelessness associated with “fear of uncertainty as to what will come next.” This commonly follows loss of lives and property from other events like floods, which occur concurrently with drought and extreme heat.
Previous applications include modeling of natural hazards from remote sensing and geographic information systems [27] due to the ability to integrate spatial flood data from various sources to predict spatial variations. These models were not utilized for the prediction of disease spread, in the midst of flood events, necessitating the employment of more robust approaches so as to inform the health sector and protect human health. Back in the years 2010 to 2018, some studies by Parham and Michael [28] used models and geospatial systems [29] that revealed significant differences in the spread of malaria and other vector-borne diseases that are associated with a warming trend. Research has predicted a future increase in malaria disease transmission of about 25% [30] for sub-Saharan Africa, parts of Latin America and Southeast Asia regions that were cool and recently experiencing heightened temperatures. Adding to this, Okafor et al. [31] projected malaria incidences for populations below 5 and above 5 years of age, using climate data (temperature, precipitation, and humidity), and malaria cases from the health database in The Gambia. This was achieved with utilization of a machine learning model for 2021–2030, 2031–2014, and 2041–2050 periods. This indicates that data from both departments are significant, and various climatic scenarios like RCP4.5 and RCP8.5 can be used for epidemiological trends and the establishment of high-risk communities. Babaie et al. [29] and Filho et al. [32] found that malaria can be predicted for regions that are already experiencing the disease, those with few or no malaria cases. In this manner, countries' level of preparedness will be enhanced.
A report from the Lesotho Ministry of Health [33], indicates that Lesotho is not prone to tropical diseases like schistosomiasis and malaria. However, other reports like the Integrated Master Plan for the control of Neglected Tropical Diseases (NTDs), include these diseases. Adding to this, Smith et al. [34] have noted that various estimates have indicated that Lesotho is one of the countries with increasing malaria risk owing to the stretching of Orange river hydrology toward the west of the country [35], and increased rainfall, aggravation of heat stress or extreme weather events, and a range of disease vectors [12, 13].
The report further shows that, apart from extreme weather patterns, air pollution could impact respiratory and communicable diseases like Tuberculosis (TB), and the malaria zone is anticipated to stretch toward the country by mid-century [36].
2 Methodology
A review of literature from the year 2015 to July 2025 was done following the Preferred Reporting Items for Systematic Reviews and Meta-Analyses (PRISMA) guidelines [37]. Reputable publishers used were Frontiers, ScienceDirect, Springer, MDPI, Taylor and Francis, and Wiley. Reports from the World Health Organization (WHO) and governments were used. In addition, full-text, peer-reviewed publications written in English were included. Literature from these was used to answer the research questions pertaining to the utilization of predictive modeling on the burden of disease owing to drought as a climatic factor. Titles, abstracts and keywords guided literature selection for the study, and this was followed by relevance, quality articles, and those published within the 10 years (2015–2025). Exclusion criterion was also based on literature which did not report on Botswana, Lesotho, Namibia, eSwatini and South Africa (Figure 2) as the southern African countries, and review articles and reports which lacked originality (Figure 3).
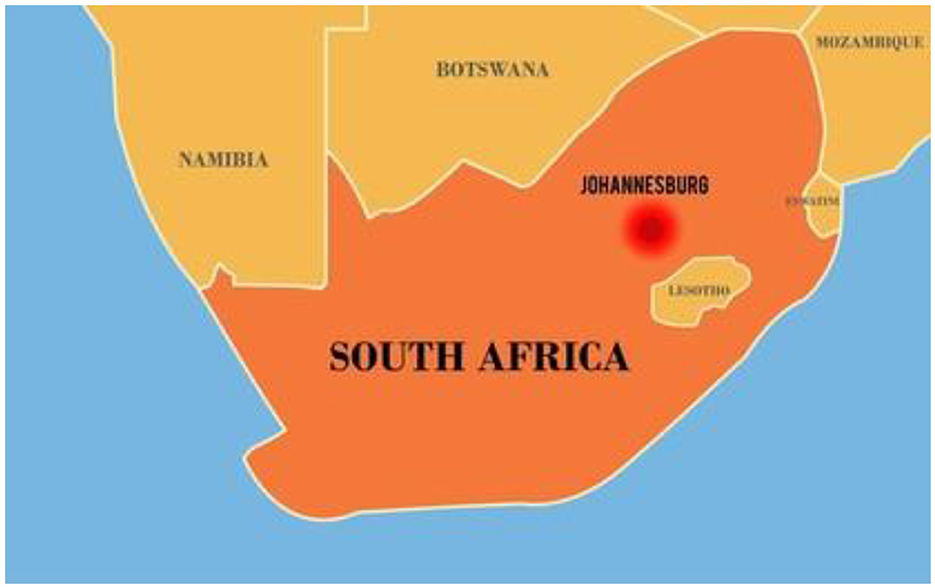
Figure 2. Map showing southern African countries that were included in the review.
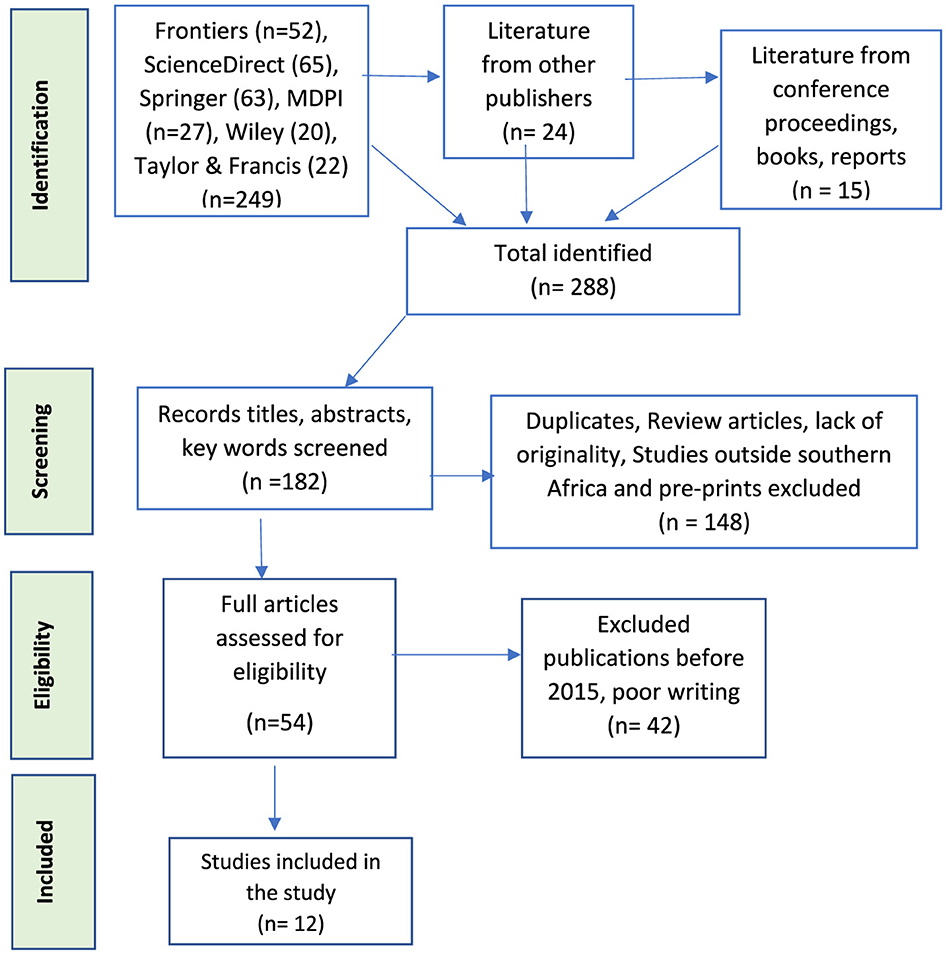
Figure 3. PRISMA diagram for literature search. Source: Author.
Inclusion criteria: the review included studies that were inclined toward burden of disease due to drought, community members affected, and utilization of models to predict drought (hydrological and meteorological), and both infectious and heat-related diseases like strokes. Literature which reported on the impact of heat and drought on human health was searched, and inclusion criteria related to those articles which reported on direct impact that was not specifically diseases, like dry air, water pollution from drought and wildfires (including air pollution). This was followed by those which reported direct impact from each of the factors above on health.
Secondly, a review of articles which showed drought models that can be used for modeling diseases was done. This was followed by a literature selection on disease modeling, with respect to food insecurity-based (malnutrition) and climate-sensitive infectious diseases.
Exclusion criteria: literature that did not report on heat and drought-related diseases, models that are used for the prediction of drought and climate-sensitive diseases were excluded from the review. Adding on these, literature that was published before 2015, and outside southern Africa, was not utilized for review (Figure 3). Lastly, a comparison of drought and disease models was done, and this guided the selection of those which could suit the southern African countries' conditions, and recommendations were made in that aspect.
3 Results
3.1 Screening and study material selection
A total of 288 publications were identified, and the elimination process was based on abstracts, titles and irrelevant keywords, and 182 articles were screened for duplicates, review articles, pre-prints, lack of originality, and those of non-southern Africa origin, yielding 148 texts. Eligibility criteria gave 54 texts, and work that was published before the year 2015 and the poorly-written (42) were excluded and this yielded 12 papers for this review. Poorly-written papers were unclear and hard to follow, and ambiguous in terms of climate-related health problems.
3.2 Relationships between drought and disease burden
Relationships between drought events, human health and disease burden are shown in Figure 1. It is evident that, if there is no forecasting or predictive modeling of these events, then the health sector will lack preparedness and fail to curb disease spread. Indirect impact of climatic variations, like destruction of infrastructure, is pertinent for the socioeconomic and wellbeing of affected communities. When precipitation rate drops, so do agricultural production, hygiene, water quality and invasion of disease vectors that tolerate drought. The latter worsens crop and livestock production, gripping the nutrition sector. Adding to this, farmers battle with agricultural production, and may increase food prices, further putting vulnerable communities under pressure with regard to food provision to their families. This mounts onto stress, anxiety, and mental health problems from other drought and flood-related challenges.
4 Impact of extreme heat and drought on health
Rising temperatures have increased the risk of extreme heat events like heatwaves, drought and subsequently water shortages. Drought is documented as a prolonged and wide-ranging scarcity of natural waters, and its consequences are not confined within certain geographical locations [38]. Other health problems that are associated with drought are food insecurity, psycho-social stress [11] malnutrition and infectious diseases [39]. Indirect impacts of extreme heat include disease spread amongst animals, where increased disease capacity affects meat consumers. These include a shortage of fodder [40] and spread of tick-borne diseases in livestock [41].
Extreme heat directly destroys crops and kills animals through excessive transpiration and heat-related stress on animals. Problems range from lack of water, invasion of disease vectors that find hot environments suitable for their development and survival, and poor tolerance to the polluted environment where animals and crops are expected to survive.
Crop failure is associated with low heat tolerance in some crops [42, 43], and associated weather conditions like dry air. On the other hand, farmers and households may fail to secure adequate supplies for animals. Animal feed is also affected, together with their health, and this adds to food insecurity problem for communities. Apart from water shortages and diseases, growing periods have been drastically adjusted, and crops do not have adequate growing periods despite other environmental challenges. These problems together lead to malnutrition and food price hike due to limited food.
5 Excessive heat and human health
The following sections will elaborate on how heat and dry air from excessive temperature impact on human health.
Excessive heat evaporates water from both surface water bodies and the atmosphere. Human beings and other forms of life like animals subsequently breathe in dry air, and this affects their respiratory systems [44, 45]. To some extent, human beings experience lung diseases caused by excessively dry air, which is sometimes polluted from particulate matter (PM) in the air, and even cardiovascular failures. Dry air irritates the respiratory tract and may exacerbate asthmatic problems [18]. Exposure to PM2.5 was reportedly associated with short and/or long-term health risks and sometimes fatalities from stroke [18, 19].
In Botswana, a study by Byakatonda et al. [46] established that El Niño Southern Oscillation (ENSO) was the most precise instrument for predicting drought in the country. Standardized Precipitation Evaporation Index (SPEI) was utilized, and correlated with ENSO, reflecting a 0.8% dryness per decade. The country experiences severe drought, which alternates with destructive floods [47]. For instance, the year 2023–2024 was declared “an Extreme agricultural drought year,” and this was followed by the 2025 floods, which destroyed crops, including livestock fodder, hence food insecurity.
In Lesotho, a report by the World Food Programme [48] indicated that a combination of drought, erratic and/or prolonged rainfall, and early frost disrupts people's livelihoods, especially crop production, food security and nutrition.
In Namibia, the drought assessment report [49] indicated a 12% surge in the population that would face food insecurity owing to drought. The country had experienced drought for seven consecutive years, with the rural communities being the most vulnerable, marked by low agricultural productivity, livestock deaths and negative impact on primary livelihood activities like unemployment, school drop-outs and escalated food prices.
In eSwatini, it was forecasted that El Niño would threaten food insecurity for 20% of communities in the year 2023, a figure that escalated to 25% in the year 2024 [50]. Water insecurity affected livestock and rainfed irrigation, and its population relied on humanitarian aid. From all these reports, drought modeling was not done comprehensively, utilizing atmospheric, climate data, hydrologic data and remote sensing (RS). Furthermore, there was no correlation between drought and disease spread or infectious diseases.
Chen et al. [52] reported that rising temperatures are associated with myocardial infarction for individuals with predisposing risk factors using German data, whereas data from the UK and Spain did not link heat events with myocardial infarctions. On the contrary, Khraishah et al. [53] have associated low temperature spells with incidences of myocardial infarction. In addition, McCutcheon et al. [54] have asserted that a strong association between climate change and cardiovascular complications is more pronounced for the elderly, and individuals who have medical complications like type 2 diabetes and hypertension are more vulnerable. These inconsistencies are concerning and need further research that entails predictive modeling under various meteorological conditions and health status of study groups. With regard to southern Africa, there is no widespread research on how excessive heat may contribute to respiratory problems and cardiovascular failures, as guided by models. In the absence of predictive modeling regarding the effect of heat on non-communicable diseases, there might be a hindrance to the health sector's preparedness and planning toward curbing these health issues. This is more concerning since non-communicable diseases like stroke and heart failure are reported as the second leading causes of mortality for people above 13 years of age [33].
6 Surface water bodies pollution
Excessive heat evaporates surface water bodies, increasing the concentration of any existing pollutants [6]. Furthermore, water bodies with low water volume get stagnant and are unable to dilute pollutants, a process that occurs to enable self-purification. This is usually enhanced by dilution and influx of clean water from upstream or tributaries.
Communities that use polluted water are at risk of water-borne diseases like cholera, giardiasis and cryptosporidiosis [55, 56]. These diseases also result from inadequate water due to drought [57]. On the other hand, inadequate water supply could lead to poor personal hygiene, leading to diseases like skin infections, scabies, dysentery, conjunctivitis, and trachoma [58]. Few studies have modeled disease burden from water that is polluted following periods of drought. For instance, a report by The Ministry of Health [33] outlines incidences of poor water supply, compromised sanitation and hygiene for rural communities, without linking these conditions to climatic variations. With erratic rainfall and prolonged periods of extreme heat events, there is an insufficient supply of water for consumption and improved hygiene.
7 Wildfires and air pollution
Wildfires deteriorate air quality from gases like carbon dioxide (CO2), sulfur dioxide (SO2) and particulate matter (PM), with PM2.5 being the air pollutant of health concern due to its ability to penetrate human lungs. Polluted air exacerbates respiratory diseases and communicable diseases like TB [12, 13], and asthma patients are the most vulnerable. Prolonged air pollution degrades the environment and impact on crop and plant growth.
With predicted changes in temperatures, the rural and poor communities tend to be the most vulnerable, and, due to congestion in their families, will easily transmit other diseases like measles [59].
Socio-economic impacts from wildfires include communities' loss of property from wildfires [60, 61], and this may lead to mental health issues, and some community members resort to unplanned migration (even due to extensive air pollution), leaving behind other hard-earned property, whereas others would have lost property after being gutted during fires. Furthermore, some animals get trapped within wildfires, leading to stress for animal owners/farmers, food insecurity and malnutrition due to inadequate supply of protein meals for consumers.
Predators which feed on some disease vectors diminish, causing an increase in the numbers of some disease vectors and changing the DV ecology [62, 63]. Adding to this, there might be an infestation of disease vectors due to heat spells and drought, affecting agricultural activities like crop production and livestock rearing. This problem mostly affects countries that lack preparedness, and the health sector gets overwhelmed with patients. Bianco et al. [64] reported on the vulnerability of middle and low-income countries to climate-related diseases, without expanding on a variety of such climate-sensitive diseases, and predictions related to when such diseases might be experienced. There is a gap concerning the extent, duration and coverage of the fires, and this needs to be predicted so that all the sectors can get prepared, and this includes disaster management authorities, to whom the data and information should be accessible.
8 Drought models
Literature on drought models was examined, and a relationship between existing literature was established, along with disease models, and what prevails in southern African countries. Various drought models can be used for modeling diseases for countries whose predictions point to a drier and hotter climate. Drought studies need atmospheric, climatic, hydrologic and remote sensing data [65]. These incorporate input parameters like evapotranspiration, temperature, precipitation, relative humidity, wind, vegetation health, stream-flow, and soil moisture. All these are available as meteorological and hydrological databases (historical and recent).
Model selection should be guided by factors such as the availability of data (cases of climate or drought-related diseases, and epidemiological, in this case), desired level of accuracy and intended use of predictions.
8.1 Stochastic models
They utilize historical climate data together with hydrological data for future drought predictions. Autoregressive Integrated Moving Average (ARIMA) and Seasonal Autoregressive Integrated Moving Average (SARIMA) are the two common stochastic models, with ARIMA being the most effective due to its ability to predict events in time [66–68]. However, ARIMA has drawbacks when it comes to complex non-linear time series modeling [69–71].
8.2 Physical models
These are known to replicate drought behavior, using physical or mathematical equations. An example is the Variable Infiltration Capacity model, which mimics the water balance of a watershed or drought prediction [72, 73]. Another physical model is the Soil and Water Assessment Tool (SWAT), which is considered consistent toward modeling future hydrologic drought events [74].
8.3 Machine Learning models (ML)
These models use techniques which are capable of identifying complex patterns and relationships from data, and this includes the utilization of algorithms to learn patterns that emanate from historical hydrological and climate data, for drought prediction [65]. In summary, various models have uniqueness that translates into specific strengths and weaknesses, but machine learning is more effective and reliable owing to the complexity of drought [70, 75, 76].
9 Disease modeling
It has been observed that remote sensing data, meteorological observations, hydrological modeling and climate indices should be integrated for accurate drought prediction [65, 77]. This approach enables an understanding of how various aspects of drought may significantly and adversely affect other sectors like the health sector.
9.1 Diffusion rate
Huang et al. [10] developed a model which reiterated the significance of three major links in disease transmission, being the source of infection, the transmission route, and the population that is susceptible to the disease in question, thus formulating the diffusion rate D (x,y) equation below:
Where:
D0 (x,y) = the impact of pollution as an environmental factor on the epidemic process for infectious diseases. Here, respiratory health problems and transmission through air are taken into consideration through the respiratory tract as a mode of transmission. Drought with high PM2.5 concentration in the atmosphere could be a climatic condition.
D1 (x,y) = impact of natural factors, including local climate and geographical conditions. These take into consideration the period when people stay indoors during undesirable weather conditions, increasing transmission rate or spread of disease due to poor ventilation and congestion indoors.
D2 (x,y) = residential environment taking into consideration that high population and high density places are more prone to disease transmission rate;
D3 (x,y) = relates to the economic and health status of individuals, where even economic status of countries in terms of ability to supply vaccines and medicinal products; health education, and awareness may help curb disease spread.
D4 (x,y) = local population mobility and transportation increase the epidemic process of infectious diseases, since there might be congestion. The unplanned migration of some communities that incurred losses after wildfires could be one of the factors that lead to increased transportation or migration rates.
In summary, the availability of data (long-term or historical), the ability to apply a more suitable model for data processing and predictions, and parameterisation (seasonal change and impact on infection rate; control disease spread and medicinal care/vaccination) are the three basic requirements for the system-prediction process. Data should be collected from the health sector, whereas social data (population size and urbanization or migration rate) should be collected from relevant departments like statistics. The other set of data entails meteorological data, and should also include historical data to facilitate future projections. An epidemic process must have three basic links, including sources of infection, routes of transmission and susceptible population. Studies by Barman et al. [78] and Jeong et al. [79] predicted the spread of Aedes Albopictus mosquitoes and COVID-19, respectively. None of these studies covered the southern African countries, and this is a gap that needs to be addressed to safeguard human health against transmissible diseases.
9.2 Population attributable fraction (PAF)
The population attributable fraction calculates disease burden, which is preventable if there are alternative exposures as the means of reducing or mitigating potential risk factors [80, 81]. The fraction is in relation to heat-related health outcomes and was developed in Australia [82], as shown in Equation 2 below. The fraction needs relative risks through an estimation of effect size; Theoretical Minimum Risk Exposure Distribution (TMRED) detection; and exposure level of risk factors, as inputs for calculations [82]. TMRED assumes that the most frequent temperatures are the minimum risk exposure threshold.
where:
∑c = sum over all categories
c = Index for exposure level category
P = Proportional exposure at each exposure level/proportion of “hot” days above the TMREDs in the reference year
RR = relative risk specific to the temperature category.
In South Africa, PAF was utilized for predictions of cholera and mortality risks [83] and not for other southern African countries. This is an area that needs further research regarding drought-related diseases using PAF.
9.3 Burden of Disease (BoD)
BoD is attributable to high temperatures calculation, and this is based on data availability and a wide difference in risk patterns across geographical regions [82], and this is preceded by the calculation of the PAF. BoD incorporates Years of Life Lost (YLL) [51] and Years Lived with Disability (YLD) in relation to temperature to find Disability-Adjusted Life Years (DALYs). However, few studies have incorporated DALYs as one of the indicators due to dependency on YLD data [84, 85].
Heat- attributable BoD could then be obtained as shown in Equation 3:
A study by Burkart et al. [81] linked deaths to daily temperature estimates taken from the ERA5 dataset. Exposure-response curves were further utilized with gridded temperature for calculation of the cause-specific burden based on the Global Burden of Diseases, Injuries and Risk Factors study over the 1990–2019 period. Sub-Saharan Africa was one of the regions included in this study where the highest heat-attributable burdens were observed, with global deaths at 1.69 million attributable to non-optimal temperature in the year 2019. This is the only study that covered southern African countries, and the trend of diseases was not modeled against soaring temperatures.
When models are developed, communities' resilience to the effects of climate change is strengthened. The Building Resilience Against Climate Effects (BRACE) from Hess et al. [86] can be adopted, and this framework (Figure 4) follows these critical steps:
i. The first step entails a forecast of climate impacts and an assessment of community vulnerability to the impacts;
ii. Secondly, the Burden of Disease (BoD) is projected;
iii. Assessment of available interventions and the feasibility of interventions that are aimed at protecting public health;
iv. Climate and Health Adaptation plans are developed, and this is followed by their implementation, and;
v. Monitoring and evaluation are performed to ensure the effectiveness of the interventions. This is aimed at the identification of the quality of such interventions on the ground.
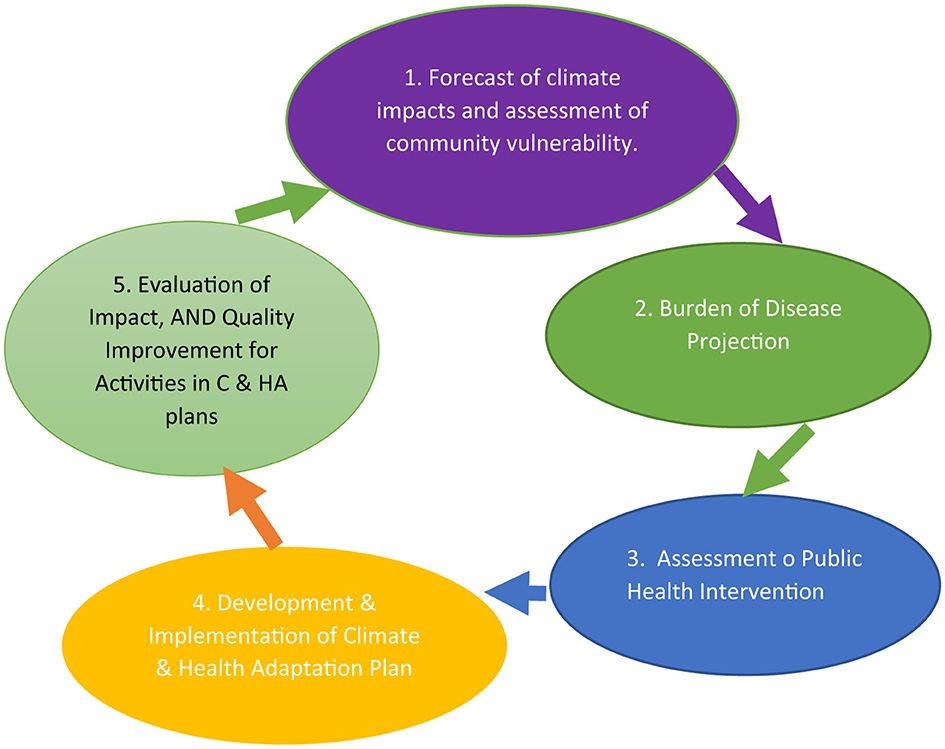
Figure 4. Center for disease control framework in BRACE. Adopted from Hess et al. [86].
Various initiatives like the National Climate Change Adaptation Strategy (NCCAS) in South Africa [87] and the Lesotho National Adaptation Programme of Action (NAPA) on climate change have used this approach to build resilient populations in efforts to get the nation prepared for climate-related disasters and avoid mental health and depression problems. However, the Lesotho approach is inclined toward agricultural productivity, and not disease spread, and extended research should model resilience using the BRACE approach to establish the quality of intervention initiatives related to disease spread.
In summary, this study suggests that countries should incorporate environmental predictors and climate predictions (temperature, precipitation, humidity and extreme weather events) into health data (numbers of reported cases and all health-related information/data from disease surveillance system); geographic and population demographics (population density and age distribution); socio-economic factors (poverty level or sources of household funds, land use, movements of communities and environmental factors within habitats); Vector data (disease vectors which are common in specific regions, e.g., insects and rodents). The “Big data” will thus be populated with predictors and will inform the spatio-temporal modeling and machine learning, which will be used to develop an early warning and decision support tool that will effectively inform climate-sensitive infectious disease transmission [68]. The public sector and its policies can thus be guided for the reduction of infectious and communicable disease spread. Notably, human behavior alters following increased temperatures, exacerbating pathogen transmission and disease outbreaks [7, 88].
10 Conclusion
It has been concluded in this review that drought and epidemiological data availability are significant in selection of suitable models that are intended to predict disease spread and reduce disease burden. The study concludes that soaring temperatures are one of the determinants of human health, marked by mortalities and morbidity. The review has also concluded that Lesotho is not forecasting drought events in alignment with disease burden, and is also not utilizing predictive models for this event. Suitable models are those that account for non-linear interactions between climate or environmental characteristics like seasonality of disease spread, variations in time (temporal disease spread), and uncertainty of disease transmission. In this manner, no risk will be left unpredicted.
It is further concluded that SARIMA and ARIMA were reportedly suitable for seasonality and temporal outbreak predictions, respectively. Nonetheless, other models like Generalized Additive Model and Artificial Neural Network (ANN) were utilized successfully in Mexico to model weather effects on human health [89] and drought simulations in South Africa [90]. In the same manner, Lesotho has not utilized these models in order to determine the effects of drought on human health. Furthermore, health services and climate change policies should be reassessed to incorporate the burden of disease, even in the planning phases of the health sector. Again, mosquitoes are highly transmissible in regions that experience both high temperatures and prolonged precipitation. There is thus a pressing need for Lesotho to model disease transmission due to this disease vector. However, heat-related, water-borne, communicable diseases should not be overlooked during the modeling processes.
Predictive modeling can be employed from the following dataset:
- hydrological parameters (surface and groundwater)
- meteorological data
i. temperature
ii. evapotranspiration
iii. rainfall
These have been utilized in studies by Zeynolabedin et al. [77] in East Azarbaijan Province, Iran, and a review on drought simulation by Nandgude et al. [65].
11 Recommendations
Availability of epidemiological and climate data can be used for disease forecasting, and this will inform early warning systems, alleviating the spread of infectious disease, while controlling cardiovascular and other heat and drought-related diseases. Lesotho is currently outside the malaria zone, but, with climatic variations, the belt is slowly shifting toward southern Africa. On this basis, the government has to facilitate and capacitate modeling of diseases and reduce disease spread to improve the level of preparedness. It is thus imperative that all the southern African countries seek to establish which predictive models are suitable for drought prediction, disease spread, resilience and sustainable development. Furthermore, the models will ensure strengthened nations' mitigation measures, preparedness of the health sector and development of early warning systems.
12 Future prospects
Future studies should establish the feasibility of diffusion rate, population attributable fraction, and burden of disease (BoD) incorporation in disease modeling, to further predict morbidities and mortalities amidst predicted drought in Lesotho. Adding to this, the significance of “Big data” that comprises environmental, health and climate data, geographical and population demographics, socio-economic factors, vector data, together with BRACE toward building the resilience of communities should be incorporated into future studies.
Data availability statement
The original contributions presented in the study are included in the article/supplementary material, further inquiries can be directed to the corresponding author.
Author contributions
MG: Writing – review & editing, Writing – original draft.
Funding
The author(s) declare financial support was received for the research and/or publication of this article. This work was supported by National University of Lesotho.
Conflict of interest
The author declares that the research was conducted in the absence of any commercial or financial relationships that could be construed as a potential conflict of interest.
Generative AI statement
The author declares that no Gen AI was used in the creation of this manuscript.
Any alternative text (alt text) provided alongside figures in this article has been generated by Frontiers with the support of artificial intelligence and reasonable efforts have been made to ensure accuracy, including review by the authors wherever possible. If you identify any issues, please contact us.
Publisher's note
All claims expressed in this article are solely those of the authors and do not necessarily represent those of their affiliated organizations, or those of the publisher, the editors and the reviewers. Any product that may be evaluated in this article, or claim that may be made by its manufacturer, is not guaranteed or endorsed by the publisher.
References
1. Mishra A, Singh V. Drought modeling - a review. J Hydrol. (2011) 403:157–75. doi: 10.1016/j.jhydrol.2011.03.049
3. NOAA. National Weather Service (2025). Available online at: https://www.weather.gov/safety/drought-types (Accessed February 7, 2025).
4. Liu S, Shi H, Niu J, Chen J, Kuang X. Assessing future socioeconomic drought events under a changing climate over the Pearl River basin in South China. J Hydrol. (2020) 30:100700. doi: 10.1016/j.ejrh.2020.100700
5. Liu S, Shi H, Sivakumar B. Socioeconomic drought under growing population and changing climate: a new index considering the resilience of a regional water resources system. J Geophys Res. (2020) 125:e2020JD033005. doi: 10.1029/2020JD033005
6. George M. Effects of changes in temperature and precipitation as climate factors that influence the spread of climate-related diseases: a systematic review. Afr Geogr Rev. (2024) 44:412–25. doi: 10.1080/19376812.2024.2416167
7. Mora C, McKenzie T, Gaw I, Dean J, von Hammerstein H, Knudson T, et al. Over half of known human pathogenic diseases can be aggravated by climate change. Nat Clim Chang. (2022) 12:869–75. doi: 10.1038/s41558-022-01426-1
8. Semenza J, Herbst S, Rechenburg A, Suk J, Höser C, Schreiber C, et al. Climate change impact assessment of food- and waterborne diseases. Crit Rev Environ Sci Technol. (2012) 42:857–90. doi: 10.1080/10643389.2010.534706
9. Nichols G, Lake I, Heaviside C. Climate change and water-related infectious diseases. Atmosphere. (2018) 9:385. doi: 10.3390/atmos9100385
10. Huang J, Yna W, Li H, Hu S, Hao Z, Li L, et al. Development of two-dimension epidemic prediction model. Infect Dis Model. (2025) 10:1190–207. doi: 10.1016/j.idm.2025.06.009
11. Myers C. Food insecurity and psychological distress: a review of the recent literature. Curr Nutr Rep. (2020) 9:107–18. doi: 10.1007/s13668-020-00309-1
13. The World Bank Group. Lesotho Climatology (2021). Available online at: https://climateknowledgeportal.worldbank.org/country/lesotho/climate-data-historical (Accessed April 20, 2025).
14. Mojahed N, Mohammadkhani M, Mohammadkhani A. Climate crises and developing vector-borne diseases: a narrative review. Iran J Public Health. (2022) 51:2664–73. doi: 10.18502/ijph.v51i12.11457
15. Aryal A, Harmon A, Dugas T. Particulate matter air pollutants and cardiovascular disease: strategies for intervention. Pharmacol Ther. (2021) 223:107890. doi: 10.1016/j.pharmthera.2021.107890
16. IHME. Global Health Data Exchange (2021). Available online at: https://ghdx.healthdata.org./ (Accessed August 1, 2025).
17. Brook R, Rajagopalan S, Pope C, Brook J, Bhatnagar A, Diez-Roux A, et al. Particulate matter air pollution and cardiovascular disease: an update to the scientific statement from the American Heart Association. Circulation. (2010) 121:2331–78. doi: 10.1161/CIR.0b013e3181dbece1
18. Yadaf R, Deora S, Yadaf G. Air pollution and its impact on cardiovascular health – It's time to act fast! Indian Heart J. (2021) 73:1–6 doi: 10.1016/j.ihj.2021.01.021
19. Kulick E, Kaufman J, Sack C. Ambient air pollution and stroke: an updated review. Stroke. (2023) 54:882–93. doi: 10.1161/STROKEAHA.122.035498
20. Butland B, Atkinson R, Crichton S, Barratt B, Beevers S, Spiridou A, et al. Air pollution and the incidence of ischaemic and haemorrhagic stroke in the South London stroke register: a case-cross-over analysis. J Epidemiol Commun Health. (2017) 71:707–12. doi: 10.1136/jech-2016-208025
21. Vivanco-Hidalgo R, Wellenius G, Basagaña X, Cirach M, González A, Ceballos P, et al. Short-term exposure to traffic-related air pollution and ischemic stroke onset in Barcelona, Spain. Environ Res. (2018) 162:160–5. doi: 10.1016/j.envres.2017.12.024
22. Toubasi A, Al-Sayegh T. Short-term exposure to air pollution and ischemic stroke. Neurology. (2023) 101:e1922–32. doi: 10.1212/WNL.0000000000207856
23. Fan Y-x, Zhang W, Li W, Ma Y-j, Zhang H-q. Global, regional, and national impact of air pollution on stroke burden: changing landscape from 1990 to 2021. BMC Public Health. (2024) 24:2786. doi: 10.1186/s12889-024-20230-4
24. Liao A, Zhang S, He C, Breitner S, Cyrys J, Naumann M, et al. Air pollution and stroke: short-term exposure's varying effects on stroke subtypes. Ecotoxicol Environ Saf. (2025) 298:118296. doi: 10.1016/j.ecoenv.2025.118296
25. Rony M, Alamgir H. High temperatures on mental health: recognizing the association and the need for proactive strategies—A perspective. Health Sci Rep. (2023) 6:e1729. doi: 10.1002/hsr2.1729
26. Sheate B. Climate change and mental health: the rising tide of eco-distress. Perspect Public Health. (2025) 145:185–87. doi: 10.1177/17579139251333289
27. Uddin K, Raj G, Giriraj A, Shrestha B. Application of remote sensing and GIS for flood hazard management: a case study from Sindh Province, Pakistan. Am J Geogr Inform Sys. (2013) 2:1–5. doi: 10.5923/j.ajgis.20130201.01
28. Parham P, Michael E. Modeling the effects of weather and climate change on malaria transmission. Environ Health Perspect. (2010) 118:620–6. doi: 10.1289/ehp.0901256
29. Babaie J, Barati M, Azizi M, Ephtekhari A, Sadat S. A systematic evidence review of the effect of climate change on malaria in Iran. J Parasitic Dis. (2018) 42:331–40. doi: 10.1007/s12639-018-1017-8
30. Zhou, G. The effects of climate change on malaria transmission in East Africa. Malaria J. (2022) 10.
31. Okafor U, Kkou P-C, D'Alessandro U, Ojeh V, Yaffa S. Projection of future malaria prevalence in the upper river region of The Gambia. Malaria J. (2025) 24:108. doi: 10.1186/s12936-025-05348-z
32. Filho L, May J, May M, Nagy G. Climate change and malaria: some recent trends of malaria incidence rates and average annual temperature in selected sub-Saharan African countries from 2000 to 2018. Malaria J. (2023) 22:248. doi: 10.1186/s12936-023-04682-4
33. Ministry of Health. Lesotho Integrated Master Plan for Neglected Tropical Diseases (NTDs) 2024-2030: Integrated Master Plan. WHO (2024). Available online at: https://www.afro.who.int/sites/default/files/2025-04/NTD%20MASTER%20PLAN%20LESOTHO%202024-2030.pdf (Accessed November 7, 2025).
34. Smith M, Willis T, Mroz E, James W, Klaar M, Gosling S, et al. Future malaria environmental suitability in Africa is sensitive to hydrology. Science. (2024) 384:697–703. doi: 10.1126/science.adk8755
35. Pratt-Johnson M. The distribution of malaria in South Africa and a mosquito survey of military hospital areas. J Hyg. (2009) 19:344–9. doi: 10.1017/S0022172400007932
36. LMS. Lesotho's Second National Communication to the Conference of Parties (COP) of the United Nations Framework Convention on Climate (UNFCCC). Ministry of Energy, Meteorology and Water Affairs (2013). Available online at: https://unfccc.int/sites/default/files/resource/LESOTHO%20SNC%20FINAL%20REPORT%20November%202013%20final.pdf (Accessed June 23, 2025).
37. Page M, McKenzie J, Bossuyt P. The PRISMA 2020 statement: an updated guideline for reporting systematic reviews. BMJ. (2021) 372:n71. doi: 10.1136/bmj.n71
38. WHO. Drought (2025). WHO. Available online at: https://www.who.int/health-topics/drought?gclid=EAIaIQobChMIsd-tztf8gQMV-RAGAB3kywTJEAMYASAAEgJ5D_D_BwE#tab=tab_1 (Accessed May 27, 2025).
39. Gallegos D, Eivers A, Sondergeld P, Pattinson C. Food insecurity and child development: a state-of-the-art review. Int J Environ Res Public Health. (2021) 18:8990. doi: 10.3390/ijerph18178990
40. Sidibe M, Dieppois B, Eden J, Mahé G, Paturel J-E, Amoussou E, et al. Near-term impacts of climate variability and change on hydrological systems in West and Central Africa. Clim Dynam. (2020) 54:2041–70. doi: 10.1007/s00382-019-05102-7
41. Ayanlade A, Oluwaranti A, Ayanlade O, Borderon M, Sterly H, Sardapolrak P, et al. Extreme climate events in sub-Saharan Africa: a call for improving agricultural technology transfer to enhance adaptive capacity. Clim Serv. (2022) 27:100311. doi: 10.1016/j.cliser.2022.100311
42. Elias E, Flynn R, Idowu O, Reyes J, Sanogo S, Schutte B, et al. Crop vulnerability to weather and climate risk: analysis of interacting systems and adaptation efficacy for sustainable crop production. Sustainability. (2019) 11:6619. doi: 10.3390/su11236619
43. Blomme G, Ntamwira J, Kearsley E, Bahati L, Amini D, Safari N, et al. Sensitivity and tolerance of different annual crops to different levels of banana shade and dry season weather. Front Sustain Food Syst. (2020) 4:545926. doi: 10.3389/fsufs.2020.545926
44. Courtney J, Bax A. Hydrating the respiratory tract: an alternative explanation why masks lower severity of COVID-19. Biophys J. (2021) 20:994–1000. doi: 10.1016/j.bpj.2021.02.002
45. Seok J, Lee B, Yoon H.-Y. Association between humidity and respiratory health: the 2016–2018 Korea National Health and Nutrition Examination Survey. Respir Res. (2024) 25:424. doi: 10.1186/s12931-024-03054-z
46. Byakatonda J, Parida B, Moalafhi D, Kenabatho P, Lesolle D. Investigating relationship between drought severity in Botswana and ENSO. Nat Hazards. (2020) 100:255–78. doi: 10.1007/s11069-019-03810-1
47. Mogotsi T. PreventionWeb (2025). Retrieved from Botswana's severe drought and the struggle to adapt. Available online at: https://www.preventionweb.net/news/botswanas-severe-drought-and-struggle-adapt
48. WFP. Anticipating the Impact of Drought in Lesotho Key Findings from Anticipatory Action Activation 2023/24. World Food Programme (2025)
49. IFRC. Namibia Drought Assessment Report. International Federation of Red Cross and Red Crescent National Societies (2022). Available online at: https://www.ifrc.org/sites/default/files/2022-08/Namibia-drought-assessment-report-2022.pdf (Accessed December 7, 2025).
50. IFRC. Eswatini Drought: DREF Operation - Appeal MDRSZ004. International Federation of Red Cross and Red Crescent Societies (2024). Available online at: https://reliefweb.int/report/eswatini/eswatini-drought-dref-operation-appeal-mdrsz004 (Accessed December 7, 2025).
51. Chen J, Xu Z, Bambrick H, Su H, Tong S, Hu W. Impacts of exposure to ambient temperature on burden of disease: a systematic review of epidemiological evidence. Int J Biometeorol. (2019) 63:1099–115. doi: 10.1007/s00484-019-01716-y
52. Chen K, Breitner S, Wolf K, Hampel R, Meisinger C, Heier M, et al. Temporal variations in the triggering of myocardial infarction by air temperature in Augsburg, Germany, 1987-2014. Eur Heart J. (2019) 40:1600–8. doi: 10.1093/eurheartj/ehz116
53. Khraishah H, Alahmad B, Ostergard J, AlAshqar A, Albaghdadi M, Vellanki N, et al. Climate change and cardiovascular disease: implications for global health. Nat Rev Cardiol. (2022) 19:798–812. doi: 10.1038/s41569-022-00720-x
54. McCutcheon K, Vachiat A, Manga P. Climate change and cardiovascular disease in Africa. Wits J Clin Med. (2018) 4:135–40. doi: 10.18772/26180197.2022.v4n3a2
55. Tian Y, Yu F, Zhang G, Tian C, Wang X, Chen Y, et al. Rotavirus outbreaks in China, 1982–2021: a systematic review. Front Public Health. (2024) 12:1423573. doi: 10.3389/fpubh.2024.1423573
56. Ali N, Khan M, Mazhar B, Mustafa M. Impact of water pollution on waterborne infections: emphasizing microbial contamination and associated health hazards in humans. Discover Water. (2025) 5:1–13. doi: 10.1007/s43832-025-00198-x
57. Magers B, Usmani M, Brumfield K, Huq A, Colwell R, Jutla A. Assessment of water scarcity as a risk factor for cholera outbreaks. Sci Total Environ. (2025) 978:179412. doi: 10.1016/j.scitotenv.2025.179412
58. Hutton G, Chase C. Water supply, sanitation, and hygiene. In:Mock C, Nugent R, Kobusingye O, Smith K, , editors. Injury Prevention and Environmental Health. 3rd ed. Washington D.C.: World Bank (2017). pp. 171–98. doi: 10.1596/978-1-4648-0522-6_ch9
59. WHO. Measles (2024). Available online at: https://www.who.int/news-room/fact-sheets/detail/measles (Accessed July 26, 2025).
60. Kala C. Environmental and socioeconomic impacts of forest fires: a call for multilateral cooperation and management interventions. Nat Hazards Res. (2023) 3:286–94. doi: 10.1016/j.nhres.2023.04.003
61. Wang X, Deng X, Hong J, Jian W, Yang Z. The impact of wildfires on local property values in Wisconsin, United States. Clim Policy. (2025) 1–15. doi: 10.1080/14693062.2025.2558181
62. Stanke C, Kerac M, Prudhomme C, Medlock J, Murray V. Health effects of drought: a systematic review of the evidence. PLoS Curr. (2013) 5:1–14. doi: 10.1371/currents.dis.7a2cee9e980f91ad7697b570bcc4b004
63. McDonald A, Hyon D, McDaniels A, O'Connor K, Swei A, Briggs C. Risk of vector tick exposure initially increases, then declines through time in response to wildfire in California. Ecosphere. (2018) 9:e02227. doi: 10.1002/ecs2.2227
64. Bianco G, Espinoza- Chávez R, Ashigbie P, Junio H, Borhani C, Miles- Richardson S, et al. Projected impact of climate change on human health in low- and middle- income countries: a systematic review. BMJ Glob Health. (2024) 8:e015550. doi: 10.1136/bmjgh-2024-015550
65. Nandgude N, Singh T, Nandgude S, Tiwari M. Drought prediction: a comprehensive review of different drought prediction models and adopted technologies. Sustainability. (2023) 15:11684. doi: 10.3390/su151511684
66. Mossad A, Alazba A. Drought forecasting using stochastic models in a hyper-arid climate. Atmosphere. (2015) 6:410–30. doi: 10.3390/atmos6040410
67. Karthika K, Thirunavukkarasu V. Forecasting of meteorological drought using ARIMA model. Indian J Agric Res. (2017) 51:103–11. doi: 10.18805/ijare.v0iOF.7631
68. Haque S, Mengersen K, Barr I, Wang L, Yang W, Vardoulakis S, et al. Towards development of functional climate-driven early warning systems for climate-sensitive infectious diseases: statistical models and recommendations. Environ Res. (2024) 249:118568. doi: 10.1016/j.envres.2024.118568
69. Zhang G. Time series forecasting using a hybrid ARIMA and neural network model. Neurocomputing. (2003) 50:159–75. doi: 10.1016/S0925-2312(01)00702-0
70. Kontopoulou V, Panagopoulos A, Kakkos I, Matsopoulos G. A Review of ARIMA vs. machine learning approaches for time series forecasting in data driven networks. Future Inter. (2023) 15:255. doi: 10.3390/fi15080255
71. Alsheheri G. Comparative analysis of ARIMA and NNAR models for time series forecasting. J Appl Math Phys. (2025) 13:267–80. doi: 10.4236/jamp.2025.131012
72. Shukla S, Steinemann A, Lettenmaier D. Drought monitoring for Washington State: indicators and applications. J Hydrometeorol. (2011) 12:66–83. doi: 10.1175/2010JHM1307.1
73. Nijssen B, Shukla S, Lin C, Gao H, Zhou T, Ishottama T, et al. A prototype global drought information system based on multiple land surface models. J Hydrometeorol. (2014) 15:1661–76. doi: 10.1175/JHM-D-13-090.1
74. Samavati A, Babamiri O, Rezai Y, Heidarimozaffar M. Investigating the effects of climate change on future hydrological drought in mountainous basins using SWAT model based on CMIP5 model. Stoch Environ Res Risk Assess. (2023) 37:849–75. doi: 10.1007/s00477-022-02319-7
75. Jariwala K, Agnihotri P. Comparative analysis of drought modelling and forecasting using soft computing techniques. Water Res Manag. (2023) 37:6051–70. doi: 10.1007/s11269-023-03642-6
76. Pande C, Vishwakarma D, Srivastava A, Moharir K, Alshehri F, Din N, et al. A novel machine learning models for meteorological drought forecasting in the semi-arid climate region. Appl Water Sci. (2025) 15:1–21. doi: 10.1007/s13201-025-02445-x
77. Zeynolabedin A, Olyaei M, Zahmatkesh Z. Application of meteorological, hydrological and remote sensing data to develop a hybrid index for drought assessment. Hydrol Sci J. (2022) 67:703–24. doi: 10.1080/02626667.2022.2043551
78. Barman S, Semenza J, Singh P, Sjödin H, Rocklöv J, Wallin J. A climate and population dependent diffusion model forecasts the spread of Aedes Albopictus mosquitoes in Europe. Commun Earth Environ. (2025) 6:276. doi: 10.1038/s43247-025-02199-z
79. Jeong B, Lee Y, Han C. A simple yet effective approach for predicting disease spread using mathematically-inspired diffusion-informed neural networks. Sci Rep. (2025) 15:15000. doi: 10.1038/s41598-025-98398-x
80. Luo Q, Li S, Guo Y, Han X, Jaakkola J. A systematic review and meta-analysis of the association between daily mean temper ature and mortality in China. Environ Res. (2019) 173:281–99. doi: 10.1016/j.envres.2019.03.044
81. Burkart K, Brauer M, Aravkin A, Godwin W, Hay S, He J, et al. Estimating the cause-specific relative risks of non-optimal temperature on daily mortality: a two-part modelling approach applied to the Global Burden of Disease Study. Lancet. (2021) 398:685–97. doi: 10.1016/S0140-6736(21)01700-1
82. Liu J, Hansen A, Varghese B, Dear K, Tong M, Prescott V, et al. Estimating the burden of disease attributable to high ambient temperature across climate zones: methodological framework with a case study. Int J Epidemiol. (2023) 52:783–95. doi: 10.1093/ije/dyac229
83. Ricci C, Kruger I, Kruger H, Breet Y, Moss S, van Oort A, et al. Determinants of mortality status and population attributable risk fractions of the North West Province, South African site of the international PURE study. Archiv Public Health. (2024) 82:102. doi: 10.1186/s13690-024-01336-y
84. Causey K, Burkart K, Collman G, Brauer M, London S. Increasing the impact of environmental epidemiology in the Global Burden of Disease Project. Epidemiology. (2021) 32:1–5. doi: 10.1097/EDE.0000000000001273
85. Kim Y-E, Jung Y-S, Ock M, Yoon S-J. DALY estimation approaches: understanding and using the incidence-based approach and the prevalence-based approach. J Prevent Med Public Health. (2022) 55:10–8. doi: 10.3961/jpmph.21.597
86. Hess J, Saha S, Schramm P, Conlon K, Uejio C, Luber G. Projecting Climate-Related Disease Burden: A Guide for Health Departments. Climate and Health Technical Report Series. Center for Disease Control and Prevention (2017). Available online at: https://www.cdc.gov/climate-health/media/pdfs/ProjectingClimateRelatedDiseaseBurden_508.pdf (Accessed December 7, 2025).
87. Shibesh B, Nagabhatla N. Addressing climate resilience in the African region: prioritizing mental health and psychosocial well-being in disaster preparedness and response planning for mainstream communities and migrants. Climate. (2025) 13:139. doi: 10.3390/cli13070139
88. Al Meslamani A. How climate change influences pathogen transmission. Pathog Glob Health. (2024) 118:450–2. doi: 10.1080/20477724.2023.2285185
89. Colón-González F, Fezzi C, Lake I, Hunter P. The effects of weather and climate on dengue. PLoS Negl Trop Dis. (2013) 7:e2503. doi: 10.1371/journal.pntd.0002503
Keywords: country preparedness, disease modeling, drought, food security, response, Southern Africa
Citation: George MA (2025) Extreme heat and disease burden in Southern Africa: a systematic review. Front. Appl. Math. Stat. 11:1698123. doi: 10.3389/fams.2025.1698123
Received: 03 September 2025; Revised: 03 November 2025; Accepted: 04 November 2025;
Published: 25 November 2025.
Edited by:
Prabir Panja, Haldia Institute of Technology, IndiaReviewed by:
Bailey Magers, Research Foundation of the City University of New York, United StatesAlmaz Akhmetov, University of Tsukuba, Japan
Copyright © 2025 George. This is an open-access article distributed under the terms of the Creative Commons Attribution License (CC BY). The use, distribution or reproduction in other forums is permitted, provided the original author(s) and the copyright owner(s) are credited and that the original publication in this journal is cited, in accordance with accepted academic practice. No use, distribution or reproduction is permitted which does not comply with these terms.
*Correspondence: Maeti Antoinette George, bWFldGlnZW9yZ2VAZ21haWwuY29t