 Natas̆a Bon
 Edi Bon
 Paola Marziani
 Luka C̆. Popović
- 1Astronomical Observatory, Belgrade, Serbia
- 2Osservatorio Astronomico di Padova (INAF), Padua, Veneto, Italy
Galaxies with narrow emission lines play a crucial role in testing the theoretical values of transition probabilities, especially for lines that need conditions that are hard to produce in laboratory plasma, and hence the theoretical values could not be checked in experimental measurements. In this paper, we explore the [O III]
1 Introduction
Emission lines from ionized gas regions in galaxies provide important diagnostic tools for understanding their physical properties. Two of the most widely studied sets of emission lines are the [O III]
The [OIII]
In addition to [OIII], the [NII]
To effectively classify galaxies based on their ionization sources, we rely on the Baldwin, Phillips, and Terlevich (BPT) diagram (Baldwin et al. (1981)), which uses line ratios such as [OIII]/H
Narrow emission lines observed in galaxy spectra are commonly attributed to photoionization of the interstellar medium (ISM) by energetic sources such as active galactic nuclei (AGNs) or young, massive stars within HII regions. In AGNs, narrow-line regions (NLRs) are photoionized by the hard radiation field of the accretion disk around the central supermassive black hole, producing prominent high-excitation lines. In contrast, in star-forming galaxies, narrow emission lines originate primarily from HII regions ionized by O- and B-type stars, typically associated with recent or ongoing star formation activity.
However, it is now recognized that other ionizing sources can also contribute significantly to the excitation of the gas. In addition to AGNs and young stellar populations, evolved low-mass stars - particularly hot post-asymptotic giant branch (post-AGB) stars and white dwarfs - can produce a hard ionizing continuum capable of generating LINER-like emission spectra. These stellar remnants, collectively known as HOLMES (hot low-mass evolved stars), may dominate the ionization budget in galaxies with little or no recent star formation (Binette et al., 1994; Stasińska et al., 2008; Byler et al., 2019). Their contribution is particularly relevant in early-type galaxies and systems with low specific star formation rates, where the emission-line excitation cannot be attributed to either AGN activity or massive stars alone.
In this study, we focus on analyzing the [OIII]
2 Sample selection
The spectroscopic data used in this work were taken from the DR7 release of Sloan Digital Sky Survey (SDSS) (Abazajian et al., 2009). The SDSS survey provides spectra in the wavelength range 3,800–9,200 Å and with mean spectral resolution
The aim was to investigate the gas component in the central region of the galaxy. Since galaxies were observed through a fixed angular fiber, we constrained the redshift range of the galaxies between 0.01 and 0.05, that corresponds to projected linear distances between 0.3 and 1.5 kpc from the galaxy center, or 0.6 and 3 kpc in diameter. We analyzed only those objects where redshift confidence, provided by SDSS DR7 database is higher than 0.95.
To firmly confine the FOV of the fiber only on the inner part of the galaxy, we constrained the size of the SDSS objects, using the SDSS isophotes in the r-band (“isoA_r”), which represents the size of the major axis of the galaxy. We bounded the major axis to be larger than 1 kpc, so the SDSS fiber covers the inner part of the galaxy.
In our study, we focused on the central region of galaxies to ensure that the observed emission lines predominantly originate from nuclear processes such as starburst activity or AGN ionization, rather than diffuse ionized gas from the outer regions. While it is well established that the central parts of galaxies often contain older stellar populations, we assumed that in the presence of an active nucleus or a nuclear starburst, strong emission lines from ionized gas would dominate the observed spectrum. This assumption is supported by previous studies showing that nuclear starbursts and AGN-related ionization effects are typically more intense in the central regions than in the outskirts (e.g., Kewley et al., 2006). By restricting our analysis to the central region, we aim to reduce the contribution of older stellar populations and extended diffuse emission, ensuring that our measurements primarily trace the physical conditions of the ionized gas in the nuclear region.
We constrained H
The resulting sample contains 4510 NELG and does not include duplicates found in the original DR7 catalog. Also, there is no spurious detection (no object with Petrosian magnitude in z band higher than 22.83).
3 Methods
3.1 Analysis of a volume limited narrow emission line galaxy sample
In order to analyze simultaneously all components of the integrated light from selected objects, we used the ULySS1 (Koleva et al., 2009) full spectrum fitting package, which fits spectroscopic observations against a bounded linear combination of nonlinear model components, convolved with a parametric line-of-sight velocity distribution.
The ULySS code was originally developed for studying the history of stellar populations and for analyzing stellar atmospheres. One of the main advantages of ULySS is its flexibility, allowing users to define arbitrary non-linear components, as explained in detail by Bon et al. (2014), Bon et al. (2016). In this study, we modified ULySS by introducing additional components designed to simultaneously fit the nebular continuum, stellar population templates, AGN continuum and a comprehensive set of emission lines. The parameters of the emission lines could be either tied or left free, depending on the specific fitting conditions.
For the purpose of studying spectra in NELG, the model of emission line galaxy used in the fit represents the linear combination of power law continuum, stellar population model convolved with a line-of-sight broadening function, and a sum of Gaussians, that represent emission lines, as described in Bon et al. (2014). The model is multiplied by a Legendre polynomial that supposes to absorb the errors in the flux calibration, Galactic extinction or any other cause that affects the shape of the continuum. The model is generated at the same resolution and with the same sampling as the observation. Spectra were fitted in the 3,700–6,800 Å wavelength range. The fit is performed in the pixel space.
We used Vazdekis stellar population models from the library of single stellar populations, computed with the MILES library and Salpeter IMF (Sánchez-Blázquez et al., 2006; Vazdekis et al., 2010).
By fitting a spectrum with the ULySS, we reconstruct the SSP-equivalent age and metallicity, mean stellar velocity and velocity dispersion, spectral index of the featureless continuum, shifts, widths and intensities of emission lines, as well as fractions of all model components.
For this study we fitted all Balmer lines and strong forbidden lines [O II]
In this work we analyzed only narrow emission lines, narrower than 600 km s-1, so the profiles of emission lines were fitted with a single Gaussian function. Figure 1 represent examples of the fit in total fitted wavelength range, and zoomed H
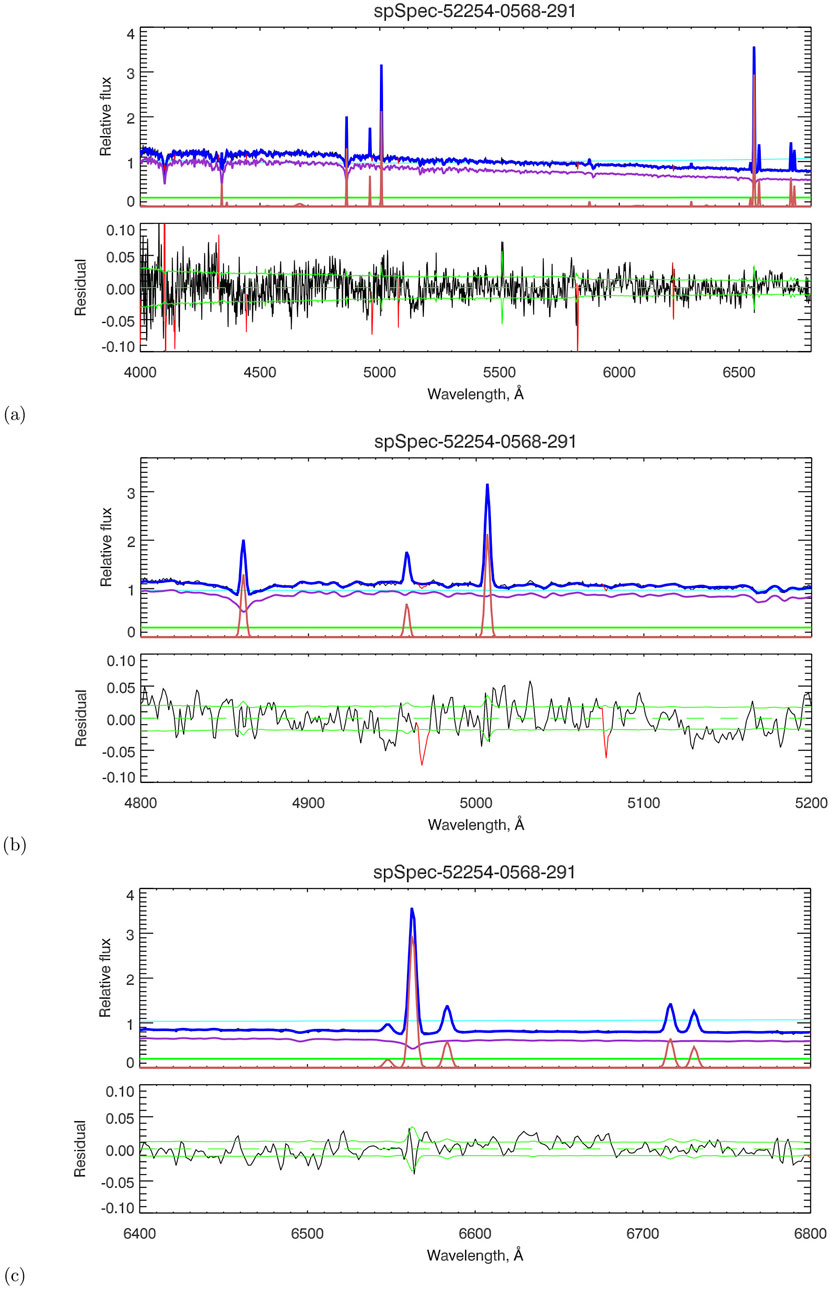
Figure 1. Example of the best fit in the total fitted wavelength range (a), best fit of the H
The common way of fitting [OIII]
Emission lines fluxes as well as their uncertainties were measured using IDL procedure INT_TABULATED from the best fit model of emission lines and residual of the fit, respectively.
Before measuring the flux ratios we removed from the set those spectra where: (a) relative error of line dispersion of any analyzed forbidden emission line is higher than 10%; (b) the difference between the width of two emission lines in the doublet [OIII]
In our analysis, each emission line was modeled using a single Gaussian profile. Even though the two lines of a forbidden doublet (e.g., [N II]
We used this method for the statistical analysis of the spectra in the central kpc of the selected NELG. The narrow emission lines can be used to classify the dominant ionization energy source in emission line galaxies. Consequently we made the well known H
Therefore, from 229 Sy2s, 89 LINERs, 3,117 starburst galaxies and 1,078 composite objects, these additional constraints have limited our samples to 37 Sy2, 48 LINERs, 262 composite spectra and 1,227 starbursts for [OIII] ratio analysis, while for the case of [NII] ratio analysis our analyzed samples counted 37 Sy2s, 47 LINERs, 202 composites and 1,513 starbursts for flux ratio analysis.
In order to remove extreme outliers we performed sigma-clipping procedure within standard 3
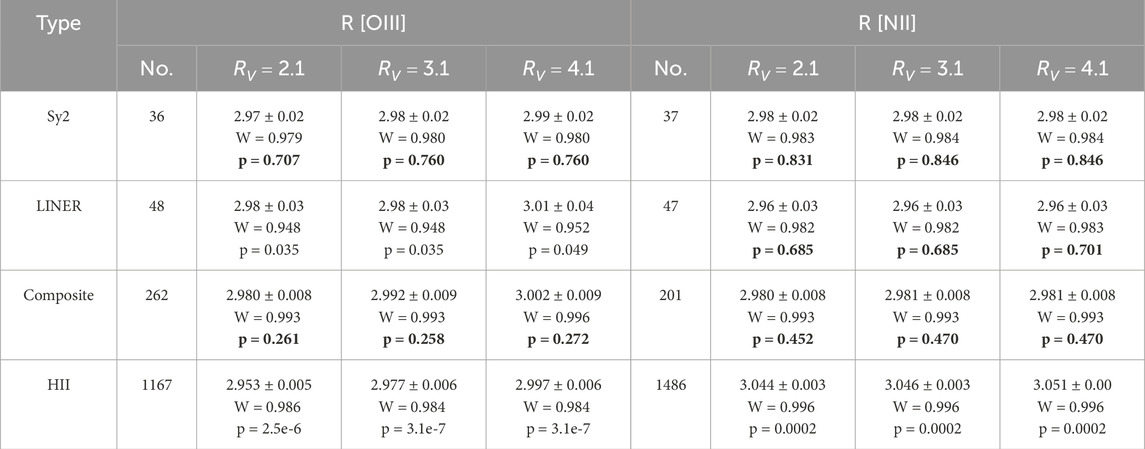
Table 1. Average flux ratios of [OIII] and [NII] with standard error of the mean (SEM), and Shapiro-Wilk test statistics (
3.2 Extinction correction procedure
The observed emission line fluxes were corrected for interstellar reddening using the Balmer decrement, specifically the H
To accurately measure the intrinsic fluxes of emission lines in our sample of galaxies, we corrected for interstellar reddening by applying an extinction correction based on the observed Balmer decrement, specifically the
The hydrogen Balmer lines are commonly employed to estimate the level of extinction affecting the observed emission lines of a photoionized plasma. This is because the intrinsic Balmer decrement values are largely insensitive to variations in gas temperature and density (if electron density is low,
To quantify the extinction, we applied the reddening law, which expresses the total extinction
where
The ratio
The selection of different
The functions
The reddening correction was applied to the observed fluxes
where R is the ratio of emission lines and
where: (
4 Results
4.1 [O III]
The forbidden [O III] lines at 4,958.911 Å and 5,006.843 Å are emitted from transitions within the
Observationally, some deviations have been noted: Iye et al. (1987) obtained 3.17
We present our results of [OIII]
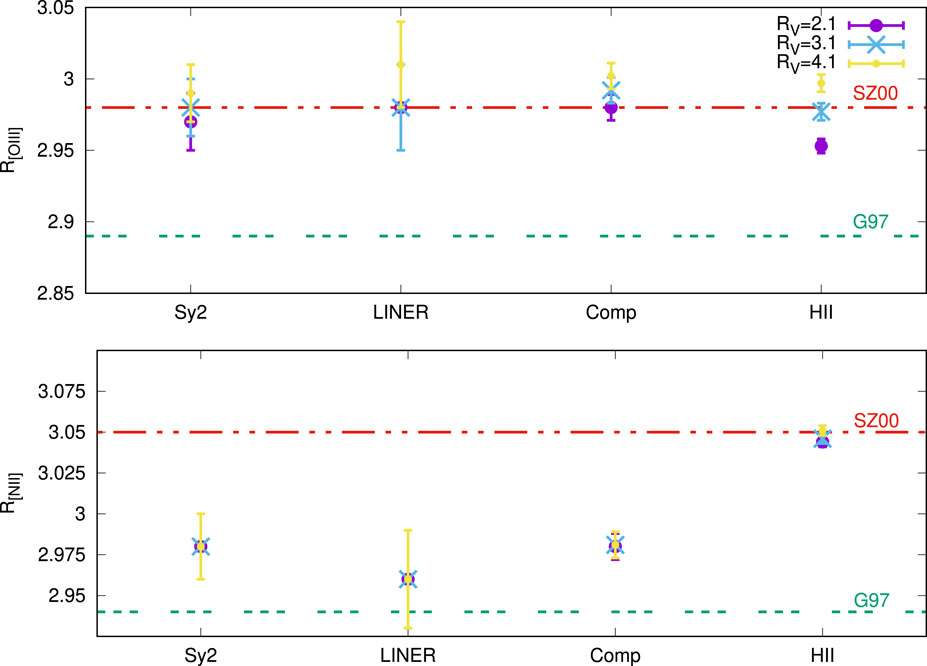
Figure 2. The comparison of R[OIII] (upper panel) and R[NII] (bottom panel) with the theoretical values from Storey and Zeippen (2000) and Galavis et al. (1997).
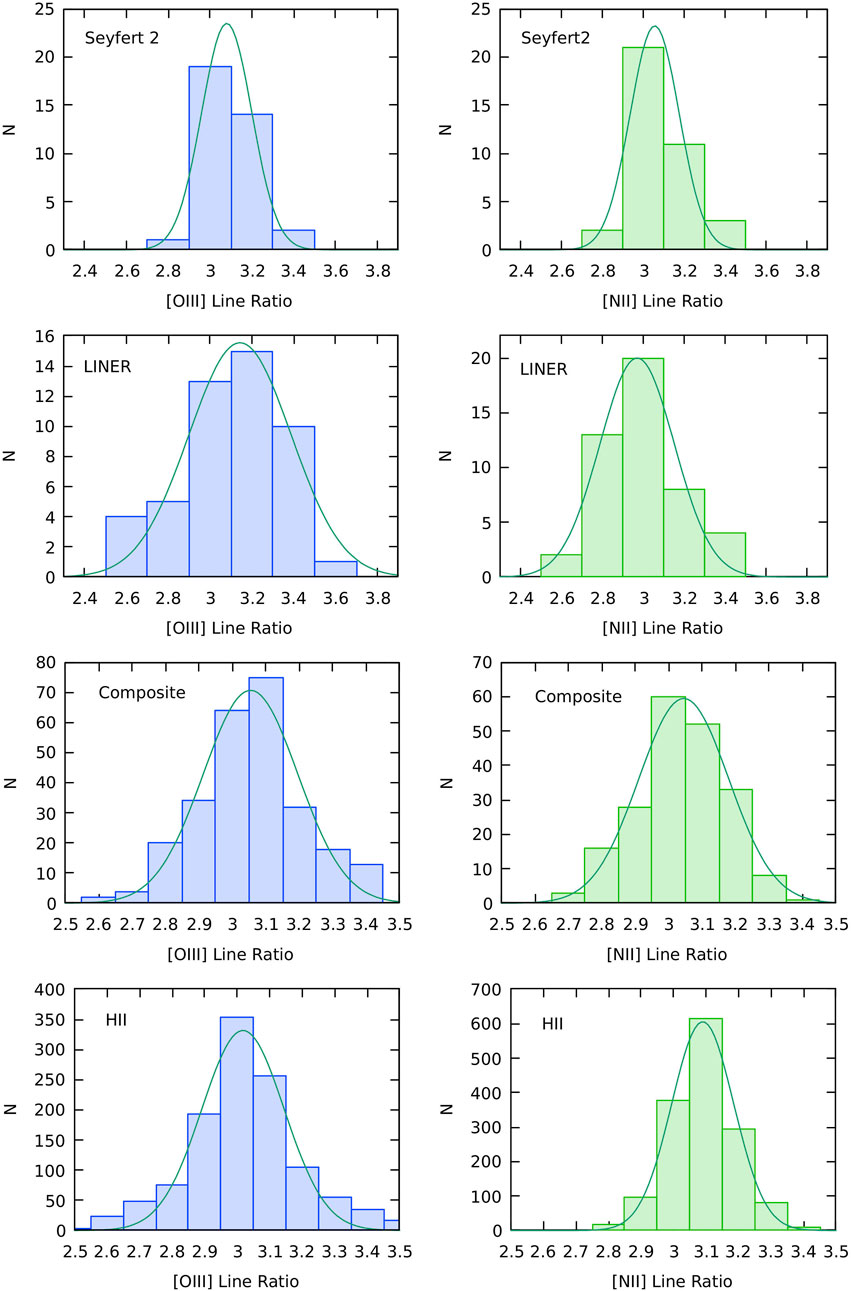
Figure 3. [OIII]4959,5007
Figure 2 presents the comparison between our measurements of the average values calculated for three extinction laws
In the Figure 3 we present the line ratio distributions for each sample (Seyfert 2, LINER, composite, and H II regions), assuming
We applied the Shapiro-Wilk test to assess Gaussianity of the distributions presented in the Figure 3. The test confirmed Gaussianity only for the distribution of line ratios in the composite sample, across all tested combinations: both line ratio distributions and all
The Figure 3 present the distribution of [OIII]
4.2 [N II]
The [N II] emission lines at 6,548 Å and 6,583 Å arise from transitions within the
The critical density for collisional de-excitation of the 1D2 level is
The theoretical intensity ratio of [N II]
Figure 3 shows the distribution of [NII]
The result for starburst spectra are in a good agreement with theoretical expectation of Storey and Zeippen (2000), especially for the case of
The reason could be physical and environmental conditions that can result with slight changes in [NII] line ratio as mentioned above, for example, if the density fluctuations reach values close to critical density, due to shocks (see, Rich et al., 2011). The [NII] lines are more sensitive to physical conditions then [OIII]. The highest discrepancy (3.6%) between our result and theoretical values is in the case of LINERs, where shocks are typically expected. We can conclude that our measurements are in overall agreement with theoretical predictions.
In addition to the [OIII] line ratio analysis, we also investigated the [NII]
To quantify the agreement between our data and theoretical expectations, we performed a two-tailed
These deviations are plausible. The [NII] lines are more sensitive to gas density and ionization structure than [OIII], and are particularly sensitive to shock excitation and other processes in AGN-driven environments. The largest deviation is found in LINERs, where shocks are expected to play a significant role (Rich et al., 2011). Overall, the measured [NII] ratios are consistent with theoretical predictions when the environmental and excitation conditions specific to each galaxy type are considered.
5 Discussion
The observed ratios of forbidden doublet lines, such as ([N II]
Forbidden lines arise from metastable levels and are sensitive to electron density
Forbidden transitions are typically optically thin, but in dense regions self-absorption can suppress the strongest line, while resonant scattering increases photon escape times (Gaskell, 2017). These effects can modify the doublet ratio, particularly in high-density ionized clouds.
The interpretation of emission line ratios in galaxies requires careful consideration of both intrinsic ionization conditions and the effects of reddening. The total-to-selective extinction parameter,
The results in Table 1 indicate that for most galaxy types, the [O III] and [N II] line ratios exhibit only minor variations with changes in
The primary factors contributing to these trends include the fact that LINERs are commonly found in evolved, passive galaxies, where dust grain size distributions and compositions may differ from those in star-forming regions. Unlike H II regions or Seyfert galaxies, LINERs often exhibit lower ionization parameters, which could make their line ratios more sensitive to subtle extinction effects. Some LINERs show evidence of shock-driven ionization Rich et al. (2011), which can alter the relative strengths of forbidden lines and make them more sensitive to dust corrections.
Seyferts and LINERS may also need additional semi broad component in the model. Preliminary tests from re-fitting Seyfert 2 sample with a two-component model (narrow + semi-broad) reveal that the inclusion of an additional semi-broad Gaussian often results in an increase in the measured line ratios. A close inspection of the line profiles shows that in many cases, the additional semi broad component either (1) significantly overlaps with neighboring lines such as H
Given this situation, we conclude that adopting a two-component model for the [NII]+Halpha would either (a) lead to a substantial loss of usable spectra due to the overlap criterion being violated, or (b) require ignoring the overlap in faint-component cases, which undermines methodological consistency. Conversely, in cases where the semi-broad component is very faint, its impact is minimal, and the spectrum could arguably remain. However, this raises a concern about “uniform treatment”: either we apply a strict overlap rejection to all cases regardless of flux contribution, which would severely reduce the sample size (already limited), or we introduce subjective thresholds, risking inconsistent selection. If we retain the two-component model, then the overlap criterion is violated in many cases where the semi broad component is significant. Thus, for the purpose of maintaining a statistically significant and uniformly treated sample, we favor the use of a single-component model uniformly for all spectra, regardless of whether a second component could be locally justified.
In contrast to LINERs, Seyfert 2 (Sy2) galaxies and composite galaxies exhibit greater stability in their line ratios across different values of
H II regions, however, exhibit a slight increase in the [O III] and [N II] doublet ratios at
The observed trends in forbidden line ratios provide insights into the evolutionary stages and ionization mechanisms of different galaxy types. The distinct behavior of LINERs suggests that they may represent a transition phase in galaxy evolution, where ionization is no longer dominated by young stars but rather by hot post-AGB stars, weak AGN, or shock processes.
Our results demonstrate that the impact of reddening corrections on emission line ratios is generally small but not negligible, particularly in LINERs. They exhibit a stronger dependence on
These findings emphasize the importance of considering both extinction corrections and underlying astrophysical processes when interpreting emission line ratios in different galaxy types.
6 Conclusion
Theoretical values obtained for transition probabilities of emission lines could be in some cases tested only in astrophysical conditions. In the spectra of narrow emission line galaxies forbidden emission lines such as [OIII]
In this study, we investigated the ratios of the optical forbidden emission lines [OIII]
The latest theoretical prediction for [OIII]
In summary, our results demonstrate following: (i) The impact of reddening corrections on emission line ratios is generally small but not negligible, particularly in LINERs; (ii) LINERs exhibit a stronger dependence on
We find that [OIII] line ratios correspond to theoretical prediction of Storey and Zeippen (2000) for samples Sy, LINER and composite in case of
Our analysis is in a good agreement with theoretical expectations and results from previous works. The measured [O III] and [N II] flux ratios across different galaxy subclasses remain largely consistent with theoretical predictions, particularly for Seyfert 2, composite galaxies, and H II regions. However, the most notable discrepancy was observed in [N II] ratio for the case of LINERs, but still remains within theoretical calculations.
Additionally, we find that the small differences observed among the four subclasses could be linked to variations in the physical conditions of their inner regions. Such differences include electron density, ionization parameter, and dust properties, all of which can influence the reddening corrections applied to emission line ratios. These effects, in turn, can lead to subtle modifications in the observed line profiles, particularly in LINERs, where the ionization mechanisms are less uniform compared to Seyfert galaxies or H II regions.
Our results reinforce the importance of considering both reddening effects and intrinsic galaxy properties when interpreting emission-line diagnostics, particularly in low-ionization systems like LINERs, where multiple ionization sources contribute to the observed spectra.
Data availability statement
The raw data supporting the conclusions of this article will be made available by the authors, without undue reservation.
Author contributions
NB: Conceptualization, Data curation, Formal Analysis, Funding acquisition, Investigation, Methodology, Project administration, Resources, Software, Supervision, Validation, Visualization, Writing – original draft. EB: Conceptualization, Formal Analysis, Investigation, Methodology, Writing – original draft. PM: Supervision, Validation, Visualization, Writing – original draft. LP: Supervision, Validation, Writing – original draft.
Funding
The author(s) declare that financial support was received for the research and/or publication of this article. This work is supported by the Ministry of Science, Technological Development and Innovation of the Republic of Serbia, contract No. 451–03–136/2025-03/200002. Funding for the Sloan Digital Sky Survey (SDSS) and SDSS-II has been provided by the Alfred P. Sloan Foundation, the Participating Institutions, the National Science Foundation, the U.S. Department of Energy, the National Aeronautics and Space Administration, the Japanese Monbukagakusho, and the Max Planck Society, and the Higher Education Funding Council for England. The SDSS Web site is http://www.sdss.org/. The SDSS is managed by the Astrophysical Research Consortium (ARC) for the Participating Institutions. The Participating Institutions are the American Museum of Natural History, Astrophysical Institute Potsdam, University of Basel, University of Cambridge, Case Western Reserve University, The University of Chicago, Drexel University, Fermilab, the Institute for Advanced Study, the Japan Participation Group, The Johns Hopkins University, the Joint Institute for Nuclear Astrophysics, the Kavli Institute for Particle Astrophysics and Cosmology, the Korean Scientist Group, the Chinese Academy of Sciences (LAMOST), Los Alamos National Laboratory, the Max-Planck-Institute for Astronomy (MPIA), the Max-Planck-Institute for Astrophysics (MPA), New Mexico State University, Ohio State University, University of Pittsburgh, University of Portsmouth, Princeton University, the United States Naval Observatory, and the University of Washington.
Acknowledgments
We acknowledge the help of Philippe Prugniel in the sample selection process. We also acknowledge Samir Salim and Martin Gaskell for their help and useful comments.
Conflict of interest
The authors declare that the research was conducted in the absence of commercial or financial relationships that could be construed as a potential conflict of interest.
The reviewer DB declared a shared affiliation with the author PM to the handling editor at the time of review.
The author(s) declared that they were an editorial board member of Frontiers, at the time of submission. This had no impact on the peer review process and the final decision.
Generative AI statement
The author(s) declare that no Generative AI was used in the creation of this manuscript.
Publisher’s note
All claims expressed in this article are solely those of the authors and do not necessarily represent those of their affiliated organizations, or those of the publisher, the editors and the reviewers. Any product that may be evaluated in this article, or claim that may be made by its manufacturer, is not guaranteed or endorsed by the publisher.
Footnotes
1ULySS is available at: http://ulyss.univ-lyon1.fr/
References
Abazajian, K. N., Adelman-McCarthy, J. K., Agüeros, M. A., et al. (2009). ApJS 182, 543. doi:10.1088/0067-0049/182/2/543
Baldwin, J. A., Phillips, M. M., and Terlevich, R. (1981). Publ. Astronomical Soc. Pac. 93, 5. doi:10.1086/130766
Bon, E., Zucker, S., Netzer, H., Marziani, P., Bon, N., Jovanović, P., et al. (2016). ApJS 225, 29. doi:10.3847/0067-0049/225/2/29
Bon, N., Popović, L. Č., and Bon, E. (2014). Efficiency tests for estimating the gas and stellar population parameters in Type 2 objects. Adv. Space Res. 54, 1389–1400. doi:10.1016/j.asr.2014.06.040
Byler, N., Dalcanton, J. J., Conroy, C., Johnson, B. D., Choi, J., Dotter, A., et al. (2019). Self-consistent Predictions for LIER-like Emission Lines from Post-AGB Stars. AJ 158, 2. doi:10.3847/1538-3881/ab1b70
Calzetti, D., Armus, L., Bohlin, R. C., Kinney, A. L., Koornneef, J., and Storchi-Bergmann, T. (2000). The dust content and opacity of actively star-forming galaxies. Astrophysical J. 533, 682–695. doi:10.1086/308692
Cardelli, J. A., Clayton, G. C., and Mathis, J. S. (1989). The relationship between infrared, optical, and ultraviolet extinction. APJ 345, 245. doi:10.1086/167900
Dimitrijević, M. S., Popović, L. Č., Kovačević, J., Dačić, M., and Ilić, D. (2007). MNRAS 374, 1181. doi:10.1111/j.1365-2966.2006.11238.x
Dojčinović, I., Kovačević-Dojčinović, J., and Popović, L. Č. (2023). Adv. Space Res. 71, 1219. doi:10.1016/j.asr.2022.04.041
Galavis, M. E., Mendoza, C., and Zeippen, C. J. (1997). Atomic data from the IRON Project: XXII. Radiative rates forforbidden transitions within the ground configuration of ions inthe carbon and oxygen isoelectronic sequences. A and AS 123, 159–171. doi:10.1051/aas:1997344
Gaskell, C. M., and Ferland, G. J. (1984). Theoretical hydrogen-line ratios for the narrow-line regions of active galactic nuclei. PASP 96, 393. doi:10.1086/131352
Iye, M., Ulrich, M.-H., and Peimbert, M. (1987). High resolution spectrum of the starburst galaxy Tololo 1924-416 (=ESO 338-IG04). Astronomy and Astrophysics 186, 84–94.
Kauffmann, G., Heckman, T. M., Tremonti, C., Brinchmann, J., Charlot, S., White, S. D. M., et al. (2003). The host galaxies of active galactic nuclei. MNRAS 346, 1055–1077. doi:10.1111/j.1365-2966.2003.07154.x
Kewley, L. J., Dopita, M. A., Sutherland, R. S., Heisler, C. A., and Trevena, J. (2001). Theoretical modeling of starburst galaxies. APJ 556, 121–140. doi:10.1086/321545
Kewley, L. J., Groves, B., Kauffmann, G., and Heckman, T. (2006). The host galaxies and classification of active galactic nuclei. MNRAS 372, 961–976. doi:10.1111/j.1365-2966.2006.10859.x
Koleva, M., Prugniel, P., Bouchard, A., and Wu, Y. (2009). ULySS: a full spectrum fitting package. A and A 501, 1269–1279. doi:10.1051/0004-6361/200811467
Laker, M. A., Camacho, C. D., Jones, D., and Moody, J. (2022). The flux ratio of the [OIII]λλ5007,4959 doublet with redshift. Symmetry 14, 266. doi:10.3390/sym14020266
Maiolino, R., Marconi, A., and Oliva, E. (2001). Astron Astrophys. 365, 37–48. doi:10.1051/0004-6361:20000012
Osterbrock, D. E. (1989). Astrophysics of gaseous nebulae and active galactic nuclei, 101, 341. Available online at: https://ui.adsabs.harvard.edu/abs/1989agna.book
Osterbrock, D. E., and Ferland, G. J. (2006). Astrophysics of gaseous nebulae and active galactic nuclei. 2nd edn. Sausalito, California: University Science Books.
Popović, L. Č., Dimitrijević, M. S., Bon, E., and Dačić, M. (2005). Publications of the astronomical society. Rudjer Boskovic 5, 247.
Sánchez-Blázquez, P., Peletier, R. F., Jiménez-Vicente, J., et al. (2006). MNRAS 371, 703. doi:10.1111/j.1365-2966.2006.10699.x
Shivaei, I., Reddy, N., Rieke, G., Shapley, A., Kriek, M., Battisti, A., et al. (2020). The MOSDEF survey: the variation of the dust attenuation curve with metallicity. APJ 899, 117. doi:10.3847/1538-4357/aba35e
Stasińska, G., Vale Asari, N., Cid Fernandes, R., Gomes, J. M., Schlickmann, M., Mateus, A., et al. (2008). Can retired galaxies mimic active galaxies? clues from the sloan digital sky survey. MNRAS 391, L29– L33. doi:10.1111/j.1745-3933.2008.00550.x
Storey, P. J., and Zeippen, C. J. (2000). Theoretical values for the [O iii] 5007/4959 line-intensity ratio and homologous cases. MNRAS 312, 813–816. doi:10.1046/j.1365-8711.2000.03184.x
Strauss, M. A., Weinberg, D. H., Lupton, R. H., Narayanan, V. K., Annis, J., Bernardi, M., et al. (2002). Spectroscopic target selection in the sloan digital Sky survey: the main galaxy sample. AJ 124, 1810–1824. doi:10.1086/342343
Vazdekis, A., Sánchez-Blázquez, P., Falcón-Barroso, J., Cenarro, A. J., Beasley, M. A., Cardiel, N., et al. (2010). Evolutionary stellar population synthesis with MILES - I. The base models and a new line index system. MNRAS 404, 1639–1671. doi:10.1111/j.1365-2966.2010.16407.x
Keywords: galaxies, emission line galaxies, seyfert-galaxies, star forming galaxies, liners, active gala×ies, emission lines ratio
Citation: Bon N, Bon E, Marziani P and Popović LC (2025) Ratios of forbidden [OIII] λλ4959,5007 and [NII] λλ6548,6583 lines in nearby narrow emission line galaxies. Front. Astron. Space Sci. 12:1540522. doi: 10.3389/fspas.2025.1540522
Received: 05 December 2024; Accepted: 23 April 2025;
Published: 13 May 2025.
Edited by:
Fabio La Franca, Roma Tre University, ItalyReviewed by:
Daniela Bettoni, Osservatorio Astronomico di Padova (INAF), ItalyAlberto Nigoche-Netro, University of Guadalajara, Mexico
Marina Trevisan, Federal University of Rio Grande do Sul, Brazil
Copyright © 2025 Bon, Bon, Marziani and Popović. This is an open-access article distributed under the terms of the Creative Commons Attribution License (CC BY). The use, distribution or reproduction in other forums is permitted, provided the original author(s) and the copyright owner(s) are credited and that the original publication in this journal is cited, in accordance with accepted academic practice. No use, distribution or reproduction is permitted which does not comply with these terms.
*Correspondence: Natas̆a Bon, bmJvbkBhb2IucnM=