 Ligia Alves Da Silva1,2*
 Jiankui Shi1
 Lívia R. Alves2
 Laysa Cristina Araújo Resende1,2
 Luis Eduardo Antunes Vieira2
 Joaquim Eduardo Rezende Costa2
 Jose Paulo Marchezi3
 Oleksiy V. Agapitov4
 David Gary Sibeck5
 Angela Machado dos Santos1,2
 Vania Fatima Andrioli1,2
 Paulo Ricardo Jauer1,2
 Vinicius Deggeroni2
 Carolina de Sousa do Carmo1,2Prosper Kwamla Nyassor2
 Sony Su Chen2
 Toyese Tunde Ayorinde2
 Karen Júlia Coldebella Ferreira2
 Juliano Moro1,2
 Chi Wang1Hui Li1Zhengkuan Liu1
- 1State Key Laboratory of Space Weather, National Space Science Center, Chinese Academy of Sciences, Beijing, China
- 2Division of Space Weather and Division of Heliophysics, Planetary Sciences and Aeronomy, National Institute for Space Research – INPE, São José dos Campos, São Paulo, Brazil
- 3Department of Geology and Natural Resources, Institute of Geosciences, University of Campinas – UNICAMP, Campinas, São Paulo, Brazil
- 4University of California, Berkeley - UCB - Space Sciences Laboratory, Berkeley, CA, United States
- 5NASA Goddard Space Flight Center, Greenbelt, MD, United States
A complex active region in the Sun’s photosphere from 8 May 2024, produced seven halo-type Coronal Mass Ejections (CMEs) following extreme solar flares. These events generated Solar Energetic Particles (SEPs) that propagated toward Earth, culminating in an extreme geomagnetic storm (SYM-H = −497 nT) from May 10 to 13 May 2024. This study analyzes the Sun’s photosphere, interplanetary medium, inner radiation belt, and the space weather impacts on the neutral atmosphere and E and F ionospheric layers over the South Atlantic Magnetic Anomaly (SAMA) during the storm’s main phase. The first and second Interplanetary CMEs (ICMEs) reached Earth’s bow shock at 15:00 UT and 17:00 UT on May 10, respectively. The second ICME, associated with a shock, caused a significant displacement of the dayside magnetopause (∼6 Earth radii, RE) and the first solar wind Poynting flux transfer into the magnetosphere (Akasofu parameter, Epsilon ∼ 1 × 10¹³ W). At 18:00 UT, the third ICME and its associated shock pushed the magnetopause further to ∼5 RE and added energy to the magnetospheric budget (Epsilon ∼2.5 × 10¹³ W). Between 19:00 and 21:00 UT, the solar wind proton density (>40 cm-3) peaked at Earth’s bow shock, but no energy input to the magnetosphere occurred (Epsilon ∼0 W). Low-energy electron/ion fluxes vanished in the inner radiation belt. Epsilon gradually increased between 21:00 and 22:30 UT, coinciding with the onset of low-energy electron/ion injections into the inner radiation belt and substorm activity. These injections persisted after 22:30 UT, albeit limited to specific energy levels. Enhanced energetic particle precipitation (EPP) and local particle acceleration caused significant variability in electron/ion fluxes in the inner radiation belt. Increased scattering by plasma waves precipitated particles into the SAMA atmosphere, raising ionization rates and depleting ozone in the mesosphere and stratosphere. Extra ionization in the E ionospheric region further indicated auroral-like effects in this low-latitude region during the storm’s main phase.
Highlights
• The low-energy electron (10 eV-100 keV) flux vanishes from the inner radiation belt simultaneously to the absence of energy input in the magnetosphere.
• Simultaneous observation of enhanced ionizations in the E ionospheric region over SAMA and electron flux variability in the inner radiation belt.
• Abrupt ozone depletion in the mesosphere over SAMA simultaneously to the electron flux variability in the inner radiation belt.
1 Introduction
Complex active regions in the Sun’s photosphere are the source of the most powerful solar events (McIntosh, 1990; Moon et al., 2016; Tsurutani et al., 2023), which can generate and launch various types of eruptive phenomena in the direction of the Earth, like Coronal Mass Ejections (CMEs), extreme solar flares, and Solar Energetic Particles (SEPs) (Sammis et al., 2000; Takizawa and Kitai, 2015). These dynamic conditions in the solar corona can trigger physical processes that release successive CMEs, which can be responsible for sequential storms when coupled to the Earth’s magnetosphere (Zhang et al., 2007; Yermolaev and Yermolaev, 2008). The strength of the solar wind plasma and magnetic field parameters, the number of Interplanetary CMEs (ICMEs), as well the intensities of SEP particles, control the impact on the inner and outer magnetosphere (Baker et al., 2013). Space weather disturbances causing particle precipitation from the magnetosphere into the atmosphere can be monitored and studied.
The cumulative effect form several ICMEs to the Earth’s magnetosphere during a short time interval can trigger physical mechanisms capable of generating various geomagnetic storms (Gonzalez et al., 2007; Echer et al., 2008; Gonzalez et al., 2011), which when they occur over a short time, can be considered an extreme storm. Generally, extreme storms include strong magnetopause compressions, followed by energy deposition in the magnetosphere through the magnetopause (Ponomarev et al., 2006) and also magnetotail reconnections. The particle flux variability in the inner magnetosphere, specifically in the inner radiation belt, under the influence of this energy deposited, can contribute to extra ionizations in the atmosphere over the South Atlantic Magnetic Anomaly (SAMA), characterized by an environment with the lower magnetic field intensity (∼25,000 nT) on Earth. Such extra ionization is attributed to the presence of unusual energetic particle precipitation (EPP) in this particular low-latitude region (Moro et al., 2022; Resende et al., 2022a; Da Silva et al., 2022; Da Silva et al., 2023).
Enhanced charged particle intensities in space and the atmospheric environments during extreme storms can damage satellite circuits (Baker et al., 2018), and increase radiation hazards for humans in aircraft, spacecraft, and the space station (Parihar et al., 2016; Scheibler et al., 2022; Shetgaonkar and Kumar, 2022). They can also change the ionized-neutral atmosphere composition in the auroral regions (Cai and Ma, 2007; Reddmann et al., 2023) and over the SAMA (Da Silva et al., 2016; Da Silva et al., 2022; Da Silva et al., 2023; Andrioli et al., 2024). Although the inference of the EPP over the SAMA region is quite complicated due to proton contamination in the electron detectors onboard low-orbit satellites (Rodger et al., 2013), the signature of extra ionization at different altitudes can be mapped using ground-based network data, and via measurements of the ozone distribution in neutral atmosphere using low-orbit satellite data, which is the main approach of this work.
Therefore, the atypical behavior in the neutral-ionized atmosphere over SAMA is analyzed under the influence of the low-energy electron precipitation through the signatures of enhanced ionization in the atmosphere during an extreme geomagnetic storm that occurred on May 10-13, 2024. This extreme geomagnetic storm was the most powerful in the last 35 years. It can cause several disturbances in the ionized-neutral atmosphere over the SAMA region through the influence of EPP. In the Ionized atmosphere, this storm can contribute to the generation of nocturnal E layers (Abdu et al., 2013), pre-reversal enhancements of the zonal electric field/vertical drift (PRE) during the sunset hours (Abdu et al., 2005), development of the auroral type sporadic E layers during the recovery phase of the storm (Moro et al., 2022; Resende et al., 2022a; Resende et al., 2022b; Da Silva et al., 2022; Da Silva et al., 2023), and changes in the propagation direction of equatorial plasma bubbles (EPBs) (Santos et al., 2016).
On the other hand, enhanced ionization in the neutral atmosphere over SAMA can be analyzed by observing composition changes in the mesosphere/stratosphere, similar to those in the auroral regions. These precipitations increase ionization and dissociation rates, producing the odd nitrogen (NOx) and odd hydrogen (HOx) at these altitudes in response to EPP, which can interfere with ozone chemistry catalytically, causing ozone depletion (Callis et al., 1991; Da Silva et al., 2016; Sun et al., 2024).
2 Data and methodology description
We analyzed atmospheric perturbations over SAMA during the main phase of the May 10-11, 2024, extreme geomagnetic storm. We tracked the event from the solar corona active region conditions, the solar wind parameters in the vicinity of the Earth bow shock, the inner radiation belt electron/ion flux, to the ionized-neutral atmosphere disturbances over SAMA associated with EPP.
Magnetic field and plasma data at the Earth’s bow shock nose were obtained from the Magnetic Field Experiment (MAG) and Solar Wind Electron, Proton, and Alpha Monitor (SWEPAM) instruments onboard the ACE satellite (Stone et al., 1998) and the 3DP instrument on the WIND spacecraft (Ogilvie et al., 1995), accessed via https://omniweb.gsfc.nasa.gov/form/omni_min_def.html. The magnetopause standoff distance (Rmp) was estimated using the solar wind parameters and the model of Shue et al. (1998). The magnetospheric energy budget was estimated through the Epsilon parameter of Akasofu, calculated from interplanetary medium parameters according to Perreault and Akasofu (1978) and Akasofu (1979), Akasofu (1981). Geomagnetic indices, including SYM-H and AE, were computed at WDC for Geomagnetism (https://wdc.kugi.kyoto-u.ac.jp/aeasy/) and https://omniweb.gsfc.nasa.gov/form/omni_min_def.html. These parameters are critical for understanding the coupling between solar wind structures and Earth’s magnetosphere and the physical processes within the inner magnetosphere that drive space weather impacts (Borovsky and Yakymenko, 2017; Borovsky, 2018).
The measurements of the magnetic field and plasma data sets shifted to the Earth’s bow shock nose are obtained at https://omniweb.gsfc.nasa.gov/form/omni_min_def.html to characterize the solar wind parameters during this extreme geomagnetic storm. These parameters are measured by the Magnetic Field Experiment (MAG) and Solar Wind Electron, Proton, and Alpha Monitor (SWEPAM) instrument onboard the Advanced Composition Explorer (ACE) satellite (Stone et al., 1998), and from three-dimensional plasma and energetic particle investigation (3DP) instrument onboard the WIND spacecraft (Ogilvie et al., 1995). We estimate the magnetopause standoff distance (Rmp) using solar wind parameters by making use of model of Shue et al. (1998). The energy input for the magnetospheric energy budget is estimated through the Epsilon parameter of Akasofu, which is calculated using the interplanetary medium parameters according to Perreault and Akasofu (1978) and Akasofu (1979), Akasofu (1981). Geomagnetic indices are used to infer the geomagnetic storm/substorm intensities, in which the symmetric ring current H (SYM-H) and Auroral electrojet (AE) indices have been computed at WDC for Geomagnetism at https://wdc.kugi.kyoto-u.ac.jp/aeasy/, available at https://omniweb.gsfc.nasa.gov/form/omni_min_def.html. The interplanetary parameters measurements and geomagnetic indexes are essential for understanding the coupling between the solar wind structures and the Earth’s magnetosphere. These parameters are also relevant to identifying the changes that can trigger physical processes within the inner magnetosphere responsible for the space weather impacts (Borovsky and Yakymenko, 2017; Borovsky, 2018).
The inner radiation belt conditions are analyzed from the in-situ measurements of the electron/ion fluxes and magnetic field components by the three THEMIS (Time History of Events and Macroscale Interactions during Substorms) inner probes (THA, THD, and THE, Angelopoulos, 2008). The low-energy electron/ion fluxes (10 eV-100 keV/10 eV-100 keV), mid-energy electron flux (200 keV–700 keV), and high-energy ion flux between (2 MeV–40 MeV) within the inner radiation belt are provided by the Solid-State Telescope (SST), and Electrostatic Analyzer (ESA) instruments (McFadden et al., 2008). The magnetic field components (Bx, By, and Bz) in Geocentric Solar Magnetospheric (GSM) coordinates are obtained from the Fluxgate Magnetometer (FGM) instrument (Auster et al., 2008). During our study period, the footprints of THA and THE satellites, the magnetic conjugated projections of the spacecraft location to the ionosphere crossed Equatorial South America (Figure 1 - blue and red lines), including the SAMA region (Figure 1 - blue and red dashed lines) during the period of interest.
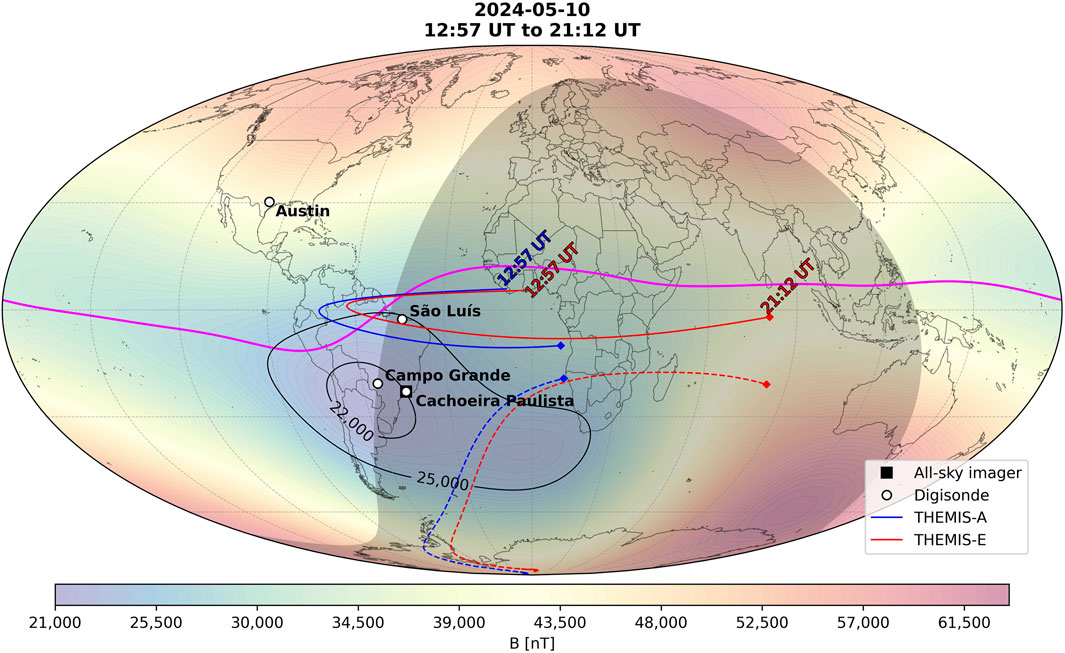
Figure 1. The traces of THA (the blue curve) and THE (the red curve) and their magnetic footprints (the dashed blue and red curves, respectively) on 10 May 2024, 12:57–21:12 UT (from https://sscweb.gsfc.nasa.gov). The color’s scale represents the global magnetic field, and the magenta line indicates the magnetic equator at an altitude of 150 km. Cachoeira Paulista, Campo Grande, São Luís, and Austin are represented by Digisonde stations (white circles) and an all-sky imager station (black square). The SAMA region is depicted by the iso-intensity black contours of 22,000 and 25,000 nT.
The EPP into the atmosphere over the SAMA region is analyzed through the Energetic Particle Telescope (EPT) instrument onboard the PROBA-V satellite. The PROBA-V/EPT data are publicly available on the Space Situational Awareness website of ESA https://swe.ssa.esa.int/space-radiation. The EPT operates in a low Earth orbit at an altitude of 820 km. It employs state-of-the-art signal processing technologies to achieve precise particle identification, such as electrons between 500 and 20,000 keV. The EPT’s modular design allows customization of its maximum energy range, field of view, geometrical factor, and angular resolution, making it suitable for diverse research and operational needs. Its innovative ΔE-R detection principle ensures high energy resolution and contamination-free measurements, enabling robust monitoring of space weather phenomena and contributing to the validation of radiation environment models (Cyamukangu and Grégoire, 2011; Cyamukungu et al., 2014; Pierrard et al., 2014).
The ionosphere dynamics over the SAMA region was analyzed using the OI 630.0-nm emission all-sky images collected in Cachoeira Paulista (Lat: 22°39′54″S, Lon: 45°00′34″W) station (Figure 1 - black square) to detect EPBs propagation. The Extra ionization in E region is analyzed with Digisondes (Reinisch et al., 2009). The Digisonde stations (Figure 1 - white circles) are in Cachoeira Paulista, Campo Grande (Lat: 20°26′34″S, Lon: 54°38′47″W) and São Luís (Lat: 2°31′51″S, Lon: 45°00′34″W). The ionosphere data is obtained from the EMBRACE network at https://www2.inpe.br/climaespacial/portal/pt/. The data from Austin station (Lat: 30°16′11″N, Lon: 97°45′25″W) in Texas (United States), obtained at https://giro.uml.edu/, is included here for comparison, as it is located far from the SAMA.
The ozone distribution on the mesosphere/stratosphere over the SAMA region was obtained from Sounding of the Atmosphere using Broadband Emission Radiometry (SABER) instrument on board of TIMED (Thermosphere, Ionosphere, Mesosphere/stratosphere and Energetics Dynamics) satellite (Russell et al., 1999). SABER observes ozone emission in a band-pass range from 1,010 to 1,150 cm–1 (9.9–8.7 μm) and autonomously retrieves data from two separate channels: 9.6 μm and 1.27 μm. SABER’s O3 measurements have a precision of approximately 2% in the altitude range of 10–65 km and around 5% in the mesosphere (Russell et al., 1999).
3 Space weather analyses
3.1 Sun’s photosphere conditions in the active region AR13664
Solar activity, such as solar flares and coronal mass ejections (CMEs), is the primary driver of near-Earth disturbances. These phenomena release enormous amounts of magnetic energy into the solar corona, creating space weather and geomagnetic disturbances and affecting the Earth’s atmosphere. Solar activity originates in active regions (ARs) in the solar photosphere. These regions are characterized by strong magnetic fields, and the emergence of new magnetic flux is believed to be one of the main triggers for the release of non-potential free energy in the form of solar flares.
The emergence of new magnetic flux, which can be monitored by the total unsigned magnetic flux and the total unsigned magnetic helicity, is also a well-observed phenomenon and is believed to be one of the mechanisms for the formation of the current sheet where free energy can be used to generate solar flares (Tur and Priest, 1976; Wang and Tang, 1993; Sudol and Harvey, 2005). Additionally, the dynamics of flux cancellation and emergence on the solar surface are confirmed to be important parameters (Hazra et al., 2020).
Figure 2 shows a sequence of the HMI/SDO line-of-sight (LOS) magnetic field of AR13664, highlighting the magnitude and complexity of the magnetic field structure. The total unsigned magnetic flux was found to be approximately double the value previously classified as a flaring region, as analyzed by Hazra et al. (2020). The time evolution of the region’s magnetic flux revealed a 50% oscillation during the period from May 8 to May 10. This significant variability is a strong indicator of high flare activity, which can impact the atmosphere within minutes.
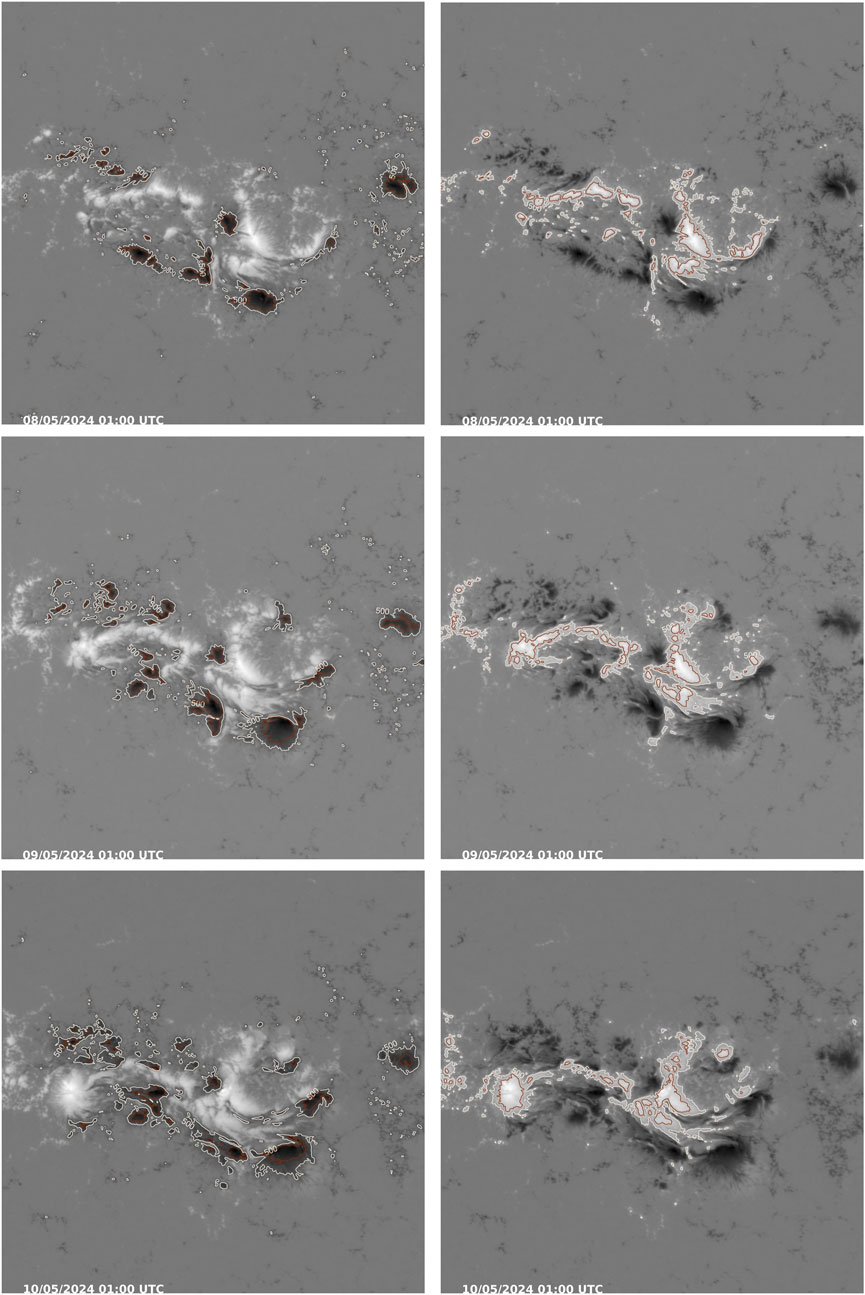
Figure 2. Scenario in the Sun’s Photosphere analyzed through the magnetic flux estimated from the line-of-sight magnetogram data obtained from the Helioseismic Magnetic Imager (HMI) onboard the Solar Dynamics Observatory (SDO).
AR13664 was also unusual in terms of its size. The maximum area of active pixels during its lifetime was 4,394.67 µHem, which is equivalent to 0.0276 of the solar disk surface area (or 2.76%), as measured by SDO/HMI (Jaswal et al., 2024). This is significantly larger than the average area of active regions.
The active region AR13664 sourced seven CME Halo types on May 8-11 (Figure not shown here). The first CME presented a minimum linear speed (530 km/s), which occurred at 5:36 UT on May 8, location S22 W11. The second and third CMEs are also generated on May 8, at 12:24 UT and 22:25 UT, respectively, reaching linear speeds of 677 km/s and 952 km/s, respectively. The fourth CME occurred at 9:24 UT on May 9, presenting a linear speed of 1,280 km/s, and location S20 W24. The fifth and sixth CMEs are generated at S17 W28 and S17 W34, respectively, reaching the linear speed of 1,024 km/s and 953 km/s, respectively. Lastly, the seventh CME Halo type presented a maximum linear speed of 1,614 km/s at 1:36 UT on May 11, with their location S17 W22. The summary of the observed CMEs are presented in (Supplementary Table SA1).
3.2 Interplanetary medium conditions and geomagnetic storm intensity
Figures 3a, b shows a slight increase in both solar wind velocity (Vp) and proton density (Np) close to 14:53 UT on May 10 due to the arrival of the first ICME (vertical black dashed line). On the other hand, the high-density foreshock solar wind (Np ∼ 30 cm-3) (panel b) propagating in the interplanetary medium with a speed of 600 km/s (panel a) reached the Earth’s bowshock around 17:00 UT on May 10. This strong and abrupt increase in Vp (Figure 3a) and Np (Figure 3b) occurs after arrival of the second ICME (vertical red dashed line), which is associated with a shock, causing a direct impact on the Interplanetary Magnetic Field (IMF) (Figures 3c, d). This impact, consequently, starts the initial substantial displacement of the predicted magnetopause standoff distance (panel e), reaching Rmp = ∼ 6RE.
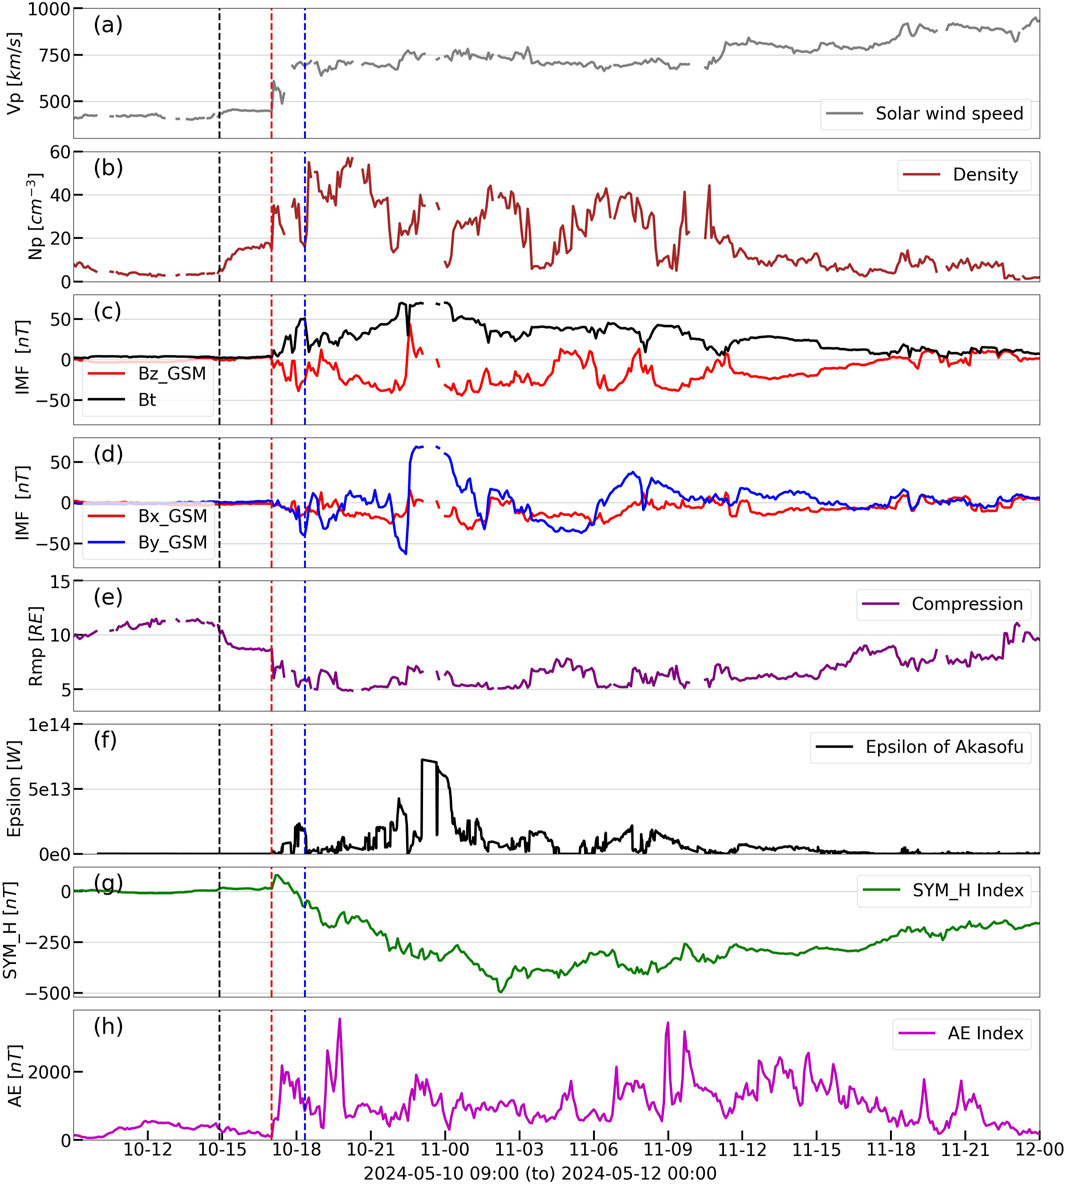
Figure 3. (a) Solar wind proton bulk velocity - Vp; (b) proton density - Np, (c) solar wind magnetic field magnitude - Bt (black line) and magnetic field Bz component (orange line), (d) Bx (red line), and By (blue line), (e) magnetopause standoff distance - Rmp, (f) Epsilon of Akasofu, geomagnetic storm/substorm indices–SYM-H (g), and AE (h). The vertical lines indicate the time of arrival of the first three ICMEs. The first ICME is represented by a black line, the second ICME by a red line, and the third ICME by a blue line.
The energy input for the magnetospheric energy budget is shown in Figure 3f, which is estimated through the calculation of Epsilon of Akasofu that reached = ∼ 1 × 10¹³W (Koskinen and Tanskanen, 2002). This parameter is employed to describe the transfer of solar wind Poynting flux into the magnetosphere, during the influence of substorm and storm timescales (Koskinen and Tanskanen, 2002). Ground-based magnetometers marked the arrival of the solar wind structure with a sudden impulse (SI) of around 80 nT in the SYM-H index, as shown in Figure 3g, indicating the initial phase of the geomagnetic storm. At the same time, the auroral electrojet index shows the onset of a substorm (Figure 3h) that evolves concurrently with the extreme geomagnetic storm main phase through May 10.
The third ICME is also associated with a shock, once the Vp (Figure 3a) and Np (Figure 3b) are concomitantly strong and abrupt close to 18:20 UT on May 10 (vertical blue dashed line), contributing to a considerable predicted increase in the magnetopause compression (Figure 3e), that reached Rmp = ∼ 5RE. This magnetopause compression is followed by the increased energy input for the magnetospheric energy budget, which Epsilon of Akasofu = ∼ 2.5 × 10¹³ W (Figure 3f). Although the high proton density values (>40 cm-3) between 19:00 and 21:00 UT (Figure 3b), coincide with the substorm peak, as indicated by the AE index reaching a remarkable value of 3,600 nT (Figure 3h), this phase corresponds to a lack of energy input into the magnetospheric energy budget, with Epsilon of Akasofu values approximately 0 W (Figure 3F).
The arrival of the first solar wind structures in the magnetosphere causes the increasing Chapman-Ferraro magnetospheric current, shown by ground magnetometers as a sudden impulse (SI) of around 80 nT in the Sym-H index (Figure 3g). The main phase of the geomagnetic storm occurs just after the solar wind ICME flux tube reaches the Earth’s magnetosphere (Figure 3d). The long-lasting south-oriented IMF (Bz ∼ - 25 nT) provides enough conditions for dayside magnetospheric reconnection (see Gonzalez et al., 1994), leading to magnetic flux transport toward the magnetotail; at this region, the increased convection transports magnetospheric plasma from the tail to the dayside magnetosphere, enriching the ring current (related to geomagnetic storm) and Regions 1 and 2 field-aligned currents (related to substorm). The intensification of the ring current has a peak at approximately 02:15 UT on May 11, when the SYM-H reached −497 nT (Figure 3g). Whereas the regions 1 and 2 field-aligned currents are mapped into the ionosphere, leading to the auroral electrojet intensification (see Kepko et al., 2015; Dai et al., 2024), observed in the increasing of the AE index to ∼2,000 nT, alongside the Sym-H main phase evolving. The Kp index (not shown here) reached 8o during the initial phase interval. In this complex space weather event, it is observed that a substorm growth and expansion are concomitant with a geomagnetic storm’s main phase. As a result, during the main phase of the storm, the Kp index increased to 9o, Sym-H peaks at −497 nT, and the AE index reached 3,600 nT, indicating that this was the most intense geomagnetic storm observed in solar cycle 25.
3.3 Inner magnetosphere conditions at the beginning of the storm’s main phase
THEMIS A (THA) and E (THE) satellites measurements captured inner magnetosphere conditions as they crossed the SAMA region, as shown in Figure 1 (blue and red lines). Figure 4 presents THA and THE spacecraft orbits in the XY, XZ, and YZ GSE planes for the period between 12:57 UT and 21:12 UT. Inner radiation belt electron/ion fluxes can be detected when both spacecraft are near their nightside (L-shell ≤2 in Figure 5). On the other hand, the electron/ion fluxes in the outer radiation belt were detected when both spacecraft cross the dayside to nightside and vice-versa (6.5 ≥ L-shell ≥3.5 in Figure 5). Figure 5 presents the mid-energy electron flux (200 keV–700 keV), the low-energy electron flux (10 eV-100 keV), the high-energy ion flux (2 MeV–40 MeV), and the low-energy ion flux (10 eV-100 keV) as the - first, second, third and fourth panels, respectively.
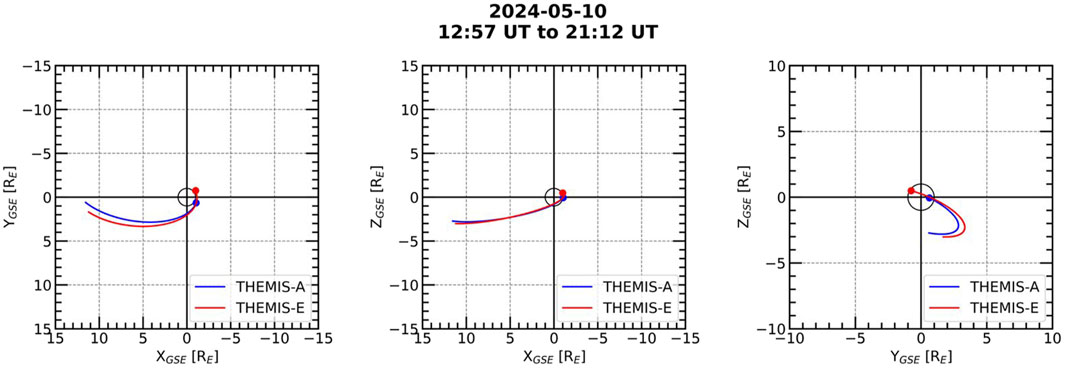
Figure 4. THEMIS A (blue lines) and THEMIS E (red lines) spacecraft orbits in the XY, XZ and YZ GSE planes for the period between 12:57 UT and 21:12 UT on 10 May 2024. Available in: https://sscweb.gsfc.nasa.gov.
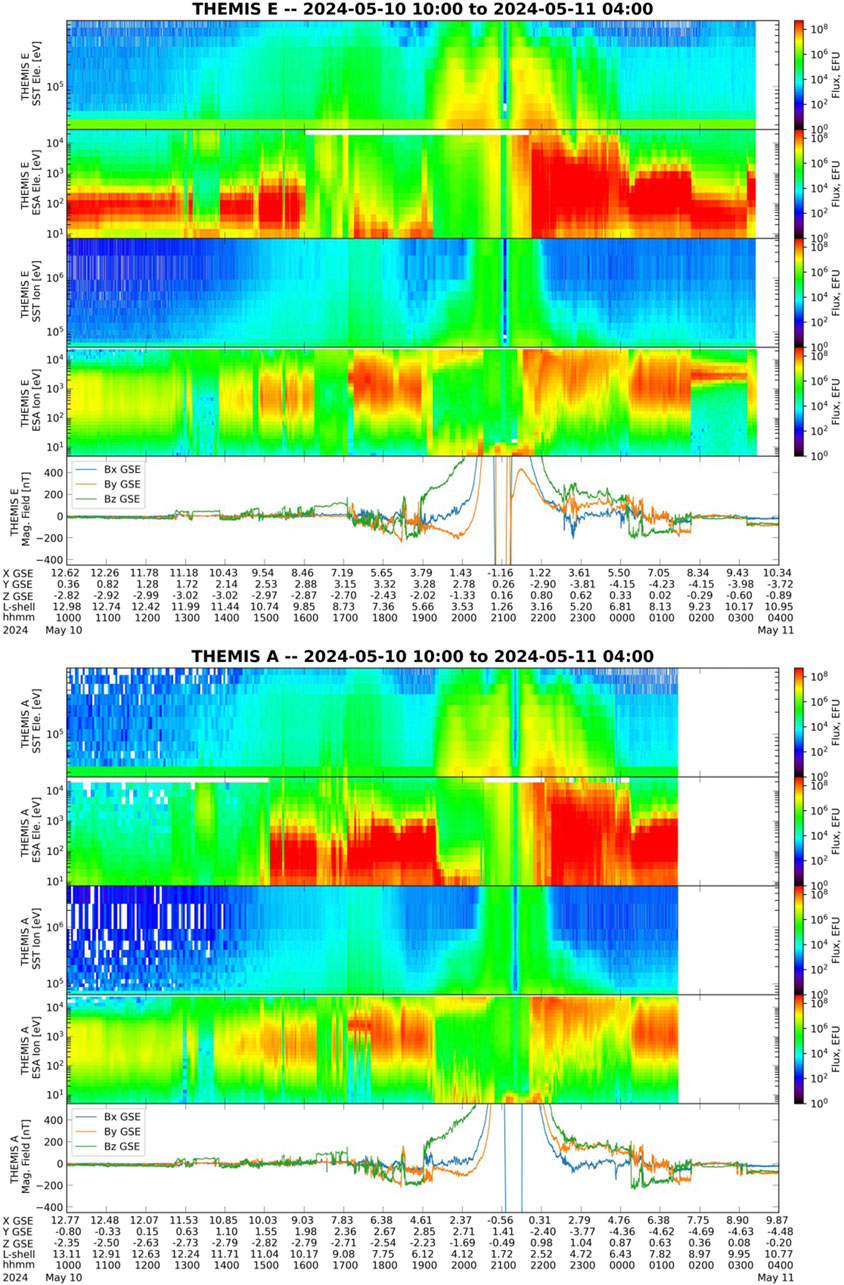
Figure 5. From top to bottom: mid-energy electron flux between 200 keV and 700 keV (first panel); low-energy electron flux between 10 eV and 100 keV (second panel); high-energy ion flux between 2 MeV and 40 MeV (third panel); low-energy ion flux between 10 eV and 100 keV (fourth panel); magnetic field components (Bx, By and Bz) in Geocentric Solar Ecliptic (GSE) coordinates (fifth panel). The x-axis presents the GSE components (x, y, and z), L-shell, and time. The data are obtained from the THEMIS E (top panels) and THEMIS A (bottom panels) spacecraft.
Figure 5 (second and fourth panels) shows that the low-energy electron (10 eV-100 keV) and ion (10 eV-100 keV) fluxes in the inner and outer radiation belt vanish between 19:00 and 21:00 UT (5.66 ≥ L-shell ≥1.26 - THE and 6.12 ≥ L-shell ≥1.72 - THA) when compared with the perigees before the storm (Figure not shown here). This behavior at L-shell ≤2 suggests that these particles could be launched to the loss cone for precipitate into the atmosphere over SAMA through wave-particle resonance interactions (Da Silva et al., 2022; Da Silva et al., 2023). This period coincides with the absence of energy input for the magnetospheric energy budget when the Epsilon of Akasofu is ∼ 0W (see Figure 2f). On the other hand, the low-energy electron (10 eV-100 keV) and ion (10 eV-100 keV) injections close to L-shell ≤2 increase significantly from ∼21:30 UT (Figure 5 - second and fourth panels), contributing to enhancing the ring current in the inner magnetosphere (Bittencourt, 2004). Curiously, these electron/ion injections close to low L-shells occur during a gradual increase of the Epsilon parameter of Akasofu, which reached ∼4 × 10¹³W (see Figure 3f).
The mid-energy electron (200 keV–700 keV) and high-energy ion fluxes (2 MeV–40 MeV) observed in Figure 5 (first and third panels) are representative of the outer boundary of the outer radiation belt between 18:00 and 19:00 UT (7.5 ≥ L-shell ≥5.5), which indicates a clear presence of the trapped relativistic particles (Alves et al., 2016; Da Silva et al., 2021). On the other hand, the outer radiation belt flux after 22:00 UT decreased significantly (Figure 5 - first panel), suggesting the occurrence of the electron flux dropout caused by the magnetopause shadowing mechanism during strong compression of the magnetopause (Alves et al., 2016; Da Silva et al., 2021) that reached ∼ 5RE (see Figure 2e).
The electron flux variability in the inner radiation belt (L-shell ≤2) observed through the THA and THE data suggests the occurrence of EPP over the SAMA region. Therefore, using the EPT/PROBA-V data shown in Supplementary Figure S1, it can be confirmed that electron precipitation (hundreds of keV) was significantly enhanced over the SAMA region during the influence of this extreme storm, as also noted by Pierrard et al. (2024).
3.4 Particle precipitation effect observed in the ionized atmosphere over SAMA
The EPP is one of the major coupling mechanisms between the solar wind and Earth’s magnetosphere-atmosphere, capable of causing disturbances in the ionized atmosphere over both the auroral (Nath et al., 1980; Pettit et al., 2023) and SAMA regions (Santos et al., 2016; Resende et al., 2022b; Moro et al., 2022; Da Silva et al., 2022; Da Silva et al., 2023). The impacts in the auroral regions are well understood, principally due to the wide observational measurements in situ. Conversely, over the SAMA region, the proton contamination limits the use of the electron detectors onboard low-orbit satellites (Rodger et al., 2013). However, using the ground-based network data from instruments such as Digisonde and all-sky image, it is possible to identify the EPP signatures in the ionosphere over this low latitude region during the main phase of the extreme geomagnetic storm that occurred on May 10-11, 2024.
The first EPP signature in the ionized atmosphere is presented through the atypical behavior of the EPBs detected over Cachoeira Paulista, as observed in a sequence of the OI 630.0-nm emission all-sky images (Figure 6). This EPB, notably, exhibited an unusual behavior related to its propagation direction, which drifted westward (indicated by red arrows) rather than the typical eastward movement. EPBs are field-aligned irregularities generated when low-density plasma in the inner boundary of the ionospheric F-region is displaced to higher altitudes, due to the Rayleigh-Taylor plasma Instability (RTI), which typically occurs near the magnetic equator (Woodman and La Hoz, 1976; Yokoyama, 2017). In other words, the pre-reversal enhancement of the zonal electric field/vertical plasma drift (PRE) during sunset triggers the instability responsible for generating EPBs. In this magnetic storm studied here, Carmo et al. (2024) classified the EPB formed over the American sector as Super EPB, suggesting that prompt penetration electric fields (PPEF) played a role in intensifying the PRE, which in turn triggered a strong RTI.
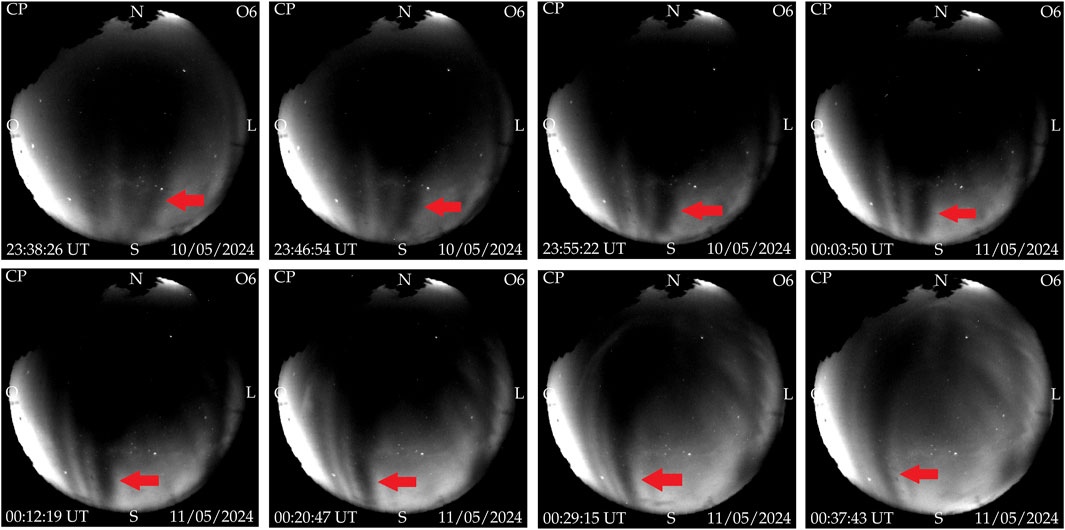
Figure 6. Sequence of All-Sky Imager (ASI) images from 23:38 UT to 00:37 UT on 11 May 2024, captured in Cachoeira Paulista, showing the westward movement of the super EPB (red arrows).
Figure 7 illustrates that the peak height of the F2-layer (red curve) over São Luís, a region near the magnetic equator, presented abrupt changes on the night of May 10-11 compared to the quiet time reference day (blue curve), mainly during and after the PRE occurrence. This intense uplift of the F-layer/PRE appears to be caused by an eastward PPEF associated with a southward IMF Bz (∼−40 nT at ∼ 21:00 UT in Figure 3). This is an explanation of why the EPB, which presented a duration of ∼12 h (from 22:30 UT to 10:30 UT), reached an apex height of approximately 4,500 km, as reported by Carmo et al. (2024).
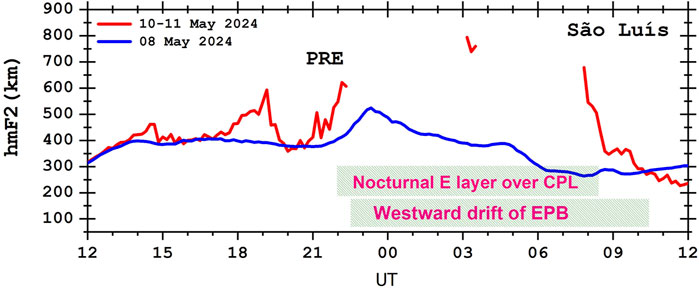
Figure 7. Peak height of the F2-layer over São Luís during 10–11 May 2024 (red curve). The blue curve indicates the quiet time reference day (8 May 2024). A nocturnal E layer was registered over CLP, during the changes in the drift of the equatorial plasma bubble detected over Cachoeira Paulista.
The unusual westward movement of EPB over the SAMA region remains a topic of ongoing discussion in the scientific community. Two potential physical mechanisms may be working together to explain this atypical behavior. One is the disturbance of dynamo-associated westward thermospheric wind (Li et al., 2009; Sau et al., 2017; Carmo et al., 2024), since it was observed an intense auroral activity in the times that preceded the onset of the zonal drift variations (see AE index in the last panel from Figure 3). This partially can have contributed to driving the changes in zonal drift.
Another possible physical mechanism is the vertical Hall electric field induced by a PPEF in the presence of an increase in the E region conductivity (Abdu et al., 2003; Santos et al., 2016). This increase in the conductivity, which started some minutes before EPB moved to the west (gray bars in Figure 7) can be attributed to the additional ionization caused by EPP over the SAMA region. As a result, the typical movement of the EPB was modified. In other words, the extra ionization from EPP in the lower ionosphere (E region) significantly increased the field line-integrated conductivities, particularly the Hall conductivity in the SAMA region, and contributed to the EPB’s westward drift.
To clarify the role of EPP in this event, Figure 8 shows the nocturnal E region presence at 2350 UT (1750 LT) in ionograms at different stations over the Brazilian regions, (a) Cachoeira Paulista, (b) Campo Grande, and (c) São Luís. Additionally, we include data from a station located far from the SAMA region, namely (d) Austin in Texas, United States. It is noteworthy that in Austin, the nocturnal E region is absent, which is consistent with typical behavior. In fact, as demonstrated by Moro et al. (2019), the E region is not detected in ionosonde data after sunset due to the reduced electron density. Therefore, the E region occurring in the nighttime confirms that the enhanced ionization is localized specifically within the SAMA region during particularly intense geomagnetic storms.
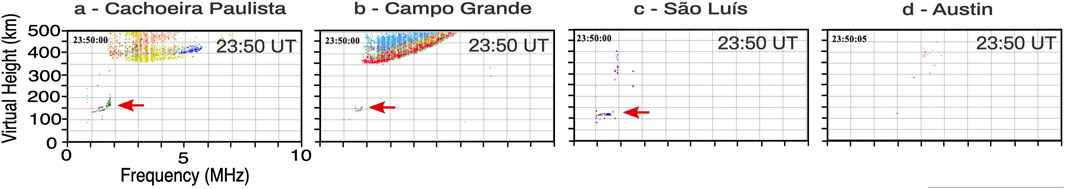
Figure 8. Ionograms sequence over Cachoeria Paulista (a), Campo Grande (b), São Luís (c) on 10 May 2024 showing the presence of a nocturnal E layer. In contrast, the Austin station (d), located far from the SAMA, does not exhibit the nighttime E region.
The nighttime E region is observed over stations located near the SAMA’s center, Cachoeira Paulista and Campo Grande, as shown in Figures 8a, b. Interestingly, the nocturnal E region was also detected in São Luís (Figure 8c), a location quite far from the center of the SAMA. This suggests that the magnetic storm was intense enough to induce particle precipitation in more areas distant from the SAMA center (see Figure 1). The consequence of this extra ionization generated by EPP is an increase in the ratio of field line-integrated Hall to Pedersen conductivities, ΣH/ΣP. This change probably modified the vertical electric field and consequently contributed to the EPB’s westward on the nighttime of May 10-11, similar to what was reported by Santos et al. (2016).
The most plausible explanation is that EPP during the main phase of the magnetic storm, through collisional processes and pitch angle scattering driven by hiss waves (Da Silva et al., 2022; Da Silva et al., 2023), leads to the interaction of low-energy electrons (< tens keV) from the inner radiation belt with the atmosphere in the SAMA region. Over the SAMA, the mirror point reaches a low altitude (Roederer, 1970), which facilitates the collisional processes and particle precipitation through the pitch angle scattering mechanism. The evidence of the EPP is observed by PROBA-V data, which illustrates the significant increase in EPP (500–600 keV) over the SAMA region during this event, and by THEMIS data, which shows the local loss of the low-energy electron (10 eV-100 keV) in the inner belt suggesting enhanced of low-energy electron flux precipitation over the SAMA region.
3.5 Particle precipitation effect observed in the neutral atmosphere over SAMA
EPP also affects the neutral atmosphere, altering mesosphere/stratosphere composition with potential climate impacts. EPP increases the ionization rate and molecules’ dissociation, producing odd nitrogen (NOx) and odd hydrogen (HOx) in the upper neutral atmosphere that can interfere with ozone chemistry (Callis et al., 1991; Sun et al., 2024). This impact of EPP on atmospheric composition and ozone has been validated by observations (e.g., Newnham et al., 2020; Sinnhuber et al., 2016; Randall et al., 2006) as well as through 3D chemistry-climate models (e.g., Rozanov et al., 2012; Verronen et al., 2016; Sinnhuber et al., 2018) that consider EPP-induced ionization. During geomagnetic storms, such as this observed on May 10-11, 2024, particle precipitation, particularly electrons, is commonly seen at high latitudes (e.g., Frolov and Troitsky, 2023). Due to its weaker magnetic field strength, the SAMA is thus more sensitive to EPP events, making it a hotspot for the impacts of geomagnetic storms on atmospheric chemistry, including processes like ozone depletion (Clilverd et al., 2016; Da Silva et al., 2016).
The TIMED/SABER instrument provided ozone mixing ratio data, which was used to analyze the ozone response to EPP during the influence of the geomagnetic storm over the SAMA region. A grid of 10° on latitude and 20° on longitude is considered, from 30° S to 20° S and 40° W to 60° W. Moreover, 4 days of data are taken, considering 1 day before and 1 day after the interplanetary structure reaches the Earth’s magnetosphere. Thus, 20 events were measured inside the defined grid and time scale with the details about the events shown in (Supplementary Table SA2). By integrating the TIMED/SABER data, this work considers stratospheric ozone within the altitude range of 20 km–80 km, while the mesospheric total ozone mixing ratio is considered from 80 km to 100 km. After the integration, the averaged of the data on each respective day for all measurements into that grid are applied, which is called the daily mean over the SAMA.
Figure 9 (panels a, and b) and SM2 (Supplementary Material 2) show the significant and abrupt reduction of around 15% in the daily total ozone between 80 km and 100 km on 11 May 2024 (main phase of the magnetic storm), compared to May 9 and 10 (days before the magnetic storm). During the storm’s main phase, the occurrence of Coulomb collisions between EPP and the storm-enhanced neutral oxygen atoms was expected, as demonstrated by Dachev (2018). This process should be followed by the production of NOx and HOx, which are highly efficient in catalyzing ozone destruction in the mesosphere during geomagnetic storms (Brown, 1966; Newnham et al., 2020; Tartaglione et al., 2020; Mironova et al., 2022; Frolov and Troitsky, 2023). It is important to emphasize that the slight increase in stratospheric O3 observed starting on 12 May 2024, is likely associated with the arrival of a new ICME at Earth during the long recovery phase of the extreme storm. Furthermore, the reduced number of TIMED/SABER passes over the selected region on May 12, compared to other days shown in Figure 9 (panels a, and b), may contribute to unreliable fluctuations in the data.
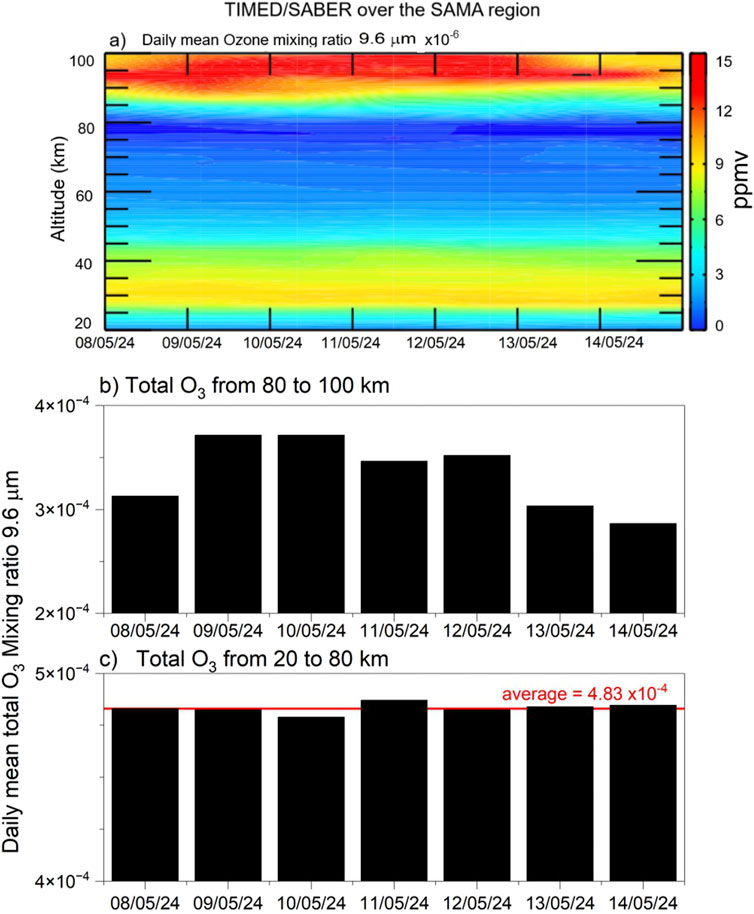
Figure 9. Ozone mixing ratio over the SAMA region in 2D, altitude by time range (a), and ozone mixing ratio over the SAMA region integrated into the altitude from 80 to 100 km (b) and from 20 to 80 km (c). The horizontal red line in panel c indicates the mean value across the observed days. The grid is 10° on latitude and 20° on longitude, from 30°S to 20°S and 40°W to 60°W. The TIMED/SABER instrument provides this data. Regarding the presence of zero values in the ozone mixing ratio, this feature arises from the inherent limitations of the SABER instrument retrievals at certain altitudes (e.g. Rong et al., 2009).
During the recovery phase of the storm, precisely on May 13 and 14, Figure 9 (panels a, and b) and SM2 show that the ozone depletion between 80 km and 100 km (mesosphere is included) is more pronounced compared to the storm’s main phase. This behavior indicates an increased EPP on May 13 and 14, as observed in Supplementary Figure S1 and shown by Pierrard et al. (2025) for the same event, which consequently suggests a production increase of NOx and HOx that catalytically causes ozone destruction more efficiently in the thermosphere and mesosphere (e.g., Sinnhuber et al., 2012; Vampola and Gorney, 1983). The ozone depletion process leads to increased mesospheric cooling in the temperature-dependent reactions and vertical transport. The enhanced vertical transport can carry more NOx from the thermosphere down into the mesosphere, further depleting ozone.
The ozone depletion observed between 80 km and 100 km in Figure 9 (panels a and b) and SM2 (Supplementary Material 2) on May 8 may be associated with a different solar wind structure that reached the L1 Lagrangian point between May 5 and 6, which is outside the scope of this study. For more details, please refer to the proton density and solar wind velocity data at https://www2.inpe.br/climaespacial/portal/swd-perfis-temporais/.
The stratospheric ozone over SAMA, included from 20 to 80 km, is presented in Figure 9 (panels a, and c). The slow and gradual ozone variation during the influence of this extreme storm is observed. The ozone depletion reached only ∼2% on 10 May 2024 (red line in Figure 9c), suggesting that it could be associated with solar flares and SEPs that reach the Earth’s magnetosphere a few minutes after being generated at the solar corona (see Frolov and Troitsky, 2023). Gradual ozone depletion in the stratosphere was also expected since the transference of NOx and HOx through vertical transport is not as efficient over the SAMA region when compared to the auroral regions, in which decedent vertical transport is governed by the polar vortex and meridional circulation (Randall et al., 2005; 2007; Turunen et al., 2009; Sinnhuber and Funke, 2020). In this case, over the SAMA region, the NOx and HOx were produced in situ in the stratosphere (see Randall et al., 2007), which requires electrons of hundreds of keV precipitating from the inner radiation belt, and thus happens in minor quantities.
4 Concluding remarks
On 10 May 2024, the interaction between multiple ICMEs in the solar wind and Earth’s magnetosphere resulted in the most powerful geomagnetic storm since March 1989. This event demonstrated a significant transfer of solar wind Poynting flux into the magnetosphere during the storm’s main phase. During this period, space weather disturbances in the atmosphere over the South Atlantic Magnetic Anomaly (SAMA) region were analyzed, particularly as THA and THE satellites crossed this region at perigee. Variability in electron and ion flux within the inner radiation belt was observed, indicating the occurrence of energetic particle precipitation (EPP) in the atmosphere over SAMA. During the storm’s main phase on May 10, between 19:00 and 21:00 UT, there was a decrease in low-energy electron and ion fluxes in the inner radiation belt, followed by an increase (injections) from 22:00 UT. This suggests that particle precipitation into the atmosphere over SAMA led to additional ionization in the neutral-ionized atmosphere. This phenomenon was evidenced by sudden and gradual ozone depletion in the mesosphere and stratosphere, respectively, westward propagation of plasma bubbles, and the detection of a nocturnal E region in this low-latitude area. Finally, based on the data showing the atypical behavior of both the neutral and ionized atmosphere, along with satellite data indicating significant particle input, as well as existing EPP theory related to SAMA (Batista and Abdu, 1977; Abdu et al., 2005; Moro et al., 2022; Resende et al., 2024), it is evident that particles interacted in this anomalous region.
Data availability statement
The datasets presented in this study can be found in online repositories. The names of the repository/repositories and accession number(s) can be found in the article/Supplementary Material.
Author contributions
LD: Conceptualization, Data curation, Formal Analysis, Investigation, Methodology, Project administration, Supervision, Writing – original draft, Writing – review and editing. JS: Methodology, Visualization, Writing – review and editing. LA: Methodology, Supervision, Visualization, Writing – review and editing. LR: Conceptualization, Data curation, Formal Analysis, Methodology, Writing – review and editing. LV: Conceptualization, Formal Analysis, Methodology, Writing – review and editing. JR: Conceptualization, Formal Analysis, Methodology, Writing – review and editing. JMa: Software, Writing – review and editing. OA: Conceptualization, Data curation, Formal Analysis, Investigation, Methodology, Supervision, Writing – review and editing. DS: Conceptualization, Data curation, Formal Analysis, Investigation, Methodology, Supervision, Writing – review and editing. AS: Conceptualization, Formal Analysis, Investigation, Methodology, Writing – review and editing. VA: Conceptualization, Data curation, Formal Analysis, Investigation, Writing – review and editing. PJ: Data curation, Formal Analysis, Methodology, Writing – review and editing. VD: Data curation, Software, Writing – review and editing. CC: Data curation, Formal Analysis, Software, Writing – review and editing. PN: Formal Analysis, Writing – review and editing. SC: Data curation, Software, Writing – review and editing. TA: Data curation, Formal Analysis, Writing – review and editing. KF: Data curation, Investigation, Writing – review and editing. JMo: Data curation, Formal Analysis, Writing – review and editing. CW: Writing – review and editing. HL: Writing – review and editing. ZL: Writing – review and editing.
Funding
The author(s) declare that financial support was received for the research and/or publication of this article. LD, LR, VA, AS, PJ, and JM are grateful for financial support from China-Brazil Joint Laboratory for Space Weather (CBJLSW), National Space Science Center (NSSC) and the Chinese Academy of Science (CAS). This work was supported by the International Partnership Program of the Chinese Academy of Sciences (grants 183311KYSB20200003 and 183311KYSB20200017). LV thanks CNPq/MCTI (Grant 422776/2021-1), TED-004/2020-AEB and PO-20VB.0009. LA thanks CNPq/MCTI (Grant 301476/2018-7). LS thanks CNPq/MCTI (Grant 312906/2023-4). SC thanks CNPq/MCTI (Grant 172834/2023-6). OA was supported by NASA grants 80NSSC22K0522, 80NNSC19K0264, and 80NSSC20K0218.
Acknowledgments
We also thank the Brazilian Ministry of Science, Technology, and Innovation (MCTI), the Brazilian Space Agency (AEB), the Space Weather Division (DICEP) and the National Institute for Space Research (INPE).
Conflict of interest
The authors declare that the research was conducted in the absence of any commercial or financial relationships that could be construed as a potential conflict of interest.
The author(s) declared that they were an editorial board member of Frontiers, at the time of submission. This had no impact on the peer review process and the final decision.
Generative AI statement
The author(s) declare that no Generative AI was used in the creation of this manuscript.
Publisher’s note
All claims expressed in this article are solely those of the authors and do not necessarily represent those of their affiliated organizations, or those of the publisher, the editors and the reviewers. Any product that may be evaluated in this article, or claim that may be made by its manufacturer, is not guaranteed or endorsed by the publisher.
Supplementary material
The Supplementary Material for this article can be found online at: https://www.frontiersin.org/articles/10.3389/fspas.2025.1550635/full#supplementary-material
References
Abdu, M. A., Batista, I. S., Carrasco, A. J., and Brum, C. G. M. (2005). South Atlantic magnetic anomaly ionization: a review and a new focus on electrodynamic effects in the equatorial ionosphere. J. Atmos. Solar-Terrestrial Phys. 67 (17–18), 1643–1657. doi:10.1016/j.jastp.2005.01.014
Abdu, M. A., MacDougall, J. W., Batista, I. S., Sobral, J. H. A., and Jayachandran, P. T. (2003). Equatorial evening prereversal electric field enhancement and sporadic E layer disruption: a manifestation of E and F region coupling. J. Geophys. Res. Space Phys. 108 (A6), 1254. doi:10.1029/2002JA009285
Abdu, M. A., Souza, J. R., Batista, I. S., Fejer, B. G., and Sobral, J. H. A. (2013). Sporadic E layer development and disruption at low latitudes by prompt penetration electric fields during magnetic storms. J. Geophys. Res. Space Phys. 118 (5), 2639–2647. doi:10.1002/jgra.50271
Akasofu, S.-I. (1979). Interplanetary energy flux associated with magnetospheric substorms. Planet. Space Sci. 27 (4), 425–431. doi:10.1016/0032-0633(79)90119-3
Akasofu, S.-I. (1981). Energy coupling between the solar wind and the magnetosphere. Space Sci. Rev. 28 (2), 121–190. doi:10.1007/BF00218810
Alves, L. R., Da Silva, L. A., Souza, V. M., Sibeck, D. G., Jauer, P. R., Vieira, L. E. A., et al. (2016). Outer radiation belt dropout dynamics following the arrival of two interplanetary coronal mass ejections. Geophys. Res. Lett. 43 (3), 978–987. doi:10.1002/2015GL067066
Andrioli, V. F., Xu, J., Batista, P. P., Resende, L. C. A., da Silva, L. A., Pimenta, A. A., et al. (2024). Peculiar enhancement in the neutral K and Na layers observed during atypical E-region event in the South American magnetic anomaly (SAMA) region. Front. Astronomy Space Sci. 11. doi:10.3389/fspas.2024.1458148
Angelopoulos, V. (2008). The THEMIS mission. Space Sci. Rev. 141 (1–4), 5–34. doi:10.1007/s11214-008-9336-1
Auster, H. U., Glassmeier, K. H., Magnes, W., Aydogar, O., Baumjohann, W., Constantinescu, D., et al. (2008). The THEMIS fluxgate magnetometer. Space Sci. Rev. 141 (1–4), 235–264. doi:10.1007/s11214-008-9365-9
Baker, D. N., Erickson, P. J., Fennell, J. F., Foster, J. C., Jaynes, A. N., and Verronen, P. T. (2018). Space weather effects in the Earth’s radiation belts. Space Sci. Rev. 214, 17. doi:10.1007/s11214-017-0452-7
Baker, D. N., Hoxie, V. C., Batiste, S., Bolton, M., Li, X., Elkington, S. R., et al. (2013). The relativistic electron-proton telescope (REPT) instrument on board the Radiation Belt Storm Probes (RBSP) spacecraft: characterization of Earth's Radiation belt high-energy particle populations. Space Sci. Rev. 179 (1–4), 337–381. doi:10.1007/s11214-012-9950-9
Batista, I. S., and Abdu, M. A. (1977). Magnetic storm associated delayed sporadic E enhancements in the Brazilian Geomagnetic Anomaly. J. Geophys. Res. Space Phys. 82 (29), 4777–4783. doi:10.1029/JA082i029p04777
Bittencourt, J. A. (2004). Fundamentals of plasma physics. 3rd ed. Pergamon Press. doi:10.1007/978-1-4757-4030-1
Borovsky, J. E. (2018). The spatial structure of the oncoming solar wind at Earth and the shortcomings of a solar-wind monitor at L1. J. Atmos. Solar-Terrestrial Phys. 177, 2–11. doi:10.1016/j.jastp.2017.03.014
Borovsky, J. E., and Yakymenko, K. (2017). Substorm occurrence rates, substorm recurrence times, and solar wind structure. J. Geophys. Res. Space Phys. 122 (3), 2973–2998. doi:10.1002/2016JA023625
Brown, R. R. (1966). Electron precipitation in the auroral zone. Space Sci. Rev. 5 (3), 311–387. doi:10.1007/bf02653249
Cai, H.-T., and Ma, S.-Y. (2007). Initial study of inversion method for estimating energy spectra of auroral precipitating particles from ground-based is radar observations. Chin. J. Geophys. 50 (1), 12–21. doi:10.1002/cjg2.1005
Callis, L. B., Baker, D. N., Blake, J. B., Lambeth, J. D., Boughner, R. E., Natarajan, M., et al. (1991). Precipitating relativistic electrons: their long-term effect on stratospheric odd nitrogen levels. J. Geophys. Res. Atmos. 96 (D2), 2939–2976. doi:10.1029/90JD02184
Carmo, C. S., Dai, L., Wrasse, C. M., Barros, D., Takahashi, H., Figueiredo, C. A. O. B., et al. (2024). Ionospheric response to the extreme 2024 mother’s day geomagnetic storm over the Latin American sector. Space weather. 22 (12). doi:10.1029/2024SW004054
Clilverd, M. A., Rodger, C. J., Andersson, M. E., Seppälä, A., and Verronen, P. T. (2016). “Linkages between the radiation belts, polar atmosphere and climate: electron precipitation through wave particle interactions,” in Waves, particles, and storms in geospace: a complex interplay. Editors G. Balasis, I. A. Daglis, and I. R. Mann (Oxford University Press), 354–376. doi:10.1093/acprof:oso/9780198705246.003.0015
Cyamukungu, M., Benck, S., Borisov, S., Grégoire, G., Cabrera, J., Bonnet, J. L., et al. (2014). The Energetic Particle Telescope (EPT) on board PROBA-V: description of a new science-class instrument for particle detection in space. IEEE Trans. Nucl. Sci. 61, 3667–3681. doi:10.1109/tns.2014.2361955
Cyamukungu, M., and Grégoire, G. (2011). The energetic particle telescope (EPT) concept and performances. Sol. Phys. Space Weather Instrum. IV. doi:10.1117/12.892420
Dachev, T. P. (2018). South-atlantic anomaly magnetic storms effects as observed outside the international space station in 2008–2016. J. Atmos. Solar-Terrestrial Phys. 179, 251–260. doi:10.1016/j.jastp.2018.08.009
Dai, L., Zhu, M., Ren, Y., Gonzalez, W., Wang, C., Sibeck, D., et al. (2024). Global-scale magnetosphere convection driven by dayside magnetic reconnection. Nat. Commun. 15, 639. doi:10.1038/s41467-024-44992-y
Da Silva, L. A., Satyamurty, P., Alves, L. R., Souza, V. M., Jauer, P. R., Silveira, M. V. D., et al. (2016). Comparison of geophysical patterns in the southern hemisphere mid-latitude region. Adv. Space Res. 58 (10), 2090–2103. doi:10.1016/j.asr.2016.04.003
Da Silva, L. A., Shi, J., Alves, L. R., Sibeck, D., Souza, V. M., Marchezi, J. P., et al. (2021). Dynamic mechanisms associated with high-energy electron flux dropout in the Earth’s outer radiation belt under the influence of a coronal mass ejection sheath region. J. Geophys. Res. Space Phys. 126 (1). doi:10.1029/2020JA028492
Da Silva, L. A., Shi, J., Resende, L. C. A., Agapitov, O. v., Alves, L. R., Batista, I. S., et al. (2022). The role of the inner radiation belt dynamic in the generation of auroral-type sporadic E-layers over South American Magnetic Anomaly. Front. Astronomy Space Sci. 9. doi:10.3389/fspas.2022.970308
Da Silva, L. A., Shi, J., Vieira, L. E., Agapitov, O. v., Resende, L. C. A., Alves, L. R., et al. (2023). Why can the auroral-type sporadic E layer be detected over the South America Magnetic Anomaly (SAMA) region? An investigation of a case study under the influence of the high-speed solar wind stream. Front. Astronomy Space Sci. 10. doi:10.3389/fspas.2023.1197430
Echer, E., Gonzalez, W. D., and Tsurutani, B. T. (2008). Interplanetary conditions leading to superintense geomagnetic storms (Dst ≤ −250 nT) during solar cycle 23. Geophys. Res. Lett. 35 (6). doi:10.1029/2007GL031755
Frolov, V. L., and Troitsky, A. V. (2023). HF-induced artificial injection of energetic electrons from the Earth’s radiation belt as a powerful source for modification of ionized and neutral components of the Earth’s atmosphere. Atmosphere 14 (5), 843. doi:10.3390/atmos14050843
Gonzalez, W. D., Echer, E., Clua-Gonzalez, A. L., and Tsurutani, B. T. (2007). Interplanetary origin of intense geomagnetic storms (Dst < −100 nT) during solar cycle 23. Geophys. Res. Lett. 34 (6). doi:10.1029/2006GL028879
Gonzalez, W. D., Echer, E., Tsurutani, B. T., Clúa de Gonzalez, A. L., and Dal Lago, A. (2011). Interplanetary origin of intense, superintense and extreme geomagnetic storms. Space Sci. Rev. 158, 69–89. doi:10.1007/s11214-010-9715-2
Gonzalez, W. D., Joselyn, J. A., Kamide, Y., Kroehl, H. W., Rostoker, G., Tsurutani, B. T., et al. (1994). What is a geomagnetic storm? J. Geophys. Res. 99 (A4), 5771–5792. doi:10.1029/93JA02867
Hazra, S., Sardar, G., and Chowdhury, P. (2020). Distinguishing between flaring and nonflaring active regions. Astronomy and Astrophysics 639, A44. doi:10.1051/0004-6361/201937426
Jaswal, R., and Sinha, S.Nandy (2024). Deconstructing solar super active region 13664 in the context of the historic geomagnetic storm of 2024 may 10-11. Astrophysical J. (APJ). doi:10.48550/arXiv.2409.14752
Kepko, L., McPherron, R. L., Amm, O., Apatenkov, S., Baumjohann, W., Birn, J., et al. (2015). Substorm current wedge revisited. Space Sci. Rev. 190, 1–46. doi:10.1007/s11214-014-0124-9
Koskinen, H. E. J., and Tanskanen, E. I. (2002). Magnetospheric energy budget and the epsilon parameter. J. Geophys. Res. Space Phys. 107 (A11). doi:10.1029/2002JA009283
Li, G., Ning, B., Zhao, B., Liu, L., Wan, W., Ding, F., et al. (2009). Characterizing the 10 November 2004 storm-time middle-latitude plasma bubble event in Southeast Asia using multi-instrument observations. J. Geophys. Res. Space Phys. 114 (A7). doi:10.1029/2009JA014057
McFadden, J. P., Carlson, C. W., Larson, D., Ludlam, M., Abiad, R., Elliott, B., et al. (2008). The themis esa plasma instrument and in-flight calibration. Space Sci. Rev. 141 (1–4), 277–302. doi:10.1007/s11214-008-9440-2
McIntosh, P. S. (1990). The classification of sunspot groups. Sol. Phys. 125 (2), 251–267. doi:10.1007/BF00158405
Mironova, I., Sinnhuber, M., Bazilevskaya, G., Clilverd, M., Funke, B., Makhmutov, V., et al. (2022). Exceptional middle latitude electron precipitation detected by balloon observations: implications for atmospheric composition. Atmos. Chem. Phys. 22, 6703–6716. doi:10.5194/acp-22-6703-2022
Moon, K. R., Delouille, V., Li, J. J., de Visscher, R., Watson, F., and Hero, A. O. (2016). Image patch analysis of sunspots and active regions. J. Space Weather Space Clim. 6, A3. doi:10.1051/swsc/2015043
Moro, J., Xu, J., Denardini, C. M., Resende, L. C. A., da Silva, L. A., Chen, S. S., et al. (2022). Different sporadic-E (Es) layer types development during the august 2018 geomagnetic storm: evidence of auroral type (Es a) over the SAMA region. J. Geophys. Res. Space Phys. 127 (2). doi:10.1029/2021JA029701
Moro, J., Xu, J., Denardini, C. M., Resende, L. C. A., Silva, R. P., Liu, Z., et al. (2019). On the sources of the ionospheric variability in the South American Magnetic Anomaly during solar minimum. J. Geophys. Res. Space Phys. 124, 7638–7653. doi:10.1029/2019JA026780
Nath, N., Steen Mikkelsen, I., and Stockflet Jørgensen, T. (1980). On the formation of high latitude Es-layers. J. Atmos. Terr. Phys. 42 (9–10), 841–852. doi:10.1016/0021-9169(80)90088-4
Newnham, D. A., Rodger, C. J., Marsh, D. R., Hervig, M. E., and Clilverd, M. A. (2020). Spatial distributions of nitric oxide in the antarctic wintertime middle atmosphere during geomagnetic storms. J. Geophys. Res. Space Phys. 125 (7). doi:10.1029/2020JA027846
Ogilvie, K. W., Chornay, D. J., Fritzenreiter, R. J., Hunsaker, F., Keller, J., Lobell, J., et al. (1995). SWE, a comprehensive plasma instrument for the WIND spacecraft. Space Sci. Rev. 71 (1–4), 55–77. doi:10.1007/BF00751326
Parihar, V. K., Allen, B. D., Caressi, C., Kwok, S., Chu, E., Tran, K. K., et al. (2016). Cosmic radiation exposure and persistent cognitive dysfunction. Sci. Rep. 6 (1), 34774. doi:10.1038/srep34774
Perreault, P., and Akasofu, S.-I. (1978). A study of geomagnetic storms. Geophys. J. Int. 54 (3), 547–573. doi:10.1111/j.1365-246X.1978.tb05494.x
Pettit, J., Elliott, S., Randall, C., Halford, A., Jaynes, A., and Garcia-Sage, K. (2023). Investigation of the drivers and atmospheric impacts of energetic electron precipitation. Front. Astronomy Space Sci. 10. doi:10.3389/fspas.2023.1162564
Pierrard, V., Bolsée, D., Winant, A., Al-Qaaod, A., Krasniqi, F., Bonhome, M. P., et al. (2025). BIOSPHERE measurement campaign from January 2024 to March2024 and in May 2024: effects of the solar events on the radiation belts,UV radiation and ozone in the atmosphereAIMS. Geosciences 11 (1), 117–154. doi:10.3934/geosci.2025007
Pierrard, V., Lopez Rosson, G., Borremans, K., Lemaire, J., Maes, J., Bonnewijn, S., et al. (2014). The energetic particle telescope: first results. Space Sci. Rev. 184, 87–106. doi:10.1007/s11214-014-0097-8
Pierrard, V., Winant, A., Botek, E., and Péters de Bonhome, M. (2024). The mother’s day solar storm of 11 may 2024 and its effect on Earth’s radiation belts. Universe 10, 391. doi:10.3390/universe/10100391
Ponomarev, E. A., Sedykh, P. A., and Urbanovich, V. D. (2006). Bow shock as a power source for magnetospheric processes. J. Atmos. Solar-Terrestrial Phys. 68 (6), 685–690. doi:10.1016/j.jastp.2005.11.007
Randall, C. E., Harvey, V. L., Manney, G. L., Orsolini, Y., Codrescu, M., Sioris, C., et al. (2005). Stratospheric effects of energetic particle precipitation in 2003–2004. Geophys. Res. Lett. 32 (5). doi:10.1029/2004GL022003
Randall, C. E., Harvey, V. L., Singleton, C. S., Bailey, S. M., Bernath, P. F., Codrescu, M., et al. (2007). Energetic particle precipitation effects on the Southern Hemisphere stratosphere in 1992–2005. J. Geophys. Res. Atmos. 112 (D8). doi:10.1029/2006JD007696
Randall, C. E., Harvey, V. L., Singleton, C. S., Bernath, P. F., Boone, C. D., and Kozyra, J. U. (2006). Enhanced NOx in 2006 linked to strong upper stratospheric Arctic vortex. Geophys. Res. Lett. 33, L18811. doi:10.1029/2006GL027160
Reddmann, T., Sinnhuber, M., Wissing, J. M., Yakovchuk, O., and Usoskin, I. (2023). The impact of an extreme solar event on the middle atmosphere: a case study. Atmos. Chem. Phys. 23 (12), 6989–7000. doi:10.5194/acp-23-6989-2023
Reinisch, B. W., Galkin, I. A., Khmyrov, G. M., Kozlov, A. V., Bibl, K., Lisysyan, I. A., et al. (2009). New Digisonde for research and monitoring applications. Radio Sci. 44, RS0A24. doi:10.1029/2008RS004115
Resende, L. C. A., Zhu, Y., Arras, C., Denardini, C. M., Chen, S. S., Moro, J., et al. (2022b). Analysis of the sporadic-E layer behavior in different American stations during the days around the september 2017 geomagnetic storm. Atmosphere 13 (10), 1714. doi:10.3390/atmos13101714
Resende, L. C. A., Zhu, Y., Denardini, C. M., Moro, J., Da Silva, L. A., Arras, C., et al. (2022a). Worldwide study of the Sporadic E (Es) layer development during a space weather event. J. Atmos. Solar-Terrestrial Phys. 241, 105966. doi:10.1016/j.jastp.2022.105966
Resende, L. C. A., Zhu, Y., Santos, A. M., Chagas, R. A. J., Denardini, C. M., Arras, C., et al. (2024). Nocturnal sporadic cusp-type layer (esc) resulting from anomalous excess ionization over the SAMA region during the extreme magnetic storm on 11 may 2024. J. Geophys. Res. Space Phys. 129 (11). doi:10.1029/2024JA033167
Rodger, C. J., Kavanagh, A. J., Clilverd, M. A., and Marple, S. R. (2013). Comparison between POES energetic electron precipitation observations and riometer absorptions: implications for determining true precipitation fluxes. J. Geophys. Res. Space Phys. 118 (12), 7810–7821. doi:10.1002/2013JA019439
Roederer, J. G. (1970). Dynamics of geomagnetically trapped radiation. New York: Springer. doi:10.1007/978-3-642-49300-3
Rong, P. P., Russell, J. M., Mlynczak, M. G., Remsberg, E. E., Marshall, B. T., Gordley, L. L., et al. (2009). Validation of thermosphere ionosphere mesosphere energetics and dynamics/sounding of the atmosphere using Broadband emission Radiometry (TIMED/SABER) v1.07 ozone at 9.6 μm in altitude range 15–70 km. J. Geophys. Res. 114, D04306. doi:10.1029/2008JD010073
Rozanov, E., Calisto, M., Egorova, T., Peter, T., and Schmutz, W. (2012). Influence of the precipitating energetic particles on atmospheric chemistry and climate. Surv. Geophys. 33, 483–501. doi:10.1007/s10712-012-9192-0
Russell, I. I. I. J. M., Mlynczak, M. G., Gordley, L. L., Tansock, J. J., and Esplin, R. W. (1999). “Overview of the SABER experiment and preliminary calibration results,” in Proceedings of the SPIE, 44th annual meeting, 18–23 july. Editor A. M. Larar (Denver, Colorado), 277–288. doi:10.1117/12.366382
Sammis, I., Tang, F., and Zirin, H. (2000). The dependence of large flare occurrence on the magnetic structure of sunspots. Astrophysical J. 540 (1), 583–587. doi:10.1086/309303
Santos, A. M., Abdu, M. A., Souza, J. R., Sobral, J. H. A., Batista, I. S., and Denardini, C. M. (2016). Storm time equatorial plasma bubble zonal drift reversal due to disturbance Hall electric field over the Brazilian region. J. Geophys. Res. Space Phys. 121 (6), 5594–5612. doi:10.1002/2015JA022179
Sau, S., Narayanan, V. L., Gurubaran, S., Ghodpage, R. N., and Patil, P. T. (2017). First observation of interhemispheric asymmetry in the EPBs during the St. Patrick’s Day geomagnetic storm of 2015. J. Geophys. Res. Space Phys. 122 (6), 6679–6688. doi:10.1002/2017JA024213
Scheibler, C., Toprani, S. M., Mordukhovich, I., Schaefer, M., Staffa, S., Nagel, Z. D., et al. (2022). Cancer risks from cosmic radiation exposure in flight: a review. Front. Public Health 10, 947068. doi:10.3389/fpubh.2022.947068
Shetgaonkar, G. G., and Kumar, L. (2022). “Mitigating radiation effects on humans during space travel: recent developments,” in Handbook of space pharmaceuticals. Editors Y. Pathak, M. Araújo dos Santos, and L. Zea (Springer), 1–33. doi:10.1007/978-3-319-50909-9_53-1
Shue, J.-H., Song, P., Russell, C. T., Steinberg, J. T., Chao, J. K., Zastenker, G., et al. (1998). Magnetopause location under extremes solar wind conditions. J. Geophys. Res. 103 (17), 691.
Sinnhuber, M., Berger, U., Funke, B., Nieder, H., Reddmann, T., Stiller, G., et al. (2018). NOy production, ozone loss and changes in net radiative heating due to energetic particle precipitation in 2002–2010. Atmos. Chem. Phys. 18, 1115–1147. doi:10.5194/acp18-1115-2018
Sinnhuber, M., Friederich, F., Bender, S., and Burrows, J. P. (2016). The response of mesospheric NO to geomagnetic forcing in 2002– 2012 as seen by SCIAMACHY. J. Geophys. Res.-Space 121, 3603–3620. doi:10.1002/2015JA022284
Sinnhuber, M., and Funke, B. (2020). “Energetic electron precipitation into the atmosphere,” in The dynamic loss of Earth’s radiation belts. Editors A. N. Jaynes, and M. E. Usanova (Elsevier), 279–321. doi:10.1016/B978-0-12-813371-2.00009-3
Sinnhuber, M., Nieder, H., and Wieters, N. (2012). Energetic particle precipitation and the chemistry of the mesosphere/lower thermosphere. Surv. Geophys. 33 (6), 1281–1334. doi:10.1007/s10712-012-9201-3
Stone, E. C., Frandsen, A. M., Mewaldt, R. A., Christian, E. R., Margolies, D., Ormes, J. F., et al. (1998). The advanced composition explorer. Space Sci. Rev. 86 (1/4), 1–22. doi:10.1023/A:1005082526237
Sudol, J. J., and Harvey, J. W. (2005). Longitudinal magnetic field changes accompanying solar flares. Astrophysical J. 635 (1), 647–658. doi:10.1086/497361
Sun, M., Lu, J., Li, J., Tang, F., Wei, G., Li, Z., et al. (2024). Responses of mesosphere temperature to the geomagnetic storms on 8 and 15 september 2003. J. Geophys. Res. Space Phys. 129 (5). doi:10.1029/2023JA032366
Takizawa, K., and Kitai, R. (2015). Evolution and flare activity of δ-sunspots in cycle 23. Sol. Phys. 290 (7), 2093–2116. doi:10.1007/s11207-015-0720-1
Tartaglione, N., Toniazzo, T., Orsolini, Y., and Otterå, O. H. (2020). Impact of solar irradiance and geomagnetic activity on polar NOx, ozone and temperature in WACCM simulations. J. Atmos. Solar-Terrestrial Phys. 209, 105398. doi:10.1016/j.jastp.2020.105398
Tsurutani, B. T., Zank, G. P., Sterken, V. J., Shibata, K., Nagai, T., Mannucci, A. J., et al. (2023). Space plasma physics: a review. IEEE Trans. Plasma Sci. 51 (7), 1595–1655. doi:10.1109/TPS.2022.3208906
Tur, T. J., and Priest, E. R. (1976). The formation of current sheets during the emergence of new magnetic flux from below the photosphere. Sol. Phys. 48 (1), 89–100. doi:10.1007/BF00153334
Turunen, E., Verronen, P. T., Seppälä, A., Rodger, C. J., Clilverd, M. A., Tamminen, J., et al. (2009). Impact of different energies of precipitating particles on NOx generation in the middle and upper atmosphere during geomagnetic storms. J. Atmos. Solar-Terrestrial Phys. 71 (10–11), 1176–1189. doi:10.1016/j.jastp.2008.07.005
Vampola, A. L., and Gorney, D. J. (1983). Electron energy deposition in the middle atmosphere. J. Geophys. Res. Space 88, 6267–6274. doi:10.1029/ja088ia08p06267
Verronen, P. T., Andersson, M. E., Marsh, D. R., Kovács, T., and Plane, J. M. C. (2016). WACCM-D – whole atmosphere community climate model with D-region ion chemistry. J. Adv. Model Earth. Sy. 8, 954–975. doi:10.1002/2015MS000592
Wang, H., and Tang, F. (1993). Flux emergence and umbra formation after the X-9 flare of 1991 March 22. Astrophysical J. 407, L89–L90. doi:10.1086/186813
Woodman, R. F., and La Hoz, C. (1976). Radar observations of F region equatorial irregularities. J. Geophys. Res. 81 (31), 5447–5466. doi:10.1029/JA081i031p05447
Yermolaev, Y. I., and Yermolaev, M. Y. (2008). “Comment on Interplanetary origin of intense geomagnetic storms (Dst < −100 nT) during solar cycle 23,”Geophys. Res. Lett. Editor W. D. Gonzalez 35. doi:10.1029/2007GL030281
Yokoyama, T. (2017). A review on the numerical simulation of equatorial plasma bubbles toward scintillation evaluation and forecasting. Prog. Earth Planet. Sci. 4 (37), 37. doi:10.1186/s40645-017-0153-6
Keywords: space weather, radiation belts, electron flux, electron precipitation, South Atlantic Magnetic Anomaly (SAMA), ozone depletion, sporadic E layers
Citation: Da Silva LA, Shi J, Alves LR, Resende LCA, Vieira LEA, Costa JER, Marchezi JP, Agapitov OV, Sibeck DG, dos Santos AM, Andrioli VF, Jauer PR, Deggeroni V, do Carmo CdS, Nyassor PK, Chen SS, Ayorinde TT, Ferreira KJC, Moro J, Wang C, Li H and Liu Z (2025) Space weather effects over SAMA during the extreme geomagnetic storm on May 10-11, 2024: disturbances of the neutral and ionized atmosphere. Front. Astron. Space Sci. 12:1550635. doi: 10.3389/fspas.2025.1550635
Received: 23 December 2024; Accepted: 31 March 2025;
Published: 06 May 2025.
Edited by:
Olga V. Khabarova, Tel Aviv University, IsraelReviewed by:
Kirolosse M. Girgis, Kyushu University, JapanArseniy Doyennel, VU Amsterdam, Netherlands
Copyright © 2025 Da Silva, Shi, Alves, Resende, Vieira, Costa, Marchezi, Agapitov, Sibeck, Santos, Andrioli, Jauer, Deggeroni, do Carmo, Nyassor, Chen, Ayorinde, Ferreira, Moro, Wang, Li and Liu. This is an open-access article distributed under the terms of the Creative Commons Attribution License (CC BY). The use, distribution or reproduction in other forums is permitted, provided the original author(s) and the copyright owner(s) are credited and that the original publication in this journal is cited, in accordance with accepted academic practice. No use, distribution or reproduction is permitted which does not comply with these terms.
*Correspondence: Ligia Alves Da Silva, bGlnaWEuYWx2ZXMwMUBnbWFpbC5jb20=, bGlnaWEuc2lsdmFAaW5wZS5icg==