 Yong Wang1
 P. T. Jayachandran2
 Fei-Fei Wang3Q.-H. Zhang4*Shu-Ji Sun3Tong Xu3
 Zan-Yang Xing1
 Yu-Zhang Ma1
 J. M. Ruohoniemi5S. G. Shepherd6
- 1Shandong Provincial Key Laboratory of Optical Astronomy and Solar-Terrestrial Environment, School of Space Science and Technology, Institute of Space Sciences, Shandong University, Weihai, China
- 2Physics Department, University of New Brunswick, Fredericton, NB, Canada
- 3China Research Institute of Radiowave Propagation, Qingdao, China
- 4State Key Laboratory of Space Weather, Center for Space Science and Applied Research, Chinese Academy of Sciences, Beijing, China
- 5Bradley Department of Electrical and Computer Engineering, Virginia Tech., Blacksburg, VA, United States
- 6Thayer School of Engineering, Dartmouth College, Hanover, NH, United States
For decades, the Rate of Change of Total Electron Content Index (ROTI) has been employed to monitor and quantify ionospheric irregularities, serving as a potential substitute for standard scintillation indices. However, to date, ROTI has not been sufficiently investigated in terms of its relationship with standard scintillation indices. This study presents a preliminarily statistical analysis of the relationship between ROTI and standard scintillation indices using GPS receivers from the Canadian High Arctic Ionospheric Network (CHAIN) over a 5-year period from 2011 to 2015. Our results show that as ROTI increases, the phase scintillation index (σφ) exhibits a corresponding linear increase (slope of ∼0.34), while the amplitude scintillation index (S4) shows little to no enhancement (slope of ∼0.05). Both relationships exhibit high correlation, with coefficients of approximately 0.93 and 0.82, respectively. The differentiated responses suggest that the significant enhancement of standard phase scintillation index is fundamentally dominated by refractive effects, which is primarily driven by large-scale ionospheric structures (>Fresnel-scale probably). The feeble inflation of S4 supports the assertion. Accordingly, the linear relationship solely between ROTI and σφ suggests that the increase in ROTI can be used to empirically assess the contribution of refractive variations to the enhancement of σφ at high latitudes.
1 Introduction
The rapid expansion of Global Navigation Satellite Systems (GNSS)-including GPS, Beidou, GLONASS, Galileo, and regional systems-has ushered in a new era for exploring Earth’s upper atmosphere. Compared to traditional radio instruments (such as radars and ionosondes), GNSS measurements offer unparalleled advantages. For instance, the low cost and continuous recording capabilities have enabled the deployment of a dense network of ground-based GNSS receivers to monitor the ionosphere globally on a daily basis (e.g., Cherniak et al., 2018). When satellite signals pass through the ionosphere, they are affected by ionospheric irregularities of various scales, manifesting as Total Electron Content (TEC) variations and scintillations (e.g., Mitchell et al., 2005; Moen et al., 2013; McCaffrey and Jayachandran, 2017; 2019; Jayachandran et al., 2011; 2012; 2017; Wang et al., 2016; 2020; 2021; 2022). TEC variations are typically caused by refractive effects due to large-scale structures (>Fresnel-scale), while scintillations are defined to be driven by Fresnel-scale irregularities, referring to the high frequency variations (e.g., Wang et al., 2018; Song et al., 2023; Hamza et al., 2024). Scintillation indices are generally quantified using two standard parameters: the amplitude scintillation index (S4) and the phase scintillation index (σφ), both derived from high-sampling-rate (50 Hz or higher) GNSS observables. It is noted that a standard scintillation index usually comprises two parts: refractive and diffractive (scintillation) variations (Wang et al., 2018). Due to the high sampling rate and post-processing progress required, scintillation indices can be computed using a limited number of specialized GNSS receivers automatically.
To fully leverage the dense network of low-sampling-rate (e.g., 1 Hz or lower) GNSS Geodetic receivers, the Rate of Change of TEC Index (ROTI) has been proposed to track the global distribution of ionospheric irregularities (Pi et al., 1997). ROTI is defined as the standard deviation of the rate of TEC (ROT) over a specified time interval, such as 1 or 5 min. This development has motivated many researchers to use ROTI for monitoring ionospheric irregularities on a global scale (e.g., Pi et al., 1997; Zhao et al., 2021; Nie et al., 2022a; 2022b). For instance, Cherniak et al. (2014), Cherniak et al. (2018), Cherniak et al. (2022) have progressively developed the global ROTI map using data from numerous ground-based Geodetic GNSS networks, including the International GNSS Service (IGS), European Permanent Network (EPN), and the Polar Earth Observing Network (POLENET). These studies have shown that ROTI values are dependent on the sampling rate and calculation interval (Jacobsen, 2014) as well as on the receiver architecture (Yang and Liu, 2017; McCaffrey et al., 2018).
The appealing prospect of worldwide ROTI to use as a proxy for the scarce scintillation measurements has attracted tremendous attention. Several studies have shown that the large-scale (a few kilometers) and small-scale (several hundred meters) irregularities could be represented by the ROTI and scintillation indices at the same time (e.g., Alfonsi et al., 2011; Seif et al., 2012). Basu et al. (1999) pointed out that the ratio of ROTI/S4 varies from 2 to 10 on different nights in response to the zonal plasma drift at Ascension Island near the equator region, predicting the possibility of ROTI to show the presence of irregularities caused scintillations. Moreover, from a number of case studies, the significant difference suggests that the relationships between ROTI and S4 relied on the locations of receivers (e.g., Basu et al., 1999; Xu et al., 2007; Li et al., 2007). Furthermore, Yang and Liu (2016) mentioned that the ratio of ROTI/S4 was also dependent on each satellite link due to variations in the viewing geometry. Li et al. (2022) evaluated that the higher satellite elevation angle produces a better correlation between ROTI and S4 quantitatively at low latitude region during the year of 2015. In addition, Carrano et al. (2019) comprehensively approximated the relationships between ROTI and S4 based on the scintillation theory of weak phase screen, which the observations from Ascension Island have been validated formally.
For the high-latitude region, a high correlation of 0.76 between the ROTI and the phase scintillation index (σφ) is present (Pi et al., 2013). Jacobsen (2014) pointed out that to determine the baseline level of ROTI (could be originated from a number of combinations of sampling rates and time intervals) accurately still requires to analyze “a large amount of data” in advance. Wang et al. (2022) have shown a linear relationship of σφ on ROT (rate of change of TEC), definitely convincing on the further step to ROTI. Imam et al. (2024) investigated how to estimate σφ from time series of TEC and ROT measurements from one specialized GNSS receiver via Machine Learning. Therefore, in order to represent the scare scintillation indices using the global-distributed Geodetic GNSS receivers extensively, establishing the “baseline” relationships between the ROTI and standard scintillation indices in statistical is still on the way. It is worthy to mention that the phase scintillation proxy index had also been developed, which was computed from the 1 Hz phase observables, and then comprehensively compared (e.g., Prikryl et al., 2013; Ghoddousi-Fard et al., 2013; Ghoddousi-Fard, 2017). Zhao et al. (2022) evaluated the accuracy of two 30 second-sampling-interval indices (σφ and ROTI) in monitoring scintillations using the measurements in the year of 2020 at high latitudes. Recently, Song et al. (2023) reported that phase fluctuations are dominated by large-scale (larger than the Fresnel scale) irregularities for the polar region. In contrast, the amplitude scintillations are majorly associated with Fresnel scale irregularities (Forte and Radicella, 2002). Hence, it is worth investigating ROTI’s potential correlations on the scintillation parameters to understand the physics further and then assess the applicability of ROTI as a proxy for scintillation.
In this study, we present the statistical results to further demonstrate the reference correlations of ROTI on the standard scintillation indices and also the plasma flow velocity over the Canadian Arctic ionosphere, using measurements from the Specialized GPS receivers of the Canadian High Arctic Ionospheric Network (CHAIN) (Jayachandran et al., 2009), and the Super Dual Auroral Radar Network (SuperDARN radars) of Kapuskasing (KAP), Saskatoon (SAS), Blackstone (BKS), Fort Hays West (FHW), and Christmas Valley East (CVE) (Greenwald et al., 1995; Chisham et al., 2007).
2 Measurements and the selected regions
2.1 Measurements
The Canadian High Arctic Ionospheric Network (CHAIN) comprises 32 ground-based GPS receivers located in the Canadian Arctic (Jayachandran et al., 2009). These receivers, including models Novatel GSV4004B GISTM and Septentrio PolaRxS Pro, provide Rate of TEC (ROT) data with a sampling rate of 50 Hz. The ROT index is defined as the rate of slant TEC over 15-s intervals (ROT = TEC0 - TEC-15). For detailed information on the ROT, please refer to Wang et al. (2022). The slant TEC is calculated using dual-frequency signals (L1 and L2), with the L2 signal further divided into L2P(Y) and L2C (Yang and Liu, 2017; McCaffrey et al., 2018). Following the method introduced by Pi et al. (1997), ROTI is calculated from four ROT values over 1-min intervals. Therefore, this study focuses on ROTI with a temporal resolution of 1 minute.
In this study, in order to deriving two kinds of standard scintillation indices, a standard detrending approach of using the 6th-order Butterworth filter (with a fixed cut-off frequency of 0.1 Hz) is adapted by the receiver automatically worked on the recorded raw data, which is broadcasted by the GPS L1 signal (e.g., Fremouw et al., 1978; Mushini et al., 2012; van der Meeren et al., 2015). The standard phase scintillation index (σφ) and amplitude scintillation index (S4) are calculated during 1-min intervals, and used to quantify the scintillation. We have used an elevation cut-off of 20° to minimize the multi-path contamination. To compare the GPS measurements with the plasma flow, the data provided by GPS receivers have been projected into uniform grids on Ionospheric Pierce Point (IPP) at the assumed height of 350 km (represented as the height of the peak of F layer) along line-of-sight (LOS) directions in a spatial scale of 1° Magnetic Latitude (MLat) × 2° Magnetic Longitude (MLon) under Altitude-Adjusted Corrected Geomagnetic Coordinates (AACGM).
The data of ionospheric plasma drift is obtained from the SuperDARN radars, with a growing number of more than 35 high-frequency (HF) radars overlapping a vast region from mid-latitudes to high-latitudes in the two hemispheres (Chisham et al., 2007), in particular over the Arctic. In principle, a beam of one SuperDARN radar offers the drift information of ionospheric irregularities (in a scale of decameters) along the corresponding LOS direction through Doppler shifts in the backscattered signal. Hence, if a cloud of concerned ionospheric irregularities is detected by two or more SuperDARN radars simultaneously, the velocity vector can be appropriately obtained by combining the Doppler observables from the two or more beams of related SuperDARN radars (Ruohoniemi and Baker, 1998; Shepherd and Ruohoniemi, 2000). The drift data from SuperDARN radars were prepared on the spatial resolutions of 1° MLat × 2° MLon under AACGM and in a cadence of 2 min.
2.2 The selected region
Wang et al. (2018), Wang et al. (2022) have used two regions for a closer look at the GPS amplitude and phase scintillation and their linear relationships on the convection speed. These two regions are at the noon and dawn sectors of the Canadian Arctic, respectively, with a latitudinal range between 69° and 75° MLat and spanning 11:00–13:00 Magnetic Local Time (MLT) and a latitudinal range between 60° and 68° MLat and spanning 06:00–07:00 MLT. The sectors in AACGM are represented by the magenta and black frames in Figure 1. These are in the Canadian sector where the CHAIN is located, and the specific UT intervals are 18:00–20:00 UT and 13:00–15:00 UT, respectively. These two selected regions were well covered by GPS receivers of CHAIN (not shown here) and SuperDARN radars, situated in Kapuskasing, VA (KAP), Saskatoon, SA (SAS) to the noon sector, and Blackstone, VA (BKS), Fort Hays, KS (FHW), and Christmas Valley, Oregon (CVE) for the dawn sector, simultaneously. For why we selected these two regions and the criteria for determining them in detail, please refer to Wang et al. (2018), Wang et al. (2022).
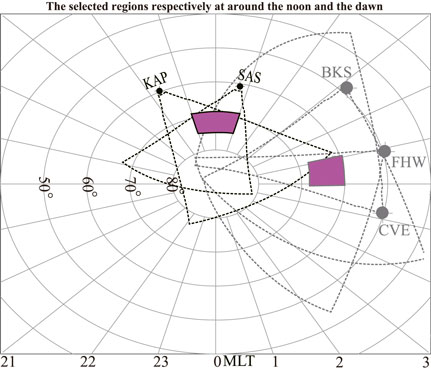
Figure 1. The locations of two selected regions (highlighted by the magenta sectors with solid black frames) and the field-of-view (FOV) of related SuperDARN radars (dashed black lines) under MLat/MLT coordinate with noon on the top and dawn on the right. The selected regions are at the noon and dawn sectors of the Canadian Arctic. In this study, the select region at the noon sector covers a range of 69°–75° MLat and 11:00–13:00 MLT (18:00–20:00 UT). Another region on the dawn sector spreads over the square of 60°–68° MLat and 06:00–07:00 MLT (13:00–15:00 UT).
3 Results: the correlation of ROTI on the phase and amplitude scintillation indices
The index of ROTI is preferred because it can be estimated from TEC measurements simply, which is obtained from widely distributed low-sampling Geodetic GNSS receivers easily. However, compared to ROTI, scintillation indices are relatively scarce due to the lack of high-cadence data from specialized scintillation receivers by default (e.g., Zhao et al., 2022; Imam et al., 2024). Many researchers have conducted case studies to explore the exact relationships between ROTI and scintillation indices (e.g., Basu et al., 1999; Xu et al., 2007; Li et al., 2007; Yang and Liu, 2016; Carrano et al., 2019). These studies concluded that the relationships between ROTI and scintillation indices vary depending on the individual station and the viewing geometry of the line-of-sight (LOS). While the exact correlation may vary, a general understanding of the relationship between ROTI and standard scintillation indices is still needed for practical applications. Therefore, a detailed statistical study is necessary to establish a reference relationship between these parameters and to cross-calibrate the measurements.
We conducted a statistical analysis over a 5-year period (2011–2015) using all available measurements from CHAIN GPS receivers in the Canadian Arctic, focusing on the noon sector (69°–75° MLat, 18:00–20:00 MLT) and the dawn sector (60°–68° MLat, 06:00–07:00 MLT). Data pairs of ROTI and scintillation indices were constructed, consisting of ROTI and the corresponding standard phase/amplitude scintillation indices within the selected regions on the same grid. The data pairs were screened to exclude scintillation indices below 0.05 (the thermal noise threshold of GNSS receivers, e.g., Wang et al., 2016) and ROTI values exceeding 3 TECU/min (to filter out spikes likely caused by cycle slips of phase observable). Additionally, plasma flow velocities below 35 m/s were excluded to remove ground scatter contamination (Ruohoniemi and Greenwald, 1997). Note that 1 TECU = 1 × 10¹⁶ electrons/m2. After applying the criterion (|ROTI| ≥ 3 TECU/min), only 513 ROTI values were discarded, representing less than 0.1% of the total data pairs.
A huge number of data pairs have been set up, 657529 for the ROTI-σφ pairs (or ROTI-S4 pairs) in total (486182 data pairs in the dayside, 171347 data pairs in the dawn-side, respectively). Note that the number discrepancy from the two selected regions is largely proportional to each spatial scale of selected regions between at the dayside and at the dawn-side, as well as is secondarily due to the stronger velocity distribution on the dayside than that at the dawn-side after accurately filtered by the ground velocity speed. The two data pairs were then grouped into the ROTI bins of 0.001 TECU/min and averaged the contained values of scintillation indices, which fall into each ROTI bin. Note that the number threshold of data pairs for each ROTI grid is arbitrarily set as 5, as well as the range of the ROTI bin. Figure 2 presents the statistical correlations of ROTI (x-axis) on the corresponding scintillation indices (y-axis); Figure 2a is for σφ, and Figure 2b is for S4. In Figure 2, the red squares represent the median values of scintillation indices within the corresponding ROTI bins, and their standard errors ranged by the blue vertical lines. In Figures 2a,b, the solid black lines represent the linear least-square fittings based on the median values in each ROTI bin, with an equation for the best fit and the correlation coefficient.
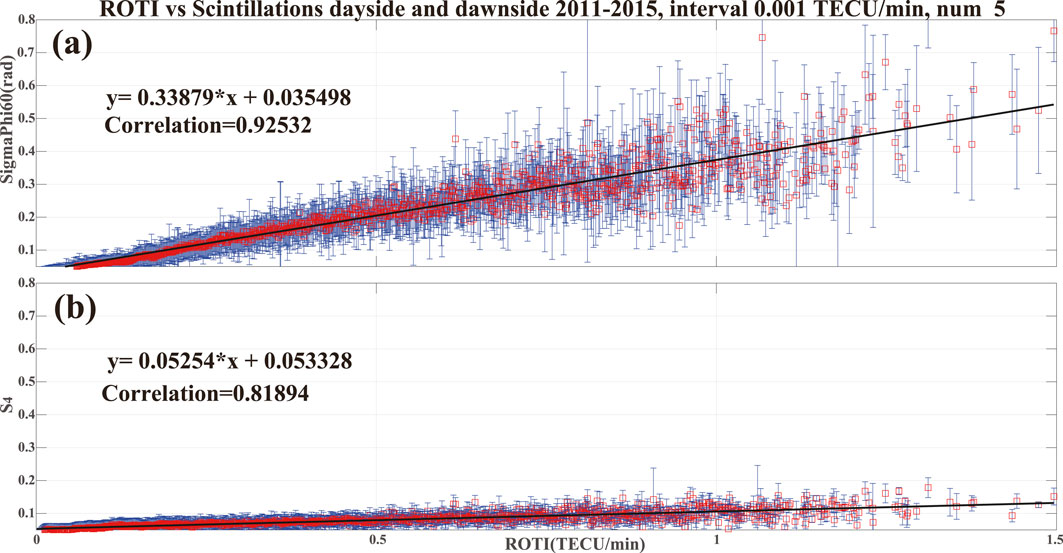
Figure 2. The statistical correlations of ROTI on the phase and amplitude scintillation indices during a period of 5 years from 2011–2015. The ROTI is binned into 0.001 TECU/min bins with a number threshold 5. Then, the median values of the corresponding scintillation indices in each bin are represented by the boxes’ red symbols and the blue bars for their standard deviations. The black lines represent the linear fits to the median values (including their equations and correlation coefficients). (a) phase scintillation indices vs ROTI; (b) amplitude scintillation indices vs ROTI.
Figure 2a shows that ROTI has a linear correlation on σφ (the best-fit slope is ∼0.34), behaving as the σφ linearly increasing with ROTI with a high correlation coefficient of 0.925. Nevertheless, Figure 2b presents that even though ROTI and S4 are well correlated (correlation coefficient of ∼0.82), the enhancement of S4 on ROTI is very feeble (slope of the best fit is almost zero, ∼0.05), which is quietly different from σφ. Note that the same y-axis in Figures 2a,b have been applied to highlight the different slopes clearly. This implies that S4 has a negligee to no enhancement on the growing ROTI. The clear but faint correlation in Figure 2b is possibly produced by that the index of S4 contained a spot of energy unexpectedly that originated from the slow variations of raw data (intensities or amplitudes) generated by the large-scale ionospheric irregularities, however, which should be precisely removed by the 6th-order Butterworth filter during the processing progress to calculate it in practice. Combined with Figures 2a,b, there is potentially one reason not only to explain the much evident correlation of σφ on ROTI in Figure 2a, but also the linear but quietly weak correlation of S4 on ROTI (∼0.05) in Figure 2b at the same time. When the difference in slopes of the best fits is compared, it is evident that the magnitude of correlations on ROTI for σφ (∼0.34) is remarkably significant more than that for S4 (∼0.05). It is a solid experimental evidence to quantify the reference correlation of ROTI on the standard phase scintillation index (σφ) using a large number of receivers (>18) located in the vast region of the Canadian Arctic. As a result, the significant difference in correlations of ROTI on the phase/amplitude scintillation indices questions the reliability to use ROTI as a proxy for highlighting the real scintillations precisely (diffractive scintillations, predominantly associated with Fresnel-scale irregularities). Because, at high latitudes, the standard phase scintillation index is very probably not contributed from diffractive variations predominately. In the near future, detailed investigations will be conducted to compare the correlation results from the individual stations located at the separated zones (for example, in the auroral oval, polar cap) and also delineate the quiet and disturbed conditions.
In this study, all available measurements from CHAIN receivers in 5 years (2011–2015) have been used to establish the general correlation of ROTI on the standard phase scintillation index. Due to involving the data from all GPS receivers made by two different manufactures (Septentrio and Novatel), the subtle difference of correlations of σφ on ROTI should be discussed in detail. As mentioned in Section 2, the index of ROTI is derived from the TEC, which is usually acquired from weighting the combination of L1 and L2 signals broadcasted by GNSS. Previous researchers had investigated and compared the inconsistent of ROTI indices derived from GPS modernized L2C and legacy L2P(Y) signals from diversity types of GNSS receivers (Yang and Liu, 2017; McCaffrey et al., 2018). McCaffrey et al. (2018) continued that the L1-aiding progress to obtain the L2 signal probably decrease the accuracy of the high frequency variations of L2 carrier phase observables. For each manufactured receiver, the solution had already been determined and encapsulated. Hereby, the Septentrio ROTI is obtained by L1 and L2C (L1-aiding free) signals. However, the Novatel ROTI is calculated from L1 and L2P(Y) (L1-aiding) combinations. As a result, if we adopt all ROTI data obtained from L1-aiding free method, the correlation would be slightly different from the mixed condition. In practice, we have checked the statistical correlation using the ROTI data only from one type of receivers (Septentrio PolaRxS Pro or Novatel GSV4004B GISTM, respectively), all showing linear but differentiated correlations (not shown here). The slopes are all ∼0.3. In this study, we expect to establish the reference correlation between scintillation parameters and ROTI in general. Then, we decide to not separate the ROTI origination in detail. If one interested, the ROTI deviation could be investigated and compared in detail considering diversity methods to derive ROTI by different receivers comprehensively.
Furthermore, the relatively low correlation between the S4 index and ROTI within the selected regions will be further explored. It might be tempting to assume that this weak correlation is simply due to the S4 index being generally weaker compared to the more pronounced σφ index. However, a comparative analysis of the distribution of scintillation indices reveals a more complex picture. Specifically, when comparing the number distributions of scintillation indices from the selected regions with those from all polar regions, the discrepancy between the σφ and S4 indices is significantly larger in the former than in the latter. Additionally, experimental evidence has confirmed the “Phase without Amplitude” phenomenon, which is characterized by frequent occurrences of high-speed plasma flows in the selected regions (e.g., Wang et al., 2016; 2018; 2022). Moreover, Jayachandran et al. (2017) demonstrated that the magnitudes of the S4 and σφ indices should be comparable through spectral analysis, and should not deviate significantly from each other. Therefore, it can be reasonably inferred that the strong correlation between the σφ index and ROTI is likely driven by the presence of these high-speed plasma flows. In their absence, the correlations between these indices would likely be much weaker.
4 Discussion
4.1 Time intervals and sampling rates
In experiments, the ROTI parameter is often calculated from ROT over various intervals (such as 1, 5, or 30 min), with TEC extracted from carrier phase raw data sampled at different rates (e.g., 1 Hz, 30 Hz, 50 Hz, or 100 Hz). Compared to scintillation indices (typically calculated from raw data sampled at 50 Hz or 100 Hz with a time resolution of 1 min), the impact of different time resolutions on ROTI values has been examined in detail. Fundamentally, the cadence of ROTI and the sampling rate of the raw data determine the frequency range of the variations produced by ionospheric irregularities at specific scales. For example, Carrano and Groves (2007) showed that fast ROTI is sensitive to irregularities at scales as small as 24 m, which is smaller than the Fresnel scale (typically ∼360 m for L-band signals, closely associated with diffractive scintillations). This sensitivity contributes to amplitude scintillations. Jacobsen (2014) further summarized how different time intervals and sampling rates affect ROTI values, noting that ROTI values are positively correlated across different cadence combinations.
In this study, the sampling rate of the GPS receivers from CHAIN is 50 Hz, with a ROT cadence of 15 s used to calculate ROTI over a 1-min interval. Thus, the upper-frequency limit is the Nyquist frequency, which is 25 Hz (50/2) for a 50 Hz sampling rate (Jacobsen, 2014). The lower frequency limit is approximately 0.0167 Hz (1/60) for a 1-min interval (60 s). Consequently, the power contributing to ROTI originates from irregularities that produce variations within the frequency range of ∼0.0167 Hz–25 Hz. Future work should examine the correlations of ROTI on ionospheric parameters carefully across different time resolutions (e.g., 5 s, 10 s, 3 min, 5 min) to solidify the baseline relationships discussed in Section 3.
4.2 Theoretical explanations of correlations
In this study, a fixed cut-off frequency of 0.1 Hz is used to detrend the slow variation background (refractive variations) when calculating scintillation indices. This cut-off frequency is typically considered as the Fresnel frequency (
Moreover, Carrano et al. (2019) have innovated the principal relationship of ROTI on the amplitude scintillation index in detail using the phase screen model in the full theory and then validated the simplified expression from the scintillation observations at Ascension Island. They had pointed out that ROTI was highly correlated with S4. They focused on the equator region primarily, which is traditionally popular of amplitude scintillation. Then, it is reasonable to establish and validate the relationship of ROTI on the S4 in theory. Moreover, Carrano et al. (2016) had derived the relationship of the ratio of σφ to S4 on the effective velocity. Similarly, at high latitudes, Lu et al. (2022) had also established a linear relationship from the ratio of phase and amplitude scintillation indices to the convection speed (with a statistical slope of ∼0.1 obtained from Figure 7 of Lu et al. (2022)). Combined with two Carrano publications together [i.e., Equation 11 in Carrano et al. (2019); Equation 18 in Carrano et al. (2016)], the ratio of ROTI on σφ has been evaluated rudely, which is basically proportional to δt^0.75. δt is noted as the sampling rate. Hereby, the phase spectral index p is simply assumed as 2.5 (p = 0.75*2 + 1) to conduct the scale-free approximation via Rino (1979a), Rino (1979b)’s theory. It is interesting to conduct a completely simulation work on establishing the correlation of ROTI on σφ in theory. Overall, it can be concluded that whatever S4 or σφ would enhance along with the growing ROTI from simulations. However, in this study, Figure 2 presents almost linear enhancement of ROTI only on σφ (nor S4) at high latitudes. There is a probable reason to explain the inconsistency. In the simplified process described by Carrano et al. (2019), to conduct the scale-free approximation in a reasonable and effective manner, the spectral structure function of amplitude is typically confined to diffractive variations and does not exceed the power-law structure strictly. However, at high latitudes, the fixed cut-off frequency (0.1 Hz) occasionally falls below the Fresnel frequency, in particular when confronted with high-speed flows, as mentioned earlier. This situation places the cut-off frequency (considered as the Fresnel frequency in practice) in the refractive regime (Wang et al., 2018; 2022). As a result, the scintillation indices are unintentionally dominated by energy originating from lower frequency ranges. The shift of the Fresnel frequency will be discussed below, along with detailed explanations.
4.3 The correlation between ROTI and plasma flow speed
Wang et al. (2022) reported a linear relationship of the phase scintillation index on the absolute values of ROT in a case study. Given that ROTI is calculated from ROT over a specific interval, it is reasonable to assume that ROTI will exhibit a similar pattern. Additionally, Wang et al. (2018), Wang et al. (2022) demonstrated a linear relationship between the phase scintillation index and plasma flow speed in statistical. Combining these findings suggests a potential linear correlation of ROTI on drift speed. The following section presents a statistical analysis of this relationship.
In this study, we used the grids containing two measurements of the ROTI and flow speed within the selected regions implemented during 5 years of 2011–2015. The cadence of the plasma flow data provided by SuperDARN radars is 2 min. Accordingly, the related ROTI data at the middle epoch of each speed interval are used for comparison with the plasma drift data. For example, when the drift measurements during the 13:00–13:02 UT are involved, the ROTI data at 13:01 UT will be used. To handle a large amount of data pairs (ROTI-flow speed) in a number of 657529, referring to Figure 2, the taken data pair has been binned into the drift speed by 0.001 km/s and then calculated the mean ROTI within each flow bin. Figure 3 exhibits the statistical correlation from the mean ROTI to the corresponding drift bin. The red squares show the median ROTI data in each speed container. The blue vertical lines represent the standard errors of ROTI in each bin. In Figure 3, the solid black line highlights the linear best fit based on each bin’s mean values, with the corresponding functional equation and the correlation coefficient.
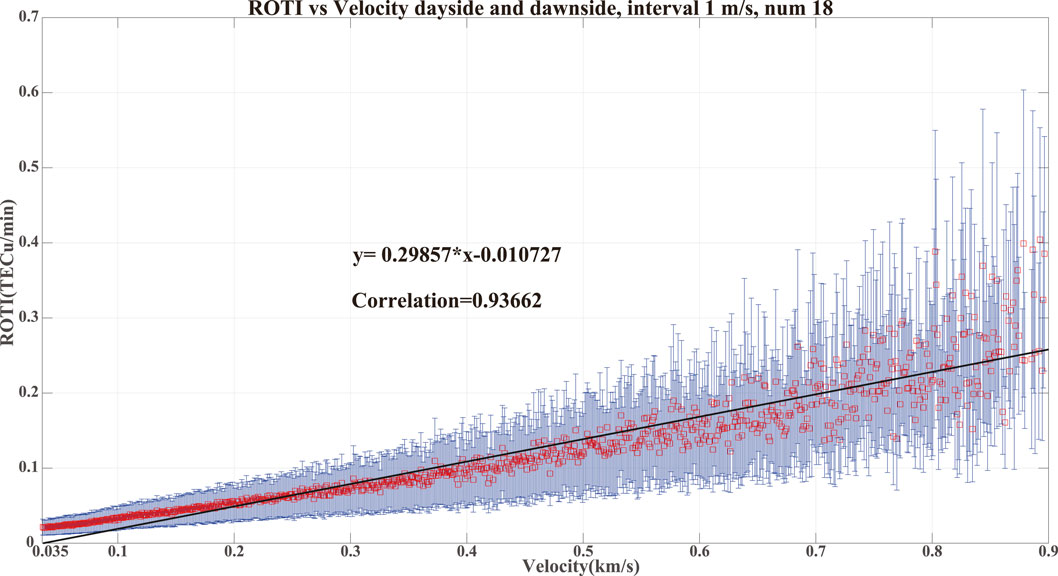
Figure 3. Similar to Figure 2 but on the data pair of ROTI-velocity speed. The ROTI is binned into the drift speed container of 0.001 km/s with a number threshold of 18. The red squares are the mean ROTI in each velocity bin, and the error bars are their standard deviations. The black line, equation function, and correlation coefficient highlight the linear line that best fits the median values.
In Figure 3, the correlation of ROTI on the velocity speed is presented, which is a linear fitting with a slope of around 0.30. Meanwhile, compared with the results from Figure 2, the linear correlation of ROTI on the phase scintillations index (with a slope of ∼0.34) is essentially identical to the relationship from Figure 3. From these results, it can be reasonably deduced that the phase scintillation index is also linearly linked to the plasma flow speed probably, which is very consistent with the results from Wang et al. (2018), Wang et al. (2022). This confirms that the TEC variations introduce phase variations that are dominantly refractive variations but not diffractive scintillation. Moreover, the previous woks have proposed a technique to infer the zonal irregularity drift following the idea that only the phase scintillation index depends on the irregularity motion rather than the amplitude scintillation index, which supports our conclusion (Carrano, et al., 2016; Lu, et al., 2022).
In Figure 3, the statistical ROTI index varies linearly with the plasma flow speed. Similarly, this linear correlation of ROTI on the plasma drift speed can be explained by the unexpected power from the lower frequency range (refractive variations) than the growing Fresnel frequency (diffractive variations). As mentioned, the ROTI index incorporates the energies from the variations in the frequency range of ∼0.0167 Hz–25 Hz produced by plasma irregularities within the specific scales. In our experiments, the more substantial drift probably moved more large-scale irregularities (or the background) to intersect the Line-Of-Sight (LOS) signal between the satellite and the ground-based receiver. Carrano et al. (2016) had also mentioned that the large swaths of TEC rapidly swept past the receiver could produce signal fluctuations not dominated by diffraction effects, which evidences our explanation. Of course, detailed research is worth of conduct to clearly clarify the hypothesis.
Regarding the standard phase scintillation index at high latitudes, it is known that the variation effects below the Fresnel frequency (empirically and automatically set as 0.1 Hz) are usually considered refractive variations due to large-scale irregularities. Along with the faster velocity, the actual Fresnel frequency is becoming greater, which is far from the fixed frequency (0.1 Hz) used to remove the refractive variations. Then, much of the refractive variations (including variations with a frequency higher than 0.1 Hz) would be unintentionally considered as the real scintillation (diffractive variations). Hence, the expansions of ROTI and phase scintillation index could probably be linked together, which are both likely bulked by the refractive variations due to the faster plasma flow.
Consequently, the enhancements of ROT/ROTI likely stem from the greater refractive effects induced by the much more large-scale irregularities transported by the faster flow, which is fundamentally consistent with the explanation on the “Phase without Amplitude” scintillations. On the contrary, the different behavior of little correlation of ROTI on the amplitude scintillation index is possibly linked to that the amplitude scintillation index is fundamentally dominated by the energy from diffraction-scintillation irregularities (around Fresnel-scale) due to the “Fresnel filter” effect. Because, at the low-frequency range (lower than Fresnel frequency), the amplitude power spectral is a flat structure in theory, which is entirely different from the power-law structure of phase spectral at the same frequency range (e.g., Rino, 1979a; Strangways et al., 2011; Wang et al., 2018). Nevertheless, we also admit that there may be some other interpretations in theory to explain Figure 3 better, which needs much more endeavors in the near future.
As a result, these differentiated correlations presented in this study demonstrate the close relationships between ROTI and standard phase scintillation index, and provide one more piece of evidence to explain the famous phenomenon of “Phase without Amplitude” scintillations.
5 Conclusion
We present the linear reference correlation of ROTI on the standard phase scintillation index rather than on the standard amplitude scintillation index, using data from up to 18 specialized GNSS receivers in the Canadian sector of the polar region over a 5-year period from 2011 to 2015. Moreover, we find that ROTI increases linearly with the growing plasma flow observed by multiple SuperDARN radars. When encountering more substantial drifts, more power from large-scale irregularities transported by the faster flow likely inflates the refractive variations in the low-frequency range. This unintentionally develops both of the ROTI and the standard phase scintillation index simultaneously. The weak linear correlation of ROTI on the standard amplitude scintillation index further supports this finding.
Furthermore, this reference correlation highlights the need for caution when using ROTI as a proxy for diffractive scintillation in the polar region. An increase in ROTI may simply reflect the presence of irregularities larger than the Fresnel scale, rather than solely indicating scintillation-producing irregularities.
Data availability statement
Publicly available datasets were analyzed in this study. This data can be found here: The data of GPS receiver is provided by the CHAIN from the database (http://chain.physics.unb.ca/data/gps/ismr/). The SuperDARN radar data are provided by Virginia Tech. through the website (http://vt.superdarn.org/news/articles/SuperDARN/1).
Author contributions
YW: Conceptualization, Methodology, Writing – original draft, Writing – review and editing. PJ: Conceptualization, Methodology, Supervision, Validation, Writing – review and editing. F-FW: Data curation, Formal Analysis, Writing – review and editing. Q-HZ: Conceptualization, Investigation, Methodology, Supervision, Writing – review and editing. S-JS: Conceptualization, Formal Analysis, Methodology, Writing – review and editing. TX: Conceptualization, Methodology, Writing – review and editing. Z-YX: Methodology, Software, Visualization, Writing – review and editing. Y-ZM: Resources, Software, Validation, Visualization, Writing – review and editing. JR: Data curation, Methodology, Software, Writing – review and editing. SS: Data curation, Methodology, Software, Writing – review and editing.
Funding
The author(s) declare that financial support was received for the research and/or publication of this article. This work in China is supported by the National Natural Science Foundation of China (Grants 42325404, 42120104003, 42474219, and 42441828), National Key Laboratory of Electromagnetic Environment (Grant JCKY2022210C614240301), the Shandong Provincial Natural Science Foundation (Grant ZR2022MD034 and ZR2022QD077), the Taishan scholars Program, the Stable-Support Scientific Project of China Research Institute of Radiowave Propagation (Grant A132312191), National Program on Key Basic Research Project (2022-173-SD-1), Xiaomi Young Talents Program, Chinese Meridian Project, and the International Partnership Program of Chinese Academy of Sciences (Grant 183311KYSB20200003). This work was supported by the foundation of the National Key Laboratory of Electromagnetic Environment (Grant JCKY2022210C614240301). This project was funded by the Arctic Yellow River Earth System National Observation and Research Station (NO. YRNORS-20242606). Infrastructure funding for CHAIN was provided by the Canadian Foundation for Innovation and the New Brunswick Innovation Foundation. CHAIN operations are conducted in collaboration with the Canadian Space Agency. This research was undertaken with the financial support of the Canadian Space Agency FAST program and the Natural Sciences and Engineering Research Council of Canada.
Acknowledgments
The SuperDARN is a collection of radars funded by national scientific funding agencies of Australia, Canada, China, France, Japan, South Africa, the United Kingdom and the United States of America. We acknowledge that the University of Saskatchewan runs the Saskatoon HF radar, the Virginia Tech. operates the HF radars of Kapuskasing, Blackstone and Fort Hays West, as well as the Dartmouth College maintains the Christmas Valley East HF radar. We also acknowledge the maintaining and running of CHAIN by Radio and Space Physics Laboratory (RSPL) of University of New Brunswick.
Conflict of interest
The authors declare that the research was conducted in the absence of any commercial or financial relationships that could be construed as a potential conflict of interest.
Generative AI statement
The author(s) declare that no Gen AI was used in the creation of this manuscript.
Publisher’s note
All claims expressed in this article are solely those of the authors and do not necessarily represent those of their affiliated organizations, or those of the publisher, the editors and the reviewers. Any product that may be evaluated in this article, or claim that may be made by its manufacturer, is not guaranteed or endorsed by the publisher.
References
Alfonsi, L., Spogli, L., Tong, J., De Franceschi, G., Romano, V., Bourdillon, A., et al. (2011). GPS scintillation and TEC gradients at equatorial latitudes in April 2006. Adv. Space Res. 47 (10), 1750–1757. doi:10.1016/j.asr.2010.04.020
Basu, S., Groves, K., Quinn, J., and Doherty, P. (1999). A comparison of TEC fluctuations and scintillations at Ascension Island. J. Atmos. Terr. Phys. 61 (16), 1219–1226. doi:10.1016/S1364-6826(99)00052-8
Carrano, C. S., and Groves, K. (2007). “TEC gradients and fluctuations at low latitudes measured with high data rate GPS receivers,” in Proceedings of the 63rd annual meeting of the Institute of navigation. Cambridge, MA, 156–163.
Carrano, C. S., Groves, K. M., and Rino, C. L. (2019). On the relationship between the rate of change of total electron content index (ROTI), irregularity strength (CkL), and the scintillation index (S4). J. Geophys. Res. Space Phys. 124, 2099–2112. doi:10.1029/2018JA026353
Carrano, C. S., Groves, K. M., Rino, C. L., and Doherty, P. H. (2016). A technique for inferring zonal irregularity drift from single-station GNSS measurements of intensity (S4) and phase (σφ) scintillations. Radio Sci. 51, 1263–1277. doi:10.1002/2015RS005864
Cherniak, I., Krankowski, A., and Zakharenkova, I. (2014). Observation of the ionospheric irregularities over the Northern Hemisphere: methodology and service. Radio Sci. 49, 653–662. doi:10.1002/2014RS005433
Cherniak, I., Krankowski, A., and Zakharenkova, I. (2018). ROTI maps: a new IGS ionospheric product characterizing the ionospheric irregularities occurrence. GPS Solutions 22, 69. doi:10.1007/s10291-018-0730-1
Cherniak, I., Zakharenkova, I., and Krankowski, A. (2022). IGS ROTI maps: current status and its extension towards equatorial region and southern hemisphere. Sensors 22 (10), 3748. doi:10.3390/s22103748
Chisham, G., Lester, M., Milan, S. E., Freeman, M. P., Bristow, W. A., Grocott, A., et al. (2007). A decade of the super dual auroral radar network (SuperDARN): scientific achievements, new techniques and future directions. Surv. Geophys. 28, 33–109. doi:10.1007/s10712-007-9017-8
Forte, B., and Radicella, S. M. (2002). Problems in data treatment for ionospheric scintillation measurements. Radio Sci. 37 (6). doi:10.1029/2001RS002508
Fremouw, E. J., Leadabrand, R. L., Livingston, R. C., Cousins, M. D., Rino, C. L., Fair, B. C., et al. (1978). Early results from the DNA Wideband satellite experiment: complex signal scintillation. Radio Sci. 13 (1), 167–187. doi:10.1029/RS013i001p00167
Ghoddousi-Fard, R. (2017). Impact of receiver and constellation on high rate GNSS phase rate measurements to monitor ionospheric irregularities. Adv. Space Res. 60, 1968–1977. doi:10.1016/j.asr.2017.07.039
Ghoddousi-Fard, R., Prikryl, P., and Lahaye, F. (2013). GPS phase difference variation statistics: a comparison between phase scintillation index and proxy indices. Adv. Space Res. 52, 1397–1405. doi:10.1016/j.asr.2013.06.035
Greenwald, R. A., Bristow, W. A., Sofko, G. J., Senior, C., Cerisier, J., and Szabo, A. (1995). Super dual auroral radar network radar imaging of dayside high-latitude convection under northward interplanetary magnetic field: toward resolving the distorted two-cell versus multicell controversy. J. Geophys. Res. 100, 19661–19674. doi:10.1029/95JA01215
Hamza, A. M., Song, K., Meziane, K., and Jayachandran, P. T. (2024). Two-component phase scintillation spectra in the auroral region: observations and model. J. Geophys. Res. Space Phys. 129, e2023JA031998. doi:10.1029/2023JA031998
Imam, R., Alfonsi, L., Spogli, L., Cesaroni, C., and Dovis, F. (2024). On estimating the phase scintillation index using TEC provided by ISM and IGS professional GNSS receivers and machine learning. Adv. Space Res. 73, 3753–3771. doi:10.1016/j.asr.2023.07.039
Jacobsen, K. S. (2014). The impact of different sampling rates and calculation time intervals on ROTI values. J. Space Weather Space Clim. 4, A33. doi:10.1051/swsc/2014031
Jayachandran, P. T., Hamza, A., Hosokawa, K., Mezaoui, H., and Shiokawa, K. (2017). GPS amplitude and phase scintillation associated with polar cap auroral forms. J. Atmos. Terr. Phys. 164, 185–191. doi:10.1016/j.jastp.2017.08.030
Jayachandran, P. T., Hosokawa, K., Shiokawa, K., Otsuka, Y., Watson, C., Mushini, S. C., et al. (2012). GPS total electron content variations associated with poleward moving Sun-aligned arcs. J. Geophys. Res. Space Phys. 117, A05310. doi:10.1029/2011ja017423
Jayachandran, P. T., Langley, R. B., MacDougall, J. W., Mushini, S. C., Pokhotelov, D., Hamza, A. M., et al. (2009). Canadian high arctic ionospheric network (CHAIN). Radio Sci. 44, RS0A03. doi:10.1029/2008rs004046
Jayachandran, P. T., Watson, C., Rae, I. J., MacDougall, J. W., Danskin, D. W., Chadwick, R., et al. (2011). High-latitude GPS TEC changes associated with a sudden magnetospheric compression. Geophys. Res. Lett. 38 (L23104). doi:10.1029/2011GL050041
Li, G., Ning, B., and Yuan, H. (2007). Analysis of ionospheric scintillation spectra and TEC in the Chinese low latitude region. Earth Planets Space 59 (4), 279–285. doi:10.1186/bf03353105
Li, W., Song, S., and Jin, X. (2022). Ionospheric scintillation monitoring with ROTI from Geodetic receiver: limitations and performance evaluation. Radio Sci. 57, e2021RS007420. doi:10.1029/2021RS007420
Lu, S., Xing, S.-Z., Deng, Z.-X., Zhang, Q.-H., Wang, Y., Wang, C., et al. (2022). Modeling research on the relationship between ionospheric scintillation index and drift speed in polar ionosphere. Chin. J. Geophys. 65 (10), 3704–3713. (in Chinese). doi:10.6038/cjg2022Q0069
McCaffrey, A. M., and Jayachandran, P. T. (2017). Observation of subsecond variations in auroral region total electron content using 100 Hz sampling of GPS observables. J. Geophys. Res. Space Phys. 123, 6892–6900. doi:10.1002/2017JA024255
McCaffrey, A. M., and Jayachandran, P. T. (2019). Determination of the refractive contribution to GPS phase “scintillation”. J. Geophys. Res. Space Phys. 124, 1454–1469. doi:10.1029/2018JA025759
McCaffrey, A. M., Jayachandran, P. T., Langley, R. B., and Sleewaegen, J. M. (2018). On the accuracy of the GPS L2 observable for ionospheric monitoring. GPS Solutions 22, 23. doi:10.1007/s10291-017-0688-4
Mitchell, C. N., Alfonsi, L., De Franceschi, G., Lester, M., Romano, V., and Wernik, A. W. (2005). GPS TEC and scintillation measurements from the polar ionosphere during the October 2003 storm. Geophys. Res. Lett. 32, L12S03. doi:10.1029/2004GL021644
Moen, J., Oksavik, K., Alfonsi, L., Daabakk, Y., Romano, V., and Spogli, L. (2013). Space weather challenges of the polar cap ionosphere. J. Space Weather Space Clim. 3, A02. doi:10.1051/SWSC/2013025
Mushini, S. C., Jayachandran, P. T., Langley, R. B., MacDougall, J. W., and Pokhotelov, D. (2012). Improved amplitude- and phase-scintillation indices derived from wavelet detrended high-latitude GPS data. GPS Solutions 16 (3), 363–373. doi:10.1007/s10291-011-0238-4
Nie, W. F., Rovira-Garcia, A., Li, M., Fang, Z., Wang, Y., Zheng, D., et al. (2022b). The mechanism for GNSS-based kinematic positioning degradation at high-latitudes under the March 2015 Great storm. Space weather. 20, e2022SW003132. doi:10.1029/2022SW003132
Nie, W. F., Rovira-Garcia, A., Wang, Y., Zheng, D., Yan, L., and Xu, T. (2022a). On the global kinematic positioning variations during the September 2017 solar flare events. J. Geophys. Res. Space Phys. 127, e2021JA030245. doi:10.1029/2021JA030245
Pi, X., Mannucci, A. J., Valant-Spaight, B., Bar-Seve, Y., Romans, L. J., Skone, S., et al. (2013). “Hall GM observations of global and regional ionospheric irregularities and scintillation using GNSS tracking networks,” in Proceedings of the ION 2013 pacific PNT meeting, 752–761. Honolulu, Hawaii, 23-25 April.
Pi, X., Mannucci, A. J., Lindqwister, U. J., and Ho, C. M. (1997). Monitoring of global ionospheric irregularities using the worldwide GPS network. Geophys. Res. Lett. 24 (18), 2283–2286. doi:10.1029/97GL02273
Prikryl, P., Ghoddousi-Fard, R., Kunduri, B. S. R., Thomas, E. G., Coster, A. J., Jayachandran, P. T., et al. (2013). GPS phase scintillation and proxy index at high latitudes during a moderate geomagnetic storm. Ann. Geophys. 31, 805–816. doi:10.5194/angeo-31-805-2013
Rino, C. L. (1979a). A power law phase screen model for ionospheric scintillation, 1. Weak scatter. Radio Sci. 14 (6), 1135–1145. doi:10.1029/RS014i006p01135
Rino, C. L. (1979b). A power law phase screen model for ionospheric scintillation, 2. Strong scatter. Radio Sci. 14 (6), 1147–1155. doi:10.1029/RS014i006p01147
Ruohoniemi, J. M., and Baker, K. B. (1998). Large-scale imaging of high-latitude convection with Super Dual Auroral Radar Network HF radar observations. J. Geophys. Res. Space Phys. 103 (A9), 20797–20811. doi:10.1029/98JA01288
Ruohoniemi, J. M., and Greenwald, R. A. (1997). Rates of scattering occurrence in routine HF radar observations during solar cycle maximum. Radio Sci. 32 (3), 1051–1070. doi:10.1029/97RS00116
Seif, A., Abdullah, M., Marie Hasbi, A., and Zou, Y. (2012). Investigation of ionospheric scintillation at UKM station, Malaysia during low solar activity. Acta. Astronaut. 81 (1), 92–101. doi:10.1016/j.actaastro.2012.06.024
Shepherd, S. G., and Ruohoniemi, J. M. (2000). Electrostatic potential patterns in the high-latitude ionosphere constrained by SuperDARN measurements. J. Geophys. Res. 105 (A10), 23005–23014. doi:10.1029/2000JA000171
Song, K., Hamza, A. M., Jayachandran, P. T., Meziane, K., and Kashcheyev, A. (2023). Spectral characteristics of phase fluctuations at high latitude. J. Geophys. Res. Space Phys. 128, e2022JA031244. doi:10.1029/2022JA031244
Strangeways, H. J., Ho, Y.-H., Aquino, M. H. O., Elmas, Z. G., Marques, H. A., Monico, J. F. G., et al. (2011). On determining spectral parameters, tracking jitter, and GPS positioning improvement by scintillation mitigation. Radio Sci. 46, RS0D15. doi:10.1029/2010RS004575
van der Meeren Oksavik, K., Lorentzen, D. A., Rietveld, M. T., and Clausen, L. B. N. (2015). Severe and localized GNSS scintillation at the poleward edge of the nightside auroral oval during intense substorm aurora. J. Geophys. Res. Space Phys. 120, 10607–10621. doi:10.1002/2015JA021819
Wang, Y., Cao, Z., Xing, Z., Zhang, Q., Jayachandran, P. T., Oksavik, K., et al. (2021). GPS scintillations and TEC variations in association with a polar cap arc. J. Geophys. Res. Space Phys. 126, e2020JA028968. doi:10.1029/2020JA028968
Wang, Y., Jayachandran, P. T., Ma, Y., Zhang, Q., Xing, Z., Ruohoniemi, J. M., et al. (2022). Dependencies of GPS scintillation indices on the Ionospheric plasma drift and rate of change of TEC around the dawn sector of the polar ionosphere. J. Geophys. Res. Space Phys. 127, e2022JA030870. doi:10.1029/2022JA030870
Wang, Y., Zhang, Q., Jayachandran, P. T., Lockwood, M., Zhang, S., Moen, J., et al. (2016). A comparison between large-scale irregularities and scintillations in the polar ionosphere. Geophys. Res. Lett. 43, 4790–4798. doi:10.1002/2016GL069230
Wang, Y., Zhang, Q., Jayachandran, P. T., Moen, J., Xing, Z., Chadwick, R., et al. (2018). Experimental evidence on the dependence of the standard GPS phase scintillation index on the ionospheric plasma drift around noon sector of the polar ionosphere. J. Geophys. Res. Space Phys. 123, 2370–2378. doi:10.1002/2017JA024805
Wang, Y., Zhang, Q., Ma, Y., Jayachandran, P. T., Xing, Z., Balan, N., et al. (2020). Polar ionospheric large-scale structures and dynamics revealed by TEC keogram extracted from TEC maps. J. Geophys. Res. Space Phys. 125, e2019JA027020. doi:10.1029/2019JA027020
Xu, J., Zhu, J., and Li, L. (2007). Effects of a major storm on GPS amplitude scintillations and phase fluctuations at Wuhan in China. Adv. Space Res. 39 (8), 1318–1324. doi:10.1016/j.asr.2007.03.004
Yang, Z., and Liu, Z. Z. (2016). Correlation between ROTI and ionospheric scintillation indices using Hong Kong low-latitude GPS data. GPS Solutions 20, 815–824. doi:10.1007/s10291-015-0492-y
Yang, Z., and Liu, Z. Z. (2017). Investigating the inconsistency of ionospheric ROTI indices derived from GPS modernized L2C and legacy L2P(Y) signals at low-latitude regions. GPS Solutions 21, 783–796. doi:10.1007/s10291-016-0568-3
Zhao, D. S., Li, W., Li, C. D., Tang, X., Wang, Q., Hancock, C. M., et al. (2021). Ionospheric phase scintillation index estimation based on 1 Hz geodetic GNSS receiver measurements by using continuous wavelet transform. Space weather. 20, e2021SW003015. doi:10.1029/2021SW003015
Zhao, D. S., Wang, Q., Li, W., Shi, S., Quan, Y., Hancock, C. M., et al. (2022). Validating ionospheric scintillation indices extracted from 30s-sampling-interval GNSS Geodetic receivers with long-term ground and in-situ observations in high-latitude regions. Remote Sens. 14, 4255. doi:10.3390/rs14174255
Keywords: ROTI, scintillation indices, linear correlation, plasma flow, Canadian Arctic
Citation: Wang Y, Jayachandran PT, Wang F-F, Zhang Q-H, Sun S-J, Xu T, Xing Z-Y, Ma Y-Z, Ruohoniemi JM and Shepherd SG (2025) The statistical correlations of rate of change of TEC index (ROTI) on the standard scintillation indices over the Canadian Arctic. Front. Astron. Space Sci. 12:1564311. doi: 10.3389/fspas.2025.1564311
Received: 21 January 2025; Accepted: 02 April 2025;
Published: 11 April 2025.
Edited by:
Tzu-Wei Fang, Space Weather Prediction Center (NOAA), United StatesReviewed by:
Yang Wang, University of Colorado Boulder, United StatesTibor Durgonics, University of Colorado Boulder, United States
Copyright © 2025 Wang, Jayachandran, Wang, Zhang, Sun, Xu, Xing, Ma, Ruohoniemi and Shepherd. This is an open-access article distributed under the terms of the Creative Commons Attribution License (CC BY). The use, distribution or reproduction in other forums is permitted, provided the original author(s) and the copyright owner(s) are credited and that the original publication in this journal is cited, in accordance with accepted academic practice. No use, distribution or reproduction is permitted which does not comply with these terms.
*Correspondence: Q.-H. Zhang, emhhbmdxaW5naGVAbnNzYy5hYy5jbg==