 Greta M. Cappello1*
 Manuela Temmer1
 Eva Weiler1,2
 Alessandro Liberatore3
 Christian Möstl2
 Tanja Amerstorfer2
- 1Institute of Physics, University of Graz, Graz, Austria
- 2Austrian Space Weather Office, GeoSphere Austria, Graz, Austria
- 3Jet Propulsion Laboratory, California Institute of Technology, Pasadena, CA, United States
The CORonagraph and Heliospheric Imager data eXplorer (CORHI-X) is an open-source tool designed for the Heliophysics community to foster multi-spacecraft studies. CORHI-X enables users to easily visualize multi-spacecraft constellations, their overlapping fields of view (FoV), and the occurrence of coronal mass ejections (CMEs) over defined time intervals beginning in 2019. CORHI-X is accessible via a Python Streamlit interface, where users can select coronagraphs (e.g., STEREO-A/COR1-COR2, SOHO/C2-C3, SOLAR ORBITER/Metis) and heliospheric imagers (e.g., STEREO-A/HI-A, PARKER SOLAR PROBE/WISPR, SOLAR ORBITER/SoloHI). The tool not only provides spacecraft positions and FoVs of selected instruments, but also ensures that FoVs are plotted only when the corresponding spacecraft data are available. Indeed, the online archives of each instrument are checked monthly to retrieve observation dates, ensuring that CORHI-X automatically incorporates the latest data. For an effective search for eruptive events potentially appearing within the instrument’s FoVs, CORHI-X is linked to two different CME catalogs (DONKI and HI-Geo, respectively). The user can visualize specific CMEs and propagate them over distance to identify which events may have entered the FoV of one or more instruments. Users can also manually enter their own CME input parameters (propagation direction, speed, time, width, and longitude) via the interface. For propagation, a simple drag-based model is incorporated in the visualization of the spacecraft constellation.
1 Introduction
The 25th Solar Cycle began in December 2019, and reached its maximum in October 2024 as announced by the National Aeronautics and Space Administration (NASA), the National Oceanic and Atmospheric Agency (NOAA), and the Solar Cycle Prediction Panel. Compared to Solar Cycle 24, it reveals an increased number of sunspot groups and solar flares, making it an intriguing and active cycle for studying Coronal Mass Ejections (CMEs) (Yazev et al., 2023; Upton and Hathaway, 2023). CME observations and studies by more than one spacecraft covering different distances from the Sun, are essential to better understand the physical mechanisms of CME evolution and their interaction with the solar wind (e.g., Temmer et al., 2011; Good et al., 2018; Pal et al., 2020; Hess et al., 2023; Liberatore et al., 2024; Palmerio et al., 2024; Davies et al., 2024). Still operating key missions include the Solar and Heliospheric Observatory (SOHO; Domingo et al., 1995), the Solar TErrestrial RElations Observatory (STA and STB; Kaiser et al., 2008), and the Solar Dynamic Observatory (SDO; Pesnell et al., 2012).
In recent years, we have seen the launch of new observatories, such as the Parker Solar Probe launched in August 2018 (PSP; Fox et al., 2016), and the Solar Orbiter launched in February 2020 (SolO; Müller et al., 2020; García Marirrodriga et al., 2021). These new missions introduce not only advanced technologies, with higher-resolution data and shorter cadences, but also innovative spacecraft orbits that allow for closer exploration of the Sun, venturing into regions previously unexplored. However, because of the large distances away from Earth, the spacecraft telemetry is low, which especially affects the availability of remote sensing image data. The limitations in data availability are an issue that restricts the selection of events covering interesting spacecraft constellations.
The PSP reached its closest perihelion at 8.86 solar radii from the Sun’s surface in December 2024. During the first 5 years of its nominal mission, the PSP achieved remarkable scientific results, significantly enhancing our understanding of the Sun’s corona and solar wind (Raouafi et al., 2023). Similarly, SolO has already produced stunning scientific results with respect to CME-flare studies (see, e.g., Bemporad et al., 2022; Mierla et al., 2022; Hess et al., 2023), with much more expected to follow. Indeed, after the Ulysses spacecraft (Caseley and Marsden, 1990), SolO will be the second satellite to provide out-of-ecliptic observations of the Sun. Ulysses was deflected from the ecliptic plane to the heliographic south pole after its encounter with Jupiter in February 1992, and later to the heliographic north pole in 1995. These out-of-ecliptic observations revealed the presence of an interstellar cloud of dust and gas, the modulation of coronal rays, the composition of cosmic ray particles, and less variation in magnetic field intensity and solar wind velocity than expected (McKibben et al., 1995).
SolO will leave the ecliptic plane by up to 30° (starting in 2025 and continuing until 2029), providing unprecedented views of these crucial but previously inaccessible regions with its remote sensing and in-situ instruments. Out-of-ecliptic images from CMEs will be a challenge for observers and modelers. Additionally, CMEs observed at various distances to the Sun and/or passing over PSP, SolO, or other spaceraft carrying in-situ instruments (e.g., Bepi Colombo; Benkhoff et al., 2021) provide unique constellations for gaining better insight into local CME structures and how these relate to the global view as the CME evolves (see, e.g., Cappello et al., 2024).
Due to the proximity to the Sun of these new-generation spacecraft, the white-light heliospheric imagers aboard PSP and SolO, namely WISPR (Vourlidas et al., 2016) and SoloHI (Howard et al., 2020), are able to capture the inner heliosphere of the Sun. In particular, during recent encounters, WISPR has predominantly captured images of the corona rather than the heliosphere. This contrasts with the heliospheric imagers (HI1 and HI2) on board the STA (HI-A; Eyles et al., 2009), which, positioned at 1 AU, feature a wider field of view (FoV) capable of observing regions much farther from the Sun. Depending on the location of the spacecraft, the FoV of WISPR or/and SoloHI may overlap with that of HI-A, but also with that of the coronagraphs aboard SOHO, STA and SolO, specifically C2-C3 (Brueckner et al., 1995), COR1-COR2 (Howard et al., 2008) and Metis (Antonucci et al., 2020). Table 1 gives a summary of instruments available over the time range spanning from January 2019 until present together with their FoV extension, in degree and solar radii, at a certain heliocentric distance.

Table 1. Summary of instruments, instrument types, FoV in degree and solar radii (
The ability of these instruments to capture heliospheric structures is further influenced by the position of observed plasma relative to the Thomson surface (Vourlidas and Howard, 2006; Lugaz et al., 2010), a spherical surface with a diameter equal to the distance between the Sun and the observer. This geometric relationship affects the way scattered light is detected, making structures appear brighter when they are closer to the Thomson sphere, where scattering is maximized. This assumption also significantly impacts parameters derived from image data, such as CME kinematics, as demonstrated in Patel et al. (2023).
Due to the highly elliptic orbits of PSP and SolO, it is essential to mention that the FoV of the various instruments changes drastically at perihelion compared to the stable FoV of HI-A. For example PSP may reach speeds at perihelion of about 180–190 km/s and, hence, moving roughly by 10° in longitude over a single day. On the contrary, STA takes about half a year to achieve the same degree of movement. As the orbital positions of SolO and PSP change rather fast, the FoVs cover either large distances from the Sun with lower cadence or smaller ones with higher cadence.
Related to that is the difference in data availability between the new-generation HIs and HI-A. While HI-A provides continuous observations, occasionally with some gaps, the new-generation HIs do not have a uniform distribution of data products due to the already mentioned limitation in telemetry. In fact, WISPR and SoloHI collect data only during perihelion or specific observation windows, which are determined by the respective working teams of each instrument. Clearly, for an efficient way to exploit these new kinds of data and detecting overlaps, a visualization is valuable for illustrating the changing FoVs and limitations in data availability. In this context, knowing where heliospheric imagers and coronagraphs are focusing their observations is particularly important. This knowledge enhances the interpretation of solar events and facilitates the effective selection of relevant data. Access to up-to-date information in online databases for each instrument is essential to validate observations and conduct detailed analyzes on various platforms.
Several tools are already available to facilitate these operations. For instance, JHelioviewer1 (Müller et al., 2017) which offers visualization of imaging data over specific time intervals. STORMS (Solar Terrestrial ObseRvations and Modeling Service; Rouillard et al., 2020) provides tools to study Heliophysics and space weather by modeling and observational data download. The Integrated Space Weather Analysis (ISWA) tool2 also enables a straightforward visualization of remote sensing and in-situ data for space weather applications. The STEREO Science Center (SSC) tool “Where is STEREO”3 and SolarMach (Gieseler et al., 2023) allow users to explore spacecraft configurations. The latter additionally analyzes the solar magnetic connectivity between Sun and spacecraft, which is useful for studying solar energetic particle events. Another interesting tool available to the community is the Propagation Tool (Rouillard et al., 2017), which is a Java interface for studying the evolution of coronal and solar wind structures, including CMEs, CIRs, and SEPs. It enables the propagation of these structures both outward from the Sun and inward from planets or spacecraft across the inner and outer Heliosphere. Additionally, the tool allows to obtain the J-maps from HI-A observations that can be used to infer the kinematics of transient events.
To further support the Heliophysics community in using remote sensing image data from multiple spacecraft fostering especially stereoscopy studies, we developed the CORonagraph and Heliospheric Imager data eXplorer (CORHI-X). This open source Python tool distinguishes itself by enabling users to explore spacecraft constellations, visualize instrument FoVs, and check the availability of data for coronagraphs and HIs. Moreover, it provides visualization of propagating CME fronts from user-defined input or from up-to-date CME catalogs. That feature facilitates selecting CMEs that might have been detected in remote sensing data and displays the positions of observatories that may have detected events in-situ.
Concluding, the output from CORHI-X maximizes information for multi-viewpoint studies on eruptive events. Unlike existing tools, CORHI-X not only shows the position of the spacecraft, but also which area of the Heliosphere the instrument covers, and identifies opportunities of overlapping FoVs between different coronagraphs and heliospheric imagers. Additionally, CORHI-X indicates when the corresponding data is available in online archives. This means that users can easily determine which events are observable and access the relevant data for download.
2 CORHI-X functionalities
2.1 Data availability from different observatories
CORHI-X provides an overview of the spacecraft constellation for a specific interval of time starting from January 2019. It plots the position of the spacecraft using the ephemerids returned by JPL HORIZONS using the sunpy routine coordinates.get_horizons_coord. The big advantage of using CORHI-X is that the FoVs are only visualized when data is available in the online archives for each spacecraft. A separate Python script runs automatically every month, querying the online archives of each instrument to check for newly available data. It retrieves the latest observation dates and stores them in separate.txt files, one for each instrument. When launched, CORHI-X downloads from a shared Drive the updated files containing the date information.
For streamlining the data availability process when querying the latest data, only archives of the STA/COR2 level 0 data (red https://stereo-ssc.nascom.nasa.gov/data/ins_data/secchi/L0/a/img/cor2/), SOHO/C2 level 0.5 data (https://lasco-www.nrl.navy.mil/lz/level_05/), Metis total brightness level 2 data (https://soar.esac.esa.int/soar/), STA/HI1-A level 2 data (https://stereo-ssc.nascom.nasa.gov/data/ins_data/secchi/L0/a/img/hi_1/), SolO/SoloHI level 2 tile 1 data (https://SolOhi.nrl.navy.mil/so_data/L2/) and the PSP/WISPR inner level 3 data (https://wispr.nrl.navy.mil/data/rel/fits/L3/) are accessed. In that respect, COR2 serves as a representative example of data availability from the coronagraphs aboard STA, while SoloHI tile 1 illustrates the data coverage for the heliospheric imager on SolO, as an example.
Since each instrument operates at a different cadence, observation dates have been adjusted to the nearest full or half hour, depending on whether they fall within 15 min before or after the specified time. This standardization is necessary to account for cadence variations among instruments. Indeed, the cadence of remote sensing instruments aboard PSP and SolO depends on both the spacecraft’s distance from the Sun and the observation modes. For example, during encounter 15 (E15), the cadence of WISPR-I ranged from 1-hour intervals at the beginning of the encounter to 7-minute intervals at the perihelion. In general, WISPR cadence decreases with greater distance from the Sun. SoloHI tiles 1 and 2 had a cadence of approximately 24 min during perihelion 8 (P8), while tiles 3 and 4 had a cadence of around 48 min. METIS cadence is strongly influenced by the observation plan, with intervals ranging from minutes to hours. Meanwhile, the cadence of other coronagraphs and heliospheric imagers remains relatively stable, with COR2 operating at approximately 15 min intervals, C2 at 12 min, and HI-A at around 40 min. However, each instrument may have specific observation plans with varying cadences depending on the science objectives.
Additionally, rounding to the nearest half hour optimizes code performance and responsiveness. Extensive testing has shown that a maximum interval of 30 min provides the most reasonable computation time for CORHI-X. Reducing the interval further would significantly slow the program down.
Figure 1 shows the number of available observations from coronagraphs and heliospheric imagers every half hour compared to monthly averaged sunspots number. In comparison to the sunspot number we see that PSP and SolO data cover well the rising to maximum activity phase of solar cycle 25. Data from WISPR and SoloHI are, at the time of writing, only available until April 2024. Therefore, the statistics performed cover the time range from 2019 to April 2024. It is important to note that while C2-C3, COR1-COR2, and HI-A provide relatively continuous observation times, WISPR operates only during specific perihelion windows. SoloHI and Metis, on the other hand, generally observe both during and outside perihelion windows during the nominal phase of the mission but may experience interruptions in data availability. In fact, data gaps in the different spacecraft is mostly related due to specific observation plans or, in some cases, instrument failures.
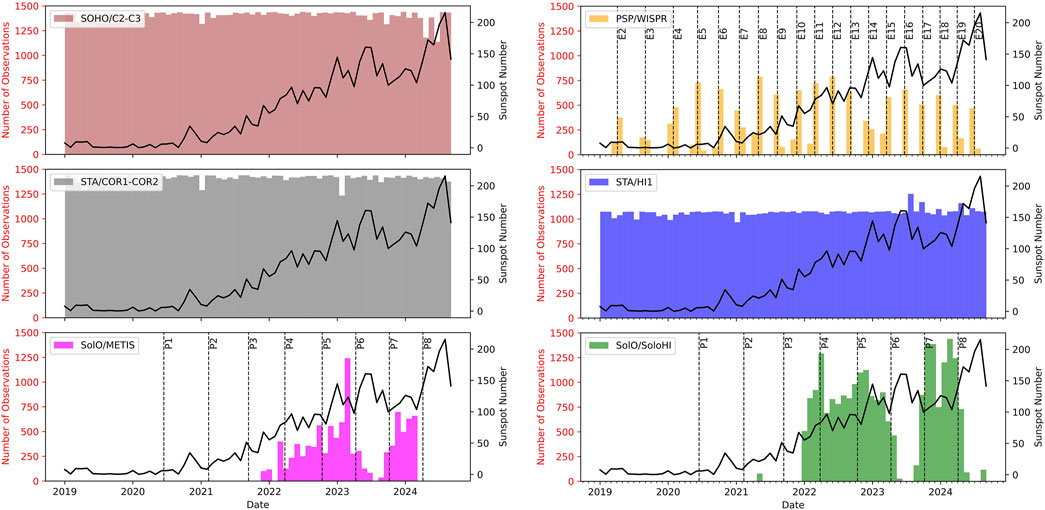
Figure 1. Data availability from different observatories at the time of manuscript writing, covering the period from January 2019 to the end of 2024, compared to the monthly mean sunspots number (black line). All observation times are rounded to the half-hour. Left panel: Number of observations performed by coronagraphs SOHO/C2-C3 (in brown), STA/COR1-COR2 (in grey), SolO/Metis (in pink). Right panel: Number of observations performed by Heliospheric Imagers: PSP/WISPR (in yellow), STA/HI-A (in blue), and SolO/SoloHI (in green). For SolO and PSP, the perihelion numbers starting from 2019 are indicated as P1–P8 and E2–E19, respectively.
2.2 Instruments FoVs and their overlaps
In CORHI-X, each FoV overlap is defined as a polygon, whose sides are measured in AU. To quantify the overlap, we calculate the area of that polygon in
Figure 2 presents a statistical analysis of FoV overlaps, starting from 2019, when different heliospheric imagers (HIs) have overlapping coverage. Only overlaps equal to or greater than 0.05
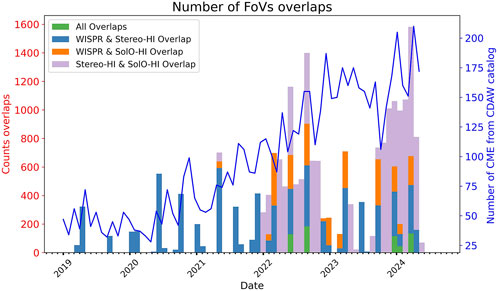
Figure 2. Number of Field-of-View (FoV) overlaps between heliospheric imagers (HIs) from 2019 onward, considering a half-hour cadence. Each count corresponds to a detected overlap at a half-hour interval. Overlaps between WISPR, HI-A, and SoloHI are shown in green; WISPR and HI-A in blue; WISPR and SoloHI in orange; and HI-A and SoloHI in purple. The blue line represents the number of CMEs over the same time interval reported by the CDAW catalog.
Specifically, Figure 3 shows two different spacecraft constellation outputs from CORHI-X: (a) 25 March 2022, 14:00 UT (e.g., Liberatore et al., 2024), and (b) 24 September 2023, 19:30 UT (e.g., Liberatore et al., 2025), where the overlap areas are 0.05

Figure 3. Example of CORHI-X spacecraft constellation and the associated observations by different HIs. In general, overlap areas equal or bigger to 0.05
2.3 Visualization of CMEs in CORHI-X using catalogs and user defined input
CORHI-X not only allows us to plot FoV overlaps for data available in the online archives but also to visualize how many transient events may have entered those FoVs. The CME information is taken from already existing catalogs or is defined by the user. Catalogs covered are the Space Weather Database Of Notifications, Knowledge, Information (DONKI),4 and the Heliospheric Imager Geometric Fitting Catalog (HIGeoCat) from the EU project HELCATS (Heliospheric cataloguing, analysis and techniques service). Sections 2.3.1, 2.3.2 provide more details on the CME input, through catalogs or self-defined parameters. Figure 4 shows an example of three different options that the user can select through different checkboxes, respectively “Plot HI-GEO/SSEF catalog,” “Plot DONKI/ELEvo catalog” and “Plot user CMEs.” For each instrument the FoV is plotted. Different shaded colors represent the overlapping regions between the various HIs, extending up to 1 AU, but only when data are available. Specifically, the overlapping FoVs between pairs of instruments (WISPR and HI-A, WISPR and SoloHI, SoloHI and HI-A) in yellow, and among all three instruments (WISPR, HI-A, and SoloHI) in green.
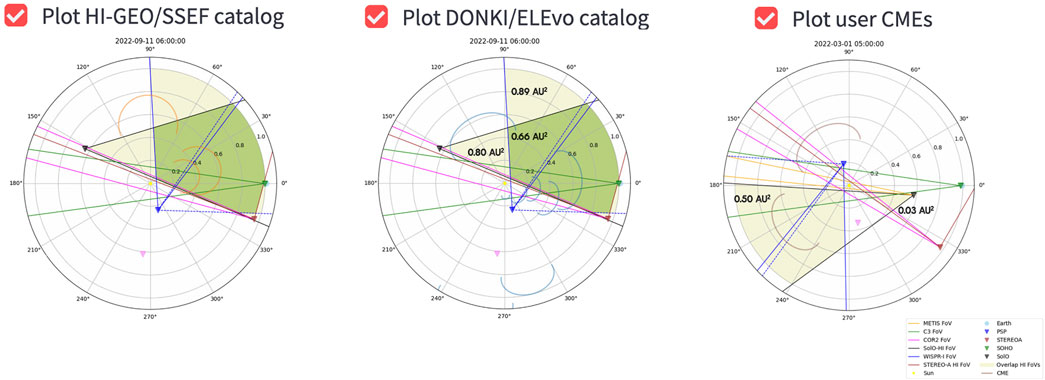
Figure 4. CORHI-X output plots derived by three different inputs on the example of the 11 September 2022 event (left and central figures) and 1 March 2022 (right figure). Left: Spacecraft constellation when the user selects the checkbox to propagate the CMEs in the HI-Geo catalog. Center: Spacecraft constellation when the user selects the checkbox to propagate the CMEs in the DONKI catalog (see Section 2.3.1). Right: Spacecraft constellation where CMEs are defined by the user (see Section 2.3.2). The area of the overlapping region (in yellow indicating overlap of two HIs’ FoVs and in green of three HIs’ FoV) is reported in
The visualization enables quickly to identify which part of the CME fluxrope might have been observed by the different instruments and supports the user in qualifying the potential of the observations for that event. In our analysis of overlapping FoV areas, we focus exclusively on heliospheric imagers rather than coronagraphs, as the former’s overlaps are generally larger and more dynamic. This is particularly true for SoloHI and WISPR, whose proximity to the Sun and rapid motion cause their FoVs to shift constantly. By analyzing FoV overlaps, the tool highlights regions where data from these imagers coincide, providing valuable insights into transient events and small-scale structures in the solar wind. Furthermore, heliospheric imaging serves as a critical link between solar imaging and in situ measurements, enhancing our understanding of solar wind evolution and its impact on space weather.
Figure 5 displays the number of times CMEs were observed within the overlapping FoVs of different instruments, using a 30-minute time cadence. To ensure that a good portion of the CME is within the overlapping FoVs we check if the apex of the CMEs contained in DONKI catalog is contained inside the overlap of two or three HIs. We notice that starting from the end of 2021, we have more transient events in the overlaps and this is due to both the increasing activity of the Sun in the ascending phase of the cycle and the increase in data availability from the HIs.
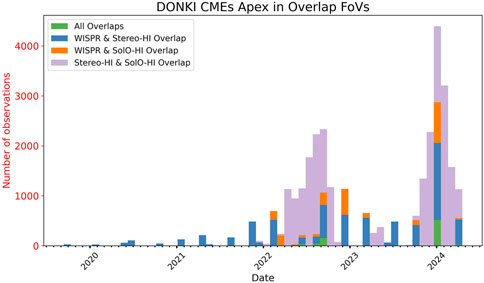
Figure 5. Number of times the apex of CMEs from the DONKI catalog was observed within the overlapping FoVs of the different HIs. All overlaps (WISPR, HI-A, SoloHI) are shown in green, WISPR and HI-A in blue, WISPR and SoloHI are orange. HI-A and SoloHI in purple.
2.3.1 CME catalogues description
The input parameters for the simulation of the CME propagation are taken from DONKI, which is provided by the Moon to Mars (M2M) Space Weather Analysis Office and hosted by the Community Coordinated Modeling Center (CCMC). The kinematic properties of the CMEs given in DONKI are derived from coronagraph observations using the CME Analysis Tool of the Space Weather Prediction Center (SWPC CAT)5 (Millward et al., 2013). The ELliptical Evolution Model (ELEvo; Möstl et al., 2015) is used to visualize the propagation of the CMEs through the heliosphere. The ELEvo model assumes an elliptical front for the CMEs and includes a simple drag-based model (Vršnak et al., 2013).
Specifically, for the propagation of the CME reported in the DONKI catalog we use an ambient solar wind speed of 450 km
2.3.2 User defined CME input
Users also have the option to input self-defined CMEs, which can be particularly useful when a CME of interest is not listed in existing catalogs or when the user wishes to define custom parameters for analysis. To facilitate this, CORHI-X allows parameter input based on the Graduated Cylindrical Shell (GCS) model (GCS; Thernisien et al., 2006). The GCS model describes the CME geometry using three key parameters:
2.4 How to operate the app
Figure 6 shows a screenshot of the CORHI-X interface with all the features embedded. Once the user starts the app through the online version or the locally installed version (see Section 2.5), the function starters collects all necessary information by downloading files in the background for the observational dates from all instruments as well as CME information from the different catalogs. The availability of these supplementary files limit the timeliness of the events and are automatically updated with a cadence of 4 weeks. A timestamp below the generated plot shows the last update of the data. With the appearance of the interface, the user may start. First step is to choose a time window of interest by defining a date and interval (in days or hours) as well as the cadence (30 min, one hour, two, six, or twelve hours). For visualization and after each change in the input parameters press the button “Generate the plots.”
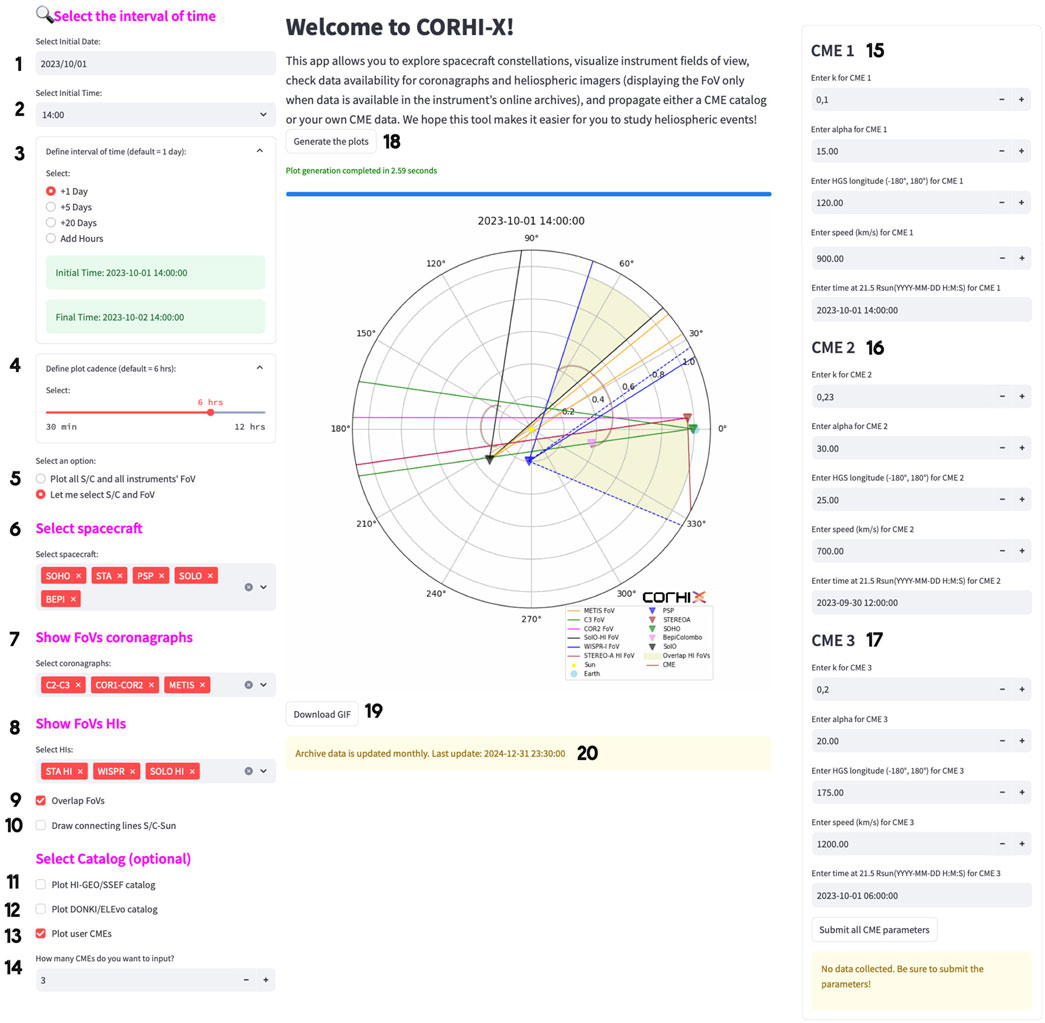
Figure 6. Basic Features of CORHI-X: (1–3) Define initial date, time, and interval. (4) Set plot cadence (e.g., 30 min, 6 h). (5) Choose between plotting all instruments/spacecraft or selecting specific spacecraft and FoVs. (6–8) Select spacecraft, coronagraph, and heliospheric imager FoVs. (9) Highlight overlapping FoVs. (10) Draw Sun-spacecraft connecting lines. (11–13) Plot CMEs from HI-Geo, DONKI catalogs, or user input. (14) Number of user CMEs. (15–17) Input CME parameters (e.g., k,
Two options are available for the visualization of the data. Either to plot the FoVs of all spacecraft and instruments simultaneously by selecting the “Plot all S/C and all instruments FoV” option, or they can select specific spacecraft and separately plot the FoVs of coronagraphs and heliospheric imagers using the “Let me select S/C and FoV” option. The user can also check the box “Overlap FoVs” in order to visualize the shaded areas in yellow and green, showing respectively the overlapping FoVs of two or three heliospheric imagers. Otherwise, if “Overlap FoVs” is not selected just the FoVs will be plotted when the data is available in the archives. In this way, the user can decide its preferred visualization. Additionally, the option “Draw connecting lines S/C-Sun” allows to show a line connecting each spacecraft to the Sun. It represents a purely geometrical connection between the spacecraft and the Sun. Highlighting their distance could be useful for the user, along with refining the estimate of which region of the Sun was centrally located in the specific FoV to determine the plane-of-sky. Importantly, this is not related to magnetic connectivity.
Finally, the user has the possibility to add CMEs by selecting a catalog with the checkboxes “Plot HI-GEO/SSEF catalog” and “Plot DONKI/ELEvo catalog” (see Section 2.3.1) or by giving a self-defined input with “Plot user CMEs” (see Section 2.3.2). Specifically, the user is first asked to input the number of CMEs to plot, and then for each CME the user will be asked to give the GCS input parameters for the kinematics calculation.
2.5 App availability
CORHI-X can be installed locally following the instructions given in the Github repository7 and archived on Zenodo.8 The repository contains the source code of the app, corhiexplorergithub.py, together with some example outputs (videos, images and gif animations), as well as the logo in different formats and colors. To run the app locally, the user must create and activate the CORHI-X environment in Python following the procedure listed on Github. Then the Python code corhiexplorergithub.py can be run, using the command: streamlit run corhiexplorergithub.py. The source code of CORHI-X uses the package Streamlit to generate a graphical interface to the Python function makeframe, which allows to produce the spacecraft constellation using the inputs selected by the user.
CORHI-X is also publicly available online through the Streamlit Cloud,9 and can be accessed online also by those users who do not want to install locally the environment’s app. In the Github page, the user will find the latest link to the online version. However, the user might experience some limitations with the online version due to the restricted computational capacity of Streamlit public apps. For this reason we strongly suggest to also install CORHI-X locally.
In both the local and online versions, updates to the observation dates of the different instruments and CME catalogs are accounted for, as these files are stored in a Cloud, which the code accesses. Therefore, whenever the app starts, it always downloads the latest files from the Cloud. All the new version updates are reported in the Github repository, and instructions are given on how to update the package in a user-friendly way.
2.6 Discussion and Outlook
We developed an streamlit app for the Heliophysics community. As discussed, CORHI-X enables users to facilitate their multi-spacecraft studies by visualizing spacecraft constellations, CME propagation, overlap between instrument FoVs, and finally data availability. By streamlining the process of finding heliospheric events, CORHI-X simplifies the analysis of solar phenomena, making it an invaluable resource for researchers looking to enhance their understanding of solar dynamics and exploit efficiently multi-instrument studies.
In the future, new features could be included. For example:
(1) Covering in-situ measurements for linking CMEs detected in image data and their locally measured plasma and magnetic field parameters. In fact, information derived from remote sensing image data are often combined with in-situ measurements providing insights into the relationship between large-scale properties of CMEs and localized plasma as well as magnetic field characteristics.
(2) Extension to its 3D view. Specifically, as SolO goes out of the ecliptic, a 3D version of CORHI-X is planned to cover information from the meridional plane.
(3) Preview of white light data observatories, especially when an overlapping FoV between at least two of them exist, might be included to facilitate the user experience in the event selection. In this regard, further analysis tools for image processing might be integrated in CORHI-X. For example, the Python package SITCoM (Udhwani et al., 2023) that uses a simple radial gradient filter in the white light coronagraph images in order to highlight dynamic structures.
(4) Inclusion of other catalogues of CMEs (in-situ and remote sensing) depending on the needs and requests of the users. For example, the HELIO4CAST catalog (Möstl et al., 2017; 2020) lists interplanetary coronal mass ejections (ICMEs) based on in situ magnetic field and bulk plasma observations in the heliosphere. The SOHO LASCO CME Catalog (Gopalswamy et al., 2024) contains manually identified CMEs from the Large Angle and Spectrometric Coronagraph (LASCO) aboard SOHO since 1996, while the LLAMACoRe (Kay and Palmerio, 2024) catalog compiles multiple 3D GCS reconstruction parameters of CMEs found in the literature.
(5) Incorporate recent/future space missions equipped with coronagraphs and heliospheric imagers in CORHI-X. For example:
(i) Aditya-L1 (launched in September 2023, Seetha and Megala (2017)) is India’s first space-based solar observatory, providing continuous observations of the Sun from the first Lagrangian point (L1). Among its remote sensing instruments, it includes the Visible Emission Line Coronagraph (VELC) which images the Corona from 1.05 to 3
(ii) GOES-19 (Geostationary Operational Environmental Satellite) launched in June 2024, which includes the CCOR (Compact Coronagraph),10 providing continuous observations of the solar corona, particularly in the context of space weather monitoring and forecasting.
(iii) PROBA-3 (launched in December 2024; Shestov et al. (2021)), carrying the ASPIICS (Association of Spacecraft for Polarimetric and Imaging Investigation of the Corona of the Sun; Renotte et al. (2014)) coronagraph, designed for high-resolution observations of the solar corona through an externally occulted setup (Shestov et al., 2021).
(iv) PUNCH (Polarimeter to UNify the Corona and Heliosphere, Deforest et al., 2022), a NASA mission launched in March 2025 consisting of four small satellites in Earth orbit to bridge the observational gap between the corona and heliosphere. From a remote-sensing perspective, one of the four satellites is equipped with the Narrow Field Imager (NFI), while the remaining three with the Wide Field Imager (WFI).
(v) Vigil,11 a future ESA mission planned for launch in 2031 that will enhance heliospheric monitoring with its onboard Heliospheric Imager (HI) and Compact Coronagraph (CC), contributing continuous observations for space weather forecasting from the Sun–Earth Lagrange 5 point.
These missions will provide crucial data that can be integrated into CORHI-X, improving its capability to analyze and model CME propagation with enhanced spatial and temporal coverage.
Data availability statement
The datasets presented in this study can be found in online repositories. The names of the repository/repositories and accession number(s) can be found below: https://github.com/gretacappello/CORHI_X and https://zenodo.org/records/14803010.
Author contributions
GC: Conceptualization, Formal Analysis, Methodology, Project administration, Resources, Software, Validation, Visualization, Writing – original draft, Writing – review and editing. MT: Project administration, Supervision, Validation, Writing – original draft, Writing – review and editing. EW: Software, Validation, Visualization, Writing – review and editing. AL: Conceptualization, Validation, Writing – review and editing. CM: Software, Validation, Visualization, Writing – review and editing. TA: Software, Validation, Visualization, Writing – review and editing.
Funding
The author(s) declare that financial support was received for the research and/or publication of this article. GC and MT acknowledge support from the Young Researchers Program (YRP), project number AVO165300016. EW and CM are funded by the European Union (ERC, HELIO4CAST, 101042188). Neither the European Union nor the granting authority can be held responsible for them. This research was funded in whole or in part by the Austrian Science Fund (FWF) [10.55776/P36093]. For open access purposes, the author has applied a CC BY public copyright license to any author-accepted manuscript version arising from this submission. The authors acknowledge the financial support by the University of Graz.
Acknowledgments
Parker Solar Probe was designed, built, and is now operated by the Johns Hopkins Applied Physics Laboratory as part of NASA’s Living with a Star (LWS) program (contract NNN06AA01C). Support from the LWS management and technical team has played a critical role in the success of the Parker Solar Probe mission. The Wide-Field Imager for Parker Solar Probe (WISPR) instrument was designed, built, and is now operated by the US Naval Research Laboratory in collaboration with Johns Hopkins University/Applied Physics Laboratory, California Institute of Technology/Jet Propulsion Laboratory, University of Gottingen, Germany, Centre Spatiale de Liege, Belgium and University of Toulouse/Research Institute in Astrophysics and Planetology. The SECCHI data are produced by an international consortium of the NRL, LMSAL, and NASA GSFC (USA), RAL and U. Bham (UK), MPS (Germany), CSL (Belgium), IOTA, and IAS (France). The SOHO/LASCO data used here are produced by a consortium of the Naval Research Laboratory (USA), Max-Planck-Institut fuer Aeronomie (Germany), Laboratoire d’Astronomie (France), and the University of Birmingham (UK). SOHO is a project of international cooperation between ESA and NASA. SUVI was designed and built at Lockheed-Martin’s Advanced Technology Center in Palo Alto, California. Solar Orbiter is a space mission of international collaboration between ESA and NASA, operated by ESA. Metis was built and operated with funding from the Italian Space Agency (ASI), under contracts to the National Institute of Astrophysics (INAF) and industrial partners. Metis was built with hardware contributions from Germany (Bundesministerium für Wirtschaft und Energie through DLR), from the Czech Republic (PRODEX) and from ESA. The Solar Orbiter Heliospheric Imager (SoloHI) instrument was designed, built, and is now operated by the US Naval Research Laboratory with the support of the NASA Heliophysics Division, Solar Orbiter Collaboration Office under DPR NNG09EK11I. The NRL effort was also supported by the Office of Naval Research. We acknowledge the Community Coordinated Modeling Center (CCMC) at Goddard Space Flight Center for the use of the Space Weather Database Of Notifications, Knowledge, Information (DONKI) https://kauai.ccmc.gsfc.nasa.gov/DONKI/ and the Space Weather Prediction Center CME Analysis Tool (SWPC CAT) https://ccmc.gsfc.nasa.gov/tools/SWPC-CAT/.
Conflict of interest
The authors declare that the research was conducted in the absence of any commercial or financial relationships that could be construed as a potential conflict of interest.
Generative AI statement
The author(s) declare that no Generative AI was used in the creation of this manuscript.
Publisher’s note
All claims expressed in this article are solely those of the authors and do not necessarily represent those of their affiliated organizations, or those of the publisher, the editors and the reviewers. Any product that may be evaluated in this article, or claim that may be made by its manufacturer, is not guaranteed or endorsed by the publisher.
Author disclaimer
Views and opinions expressed are however those of the author(s) only and do not necessarily reflect those of the European Union or the European Research Council Executive Agency.
Footnotes
2https://iswa.ccmc.gsfc.nasa.gov/IswaSystemWebApp/
3https://stereo-ssc.nascom.nasa.gov/cgi-bin/make_where_gif
4https://kauai.ccmc.gsfc.nasa.gov/DONKI.
5https://ccmc.gsfc.nasa.gov/tools/SWPC-CAT.
6https://www.helcats-fp7.eu/catalogues/wp3_cat.html
7https://github.com/gretacappello/CORHI_X. This manuscript uses the version v1.2 of CORHI-X.
8https://doi.org/10.5281/zenodo.14970674. gretacappello_2025_14970674.
9https://corhix.streamlit.app/
10https://www.goes-r.gov/spacesegment/CCOR.html
11https://www.esa.int/Space_Safety/Vigil/Vigil_mission_overview
References
Antonucci, E., Romoli, M., Andretta, V., Fineschi, S., Heinzel, P., Moses, J. D., et al. (2020). Metis: the Solar Orbiter visible light and ultraviolet coronal imager. Astron. Astrophys. 642, A10. doi:10.1051/0004-6361/201935338
Barnes, D., Davies, J. A., Harrison, R. A., Byrne, J. P., Perry, C. H., Bothmer, V., et al. (2019). CMEs in the Heliosphere: II. A statistical analysis of the kinematic properties derived from single-spacecraft geometrical modelling techniques applied to CMEs detected in the heliosphere from 2007 to 2017 by STEREO/HI-1. Sol. Phys. 294, 57. doi:10.1007/s11207-019-1444-4
Bemporad, A., Andretta, V., Susino, R., Mancuso, S., Spadaro, D., Mierla, M., et al. (2022). Coronal mass ejection followed by a prominence eruption and a plasma blob as observed by Solar Orbiter. Astron. Astrophys. 665, A7. doi:10.1051/0004-6361/202243162
Benkhoff, J., Murakami, G., Baumjohann, W., Besse, S., Bunce, E., Casale, M., et al. (2021). BepiColombo - mission overview and science goals. Space Sci. Rev. 217, 90. doi:10.1007/s11214-021-00861-4
Brueckner, G. E., Howard, R. A., Koomen, M. J., Korendyke, C. M., Michels, D. J., Moses, J. D., et al. (1995). The large angle spectroscopic coronagraph (LASCO). Sol. Phys. 162, 357–402. doi:10.1007/BF00733434
Cappello, G. M., Temmer, M., Vourlidas, A., Braga, C., Liewer, P. C., Qiu, J., et al. (2024). Internal magnetic field structures observed by PSP/WISPR in a filament-related coronal mass ejection. Astron. Astrophys. 688, A162. doi:10.1051/0004-6361/202449613
CappelloG. M. (2025). gretacappello/corhi_x: corhi-x v1.1 version. Zenodo. doi:10.5281/zenodo.14970674
Davies, E. E., Rüdisser, H. T., Amerstorfer, U. V., Möstl, C., Bauer, M., Weiler, E., et al. (2024). Flux Rope Modeling of the 2022 September 5 Coronal Mass Ejection Observed by Parker Solar Probe and Solar Orbiter from 0.07 to 0.69 au. 973, 51. doi:10.3847/1538-4357/ad64cb
Davies, J. A., Perry, C. H., Trines, R. M. G. M., Harrison, R. A., Lugaz, N., Möstl, C., et al. (2013). Establishing a stereoscopic technique for determining the kinematic properties of solar wind transients based on a generalized self-similarly expanding circular geometry. Astrophysical J. 777, 167. doi:10.1088/0004-637X/777/2/167
Deforest, C., Killough, R., Gibson, S., Henry, A., Case, T., Beasley, M., et al. (2022). “Polarimeter to UNify the corona and heliosphere (PUNCH): science, status, and path to Flight,” in 2022 IEEE aerospace conference, 1–11. doi:10.1109/AERO53065.2022.9843340
Domingo, V., Fleck, B., and Poland, A. I. (1995). The SOHO mission: an overview. Sol. Phys. 162, 1–37. doi:10.1007/bf00733425.1D
Eyles, C. J., Harrison, R. A., Davis, C. J., Waltham, N. R., Shaughnessy, B. M., Mapson-Menard, H. C. A., et al. (2009). The heliospheric imagers onboard the STEREO mission. Sol. Phys. 254, 387–445. doi:10.1007/s11207-008-9299-0
Fox, N. J., Velli, M. C., Bale, S. D., Decker, R., Driesman, A., Howard, R. A., et al. (2016). The solar probe plus mission: humanity’s first visit to our star. Space Sci. Rev. 204, 7–48. doi:10.1007/s11214-015-0211-6
García Marirrodriga, C., Pacros, A., Strandmoe, S., Arcioni, M., Arts, A., Ashcroft, C., et al. (2021). Solar orbiter: mission and spacecraft design. Astron. Astrophys. 646, A121. doi:10.1051/0004-6361/202038519
Gieseler, J., Dresing, N., Palmroos, C., Freiherr von Forstner, J. L., Price, D. J., Vainio, R., et al. (2023). Solar-MACH: an open-source tool to analyze solar magnetic connection configurations. Front. Astronomy Space Sci. 9, 384. doi:10.3389/fspas.2022.1058810
Good, S. W., Forsyth, R. J., Eastwood, J. P., and Möstl, C. (2018). Correlation of ICME magnetic fields at radially aligned spacecraft. Sol. Phys. 293, 52. doi:10.1007/s11207-018-1264-y
Gopalswamy, N., Michałek, G., Yashiro, S., Mäkelä, P., Akiyama, S., Xie, H., et al. (2024). The SOHO LASCO CME catalog – version 2. arXiv e-prints, arXiv. doi:10.48550/arXiv.2407.04165
Hess, P., Colaninno, R. C., Vourlidas, A., Howard, R. A., and Stenborg, G. (2023). SoloHI observations of coronal mass ejections observed by multiple spacecraft. Astron. Astrophys. 679, A149. doi:10.1051/0004-6361/202346907
Howard, R. A., Moses, J. D., Vourlidas, A., Newmark, J. S., Socker, D. G., Plunkett, S. P., et al. (2008). Sun Earth connection coronal and heliospheric investigation (SECCHI), 136, 67–115. doi:10.1007/978-0-387-09649-0_5
Howard, R. A., Vourlidas, A., Colaninno, R. C., Korendyke, C. M., Plunkett, S. P., Carter, M. T., et al. (2020). The solar orbiter heliospheric imager (SoloHI). Astron. Astrophys. 642, A13. doi:10.1051/0004-6361/201935202
Kaiser, M. L., Kucera, T. A., Davila, J. M., St. Cyr, O. C., Guhathakurta, M., and Christian, E. (2008). The STEREO mission: an introduction. Space Sci. Rev. 136, 5–16. doi:10.1007/s11214-007-9277-0
Kay, C., and Palmerio, E. (2024). Collection, collation, and comparison of 3D coronal CME reconstructions. Space weather. 22, e2023SW003796. doi:10.1029/2023SW003796
Liberatore, A., Liewer, P. C., Temmer, M., Cappello, G. M., De Leo, Y., and Penteado, P. (2025). Analysis of CME interactions in solar corona combining coronagraphic observations with wide-field imagers from solar orbiter and parker solar probe. ApJ. doi:10.3847/1538-4357
Liberatore, A., Braga, C. R., Temmer, M., Cappello, G. M., Telloni, D., Liewer, P. C., et al. (2024). Challenges in forecasting the evolution of a distorted CME observed during the first close solar orbiter perihelion. Astrophys. J. 970, 81. doi:10.3847/1538-4357/ad5003
Lugaz, N., Hernandez-Charpak, J. N., Roussev, I. I., Davis, C. J., Vourlidas, A., and Davies, J. A. (2010). Determining the azimuthal properties of coronal mass ejections from multi-spacecraft remote-sensing observations withstereosecchi. Remote-Sensing Observations STEREO SECCHI 715, 493–499. doi:10.1088/0004-637X/715/1/493
McKibben, R. B., Simpson, J. A., Zhang, M., Bame, S., and Balogh, A. (1995). ULYSSES out-of-ecliptic observations of “27-day” variations in high energy cosmic ray intensity. Space Sci. Rev. 72, 403–408. doi:10.1007/BF00768812
Mierla, M., Zhukov, A. N., Berghmans, D., Parenti, S., Auchère, F., Heinzel, P., et al. (2022). Prominence eruption observed in He II 304 Å up to >6 R⊙ by EUI/FSI aboard Solar Orbiter. Astron. Astrophys. 662, L5. doi:10.1051/0004-6361/202244020
Millward, G., Biesecker, D., Pizzo, V., and de Koning, C. A. (2013). An operational software tool for the analysis of coronagraph images: determining CME parameters for input into the WSA-Enlil heliospheric model. Space weather. 11, 57–68. doi:10.1002/swe.20024
Möstl, C., Isavnin, A., Boakes, P. D., Kilpua, E. K. J., Davies, J. A., Harrison, R. A., et al. (2017). Modeling observations of solar coronal mass ejections with heliospheric imagers verified with the Heliophysics System Observatory. Space weather. 15, 955–970. doi:10.1002/2017SW001614
Möstl, C., Rollett, T., Frahm, R. A., Liu, Y. D., Long, D. M., Colaninno, R. C., et al. (2015). Strong coronal channelling and interplanetary evolution of a solar storm up to Earth and Mars. Nat. Commun. 6, 7135. doi:10.1038/ncomms8135
Möstl, C., Weiss, A. J., Bailey, R. L., Reiss, M. A., Amerstorfer, T., Hinterreiter, J., et al. (2020). Prediction of the in situ coronal mass ejection rate for solar cycle 25: implications for parker solar probe in situ observations. Astrophys. J. 903, 92. doi:10.3847/1538-4357/abb9a1
Müller, D., Nicula, B., Felix, S., Verstringe, F., Bourgoignie, B., Csillaghy, A., et al. (2017). JHelioviewer. Time-dependent 3D visualisation of solar and heliospheric data. Astron. Astrophys. 606, A10. doi:10.1051/0004-6361/201730893
Müller, D., St. Cyr, O. C., Zouganelis, I., Gilbert, H. R., Marsden, R., Nieves-Chinchilla, T., et al. (2020). The solar orbiter mission. Sci. Overv. 642, A1. doi:10.1051/0004-6361/202038467
Pal, S., Dash, S., and Nandy, D. (2020). Flux erosion of magnetic clouds by reconnection with the Sun’s open flux. Geophys. Res. Lett. 47, e86372. doi:10.1029/2019GL086372
Palmerio, E., Carcaboso, F., Khoo, L. Y., Salman, T. M., Sánchez-Cano, B., Lynch, B. J., et al. (2024). On the mesoscale structure of coronal mass ejections at mercury’s orbit: BepiColombo and parker solar probe observations. Astrophys. J. 963, 108. doi:10.3847/1538-4357/ad1ab4
Patel, R., West, M. J., Seaton, D. B., Hess, P., Niembro, T., and Reeves, K. K. (2023). The closest view of a fast coronal mass ejection: how faulty assumptions near perihelion lead to unrealistic interpretations of PSP/WISPR observations. Astrophys. J. Lett. 955, L1. doi:10.3847/2041-8213/acf2f0
Pesnell, W. D., Thompson, B. J., and Chamberlin, P. C. (2012). The solar dynamics observatory (SDO). Sol. Phys. 275, 3–15. doi:10.1007/s11207-011-9841-3
Raouafi, N. E., Matteini, L., Squire, J., Badman, S., Velli, M., Klein, K., et al. (2023). Parker solar probe: four years of discoveries at solar cycle minimum. Space Sci. Rev. 219, 8. doi:10.1007/s11214-023-00952-4
Renotte, E., Baston, E. C., Bemporad, A., Capobianco, G., Cernica, I., Darakchiev, R., et al. (2014). “ASPIICS: an externally occulted coronagraph for PROBA-3: design evolution,” in Space telescopes and instrumentation 2014: optical, infrared, and millimeter wave. Editors J. M. OschmannJr., M. Clampin, G. G. Fazio, and H. A. MacEwen (Society of Photo-Optical Instrumentation Engineers (SPIE) Conference Series), 9143. doi:10.1117/12.2056784
Rouillard, A. P., Lavraud, B., Génot, V., Bouchemit, M., Dufourg, N., Plotnikov, I., et al. (2017). A propagation tool to connect remote-sensing observations with in-situ measurements of heliospheric structures. 147, 61–77. doi:10.1016/j.pss.2017.07.001
Rouillard, A. P., Pinto, R. F., Vourlidas, A., De Groof, A., Thompson, W. T., Bemporad, A., et al. (2020). Models and data analysis tools for the Solar Orbiter mission. Astron. Astrophys. 642, A2. doi:10.1051/0004-6361/201935305
Seetha, S., and Megala, S. (2017). Aditya-L1 mission. Curr. Sci. 113, 610. doi:10.18520/cs/v113/i04/610-612
Shestov, S. V., Zhukov, A. N., Inhester, B., Dolla, L., and Mierla, M. (2021). Expected performances of the PROBA-3/ASPIICS solar coronagraph: simulated data. Astron. Astrophys. 652, A4. doi:10.1051/0004-6361/202140467
Temmer, M., Rollett, T., Möstl, C., Veronig, A. M., Vršnak, B., and Odstrčil, D. (2011). Influence of the ambient solar wind flow on the propagation behavior of interplanetary coronal mass ejections. 743, 101. doi:10.1088/0004-637X/743/2/101
Thernisien, A. F. R., Howard, R. A., and Vourlidas, A. (2006). Modeling of flux rope coronal mass ejections. Astrophys. J. 652, 763–773. doi:10.1086/508254
Udhwani, P., Shrivastav, A. K., and Patel, R. (2023). SITCoM: SiRGraF integrated tool for coronal dynaMics. Front. Astronomy Space Sci. 10, 1227872. doi:10.3389/fspas.2023.1227872
Upton, L. A., and Hathaway, D. H. (2023). Solar cycle precursors and the outlook for cycle 25. J. Geophys. Res. Space Phys. 128, e2023JA031681. doi:10.1029/2023JA031681
Vourlidas, A., and Howard, R. A. (2006). The proper treatment of coronal mass ejection brightness: a new methodology and implications for observations. Astrophys. J. 642, 1216–1221. doi:10.1086/501122
Vourlidas, A., Howard, R. A., Plunkett, S. P., Korendyke, C. M., Thernisien, A. F. R., Wang, D., et al. (2016). The wide-field imager for solar probe plus (WISPR). Space Sci. Rev. 204, 83–130. doi:10.1007/s11214-014-0114-y
Vršnak, B., Žic, T., Vrbanec, D., Temmer, M., Rollett, T., Möstl, C., et al. (2013). Propagation of interplanetary coronal mass ejections: the drag-based model. Model 285, 295–315. doi:10.1007/s11207-012-0035-4
Keywords: Sun, Coronal Mass Ejections (CMEs), Heliosphere, drag-based model, multi-viewpoint observations, spacecraft constellation, heliospheric imagers, coronagraphs
Citation: Cappello GM, Temmer M, Weiler E, Liberatore A, Möstl C and Amerstorfer T (2025) CORHI-X: a Python tool to investigate heliospheric events through multiple observation angles and heliocentric distances. Front. Astron. Space Sci. 12:1571024. doi: 10.3389/fspas.2025.1571024
Received: 04 February 2025; Accepted: 24 March 2025;
Published: 16 April 2025.
Edited by:
Nicole Vilmer, Centre National de la Recherche Scientifique (CNRS), FranceReviewed by:
Ritesh Patel, Southwest Research Institute Boulder, United StatesAdam James Finley, Université Paris-Saclay, France
Copyright © 2025 Cappello, Temmer, Weiler, Liberatore, Möstl and Amerstorfer. This is an open-access article distributed under the terms of the Creative Commons Attribution License (CC BY). The use, distribution or reproduction in other forums is permitted, provided the original author(s) and the copyright owner(s) are credited and that the original publication in this journal is cited, in accordance with accepted academic practice. No use, distribution or reproduction is permitted which does not comply with these terms.
*Correspondence: Greta M. Cappello, Z3JldGEuY2FwcGVsbG9AdW5pLWdyYXouYXQ=