 Denny M. Oliveira
 Eftyhia Zesta
 Katherine Garcia-Sage
- 1Goddard Planetary Heliophysics Institute, University of Maryland, Baltimore County, Baltimore, MD, United States
- 2Heliophysics Science Division, NASA Goddard Space Flight Center, Greenbelt, MD, United States
The exponential increase of low-Earth orbit (LEO) satellites in the past 5 years has brought into intense focus the need for reliable monitoring and reentry prediction to safeguard from space collisions and ground debris impacts. However, LEO satellites fly within the upper atmosphere region that exerts significant drag forces to their orbits, reducing their lifetimes, and increasing collision risks during dynamic events, like geomagnetic storms. Such conditions can become more severe during geomagnetic storms, particularly during extreme events. In this work, we use two-line element (TLE) satellite tracking data to investigate geomagnetic activity effects on the reentries of 523 Starlink satellites from 2020 to 2024. This period coincides with the rising phase of solar cycle 25, which has shown itself to be more intense than the previous solar cycle. We derive satellite altitudes and velocities from TLE files and perform a superposed epoch analysis, the first with hundreds of similar satellites. Even with limitedly accurate TLE data, our results indisputably show that satellites reenter faster with higher geomagnetic activity. This is explained by the fastest orbital decay rates (in km/day) of the satellites caused by increased drag forces. We also find that prediction errors, defined as the difference between the epochs of actual reentries and predicted reentries at reference altitudes, increase with geomagnetic activity. As a result, we clearly show that the intense solar activity of the current solar cycle has already had significant impacts on Starlink reentries. This is a very exciting time in satellite orbital drag research, since the number of satellites in LEO and solar activity are the highest ever observed in human history.
1 Introduction
From the launch of Sputnik 1 in 1957, the first artificial satellite by the Soviet Union, the history of satellites in space has been marked by rapid technological advancements and significant geopolitical impacts. Sputnik’s success triggered the space race between the United States and the Soviet Union, culminating in the creation of the first communications satellites, weather satellites, and reconnaissance satellites throughout the Cold War (Cruddas, 2019). In the decades that followed, satellite technology evolved to support global communication, scientific research, and the launch of GPS satellites revolutionized navigation. In the 21st century, private companies like SpaceX, with its Starlink mega-constellation, have redefined the role of satellites by developing massive, low-Earth orbit (LEO) networks to provide global internet access (Ren et al., 2022). This era represents a shift from government-driven space exploration to commercial innovation, illustrating how satellites have transitioned from a strategic military tool to an integral part of everyday life, connecting the world in ways once imagined only in science fiction (Moltz, 2019).
The Kessler Syndrome, suggested by Kessler and Cour-Palais (1978), describes a self-perpetuating cascade of satellite collisions in LEO, where the impact of one satellite or piece of debris generates additional fragments. These fragments, traveling at high speeds, can collide with other objects, creating even more debris. If this cycle continues, it will exponentially increase the number of debris in orbit, making space more hazardous for satellites and spacecraft. The critical threshold is reached when the density of debris becomes high enough that collisions occur frequently, leading to a dangerous feedback loop. As a result, the Kessler Syndrome could make certain regions of space, particularly LEO, increasingly unusable for future satellites and space missions, severely impacting operational, exploratory, and commercial activities (Boley and Byers, 2021; Witze, 2022). Therefore, being able to predict such collisions to avoid further debris generation in LEO is a very important space weather research topic with significant societal impacts (Bruinsma et al., 2021; Parker and Linares, 2024), particularly during extreme geomagnetic conditions (Oliveira et al., 2021).
Geomagnetic storms, which are disturbances in Earth’s magnetic field caused by solar wind perturbations like coronal mass ejections (CMEs), can significantly heat the upper atmosphere, particularly in LEO (Fuller-Rowell et al., 1994; Prölss, 2011; Emmert, 2015). When charged particles from the solar wind interact with Earth’s magnetosphere, they intensify electric currents in the ionosphere which enhance levels of collisions between ionospheric plasma and thermospheric neutral atoms and molecules. The additional kinetic energy is locally dissipated as Joule heating (Fedrizzi et al., 2012; Kalafatoglu Eyiguler et al., 2019), making the thermosphere become denser and upwell to altitudes where satellites orbit (Liu et al., 2005; Prölss, 2011). Solar radiation affects thermosphere neutral mass density by increasing temperature and causing atmospheric expansion, which leads to higher density at a given altitude (Emmert, 2015). During periods of high solar activity, enhanced extreme ultraviolet (EUV) and X-ray radiation increase ionization and heating, further amplifying density variations (Qian et al., 2011; Emmert, 2015). Thermospheric neutral mass density is directly associated with drag acceleration, which is naturally linked to increased drag forces on satellites (Sutton et al., 2005; Calabia and Jin, 2017; Bruinsma et al., 2023). This heightened atmospheric density results in greater orbital drag on satellites, as they experience increased resistance from the denser and hotter thermosphere (Prieto et al., 2014; Oliveira and Zesta, 2019; Krauss et al., 2020). Geomagnetic storms lead to variations in the satellite’s orbit, as the increased atmospheric drag can change the satellite’s velocity and altitude over time. This effect is particularly pronounced for satellites in very-low Earth orbits (VLEO, usually considered to be bellow 300 km), where the atmosphere is denser, and the drag force is more significant. Consequently, geomagnetic storms can shorten a satellite’s operational lifespan, increase fuel consumption for orbital maintenance, and complicate mission planning and reentering.
In February 2022, nearly 40 Starlink satellites reentered Earth’s atmosphere before reaching their intended operational altitude (500–600 km) due to a combination of a few factors. First, the satellites were deployed to a low altitude (210 km) before thrusters were expected to boost up the satellites (Hapgood et al., 2022). Second, Starlink CONOPs (Concepts of Operations) required that the satellites’ solar panels kept pointing toward the Sun (Mallama and Cole, 2024), thus increasing drag. Third, the satellites were deployed while a minor geomagnetic storm was raging on. Consequently, that storm contributed to the increase of the local neutral mass density, which subsequently amplified drag forces even further (Fang et al., 2022; Berger et al., 2023; Baruah et al., 2024). As demonstrated by Fang et al. (2022), the thermosphere density underwent an increase of nearly 50% in comparison to density values before the storm. For these reasons, the satellites decayed faster than anticipated. As a result, the satellites were prevented from using their fuel to raise their orbits as planned, resulting in their loss before they could reach their operational altitudes. Thus, having better reentry predictions can greatly improve operational decisions at VLEO and aid in the planning of controlled reentries of artificial space objects.
In this work, we follow on the work provided by Oliveira et al. (2025), who performed a case study using orbital tracking data of four Starlink satellites reentering during different geomagnetic conditions. The authors noted that, the more intense the geomagnetic condition, the faster the satellite orbital decay rate (in km/day). Oliveira et al. (2025) also noted that reentry prediction errors were higher during more intense geomagnetic conditions. Here, we use similar Starlink orbital data to perform a superposed epoch analysis of orbital altitudes and velocities in order to identify impacts caused by storms with different intensities. The Starlink reentries coincide with the rising phase of solar cycle (SC) 25, a period with increasing solar activity. By confirming the case study of Oliveira et al. (2025), we highlight the importance of accurately predicting and tracking satellite reentries during storm times, particularly during severe geomagnetic storms. Improving such capabilities is of paramount importance to avoid the triggering of the Kessler syndrome which could make satellite traffic in LEO nearly inoperable. This study, with hundreds of similar satellites, is the first of its kind. Our work points the way for determining continuous prediction of reentry time and place based on geomagnetic conditions.
2 Materials and methods
2.1 Solar activity
Solar activity is represented by the F10.7 solar radiation index (Tapping, 2013). F10.7 represents the flux density of solar radio emissions at a wavelength of 10.7 cm, measured in solar flux units (sfu), where 1 sfu =
2.2 Geomagnetic activity
Geomagnetic activity is represented by the storm-time, 1-h Dst index (World Data Center for Geomagnetism, Kyoto et al., 2015). According to World Data Center for Geomagnetism, Kyoto et al., 2015, the real-time Dst index provides quick, preliminary values of geomagnetic storm activity with minimal data processing, making it slightly less accurate than its final version. The provisional Dst index is more refined, with some error corrections applied, but is still subject to further adjustments. The final Dst index is the most accurate, as it undergoes extensive quality control, calibration, and correction, providing the most reliable data for scientific analysis after a storm. The time span of our analysis covers all versions of Dst data: final (2020), provisional (2021–2023), and real-time/quick-look (2024).
2.3 Satellite orbital parameters
Satellite orbital information is extracted from Two-Line Element (TLE) data files. TLE data files are a standard format used to represent the orbital parameters of artificial satellites and other objects in space. Each TLE consists of two lines of data, with the first line containing information about the satellite’s identification, classification, and epoch (the specific time at which the orbital parameters were valid), while the second line includes key orbital elements like inclination, eccentricity, altitude, and the satellite’s position and velocity in its orbit (Kizner and Belotserkovskiy, 2005). TLEs are updated regularly, usually every few days, to reflect changes in the satellite’s orbit due to gravitational forces, atmospheric drag, or maneuvers. These data files are widely used to track satellites, predict passes, and monitor space debris. The format is compact and machine-readable, making it ideal for quick computation of satellite positions and orbits.
TLE data is downloaded from space-track.org, a website that provides free access to satellite data. The platform is maintained by the U.S. Department of Defense and offers real-time tracking data, including information on active satellites, debris, reentry predictions, and other objects in Earth’s orbit. Access requires creating a free account.
The Python package PyEphem is used to determine positions (altitudes, latitudes, and longitudes) and velocities from TLE data. PyEphem provides a simple and efficient way to extract orbital information from TLE data files, allowing users to compute satellite positions and track objects in orbit. PyEphem uses the TLE format to initialize a satellite object, parsing the two lines of data into orbital parameters such as inclination, eccentricity, right ascension of the ascending node, and perigee. The package then applies the SGP4 (Simplified General Perturbation Model 4) algorithm to propagate the satellite’s orbit over time, accounting for various gravitational forces and orbital perturbations (Acciarini et al., 2025). Once the TLE data is loaded and processed, PyEphem can provide the satellite’s position (in terms of azimuth, elevation, or geodetic coordinates) for any given time, enabling predictions of satellite passes or orbital changes. This makes PyEphem an invaluable tool for satellite tracking, astronomy, and space-related research.
In a TLE file, the mean motion
where
In this paper, we consider a satellite (or its remaining debris) reenters from VLEO when it crosses the Kármán line at 100 km altitude, commonly considered an altitude threshold from satellites reentering from outer space into the terrestrial atmosphere (von Kármán, 1956; McDowell, 2018). However, in most cases, the altitude of the last epoch of a given satellite is in the interval 180–140 km. For this reason, we use PyEphem to propagate the satellite’s altitude in time until it crosses the Kármán line. Most of the altitudes are propagated in time intervals within 1 day from the last TLE epoch. Then, we use Newtonian mechanics to estimate the satellites’ velocity according to Equation 2:
with
2.4 Superposed epoch analysis parameters
2.4.1 Zero-epoch time
A zero-epoch time for each reentry is chosen when the satellite commences its sharper decay. This reference altitude is taken as close to 280 km altitude as possible, and it is usually between 260 km and 320 km. The zero-epoch altitude is based on the inspection of altitudes during Starlink reentries under intense and severe geomagnetic conditions. An example will be shown later. Figure 2 of Oliveira et al. (2025) also shows a few more examples.
2.4.2 Tracking and impact prediction (TIP) messages
A TIP message provides epoch information of the most accurate reentry epoch. According to space-track.org, TIP messages begin to be issued a few days prior to the corresponding object’s decay. Such messages are also issued multiple times in the last 24 h preceding the decay. Although TIP messages bring latitude and longitude information, they do not provide altitude information.
2.4.3 Reentry prediction errors
A reentry prediction epoch is obtained for each satellite. We use reentry predictions provided by TIP messages for the day of the zero-epoch time. If space-track.org does not provide a reentry prediction for the reference altitude epoch, we apply the SGP4 propagator to the TLE data corresponding to the zero-epoch time to propagate the satellite’s orbit until it crosses the Kármán line.
2.4.4 Estimated reentry
This is the estimated epoch obtained by propagating the last TLE data file until the altitude reaches 100 km. We use this approach to obtain our estimated reentries as opposed to using the latest available TIP messages because the latter are issued when satellites are at many different altitudes above 100 km. As a result, our approach allows for more adequate reentry altitude estimates in the superposed epoch analysis.
2.4.5 Day difference
Day difference is simply the time interval between the estimated reentry epoch and the reference altitude (zero) epoch represented in days.
It is important to emphasize that the use of TLE data and the SGP4 model in their analyses is considered unsuitable for accurate reentry predictions, except for providing the starting conditions for numerical integration if more accurate ephemeris data is unavailable. SGP4 does not include any atmospheric model, but it just extrapolates the observed changes in mean motion, and can therefore not account for rapid increases in atmospheric densities at lower altitudes in the days before reentry. However, though limited, SGP4 can provide a prediction baseline for indirect comparison between orbital drag effects on Starlink satellites reentering during different solar and geomagneic conditions. This is the main goal of this work.
3 Statistical results and discussion
3.1 Reentries
Figure 1 shows annually number distributions of satellites (colored bars) and monthly-averaged solar radio flux index data (black line) for the period of 2000–2024. Grey bars indicate data for all satellites, whereas red bars indicate data for Starlink satellites.
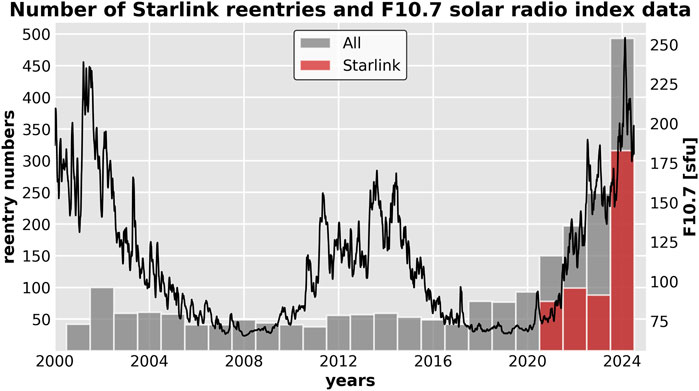
Figure 1. Annual number distribution of Starlink reentries and monthly-averaged F10.7 solar radio flux index data from 2000 to 2024. Reentry data was obtained from space-track.org. The grey bars indicate all satellites, and the red bars indicate Starlink satellites.
The data plotted in the figure covers a time interval equivalent to two solar cycles. This includes the declining phase of SC23, the entire SC24, and the rising phase of SC25. The plot clearly shows that before 2021, the maximum number of reentries was near 100, with most years presenting reentry numbers around 50. In 2019, SpaceX started launching Starlink satellites into LEO and they began reentering in late 2020. Starlink reentry numbers were relatively low in the first 3 years, with 2 reentries in 2020 (not visible in the histogram), 78 in 2021, 99 in 2022, 88 in 2023, and an impressive number of 316 reentries in 2024. The intermediary number between 2021 and 2023 may have been impacted by the unexpected reentries of 39 Starlink satellites in February 2022 (Hapgood et al., 2022). From 2020 to 2024, 1190 satellites reentered from VLEO, with 583 (nearly half) being Starlink satellites.
Oliveira et al. (2021) pointed out that the number of satellites in LEO would increase dramatically in the following years after their publication. Additionally, they mentioned that those numbers would coincide with increased solar activity in SC25. This can be seen in the rising phase of the current solar cycle (2020–2024). Therefore, it is clear that SpaceX has made a significant impact on the number of reentries of satellites from VLEO. As a result, such reentries ought to be closely tracked to avoid collisions with other satellites or debris, as well as downfall of Starlink debris in undesirable regions, such as populated areas. Such tracking should be performed even more cautiously during periods of high solar activity.
The world map shown in Figure 2 displays reentry geographic locations of all the 1864 satellites with available TIP message data found at space-track.org within the 2000–2024 period. Orange dots indicate Starlink satellite (509) positions, whereas blue dots indicate the positions of the remaining 1355 satellites. The horizontal dashed magenta lines delimit typical orbital latitudes due to the inclinations of the Starlink satellites
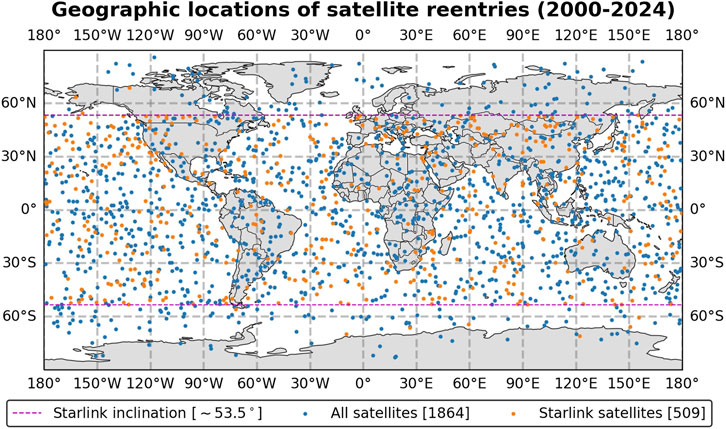
Figure 2. Geographic reentry locations of 1864 satellites in the period 2000 to 2024 obtained from available TIP message data. Orange dots are for Starlink satellites (509), and blue dots are for non-Starlink satellites (1355). Both magenta dashed horizontal lines show the orbit constrained region by Starlink inclinations (
In this paper, we group reentries occurring during three different geomagnetic activity levels: weak, moderate, and severe. Such groups are arbitrarily defined as follows.
Weak: Dst
Moderate: −200 nT
Severe: Dst
Figure 3A shows statistical number distributions of all Starlink reentries occurring during three geomagnetic conditions. The number of events within each geomagnetic activity category, represented at the top of each vertical bar, decreases as the geomagnetic activity becomes more intense. The inset pie diagram shows the relative statistical distributions of each reentry storm category. Despite the relatively low number of reentries during severe geomagnetic condition (37 reentries or 6.35% of all reentries), we will show that severe geomagnetic storms have already significantly impacted the de-orbiting of Starlink satellites during the rising phase of SC25.
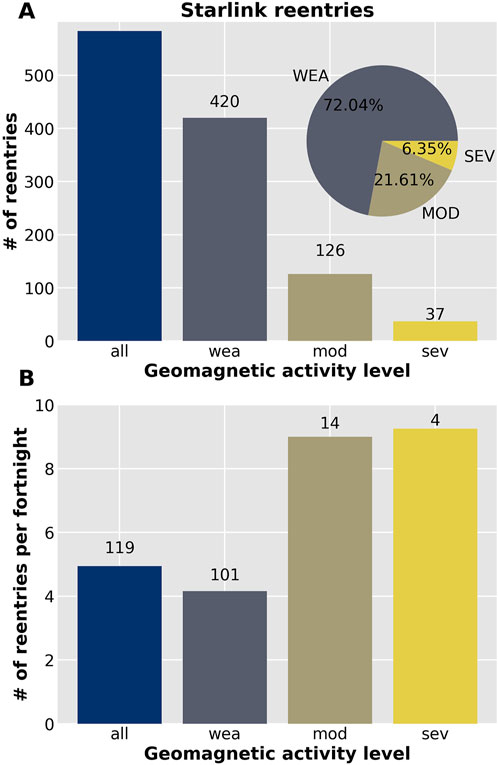
Figure 3. (A) Statistical number distributions of all events and events grouped in the three different geomagnetic activity levels (weak, moderate, and severe). The inset pie diagram shows the relative distributions of the reentries under the three different geomagnetic conditions here investigated. (B) Number of Starlink reentries per fortnight (14 days) with minimum Dst values falling in the storm level definitions presented in Section 3.1. The numbers at the top of the bars represent the numbers of fortnights within each geomagnetic level category.
Since the number of reentries occurring during moderate and severe geomagnetic conditions are relatively low, we also determine the number of fortnight (14 days) intervals with minimum Dst values falling within each storm activity level interval. We then estimate the number of Starlink reentries per fortnight, and the results are shown in Figure 3B. The numbers at the top of the bars indicate the numbers of fortnights occurring during each corresponding geomagnetic activity level. Results show that there were
It is important to note that we only have real-time/quick-look or provisional Dst data available, so that is what we used for the reentries displayed in Figure 3. Although the change of non-final version data to their final version may affect the weak and moderate categories, as argued by Oliveira et al. (2025), it is very unlikely a severe event could be lowered to a moderate event. Nevertheless, such changes would most likely be unnoticeable given the large number of satellite reentries here investigated.
3.2 Superposed epoch analysis
We use the Gannon superstorm of May 2024 as an example to illustrate our methodology. The Gannon superstorm was the most intense event in 2 decades since the Halloween events of 2003 (Hayakawa et al., 2025). Hayakawa et al. (2025) tracked the sunspot group and X-class solar flares associated with the very fast CMEs that drove the storm. The authors concluded that a large amount of magnetic energy was transferred into the magnetosphere leading to a very extreme geomagnetic storm. As a result, many accounts of low-latitude auroras were recorded around the world (Gonzalez-Esparza et al., 2024; Hayakawa et al., 2025).
Dst data for that storm is plotted in Figure 4A. Its minimum Dst value is −412 nT, which followed the storm sudden commencement (SSC) at nearly 1700 UT (Piersanti et al., 2025). The frame also shows that F10.7 increases within 8 days from
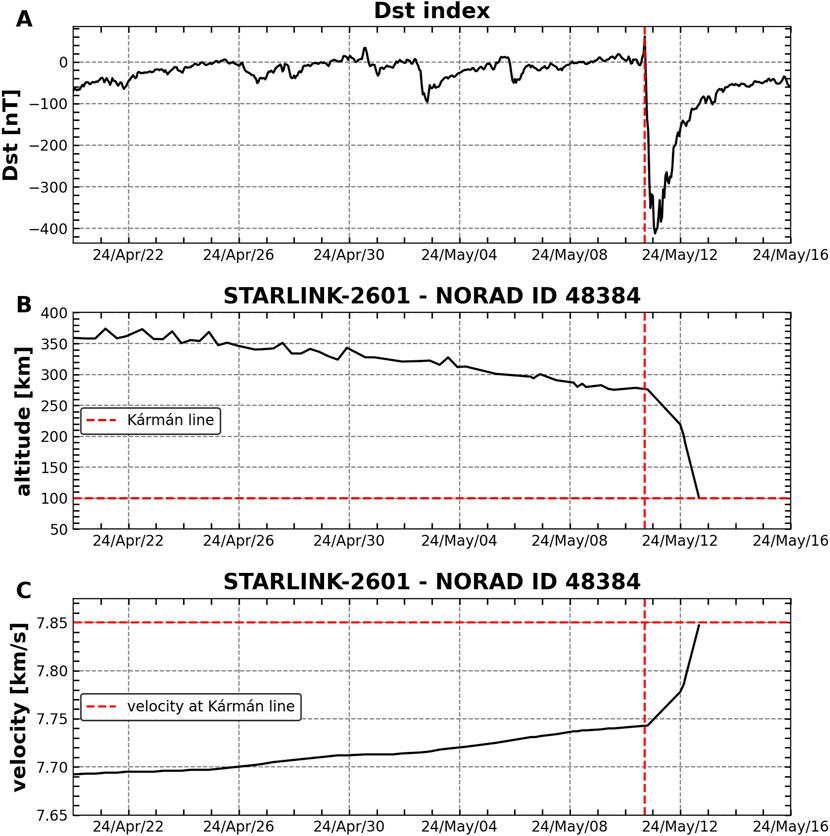
Figure 4. An example of how solar and geomagnetic activity can impact a satellite reentering from LEO. The figure shows the Starlink-2601 satellite (NORAD ID 48384) reentering during the May 2024 Gannon storm. (A): hourly values of Dst index (solid black line) and daily F10.7 solar radio flux index (solid grey line); (B): nearly daily satellite altitudes; and (C): the same for velocities. The red dashed vertical lines in all frames indicate the storm sudden commencement at
For the superposed epoch analysis, we selected altitudes near 280 km as the zero epoch time. Even for extreme storms such altitudes would provide sufficient opportunities for a satellite to elevate and make altitude or re-entry decisions. TIP messages are only issued at very low altitudes, below 200 km, when it is too late for commanding decisions. It is important to note that this is the altitude that has emerged as the “last change” altitude for the Starlink satellite. It is possible and even likely that for a different satellite configuration (volume, shape, mass) such a critical altitude could be different.
Starlink reentries during the Gannon storm are included in our superposed epoch analysis as well. We also include Starlink reentries during the extreme storm of October 2024, the second most extreme event since October 2003. Xia et al. (2025) showed that field-aligned currents during that storm were quite strong and reached low-latitude regions, along with distinct visible auroras. Oliveira et al. (2025) also showed a Starlink satellite reentered sooner than expected in October 2024.
Figure 5 shows results of superposed epoch analysis for 523 Starlink satellites (TLEs of 60 satellites were either unavailable or incomplete). Data is superposed in a time interval of 30 days before and 16 days after the zero epoch time. In all panels, the solid dots indicate mean altitude values at a daily cadence, whereas the error bars represent the 25th (lower edge) and the 75th (upper edge) quartiles of the distribution for the epoch day. In the plot, frame A is for all events, B is for weak events; C, moderate events; and D, severe events.
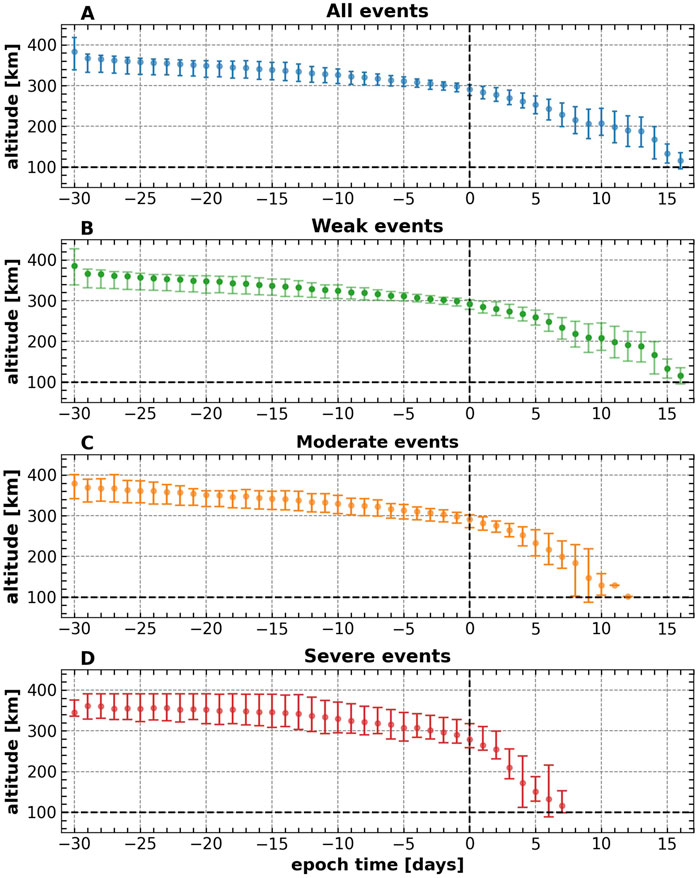
Figure 5. Superposed epoch analysis of 523 Starlink altitudes for reentries during different levels of geomagnetic activity. Frame (A), all events; (B), weak events; (C), moderate events, and (D), severe events. The error bars indicate 25th percentiles (lower edge) and 75th percentiles (upper edge). The black dashed vertical lines indicate the zero epoch time taken as the reference altitude epoch for each satellite. The black horizontal line represents the Kármán line (altitude 100 km).
As can be seen from the figure, all satellites were in reentry processes during the time period here investigated. In the case of all events (A), altitude error bars were relatively small around the zero epoch time (a few kilometers). The average reentry time for these satellites is 16 days. However, upon reentries (
Results shown for reentries during weak conditions are quite similar to results shown for all reentries, given that reentries during weak conditions correspond to
The large altitude error bars for moderate and severe geomagnetic conditions are presumably related to the relatively low number of reentries during moderate geomagnetic conditions (126), and particular of satellites reentering during severe geomagnetic conditions. Those latter conditions correspond to only 37 reentries (
Figure 6 for velocities shows similar results as seen in Figure 5 for altitudes during reentries under different geomagnetic conditions. Here, we clearly see in the figure that satellites reach the Kármám velocity (
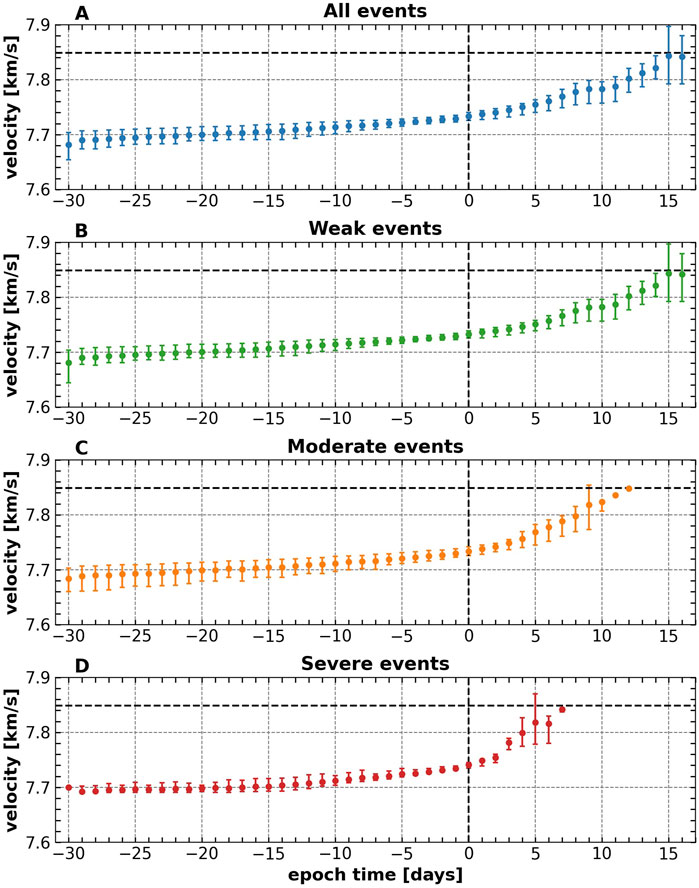
Figure 6. The same as in Figure 5, but for Starlink velocities in km/s. The black dashed horizontal line indicates the Kármán velocity (
Statistical results of Starlink reentry parameters occurring during different geomagnetic activity levels are documented in Figure 7. Panel A shows orbital decay rate as a function of Dst color coded by prediction errors. Panel B shows prediction errors plotted as a function of Dst color coded by orbital decay rate. Finally, panel C shows day difference plotted as a function of Dst color coded by orbital decay rate.
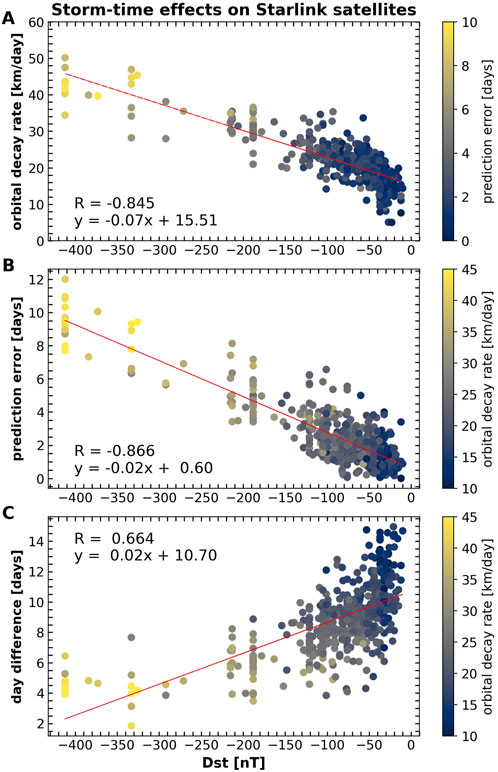
Figure 7. Scatter plots of geomagnetic activity effects on 523 Starlink reentries in the period 2020–2024. (A): orbital decay rate as a function of Dst (colors indicate prediction errors); (B): prediction error as a function of Dst (colors indicate orbital decay rate); an (C): day difference as a function of Dst (colors indicate orbital decay rate). Prediction error is the difference between the reentry and predicted epochs, whereas day difference is the difference between the reentry and reference altitude epochs. The
Although there are limited reentries under Dst
Despite having many reentries clustered with Dst
Figure 8 shows effects caused by solar activity in combination to geomagnetic activity on Starlink orbital drag. Solar activity is indicated by F10.7 solar radio flux index data, whereas geomagnetic activity is indicated by Dst index data. This is plotted in all panels, but the color codes indicate: orbital decay rate (A); prediction error (B); and day difference (C). The Dst value associated with each reentry is the same as explained before, but the F10.7 values associated with each reentry corresponds to the maximum value in a time interval of 14 days around the reference altitude epoch. We chose this time window to accommodate 27-day secular trends of solar radiation on thermospheric neutral mass density. Emmert (2015) provides many references of empirical thermospheric models that use this long-term secular trends in thermospheric density determinations.
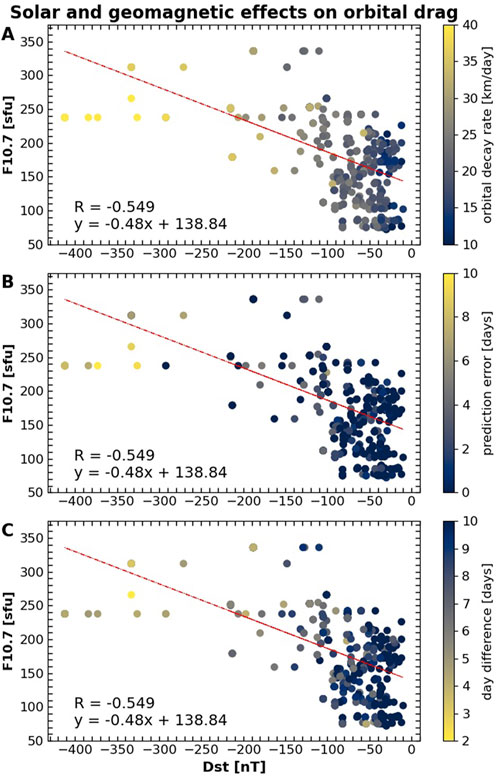
Figure 8. Effects of solar radiation and geomagnetic activity on the reentries of the 532 Starlink satellites investigated in this study. All panels show Dst plotted as a function of F10.7, with the colors representing (A), orbital decay rate; (B), prediction error; and (C), day difference.
Results show a trend of increasing geomagnetic activity with solar activity, but the correlation coefficient between Dst and F10.7 is relatively low (
Another possible effect that may have impacted our results, particularly in the occurrence of large altitude error bars and the scatter of day difference (Figure 7C), comes from variations of the areas and masses of Starlink satellites. The ballistic coefficient of a satellite is a measure of its ability to resist atmospheric drag, with a higher coefficient indicating a more streamlined satellite that experiences less resistance during its orbit (Sutton et al., 2005; Oliveira and Zesta, 2019; Bruinsma et al., 2023). The ballistic coefficient is directly proportional to the drag coefficient and the area-to-mass ratio. The solar panel areas and masses of Starlink satellites have increased over time to support more advanced technologies and improve satellite performance for enhanced service quality, including faster speeds and greater capacity for users. The masses and areas of Starlink satellites have increased by a factor of four since its first version (https://www.space.com/spacex-starlink-satellites.html#section-spacex-s-plans-for-starlink). As a result, different drag effects would occur on satellites with different ballistic coefficients in regions with similar thermosphere neutral mass density, hence the satellites’ altitudes would also be different. For this reason, a superposed epoch analysis using Starlink satellites with different ballistic coefficients would enhance the quality of our results.
The duration of geomagnetic storms can also play a role in determining the severity of drag effects on LEO satellites. For example, Oliveira et al. (2020) demonstrated that storm duration can play an equally or more critical role than intensity in driving drag effects. By analyzing historical superstorms, such as those in March 1989 and December 1921, the authors found that despite being less intense, the longer-lasting March 1989 storm caused orbital decays up to 400% greater than the shorter-lasting 1921 event. This underscores that prolonged exposure to elevated thermospheric densities during extended storms can lead to more severe satellite drag than shorter, more intense storms. Such interplay between storm intensities and durations may also have played a role in our results, particularly in the larger altitude error bars and day difference scattering mentioned above. However, a direct quantitative analysis of storm duration impacts on our results is difficult to be achieved with our data sets, particularly in the way the data are organized. For example, in their simulation, Oliveira et al. (2020) lined up the simulated thermospheric mass density (and drag effects) with the SSC of each event, in a similar way as shown in Figures 2, 4 of Oliveira et al. (2025). The reference altitude epoch and SSC/storm main phase epoch do not necessarily align for a specific reentry, and our events would have to be inspected on a case-by-case basis. Additionally, some of the reentries here investigated may have occurred during geomagnetic activity driven by corotating interaction regions (CIRs). This may add another layer of complexity to the problem, since timing the beginning and end of a CIR can also be tricky (Gosling and Pizzo, 1999). Discriminating reentries during CME- and CIR-driven geomagnetic activity is also important because CME-driven storms are generally more intense and qre briefer than CIR-driven storms (Borovsky and Denton, 2006).
As a result, in general, the statistical and superposed epoch analysis results shown in Figures 5–8 agree with the case sample shown in Figure 4 and with the comparative case study of Oliveira et al. (2025). Therefore, our results can be used for predictions of Starlink satellite reentry epochs as a function of geomagnetic activity.
4 Conclusion
In this work, we derived altitudes and velocities from TLE data to explore geomagnetic activity effects on reentries of Starlink satellites from VLEO in the period 2020 to 2024. By using Dst data to represent geomagnetic activity, we investigated storm effects on the orbits of 523 satellites as a function of storm intensity and solar activity. By taking a reference altitude between 260 and 320 km for each reentry, we superposed altitude and velocity data 30 and 16 days around the zero epoch time. We also compared orbital decay rates, day prediction errors between reentry prediction epoch and estimated reentry epoch, and day differences between estimated reentry epochs and reference altitude epoch as a function of Dst. Our main findings are listed below.
1. As pointed out by Oliveira et al. (2021), we observed a large number of satellites reentering from VLEO during high level of solar activity in the rising phase of SC25. Such combined observations are unprecedented in the history of human activity in LEO.
2. Geomagnetic storms can directly affect how fast a satellite reenters. The higher the geomagnetic activity level, the faster the satellite reenters. This is clearly shown in Figure 5 for the day difference between the altitude reference and the Kármán line crossing epochs. This is explained by increasing orbital decay rates as a function of geomagnetic activity. Our statistical results confirm the case study provided by Oliveira et al. (2025).
3. The day difference between reentry prediction epochs (derived with the SGP4 orbit propagator) and estimated reentry epochs from TLE data also increases with geomagnetic activity (prediction error). This finding reinforces the importance of using accurate orbital drag models for collision avoidance in LEO and VLEO and safeguard the ground from satellite debris impacts generated from their reentries.
4. The velocity results shown in Figure 6 confirm the findings described before. The higher the geomagnetic activity, the faster the satellite reaches the average Kármán line velocity (7.85 km/s).
5. The findings summarized in items 2 and 3 are confirmed by the scatter analyses shown in Figure 7. This is explained by the fact that faster orbital decay rates are associated with large predicton errors (how sooner a satellite reenters with respect to prediction) and day difference (how sooner a satellite reenters with respect to reference altitude epoch). Our results can be used to predict the reentry epochs of Starlink satellites as a function of geomagnetic activity levels from a last chance”, reference altitude near 280 km.
6. Solar activity also impacts orbital drag effects during the Starlink reentries. Although the correlation between F10.7 and Dst is moderate, the trends of higher orbital drag effects (orbital decay rates, prediction error, and day difference) are seen for higher F10.7 observations (Figure 8).
The effects caused by geomagnetic storms on thermosphere neutral mass density and satellite orbital drag (Jacchia, 1959; Prölss, 2011; Emmert, 2015) and on their predictions (including reentries) have been known for decades (Doornbos and Klinkrad, 2006; Klinkrad et al., 2006; Choi et al., 2017; Geul et al., 2018; He et al., 2018; Oliveira et al., 2021). All investigations hitherto have presented case studies or superposed epoch analysis studies involving one or two satellites (Sutton et al., 2005; Doornbos, 2012; Oliveira and Zesta, 2019; Krauss et al., 2020; Bruinsma et al., 2021). However, our study is the first to provide strong evidence of geomagnetic activity effects on orbital drag and subsequent reentries of more than 500 similar satellites, specifically SpaceX’s Starlink spacecraft. This includes many satellites reentering during similar times. Therefore, even though using limited daily TLE data, we show that satellites decay faster as the storm becomes more intense. Our results are also supported by the study of Parker and Linares (2024), who observed with limited daily TLE data that nearly half of 10,000 payloads in LEO (mostly Starlink objects), performed a large-scale en masse maneuver during the May 2024 event, the largest satellite migration in history. Our results are promising because they point in the direction of using short-cadence Starlink data (precise orbit determination, neutral mass density, ram direction area, drag coefficient) for the improvement of orbital drag models during geomagnetic storms, particularly during extreme events (Oliveira et al., 2021).
Data availability statement
The Dst data, provided by World Data Center for Geomagnetism, Kyoto et al. (2015), was obtained from https://wdc.kugi.kyoto-u.ac.jp/dst_realtime/index.html. The Starlink TLE data for altitudes and velocities was downloaded from space-track.org, by clicking on the tab “ELSET Search”. The F10.7 solar radio flux data, provided by a collaboration between the National Research Council Canada and the Natural Resources Canada, was downloaded from https://www.spaceweather.gc.ca/forecast-prevision/solar-solaire/solarflux/sx-5-en.php.
Author contributions
DO: Conceptualization, Data curation, Formal Analysis, Funding acquisition, Investigation, Methodology, Validation, Writing – original draft, Writing – review and editing. EZ: Conceptualization, Funding acquisition, Investigation, Project administration, Resources, Writing – original draft, Writing – review and editing. KG-S: Funding acquisition, Project administration, Resources, Supervision, Writing – review and editing.
Funding
The author(s) declare that financial support was received for the research and/or publication of this article. DO and EZ acknowledge financial support provided by NASA’s Space Weather Science Applications Operations 2 Research. DO thanks UMBC for providing financial support through the START (Strategic Awards for Research Transitions) program (grant # SR25OLIV).
Conflict of interest
The authors declare that the research was conducted in the absence of any commercial or financial relationships that could be construed as a potential conflict of interest.
Generative AI statement
The author(s) declare that no Generative AI was used in the creation of this manuscript.
Publisher’s note
All claims expressed in this article are solely those of the authors and do not necessarily represent those of their affiliated organizations, or those of the publisher, the editors and the reviewers. Any product that may be evaluated in this article, or claim that may be made by its manufacturer, is not guaranteed or endorsed by the publisher.
References
Acciarini, G., Baydin, A. G., and Izzo, D. (2025). Closing the gap between SGP4 and high-precision propagation via differentiable programming. Acta Astronaut. 226, 694–701. doi:10.1016/j.actaastro.2024.10.063
Ailor, W. H., and Patera, R. P. (2007). Spacecraft re-entry strategies: meeting debris mitigation and ground safety requirements. Proc. Institution Mech. Eng. Part G J. Aerosp. Eng. 221, 947–953. doi:10.1243/09544100JAERO199
Baruah, Y., Roy, S., Sinha, S., Palmerio, E., Pal, S., Oliveira, D. M., et al. (2024). The loss of Starlink satellites in february 2022: how moderate geomagnetic storms can adversely affect assets in low-earth orbit. Space Weather. 22, e2023SW003716. doi:10.1029/2023SW003716
Berger, T. E., Dominique, M., Lucas, G., Pilinski, M., Ray, V., Sewell, R., et al. (2023). The thermosphere is a drag: the 2022 Starlink incident and the threat of geomagnetic storms to low Earth orbit space Operations. Space Weather. 21. doi:10.1029/2022SW003330
Besliu-Ionescu, D., and Mierla, M. (2021). Geoeffectiveness prediction of CMEs. Front. Astronomy Space Sci. 8. doi:10.3389/fspas.2021.672203.3389/fspas.2021.672203
Boley, A. C., and Byers, M. (2021). Satellite mega-constellations create risks in low Earth orbit, the atmosphere and on Earth. Sci. Rep. 11, 10642. doi:10.1038/s41598-021-89909-7
Borovsky, J. E., and Denton, M. H. (2006). Differences between CME-driven storms and CIR-driven storms. J. Geophys. Res. 111. doi:10.1029/2005JA011447
Bruinsma, S., Dudok de Wit, T., Fuller-Rowell, T., Garcia-Sage, K., Mehta, P., Schiemenz, F., et al. (2023). Thermosphere and satellite drag. Adv. Space Res. doi:10.1016/j.asr.2023.05.011
Bruinsma, S., Fedrizzi, M., Yue, J., Siemes, C., and Lemmens, S. (2021). Charting satellite courses in a crowded thermosphere. Eos Trans. AGU 102. doi:10.1029/2021EO153475
Calabia, A., and Jin, S. (2017). Thermospheric density estimation and responses to the March 2013 geomagnetic storm from GRACE GPS-determined precise orbits. J. Atmos. Solar-Terrestrial Phys. 154, 167–179. doi:10.1016/j.jastp.2016.12.011
Choi, E.-J., Cho, S., Lee, D.-J., Kim, S., and Jo, J. H. (2017). A study on Re-entry predictions of uncontrolled space objects for space situational awareness. J. Astronomy Space Sci. 34, 289–302. doi:10.5140/JASS.2017.34.4.289
Cruddas, S. (2019). The space race: the journey to the moon and beyond. New York, NY: DK Publishing.
Curtis, H. D. (2005). Orbital mechanics for engineering students. Burlington, MA: Elsevier Butterworth-Heinemann.
Doornbos, E. (2012). Thermospheric density and wind determination from satellite dynamics. New York, NY: Springer. doi:10.1007/978-3-642-25129-0
Doornbos, E., and Klinkrad, H. (2006). Modelling of space weather effects on satellite drag. Adv. Space Res. 37, 1229–1239. doi:10.1016/j.asr.2005.04.097
Emmert, J. T. (2015). Thermospheric mass density: a review. Adv. Space Res. 56, 773–824. doi:10.1016/j.asr.2015.05.0381016/j.asr.2015.05.038
Fang, T.-W., Kubaryk, A., Goldstein, D., Li, Z., Fuller-Rowell, T., Millward, G., et al. (2022). Space weather environment during the SpaceX Starlink satellite loss in february 2022. Space Weather. 20, e2022SW003193. doi:10.1029/2022SW003193
Fedrizzi, M., Fuller-Rowell, T. J., and Codrescu, M. V. (2012). Global Joule heating index derived from thermospheric density physics-based modeling and observations. Space Weather. 10. doi:10.1029/2011SW000724
Fuller-Rowell, T. J., Codrescu, M. V., Moffett, R. J., and Quegan, S. (1994). Response of the thermosphere and ionosphere to geomagnetic storms. J. Geophys. Res. 99, 3893–3914. doi:10.1029/93JA02015
Geul, J., Mooij, E., and Noomen, R. (2018). Analysis of uncertainties and modeling in short-term reentry predictions. J. Guid. Control, Dyn. 41, 1276–1289. doi:10.2514/1.G003258
Gonzalez-Esparza, J. A., Sanchez-Garcia, E., Sergeeva, M., Corona-Romero, P., Gonzalez-Mendez, L. X., Valdes-Galicia, J. F., et al. (2024). The mother’s day geomagnetic storm on 10 may 2024: aurora observations and low latitude space weather effects in Mexico. Space Weather. 22, e2024SW004111. doi:10.1029/2024SW004111
Gopalswamy, N., Michalek, G., Yashiro, S., Mäkelä, P., Akiyama, S., and Xie, H. (2023). What do halo CMEs tell us about solar cycle 25? Astrophysical J. Lett. 952, L13. doi:10.3847/2041-8213/acdde2
Gosling, J. T., and Pizzo, V. J. (1999). Formation and evolution of corotating interaction regions and their three dimensional structure. Space Sci. Rev. 89, 21–52. doi:10.1023/A:1005291711900
Hapgood, M., Liu, H., and Lugaz, N. (2022). SpaceX – sailing close to the space weather? Space weather. 20, e2022SW003074. doi:10.1029/2022SW003074
Hayakawa, H., Ebihara, Y., Mishev, A., Koldobskiy, S., Kusano, K., Bechet, S., et al. (2025). The solar and geomagnetic storms in 2024 may: a flash data report. Astrophysical J. 979, 49. doi:10.3847/1538-4357/ad9335
He, C., Yang, Y., Carter, B., Kerr, E., Wu, S., Deleflie, F., et al. (2018). Review and comparison of empirical thermospheric mass density models. Prog. Aerosp. Sci. 103, 31–51. doi:10.1016/j.paerosci.2018.10.003
Jacchia, L. G. (1959). Corpuscular radiation and the acceleration of artificial satellites. Nature 183, 1662–1663. doi:10.1038/1831662a0
Kalafatoglu Eyiguler, E. C., Kaymaz, Z., Kuznetsova, M. M., Soon Shim, J., and Rastätter, L. (2019). “Relation between Joule heating and thermospheric neutral density during geomagnetic storms,” in 2019 9th international conference on recent advances in space technologies (RAST) (Istanbul, Turkey: IEEE), 663–666. doi:10.1109/RAST.2019.8767867
Kessler, D. J., and Cour-Palais, B. G. (1978). Collision frequency of artificial satellites: the creation of a debris belt. J. Geophys. Res. 83, 2637–2646. doi:10.1029/JA083iA06p02637
Kizner, Z., and Belotserkovskiy, A. (2005). Orbital mechanics of satellites: two-line elements and their usage. Acta Astronaut. 56, 43–54. doi:10.1016/j.actaastro.2004.07.001
Klinkrad, H., Fritsche, B., Lips, T., and Koppenwallner, G. (2006). “Re-entry prediction and on-ground risk estimation,” in Space debris: models and risk analysis. Editor H. Klinkrad (Berlin, Germany: Springer Berlin Heidelberg), 241–288. doi:10.1007/3-540-37674-7_9
Knipp, D., Tobiska, W., and Emery, B. (2004). Direct and indirect thermospheric heating sources for solar cycles 21—23. Sol. Phys. 224, 495–505. doi:10.1007/s11207-005-6393-4
Krauss, S., Behzadpour, S., Temmer, M., and Lhotka, C. (2020). Exploring thermospheric variations triggered by severe geomagnetic storm on 26 august 2018 using GRACE follow-on data. J. Geophys. Res. Space Phys. 125. doi:10.1029/2019JA027731
Kyoto, , Nose, M., Iyemori, T., Sugiura, M., and Kamei, T. (2015). Geomagnetic Dst index. World Data Cent. (Version v1). doi:10.17593/14515-74000
Liu, H., Lühr, H., Henize, V., and Köhler, W. (2005). Global distribution of the thermospheric total mass density derived from CHAMP. J. Geophys. Res. 110. doi:10.1029/2004JA010741
Mallama, A., and Cole, R. E. (2024). Extreme flaring of Starlink satellites. arXiv:2405, 13091. doi:10.48550/arXiv.2405.13091
McDowell, J. C. (2018). The edge of space: revisiting the karman line. Acta Astronaut. 151, 668–677. doi:10.1016/j.actaastro.2018.07.003j.actaastro.2018.07.003
Moltz, J. C. (2019). The changing dynamics of twenty-first-century space power. J. Strategic Secur. 12, 15–43. doi:10.5038/1944-0472.12.1.1729
Oliveira, D. M., and Zesta, E. (2019). Satellite orbital drag during magnetic storms. Space Weather. 17, 1510–1533. doi:10.1029/2019SW002287
Oliveira, D. M., Zesta, E., Hayakawa, H., and Bhaskar, A. (2020). Estimating satellite orbital drag during historical magnetic superstorms. Space Weather. 18, e2020SW002472. doi:10.1029/2020SW002472
Oliveira, D. M., Zesta, E., Mehta, P. M., Licata, R. J., Pilinski, M. D., Kent Tobiska, W., et al. (2021). The current state and future directions of modeling thermosphere density enhancements during extreme magnetic storms. Front. Astronomy Space Sci. 8. doi:10.3389/fspas.2021.764144
Oliveira, D. M., Zesta, E., and Nandy, D. (2025). The 10 October 2024 geomagnetic storm may have caused the premature reentry of a Starlink satellite. Front. Astronomy Space Sci. 11. doi:10.3389/fspas.2024.1522139
Parker, W. E., and Linares, R. (2024). Satellite drag analysis during the may 2024 Gannon geomagnetic storm. J. Spacecr. Rockets 61, 1412–1416. doi:10.2514/1.A36164
Piersanti, M., Oliveira, D. M., D’Angelo, G., Diego, P., Napoletano, G., and Zesta, E. (2025). On the geoelectric field response to the SSC of the May 2024 super storm over Europe. Space Weather. 23. doi:10.1029/2024SW004191
Prieto, D. M., Graziano, B. P., and Roberts, P. C. E. (2014). Spacecraft drag modelling. Prog. Aerosp. Sci. 64, 56–65. doi:10.1016/j.paerosci.2013.09.001
Prölss, G. (2011). Density perturbations in the upper atmosphere caused by the dissipation of solar wind energy. Surv. Geophys. 32, 101–195. doi:10.1007/s10712-010-9104-0
Qian, L., Burns, A. G., Chamberlin, P. C., and Solomon, S. C. (2011). Variability of thermosphere and ionosphere responses to solar flares. J. Geophys. Res. 116. doi:10.1029/2011JA016777
Ren, Y., Jin, S., Lu, Y., Gao, H., and Sun, S. (2022). The development status of Starlink and its countermeasures. Mod. Def. Technol. 50, 11–17. doi:10.3969/j.issn.1009-086x.2022.02.002
Sutton, E. K., Forbes, J. M., and Nerem, R. S. (2005). Global thermospheric neutral density and wind response to the severe 2003 geomagnetic storms from CHAMP accelerometer data. J. Geophys. Res. 110, 1–10. doi:10.1029/2004JA010985
Tapping, K. F. (2013). The 10.7 cm solar radio flux (F10.7). Space Weather. 11, 394–406. doi:10.1002/swe.20064
Witze, A. (2022). ‘Unsustainable’: how satellite swarms pose a rising threat to astronomy. Nature 606, 236–237. doi:10.1038/d41586-022-01420-9
Keywords: solar activity, geomagnetic storms, thermosphere response to storms, satellite mega-constellations, satellite orbital drag, satellite reentry
Citation: Oliveira DM, Zesta E and Garcia-Sage K (2025) Tracking reentries of Starlink satellites during the rising phase of solar cycle 25. Front. Astron. Space Sci. 12:1572313. doi: 10.3389/fspas.2025.1572313
Received: 06 February 2025; Accepted: 19 May 2025;
Published: 03 June 2025.
Edited by:
Andrés Calabia, University of Alcalá, SpainReviewed by:
Hongbo Wang, Chinese Academy of Sciences (CAS), ChinaMing-Jiang Zhang, Chinese Academy of Sciences (CAS), China
Copyright © 2025 Oliveira, Zesta and Garcia-Sage. This is an open-access article distributed under the terms of the Creative Commons Attribution License (CC BY). The use, distribution or reproduction in other forums is permitted, provided the original author(s) and the copyright owner(s) are credited and that the original publication in this journal is cited, in accordance with accepted academic practice. No use, distribution or reproduction is permitted which does not comply with these terms.
*Correspondence: Denny M. Oliveira, ZGVubnlAdW1iYy5lZHU=