 Yan-Ju Sun1,2
 Qing-He Zhang1,2*
 Zan-Yang Xing1*
 Xiang-Yu Wang1
 Duan Zhang2
 Bin-Bin Tang2
 Sheng Lu1
 Yu-Zhang Ma1
 Yong Wang1Zhi-Feng Xiu1Xin-Ming Chen1Tong Xu3Shu-Ji Sun3
 Jin Wang2
 V. Manu2
- 1Shandong Provincial Key Laboratory of Optical Astronomy and Solar-Terrestrial Environment, Institute of Space Sciences, Shandong University, Weihai, China
- 2State Key Laboratory of Space Weather, National Space Science Center, Chinese Academy of Sciences, Beijing, China
- 3China Research Institute of Radiowave Propagation, Qingdao, China
Multiple Transpolar arcs (MTPAs) are distinct auroral phenomenon occurring in the high-latitude ionosphere under prolonged northward interplanetary magnetic field (IMF) conditions. While the evolution of MTPAs is thought to be mainly modulated by the IMF By, the underlying physical mechanisms driving their dynamics remain insufficiently understood. This study integrates space-based and ground-based observations, and magnetohydrodynamic (MHD) simulations to investigate the evolution and characteristics of MTPAs and their associated field-aligned currents (FACs). The observations results reveal that following a sudden change in the IMF By orientation from dawnward to duskward, MTPAs exhibit a pronounced motion towards the duskside, driven by the strong positive IMF By. Concurrently, flow shears are detected on both flanks of the auroral arcs. MHD simulations under similar conditions demonstrate that flow shears emerge at the low-latitude boundary layer (LLBL) of the magnetosphere, facilitating plasma trapped from the magnetosheath and central plasma sheet onto open magnetic field lines. This plasma is subsequently transported into the lobe regions, generating upward FACs that accelerate local particles and form auroral arcs migrating towards the duskside within the polar cap. These findings advance our understanding of the magnetosphere-ionosphere coupling processes under varying IMF conditions.
1 Introduction
Transpolar arcs (TPAs) are large-scale auroral structures that span the polar cap, linking the dayside and the nightside auroral oval (Frank et al., 1986; Zhu et al., 1997; Milan et al., 2005; Kullen, 2012; Hosokawa et al., 2020). These arcs are primarily formed through solar wind–magnetosphere–ionosphere coupling process under strong northward IMF and quiet geomagnetic conditions. Previous studies have reported that the IMF By component significantly influences the location and motion of TPAs. Cumnock et al. (1997) first identified the link between the poleward motion of TPAs and the IMF By reversal. Specifically, the duskside TPAs in the Northern Hemisphere migrate towards the dawnside under dusk-to-dawn IMF By, while the dawnside TPAs shift towards dusk under the opposite IMF By orientation. Cumnock (2005) further suggested that IMF By reversal, during stable northward IMF and elevated solar wind magnetic energy flux (
The mechanisms driving TPAs formation and motion have been extensively investigated. On the dayside, key processes include magnetic reconnection at the low-latitude magnetopause and high-latitude lobe regions (Dungey, 1961; Newell and Meng, 1995; Chang et al., 1998; Zhang et al., 2013; Zhang et al., 2018) and plasma instabilities, such as the Kelvin–Helmholtz instability, occurring at the magnetospheric boundary layers (Rezhenov, 1995; Golovchanskaya et al., 2006; Kozlovsky et al., 2007; Xing et al., 2018; Zhang et al., 2020). On the nightside, significant contributions arise from magnetotail reconnection (Milan et al., 2005; Fear et al., 2014) and magnetotail twisting due to the IMF variations (Makita et al., 1991; Kullen, 2000; Kullen, 2012). These processes lead to plasma sheet bifurcation, filamentary extensions of plasma into the lobe, or the trapping of hot plasma within the tail lobe (Frank et al., 1986; Huang et al., 1989; Tanaka et al., 2004; Fear et al., 2014; Tanaka et al., 2017). However, none of the proposed mechanisms fully account for all the observed characteristics, particularly the occurrence and movement of multiple TPAs. Investigating this phenomenon has been challenging, primarily due to limitations in acquiring simultaneous observations across the solar wind–magnetosphere–ionosphere system. In this study, the motion and evolution of MTPAs, along with the magnetospheric responses to their growth, are examined using joint observational data from multiple ground-based stations and global three-dimensional (3D) magnetohydrodynamic (MHD) simulations.
2 Data and model
Defense Meteorological Satellite Program (DMSP) satellites operate in polar orbits at an altitude of ∼840 km with an orbital period of ∼101 min. These DMSP satellites are equipped with the Special Sensor Ultraviolet Spectrographic Imager (SSUSI), a scientific instrument designed to investigate auroral activities (Paxton et al., 1992). SSUSI is designed to observe far-ultraviolet emissions in the wavelength range of 115–180 nm. In this paper, Lyman-Birge-Hopfield short (LBHS) band (∼140–150 nm) is used to observe the MTPAs aurora emissions.
The all-sky imagers (ASIs) at Resolute Bay (RSB) (geographic: 74.8° N, 264.9° E, magnetic latitude: 82.9°N) are used to visualize the dynamical auroral emissions in the polar cap. These ASIs capture images at 2-min intervals, providing continuous monitoring of auroral activity. In this study, we use 630.0 nm auroral emissions data from the RSB ASIs (Shiokawa et al., 1999; Shiokawa et al., 2009), which is projected to an altitude of approximately 250 km. The high temporal resolution of ASI allows for detailed analysis of the evolution of MTPAs auroral structures in the polar cap.
The Resolute Bay Incoherent Scatter Radar-North (RISR-N), situated at 74.73° N, 94.91° W (magnetic latitude: 82.7° N), is used to obtain key plasma parameters such as electron density, electron temperature, ion temperature, and plasma velocity at range from 200 to 600 km (Bahcivan et al., 2010). Among the 11 beams available in RISR-N, beam 57869 (with an azimuth of 9.32° and an elevation of 38.39°) provides optimal coverage for tracking the movement and evolution of auroral arcs. In this study, we utilize RISR-N data to examine particle characteristics of the MTPAs, focusing specifically on their near-ground signatures.
A high-resolution three-dimensional global MHD model, the Piecewise Parabolic Method with a Lagrangian Remap to MHD (PPMLR-MHD), is an extension of the piecewise parabolic method (PPM) by including Lagrangian remap to magnetohydrodynamics (MHD) (Hu et al., 2007; Tang and Wang, 2018). This 3D MHD model is specifically designed for the solar wind–magnetosphere–ionosphere system (Guo et al., 2010; Li et al., 2013; Wang et al., 2013). The model employs a cartesian coordinate system centered at the Earth’s core with X-, Y-, and Z-axes oriented towards the sun, the dawn–dusk direction and to the north respectively. The X-axis ranges from 25 RE to −100 RE (RE, Earth Radius) along the Sun–Earth axis while Y and Z-axes ranges from −50 RE to 50 RE forming 240 × 240 × 240 grid points with a minimum grid spacing of 0.2 RE. In order to minimize the complexities associated with the plasmasphere and high MHD characteristic velocities due to the strong magnetic field, an inner boundary of radius 3 RE is decided for the magnetosphere (Li et al., 2013). Also, an electrostatic ionosphere shell with height-integrated conductance is included to facilitate the electrostatic coupling between the ionosphere and the magnetospheric inner boundary. The grid system employs uniformly distributed minimum grid cells within 10–15 RE of Earth. These cells exhibit spatial resolutions ranging from 0.2 RE to 0.4 RE. Beyond this region, the grid size increases geometrically along the X-, Y-, and Z-axes with a common ratio of approximately 1.05. Recently our team has done a lot of work with the PPMLR-MHD model, with representative work on MTPAs (Zhang et al., 2020) and space hurricane (Zhang et al., 2021), so we believe this model can provide us with an explanation for this work.
3 Results
Figure 1 presents the solar wind, IMF data and geomagnetic indices obtained from the NASA OMNI database (http://omniweb.gsfc.nasa.gov) for the period of 22:00 UT on 15 November 2017–03:00 UT on 16 November 2017. The IMF conditions remained relatively stable northward with about 450 km/s solar wind speed before 00:00 UT on 16 November 2017, which may favor the development of Kelvin–Helmholtz instability at the magnetopause (Hasegawa et al., 2004; Guo et al., 2010; Li et al., 2013; Wang et al., 2013; Zhang et al., 2020) and the formation of multiple cusp-aligned auroral arcs within the polar cap (Yamamoto and Ozaki, 2005; Zhang et al., 2016). At approximately 00:30 UT, a sudden change occurred in the IMF from northward to duskward orientation (dominated by IMF By). During the interval of interest (highlighted by gray shadow), the IMF conditions were stable, dominated by the strong By (∼10 nT) component. Concurrently, the solar wind speed was elevated, reaching to 480 km/s, accompanied by the increased dynamic pressure. The low values of AL and AU indicate the absence of substorm activity, suggesting a quiet auroral oval throughout the interval of interest.
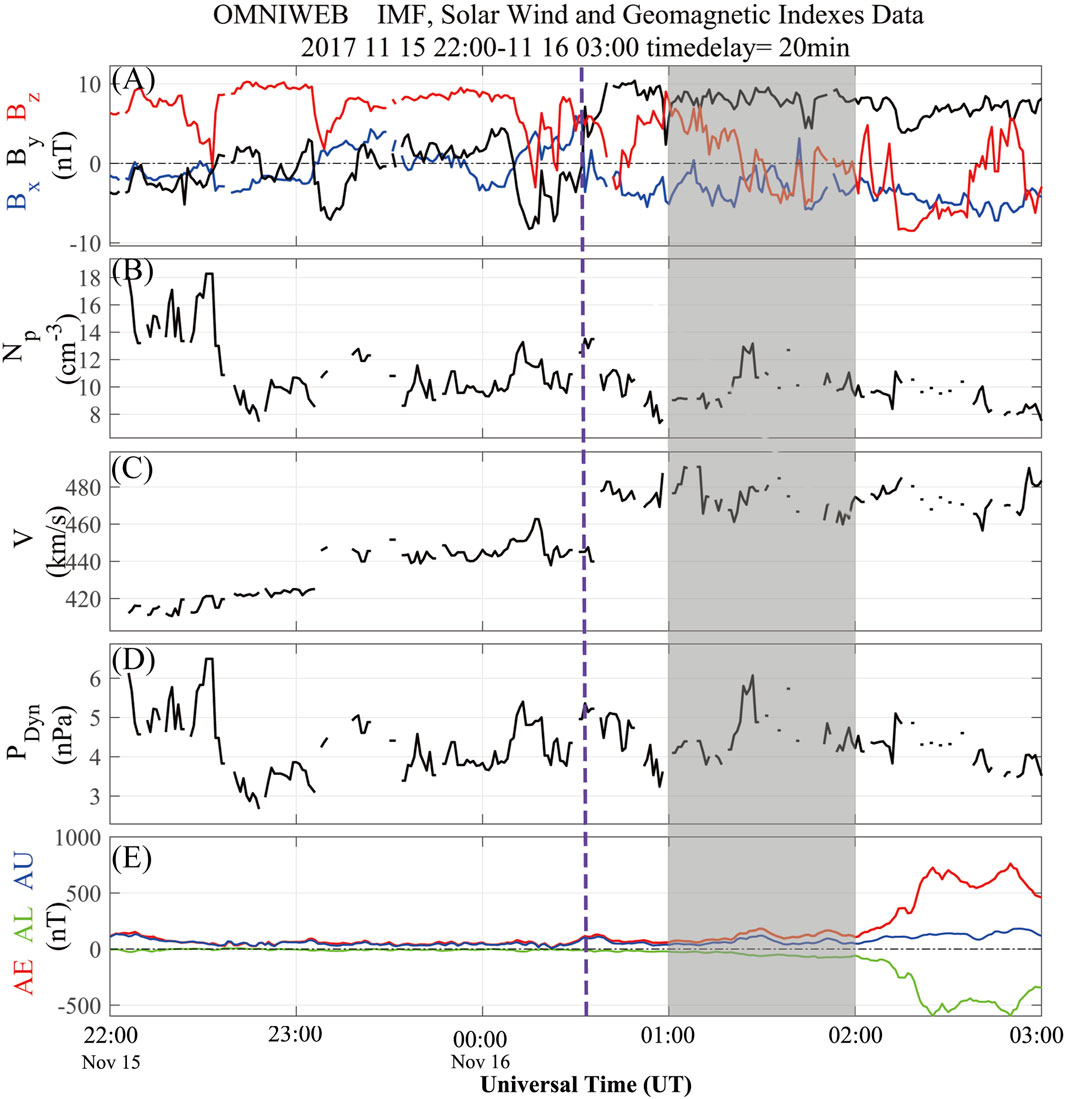
Figure 1. The interplanetary magnetic fields (IMF), solar wind and geomagnetic indices data during 22:00–03:00 UT on 15 November 2017. (A) The IMF components in GSM (geocentric solar magnetosphere) coordinates, Bx, By and Bz; (B) the solar wind number density, Np; (C) the solar wind speed, V; (D) the solar wind dynamic pressure, PDyn; (E) the provisional geomagnetic indices for auroral electrojet, AU, AL and AE. The shaded area marks the period when the MTPAs were observed. The purple dotted line marks the time at which the direction of IMF By reverses.
Auroral observations in the Northern Hemisphere are presented in Figures 2A–E. Figure 2A shows MTPAs within the otherwise vacant polar cap derived from DMSP F18 SSUSI data (Orbital center time is 01:22 UT). The red circle shows the field of view of the RSB ASI. Figures 2B–G show the RSB ASI images captured at 10-min intervals from 01:00 UT to 01:50 UT on 16 November 2017, arranged sequentially by time. A comparison between the ASI image at 01:20 UT (Figure 2D) and the DMSP SSUSI image reveals a high degree of consistency between ground-based observations and satellite measurements. These time-series images demonstrate the westward drift of moving MTPAs within the polar cap towards the duskside over time. By analyzing the auroral arcs motion in the ASI data, specifically during the selected period from 01:20 UT to 01:40 UT, the average drift speed of the two auroral arcs was determined to be approximately 320 m/s. The emission intensity of the auroral arcs ranged from 400 to 450 Rayleigh. In the images, two TPAs are identified and labeled for clarity.
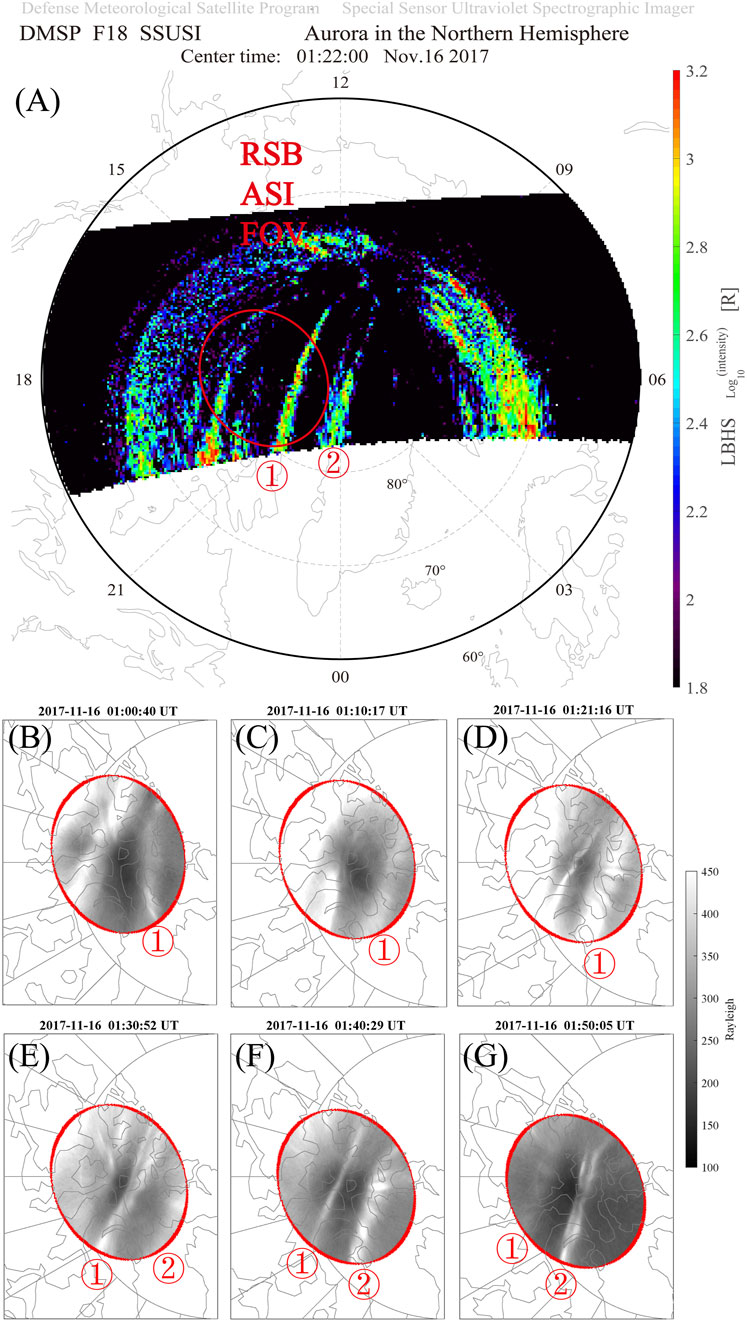
Figure 2. (A) The auroral observations from DMSP F18 SSUSI in the Northern Hemisphere on 16 November 2017. The red circles delineate the field of view of the RSB ASI. The SSUSI observations are obtained from the Lyman-Birge-Hopfield short (LBHS) band. (B–G) Auroral observation at a 630.0 nm wavelength by the RSB ASI, with observations made from 01:00 UT to 01:50 UT on 16 November 2017.
Figures 3A–D show plasma density derived from RISR-N radar, superimposed on the RSB ASI at about 7-min intervals starting at 01:21 UT on 16 November 2017. The red circles indicate the ASI field of view. The movement of the auroral arcs results in higher plasma densities at their locations compared to the surrounding regions, as indicated by tangerine yellow along the radar beams. Therefore, the auroral arcs can be interpreted as a region of high plasma density detected by radar. Figures 3E–H present plasma parameters measured by beam 57869, which has an elevation angle of 38.39° and an azimuth angle of 9.32°, roughly in the north-south direction. Two distinct regions of high plasma density, where the MTPAs are located, indicated by green arrows, are clear in Figure 3E. The morphology and kinematic characteristics of these structures align well with observations from all-sky images. The calculated velocity of the MTPAs, approximately 340 m/s, is determined by analyzing the slopes of the two high-density plasma structures in the time-series plot of the measured density from beam 57869. This value is consistent with the velocity of the two auroral arcs inferred from the ASI data. As shown by the green arrows in Figure 3E, the range of MTPAs continued to decrease under stable positive By conditions after the IMF By changed from negative to positive. This trend suggests that the MTPAs are drifting towards the radar, i.e., the MTPAs are moving towards the duskward. Figure 3F shows relatively high electron temperatures at the auroral arcs regions, indicating strong particle precipitation here. Figure 3H illustrates the line-of-sight velocity for RISR-N beam 57869. Positive line-of-sight velocity correspond to motions directed away from the radar. Notably, near the auroral arcs, particularly for the first TPA, plasma move away from the radar before sweeping across the arc, and shift to moving towards the radar after crossed the arc. This observation reveals opposite flow directions on either side of the auroral arcs, indicating the presence of flow shears around the auroral arcs. Notably, as the radar swept across the second auroral arc, a large region of dense plasma structure was still observed trailing behind the arc. This was accompanied by a significant increase in electron temperature and a clear tendency for the structure to move more rapidly towards the radar. We deduce that this structure represents a hot patch drifting along the convection lines from the polar cap region.
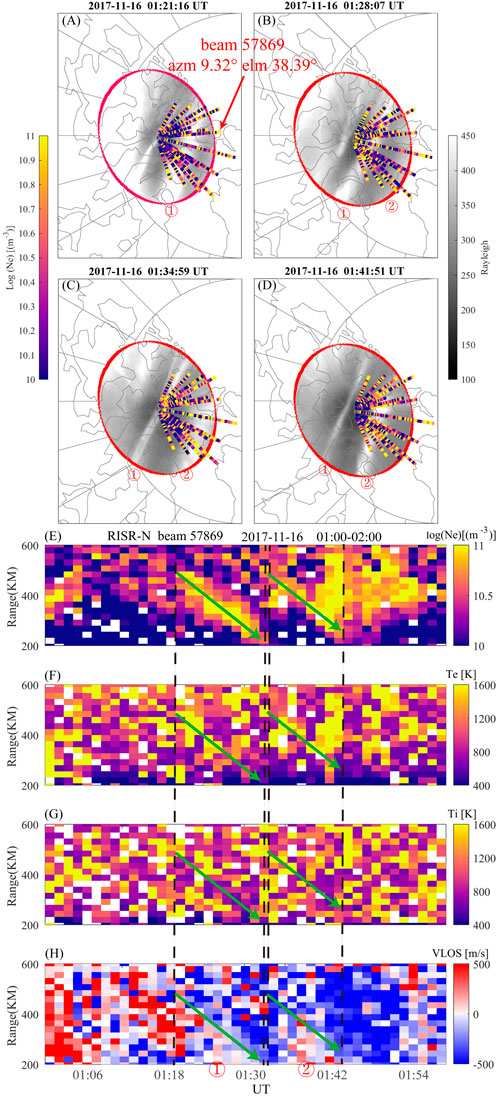
Figure 3. (A–D) Plasma density derived from the integration of multiple beam detections of the RISR radar superimposed on the RSB ASI; (E–H) Plasma parameters keograms along the beam 57869 direction. The elevation angle of the beam is 38.39° and the azimuth is 9.32°. The four panels arranged from top to bottom show the plasma density, the electron temperature, the ion temperature, and the line-of-sight velocity (the positive value signifying velocity away from the radar). The two auroral arcs marked by the green arrows correspond to those identified in the ASI.
A high-resolution three-dimensional global PPMLR-MHD model (Hu et al., 2007; Tang and Wang, 2018; Zhang et al., 2020), was used to investigate the formation and evolution of TPAs by incorporating the actual solar wind and IMF conditions as input in this study. The model includes an electrostatic ionospheric shell characterized by height-integrated conductance, allowing for the simulation of electrostatic coupling and the calculation of field-aligned currents (FACs) between the ionosphere near Earth and the magnetospheric inner boundary of the model. Figures 4A–C present the simulated FACs and plasma velocity vectors (represented by black arrows) as two-dimensional projections in the GSM Y-Z plane at X = −40 RE. In Figure 4A we mark the dawnside and the duskside as well as the low-latitude boundary layer (LLBL) position. The simulation begins at 01:10 UT, with snapshots generated at 10-min intervals, extending up to 01:30 UT. This specific plane was chosen for projection because certain plasma structures within this region are closely associated with near-Earth MTPAs, which will be demonstrated in our results later in the paper. In the GSM Y-Z plane at X = −40 RE, the red regions indicate that the current is parallel to the field lines, and the blue regions indicate that the current is anti-parallel to the field lines. The top of the magnetopause is approximately located near a circle with a radius of 20 RE, centered at the origin of this projection plane. From Figures 4A–C, we can deduce when the IMF By component abruptly transitions from negative to positive polarity at 00:30 UT and subsequently maintains prolonged stable, flow shears were generated at the LLBL on both flanks of the magnetosphere which led to the bifurcation of large-scale upward FACs in the central magnetotail region and their extension into the lobes on both sides. The flow shears, illustrated by the velocity vectors, persisted at the LLBL on the dawnside and in the central magnetotail, resulting in continuous bifurcation of the upward FACs. These bifurcated currents extended deeper into the lobe regions, with some currents continue to extend, while others gradually dissipated. The upward FACs extending into the lobes contribute to the magnetic field-aligned acceleration of magnetospheric electrons, likely facilitated by Knight’s current-voltage process (Knight, 1973; Lyons, 1981). These accelerated electrons precipitate into the polar ionosphere, generating auroral arcs that drift duskward within the auroral oval.
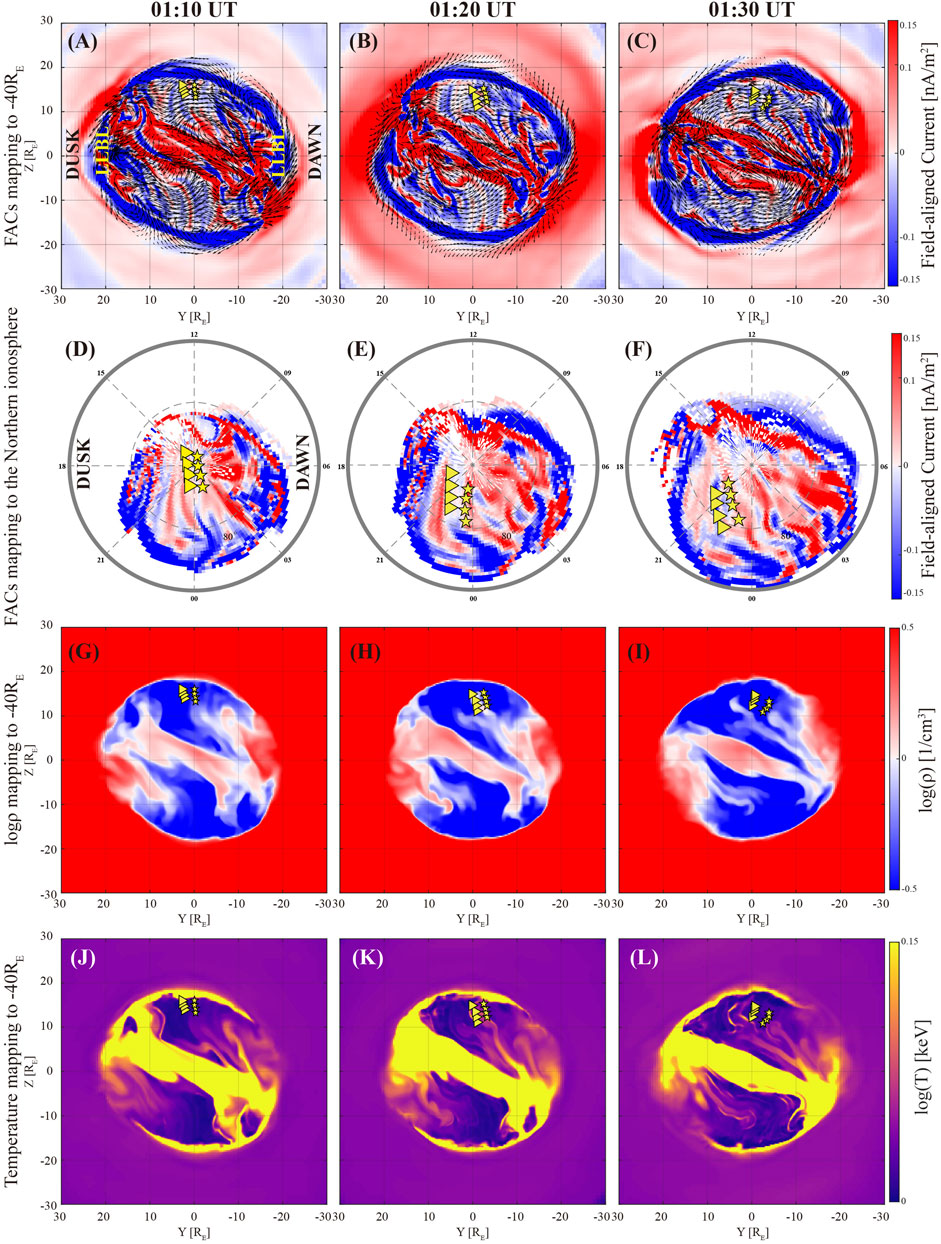
Figure 4. Simulated FACs and plasma velocity vectors as well as plasma density and temperature parameters in the Y-Z plane of GSM coordinates. (A–C) The 2D distribution of FACs and plasma velocity vectors in the X = −40 RE plane simulated by the PPMLR-MHD model the red regions indicate that the current is parallel to the field lines, and the blue regions indicate that the current is anti-parallel to the field lines; (D–F) Field-aligned mapping of the FACs is projected along the magnetic field lines, which pass through X = −40 RE, to the Northern Hemisphere magnetosphere, the red regions indicate upward FACs, the blue regions indicate downward FACs; (G–L) The 2D distribution map plots of plasma density and plasma temperature observed from the magnetotail, projected onto the Y-Z plane at −40RE. The yellow marks in the figure represent the projected footprints of multiple magnetic field lines within this plane. The simulation is sliced on 16 November 2017 at 01:10 UT to 01:30 UT, in order to compare with the DMSP SSUSI observations and RSB ASI observations.
The FACs are mapped along magnetic field lines intersecting the −40 RE plane and projected onto the ionosphere in the Northern Hemisphere, revealing a distinct current structure, as shown in Figures 4D–F, the red regions indicate upward FACs, the blue regions indicate downward FACs. The mapped FACs show well-defined structures in both the polar cap and the auroral oval, these structures are similar in both shape and size to the observed auroral arcs depicted in Figure 2. We selected specific footprints of the upward FACs, indicated by the yellow marks, from the FACs projection map to trace the magnetic field lines. For instance, the two upward FACs marked by two sets of differently shaped yellow symbols located in the lobe regions in Figure 4B are subjected to magnetic line tracing starting points, and it can be found that their magnetic line tracing footprints are located in the interior of the high-latitude pole cap region and show arcs shape. This indicates that the upward FACs in the polar cap region originate from the upward FACs in the lobe regions, both of which are derived from open magnetic field lines. In the simulation, the FACs exhibit morphologies and movements consistent with the MTPAs observed by the RSB ASI during the observation period. The FACs consistently originate from the nightside auroral boundary, particularly near the dayside region, and migrate towards the duskside, extending across to the dawnside. The upward FACs, which extend into the lobe regions and undergo bifurcation in the central magnetotail, map into the interior of the polar cap region, aligning directly with the MTPAs structures.
Meanwhile, Figures 4G–L present map plots of the plasma density versus logarithmic temperature within the Y-Z plane at −40 RE in the simulation. It is evident that the locations of multiple magnetic field lines, traced in Figures 4D–F at their footprints in this plane, correspond to regions of high-temperature, high-density plasma extending into the lobe. The simulation, spanning from 01:00 UT to 02:00 UT, clearly shows that these high-temperature, high-density plasma regions continue to drift into the lobe interior due to flow shears occurring at the LLBL on the dawnside. This indicates that flow shears result in particles from both the central plasma sheet and the solar wind being transported along open magnetic field lines into the lobe regions. As these particles subside along the magnetic field lines, MTPAs are subsequently formed in the polar cap region. With the drift of these particles along the field lines, their associated footprints also migrate, resulting in the continuous movement of MTPAs observed from the ground-based ASI. Thus, the central plasma sheet and solar wind serve as significant sources of structured electron deposits into the polar cap, leading to the formation of MTPAs.
4 Discussion
Cumnock et al. (1997) was the first to identify a connection between the poleward movement of TPAs and reversals in the IMF By component. Specifically, when the IMF By changes from duskward to dawnward, TPAs were observed on the duskside in the Northern Hemisphere that migrated across the polar cap towards the dawnside. Similarly, the dawnside TPAs were expected to drift towards the duskside when the IMF By reversed from dawnward to duskward. Through the statistical analysis, Cumnock (2005) demonstrated that a distinct reversal of IMF By, during sustained northward IMF and high solar wind magnetic energy flux (Kullen et al., 2008), which can effectively initiate the poleward motion of TPAs. The observations presented in this study are consistent with previous results.
The formation mechanisms of TPAs have been the subject of considerable debate over the past few decades (Hosokawa et al., 2020). Hosokawa et al. (2020) provide a comprehensive review of most of the models and theories of TPAs, focusing on summarizing the mechanisms of TPA formation and evolution to date. A majority of these models emphasize the topological relationship between TPAs and the plasma sheet in the magnetotail, as this region is often regarded as the source of TPAs. The movement of TPAs across the polar cap is generally linked to reversals of the IMF By component, which induces changes in the configuration of the plasma sheet. Specifically, the IMF By reversal from dawnward to duskward is thought to cause a reconfiguration of the plasma sheet, leading it to evolve from a clockwise twist to a bifurcated structure, and eventually settle into an anti-clockwise twist aligned with the new IMF By direction (Kullen, 2000).
Kullen (2000) suggested that an IMF By reversal induces reconfiguration in the magnetotail in a non-instantaneous manner, with a delay before the distant tail regions are affected. During this transitional phase, the near-Earth and far-tail regions exhibit opposing twists. By modifying the T89 model (Tsyganenko, 1989), Kullen (2000) demonstrated that this transition leads to the bifurcation of the closed field line region in the near-Earth tail, resulting in the formation of a “finger” of closed field lines extending into the polar cap. This finger-like structure shifts from dawn to dusk as the tail rotation propagates tailward, which is consistent with the observed TPAs behavior during the IMF By reversal from negative to positive.
However, we use the PPMLR-MHD model, which has a higher temporal and spatial resolution and can be fed with real-time solar wind conditions to simulate the real-time magnetospheric response, producing results that diverge significantly from those previously reported. The observed drift of MTPAs towards the duskside of the polar cap appears to result from the bifurcation of filamentary FACs near the central magnetotail, extending into the lobe regions. When the IMF undergoes an abrupt shift, flow shears develop between the magnetotail central plasma sheet and solar wind particles near the LLBL of the magnetosphere. The flow shears drive hot, dense plasma along open field lines into the lobe, providing a potential particle source for MTPAs.
The upward FACs extending into the lobe regions accelerate magnetospheric electrons along magnetic field lines precipitating, leading to their precipitation into the polar ionosphere and the formation of auroral arcs within the auroral oval. The plasma, associated with open magnetic field lines extending deeper into the lobe, maps to the polar cap in the Northern Hemisphere and exhibits a steady duskward drift. Ground-based ASI and radar observations confirm this behavior, as MTPAs were observed to consistently move towards the duskside.
These findings indicate that the mechanisms driving MTPAs formation and movement are complex, involving a combination of plasma dynamics, FACs bifurcation, and the influence of IMF orientation. The bifurcation of upward FACs and their extension into the lobe, as shown in our simulations, provides a new perspective on how MTPAs form and evolve. This contrasts with previous conceptual models that primarily emphasized tail twist dynamics, suggesting instead that localized flow shears and plasma interaction at the LLBL play a significant role in the observed auroral arcs evolution.
5 Conclusion
The formation of MTPAs results from a comprehensive coupling process between the solar wind, magnetosphere and ionosphere. When the IMF turns from dawnward to duskward, MTPAs are generated within the northern hemisphere polar cap and continue to migrate towards the duskside under sustained IMF By >0 conditions. Simultaneously, flow shears of particles are observed on both sides of these MTPAs, a key feature noted in the RISR-N radar data.
The simulations indicate that the duskward movement of MTPAs in the polar cap results from the bifurcation of filamentary FACs near the central magnetotail, extending into the lobe regions. Following an abrupt IMF turn, flow shears arise between the central plasma sheet of the magnetotail and solar wind particles at the LLBL. This interaction drives high-temperature, high-density plasma into the lobe regions along open magnetic field lines, making it a potential source region for the formation of MTPAs. The upward FACs extending into the lobe accelerate magnetospheric electrons along magnetic field lines, leading to their precipitation into the polar ionosphere and the generation of auroral arcs within the auroral oval.
As these electrons precipitate, their associated plasma footprints, mapped to the Northern Hemisphere polar cap, exhibit a continuous duskward drift, consistent with both simulation results and ground-based observations. This study provides a explanation for the formation and migration of IMF-modulated MTPAs, offering new insights into the processes by which matter and energy are transported from the solar wind to the magnetosphere and ionosphere.
Data availability statement
The solar wind and IMF data are available on the NASA OMNIWeb https://omniweb.gsfc.nasa.gov/form/omni_min.html. The DMSP SSUSI data are available on the Johns Hopkins University Applied Physics Laboratory website at https://cdaweb.gsfc.nasa.gov/pub/data/dmsp. The RSB ASI data at 630.0 nm is obtained from Index of /data/ergsc/ground/camera/omti/asi/rsb/2017/11/16. The 3D MHD simulation data are available on the website: https://doi.org/10.5281/zenodo.14264617. Resolute Bay North IS Radar data from: Rideout W., Cariglia K. CEDAR Madrigal Database URL: http://cedar.openmadrigal.org.
Author contributions
Y-JS: Methodology, Formal analysis, Writing – original draft, Writing – review and editing. Q-HZ: Conceptualization, Supervision, Writing – review and editing. Z-YX: Conceptualization, Supervision, Writing – review and editing. X-YW: Formal analysis, Methodology, Writing – review and editing. DZ: Formal analysis, Writing – review and editing. B-BT: Software, Writing – review and editing. SL: Writing – review and editing. Y-ZM: Formal analysis, Writing – review and editing. YW: Formal analysis, Writing – review and editing. Z-FX: Writing – review and editing. X-MC: Writing – review and editing. TX: Writing – review and editing. S-JS: Writing – review and editing. JW: Writing – review and editing. VM: Writing – review and editing.
Funding
The author(s) declare that financial support was received for the research and/or publication of this article. This research was funded by the National Natural Science Foundation of China (Grants 42325404, 42120104003, 42204164, 42474219), the Chinese Meridian Project, the International Partnership Program of Chinese Academy of Sciences (Grant 183311KYSB20200003), Shandong Provincial Natural Science Foundation (Grants ZR2022QD077, ZR2022MD034), the Stable-Support Scientific Project of China Research Institute of Radiowave Propagation (Grant A241204230), National Program on Key Basic Research Project (Grant 2022-173-SD-1) and the Taishan scholars Program.
Acknowledgments
The authors acknowledge use of NASA/GSFC’s Space Physics Data Facility’s OMNIWeb (or CDAWeb or ftp) service, and OMNI data. The authors acknowledge the Johns Hopkins University Applied Physics Laboratory for providing the DMSP/SSUSI data (https://cdaweb.gsfc.nasa.gov/pub/data/dmsp/). RISR-N data were obtained from the Madrigal database (http://cedar.openmadrigal.org/ftp/). OMTI data is available by contacting Dr. K. Shiokawa (c2hpb2thd2FAaXNlZS5uYWdveWEtdS5hYy5qcA==).
Conflict of interest
The authors declare that the research was conducted in the absence of any commercial or financial relationships that could be construed as a potential conflict of interest.
Generative AI statement
The author(s) declare that no Generative AI was used in the creation of this manuscript.
Publisher’s note
All claims expressed in this article are solely those of the authors and do not necessarily represent those of their affiliated organizations, or those of the publisher, the editors and the reviewers. Any product that may be evaluated in this article, or claim that may be made by its manufacturer, is not guaranteed or endorsed by the publisher.
References
Bahcivan, H., Tsunoda, R., Nicolls, M., and Heinselman, C. (2010). Initial ionospheric observations made by the new Resolute incoherent scatter radar and comparison to solar wind IMF. Geophys. Res. Lett. 37 (15). doi:10.1029/2010GL043632
Chang, S. W., Scudder, J. D., Sigwarth, J. B., Frank, L. A., Maynard, N. C., Burke, W. J., et al. (1998). A comparison of a model for the theta aurora with observations from Polar, Wind, and SuperDARN. J. Geophys. Res. Space Phys. 103 (A8), 17367–17390. doi:10.1029/97JA02255
Cumnock, J. A. (2005). High-latitude aurora during steady northward interplanetary magnetic field and changing IMF By. J. Geophys. Res. Space Phys. 110 (A2). doi:10.1029/2004JA010867
Cumnock, J. A., Sharber, J. R., Heelis, R. A., Hairston, M. R., and Craven, J. D. (1997). Evolution of the global aurora during positive IMF Bz and varying IMF By conditions. J. Geophys. Res. Space Phys. 102 (A8), 17489–17497. doi:10.1029/97JA01182
Dungey, J. W. (1961). Interplanetary magnetic field and the auroral zones. Phys. Rev. Lett. 6 (2), 47–48. doi:10.1103/PhysRevLett.6.47
Fear, R. C., Milan, S. E., Maggiolo, R., Fazakerley, A. N., Dandouras, I., and Mende, S. B. (2014). Direct observation of closed magnetic flux trapped in the high-latitude magnetosphere. Science 346 (6216), 1506–1510. doi:10.1126/science.1257377
Frank, L. A., Craven, J. D., Gurnett, D. A., Shawhan, S. D., Weimer, D. R., Burch, J. L., et al. (1986). The theta aurora. J. Geophys. Res. Space Phys. 91 (A3), 3177–3224. doi:10.1029/JA091iA03p03177
Golovchanskaya, I. V., Kullen, A., Maltsev, Y. P., and Biernat, H. (2006). Ballooning instability at the plasma sheet–lobe interface and its implications for polar arc formation. J. Geophys. Res. Space Phys. 111 (A11). doi:10.1029/2005JA011092
Guo, X. C., Wang, C., and Hu, Y. Q. (2010). Global MHD simulation of the Kelvin-Helmholtz instability at the magnetopause for northward interplanetary magnetic field. J. Geophys. Res. Space Phys. 115 (A10). doi:10.1029/2009JA015193
Hasegawa, H., Fujimoto, M., Phan, T. D., Rème, H., Balogh, A., Dunlop, M. W., et al. (2004). Transport of solar wind into Earth's magnetosphere through rolled-up Kelvin–Helmholtz vortices. Nature 430 (7001), 755–758. doi:10.1038/nature02799
Hosokawa, K., Kullen, A., Milan, S., Reidy, J., Zou, Y., Frey, H. U., et al. (2020). Aurora in the polar cap: a review. Space Sci. Rev. 216 (1), 15. doi:10.1007/s11214-020-0637-3
Hu, Y. Q., Guo, X. C., and Wang, C. (2007). On the ionospheric and reconnection potentials of the earth: results from global MHD simulations. J. Geophys. Res. Space Phys. 112 (A7). doi:10.1029/2006JA012145
Huang, C. Y., Craven, J. D., and Frank, L. A. (1989). Simultaneous observations of a theta aurora and associated magnetotail plasmas. J. Geophys. Res. Space Phys. 94 (A8), 10137–10143. doi:10.1029/JA094iA08p10137
Knight, S. (1973). Parallel electric fields. Planet. Space Sci. 21 (5), 741–750. doi:10.1016/0032-0633(73)90093-7
Kozlovsky, A., Aikio, A., Turunen, T., Nilsson, H., Sergienko, T., Safargaleev, V., et al. (2007). Dynamics and electric currents of morningside Sun-aligned auroral arcs. J. Geophys. Res. Space Phys. 112 (A6). doi:10.1029/2006JA012244
Kullen, A. (2000). The connection between transpolar arcs and magnetotail rotation. Geophys. Res. Lett. 27 (1), 73–76. doi:10.1029/1999GL010675
Kullen, A. (2012). “Transpolar arcs: summary and recent results,” in Auroral phenomenology and magnetospheric processes: Earth and other planets, 69–80.
Kullen, A., Brittnacher, M., Cumnock, J. A., and Blomberg, L. G. (2002). Solar wind dependence of the occurrence and motion of polar auroral arcs: a statistical study. J. Geophys. Res. Space Phys. 107 (A11), 13–23. doi:10.1029/2002JA009245
Kullen, A., Cumnock, J. A., and Karlsson, T. (2008). Seasonal dependence and solar wind control of transpolar arc luminosity. J. Geophys. Res. Space Phys. 113 (A8). doi:10.1029/2008JA013086
Li, W., Wang, C., Tang, B., Guo, X., and Lin, D. (2013). Global features of Kelvin-Helmholtz waves at the magnetopause for northward interplanetary magnetic field. J. Geophys. Res. Space Phys. 118 (8), 5118–5126. doi:10.1002/jgra.50498
Lyons, L. R. (1981). “The field-aligned current versus electric potential relation and auroral electrodynamics,” in Physics of auroral arc formation., 252–259.
Makita, K., Meng, C. I., and Akasofu, S. I. (1991). Transpolar auroras, their particle precipitation, and IMF y component. J. Geophys. Res. Space Phys. 96 (A8), 14085–14095. doi:10.1029/90JA02323
Milan, S. E., Hubert, B., and Grocott, A. (2005). Formation and motion of a transpolar arc in response to dayside and nightside reconnection. J. Geophys. Res. Space Phys. 110 (A1). doi:10.1029/2004JA010835
Newell, P. T., and Meng, C.-I. (1995). Creation of theta-auroras: the isolation of plasma sheet fragments in the polar cap. Science 270 (5240), 1338–1341. doi:10.1126/science.270.5240.1338
Paxton, L. J., Meng, C. I., Fountain, G. H., Ogorzalek, B. S., Darlington, E. H., Gary, S. A., et al. (1992). Special sensor ultraviolet spectrographic imager: an instrument description. Proc. SPIE. Instrumentation for Planetary and Terrestrial Atmospheric Remote Sensing, 1745. doi:10.1117/12.60595
Rezhenov, B. V., and Vardavas, I. M. (1995). A possible mechanism for <theta> aurora formation. Ann. Geophys. 13 (7), 698–703. doi:10.1007/s00585-995-0698-3
Shiokawa, K., Katoh, Y., Satoh, M., Ejiri, M. K., Ogawa, T., Nakamura, T., et al. (1999). Development of optical mesosphere thermosphere imagers (OMTI). Earth, Planets Space 51 (7), 887–896. doi:10.1186/BF03353247
Shiokawa, K., Otsuka, Y., and Ogawa, T. (2009). Propagation characteristics of nighttime mesospheric and thermospheric waves observed by optical mesosphere thermosphere imagers at middle and low latitudes. Earth, Planets Space 61 (4), 479–491. doi:10.1186/BF03353165
Tanaka, T., Obara, T., and Kunitake, M. (2004). Formation of the theta aurora by a transient convection during northward interplanetary magnetic field. J. Geophys. Res. Space Phys. 109 (A9). doi:10.1029/2003JA010271
Tanaka, T., Obara, T., Watanabe, M., Fujita, S., Ebihara, Y., and Kataoka, R. (2017). Formation of the Sun-aligned arc region and the void (polar slot) under the null-separator structure. J. Geophys. Res. Space Phys. 122 (4), 4102–4116. doi:10.1002/2016JA023584
Tang, B., and Wang, C. (2018). Large scale current systems developed from substorm onset: global MHD results. Sci. China Technol. Sci. 61 (3), 389–396. doi:10.1007/s11431-017-9132-y
Tsyganenko, N. A. (1989). A magnetospheric magnetic field model with a warped tail current sheet. Planet. Space Sci. 37 (1), 5–20. doi:10.1016/0032-0633(89)90066-4
Wang, C., Guo, X., Peng, Z., Tang, B., Sun, T., Li, W., et al. (2013). Magnetohydrodynamics (MHD) numerical simulations on the interaction of the solar wind with the magnetosphere: a review. Sci. China Earth Sci. 56 (7), 1141–1157. doi:10.1007/s11430-013-4608-3
Xing, Z., Zhang, Q., Han, D., Zhang, Y., Sato, N., Zhang, S., et al. (2018). Conjugate observations of the evolution of polar cap arcs in both hemispheres. J. Geophys. Res. Space Phys. 123 (3), 1794–1805. doi:10.1002/2017JA024272
Yamamoto, T., and Ozaki, M. (2005). A numerical model of the dayside aurora. J. Geophys. Res. Space Phys. 110 (A5). doi:10.1029/2004JA010786
Zhang, Q.-H., Lockwood, M., Foster, J. C., Zong, Q., Dunlop, M. W., Zhang, S., et al. (2018). Observations of the step-like accelerating processes of cold ions in the reconnection layer at the dayside magnetopause. Sci. Bull. 63 (1), 31–37. doi:10.1016/j.scib.2018.01.003
Zhang, Q-H., Zhang, B.-C., Lockwood, M., Hu, H-Q., Moen, J., Ruohoniemi, J. M., et al. (2013). Direct observations of the evolution of polar cap ionization patches. Science 339 (6127), 1597–1600. doi:10.1126/science.1231487
Zhang, Q-H., Zhang, Y-L., Wang, C., Lockwood, M., Yang, H-G., Tang, B-B., et al. (2020). Multiple transpolar auroral arcs reveal insight about coupling processes in the Earth’s magnetotail. Proc. Natl. Acad. Sci. 117 (28), 16193–16198. doi:10.1073/pnas.2000614117
Zhang, Q-H., Zhang, Y-L., Wang, C., Oksavik, K., Lyons, L. R., Lockwood, M., et al. (2021). A space hurricane over the Earth’s polar ionosphere. Nat. Commun. 12 (1), 1207. doi:10.1038/s41467-021-21459-y
Zhang, Y., Paxton, L. J., Zhang, Q., and Xing, Z. (2016). Polar cap arcs: sun-aligned or cusp-aligned? J. Atmos. Solar-Terrestrial Phys. 146, 123–128. doi:10.1016/j.jastp.2016.06.001
Keywords: aurora, solar-terrestrial interaction, magnetosphere, polar ionosphere, multiple transpolar arcs
Citation: Sun Y-J, Zhang Q-H, Xing Z-Y, Wang X-Y, Zhang D, Tang B-B, Lu S, Ma Y-Z, Wang Y, Xiu Z-F, Chen X-M, Xu T, Sun S-J, Wang J and Manu V (2025) Characteristics of multiple transpolar arcs motion and its corresponding magnetospheric dynamic process. Front. Astron. Space Sci. 12:1589264. doi: 10.3389/fspas.2025.1589264
Received: 07 March 2025; Accepted: 12 May 2025;
Published: 11 June 2025.
Edited by:
Nadia Imtiaz, Pakistan Institute of Nuclear Science and Technology, PakistanReviewed by:
Riley N. Troyer, Utah State University, United StatesAffelia Wibisono, Dublin Institute for Advanced Studies (DIAS), Ireland
Copyright © 2025 Sun, Zhang, Xing, Wang, Zhang, Tang, Lu, Ma, Wang, Xiu, Chen, Xu, Sun, Wang and Manu. This is an open-access article distributed under the terms of the Creative Commons Attribution License (CC BY). The use, distribution or reproduction in other forums is permitted, provided the original author(s) and the copyright owner(s) are credited and that the original publication in this journal is cited, in accordance with accepted academic practice. No use, distribution or reproduction is permitted which does not comply with these terms.
*Correspondence: Qing-He Zhang, emhhbmdxaW5naGVAbnNzYy5hYy5jbg==; Zan-Yang Xing, eGluZ3phbnlhbmdAc2R1LmVkdS5jbg==