 Anneliese L. Schmidt1*
 John W. Meriwether1
 Matthew B. Cooper2
 Andrew J. Gerrard1
 Lindsay V. Goodwin1
 Shun-Rong Zhang3Ying Ye4
- 1Department of Physics, Center for Solar-Terrestrial Research, New Jersey Institute of Technology, Newark, NJ, United States
- 2Orion Space Solutions (An Arcfield Company), Louisville, CO, United States
- 3Haystack Observatory, Massachusetts Institute of Technology, Westford, MA, United States
- 4Department of Physics and Astronomy, Rice University, Houston, TX, United States
The need for high precision measurements of vertical winds with uncertainties on the scale of 3–5 m
1 Introduction
Lower-boundary driving wave activity in the upper atmosphere, signified by perturbations of the thermospheric winds and temperatures, is an indication of energy transfer from lower altitudes into the thermosphere. Such activity has been suggested to trigger ionospheric instabilities within the coupled ionosphere/thermosphere system (Hines, 1960; Huang et al., 1994; Nicolls and Kelley, 2005). Studies of thermospheric winds utilizing Doppler velocity measurements of the 630 nm OI spectral profile during periods of low and high geomagnetic activity were first reported by Biondi and Feibelman (1968), Armstrong (1969), and Hays et al. (1969). Fabry-Perot interferometers (FPIs) have been extensively used since then to measure line-of-sight (LOS) Doppler velocity measurements in the cardinal and zenith directions to derive the thermospheric wind vector U (u,v,w). Data representing FPI observations of thermospheric vertical winds have been studied, with notable results demonstrating large apparent vertical winds evident during enhanced geomagnetic activity (Hernandez, 1982; Sipler et al., 1995) and at midlatitudes (Larsen and Meriwether, 2012) with oscillatory behavior (Hernandez, 1982; Sipler et al., 1995; Innis and Conde, 2001; Trinh et al., 2018)) that have been identified to be caused by the existence and ubiquitous nature of gravity waves (GWs) in the thermosphere (Hines, 1960). Wind and temperature oscillations and wave structures caused by GW activity are diminished by the viscous dissipation in the thermosphere which can dampen wave activity.
Traveling ionospheric disturbances (TIDs) are characterized by quasi-periodic, spatially propagating wave-like structures in the F-region plasma. Medium-scale TIDs (MSTIDs) are commonly observed in 630 nm OI nightglow imagery with having systematic westward and equatorward motion at nighttime in the Northern Hemisphere (Shiokawa et al., 2009; Martinis et al., 2009; Otsuka et al., 2013). These events can be identified via perturbations of the spatial distribution of time-differenced, i.e., differential, total electron count (dTEC) maps. MSTIDs were originally explained as being a consequence of the Perkins instability as the predicted propagation direction is consistent with the observed southwestward direction (Perkins, 1973). However, the shortcoming of this explanation is that the growth rate of the Perkin’s instability was found to be much slower than what is apparent in observations. Moreover, a seeding mechanism would also be required (Kelley and Makela, 2001). Kelley and Fukao (1991); Shiokawa et al. (2003); Nicolls and Kelley (2005); Makela and Otsuka (2012) among others have speculated that GWs could induce polarization electric fields which would reinforce the growth rate of Perkin’s Instability. Zhang et al. (2021) used dTEC maps and incoherent scatter radar data and found evidence suggesting periodic meridional polarization electric fields that might be associated with midlatitude GW events. MSTIDS and large-scale TIDs (LSTIDs) are often classified as having a close relation to induced activity from propagating and dissipating GWs. Disturbed neutral winds associated with the propagation of GWs create and/or enhance electric fields, transferring energy and momentum from the F-region plasma to the upper atmosphere, thus contributing to the high complexity of the coupling between the thermosphere and ionosphere.
It has been nearly impossible to study the response of the thermosphere due to GW activity in the past due to the need for high precision Doppler velocity measurements on the scale of 3–5 m
2 Instrumentation
HODI is a 15 cm aperture etalon FPI that uses an apochromatic lens assembly with four elements and focal length of 300 mm developed by Keo Scientific, Ltd. This optical component provides the correction needed to achieve a fully focused ring pattern on the charge coupled detector (CCD) chip within the focal plane (Unick et al., 2019) that includes 12 and 11 rings for OI 630 nm and OII
The low noise CCD camera has a 90% imaging quantum efficiency. Moreover, the field of view of each of the 12 rings is the equivalent of the field of view of a single order scanning FPI such as that discussed extensively by Hernandez (1986). With a 15 cm etalon aperture, HODI has an increased field of view of
The analysis of FPI images to extract wind and temperature measurements from FPI data is based upon the implementation of the profile fitting analysis described by Harding et al. (2014). This approach is based upon first determining the ring center position followed by performing an annular summing of the 512 × 512 superpixel signals about the ring center as described by Coakley (1995) to determine a one-dimensional interferogram with 500 points along the abscissa with 42 points per order at 630 nm. The FPI instrument function at the 630 nm emission wavelength is calibrated using a frequency stabilized HeNe 632.8 nm laser source. The position of the ring center is determined by analyzing cross-sections of the observed image to generate the interferogram. The two peaks of the innermost order relative to the ring center were determined for a Gaussian function and the ring center pixel coordinates were averaged using all of the cross-section estimates of the ring center position. Once the peak ring center is calculated and the 1D interferogram is generated, the temperature derived from the Doppler broadening of the FPI instrument function and the intensity determined from the area covered by the 1D spectral profile can be derived by using a non-linear least square fitting procedure (Innis et al., 1999; Meriwether et al., 2011; Shiokawa et al., 2012; Nicolls et al., 2012; Harding et al., 2014).
The calculation of the Doppler zero assumes that the averaged amplitudes of the zenith wind speed over long periods of time is small relative to the horizontal speeds. Using this assumption, the Doppler zero was found using the average of all of the phase differences between the 630 nm zenith peak and the laser peak positions. The HODI analysis algorithm follows the methods outlined in Harding et al. (2014). The Harding et al. (2014) blurring model is used to fit the interferogram peaks under the assumption that some vignetting is causing the peak height to decrease slightly and the instrumental width to broaden somewhat. The usage of a non-linear Airy function with optical distortion parameters as the instrument function allows for the best estimate of accurate wind velocities. The retrieval of the error estimates for the HODI data products is also outlined in Harding et al. (2014). The error bars plotted in this study, derived from the Harding analysis algorithm, represent an accurate measure of the retrieval error in carrying out the non-linear least-square fit of the model spectral profile to the data. The error bars of the HODI measurements do not follow a statistical random fluctuation pattern associated with the randomness of noise. This supports our view that the results of this study are true wave patterns and not the products of noise.
One concern regarding the analysis of 630 nm observations using HODI is whether the 1.0 nm passband of the 630 nm filter is sufficient to remove or attenuate the weak OH contamination present at 627.9 nm. Recent work by Kerr et al. (2023) has demonstrated that the existence of this OH emission will introduce an error in the Doppler shift and Doppler broadening retrieval of the LOS wind velocities and the temperature derived from the comparison of the forward model to the data. While the OH emission does represent a possible source of error, we suggest that it is not serious, as the 630.0 nm emission rate is high during the near solar-maximum period, with our data sets being taken in Summer 2022. Filter fabrication technology has improved such that more narrow bandwidth filters may be used to help ameliorate this concern in future measurements in new instrumentation. The OH contamination concern is further discussed in Section 3, Section 4, Section 5.
The first-light campaign using the HODI instrument took place at the Jeffer Observatory (JO) located in Jenny Jump State Forest in northwestern New Jersey (
3 Observations
During its first light campaign at JO, HODI observed the 630 nm emission profile in the zenith and cardinal directions with an exposure time of 120 s for each direction. In this study, only the zenith direction was used in the analysis. Only observing nights with clear skies were processed using the data analysis procedure discussed in Section 2. We present perturbations and wave activity in the vertical winds, w, as well as the residual vertical wind w’ which is the result of the subtraction of a high-order polynomial fit
We highlight one series of observations showing evidence of a monochromatic wave event. In this study, monochromatic is used to describe a wave event in which the wave is spatially and temporally coherent, with an apparent wavelength. In addition, from a total database including measurements over 57 nights, we selected two sets of five nights, each with respect to high or low geomagnetic activity. We will use these results to showcase HODI observations of vertical wind and temperature wave activity in subauroral latitudes and to determine what effects on thermospheric dynamics might develop as a result of increased geomagnetic activity. We conclude with the presentation of a case study of two nights of activity selected from these observations that also include dTEC maps generated at MIT Haystack Observatory using GNSS TEC data. The data includes observations from both the GPS and GLONASS constellations. The dTEC values are obtained by detrending the smooth background TEC variations using 30-min sliding windows (Zhang et al., 2017c; Zhang et al., 2017a) and have been used extensively for studying the effects of TIDs. We present dTEC and potential TID activity as an insight into the ionosphere during congruent observations from HODI, as one-to-one comparisons between wind or temperature fluctuations do not appear to agree with respect to dTEC observations at the location of JO.
3.1 Potential monochromatic wave event on 25 July 2022
The wind and temperature measurements of the HODI 630 nm emission profiles highlight potential monochromatic GW fluctuations in the vertical wind and temperature on 25 July 2022 shown in Figure 1. The skies above JO were clouded in the early evening (02:00–05:00 UT), but wave fluctuations were picked up by HODI nonetheless. Moderate cloud cover can lightly attenuate measurements observed by HODI, which did not greatly affect the data products used in this study. The vertical winds show a
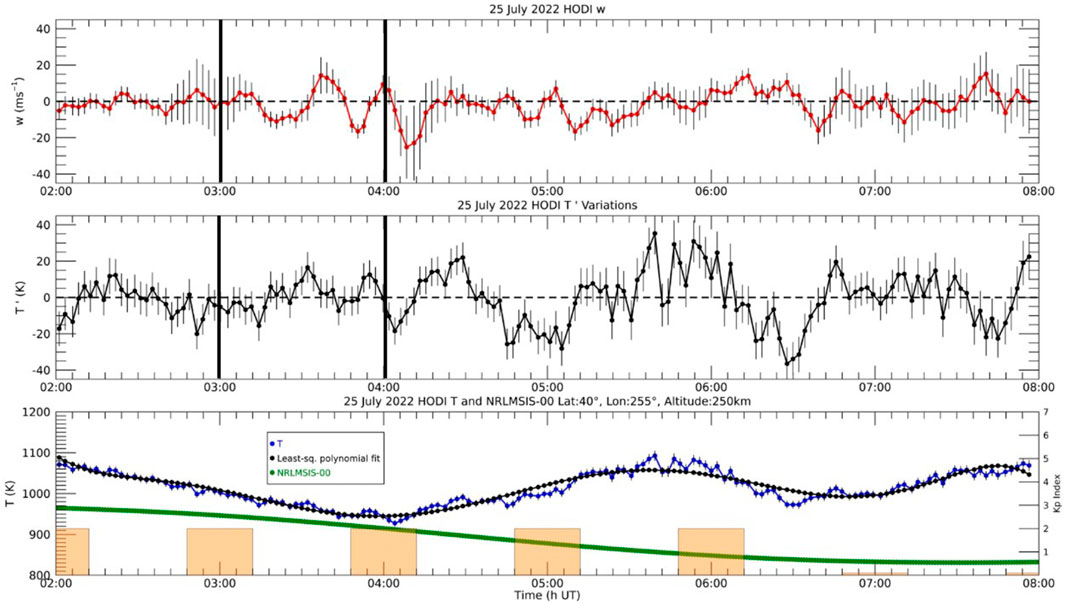
Figure 1. HODI observations of vertical winds (top, w) and residual temperatures (middle, T ′) from the subtraction of the observed temperatures (bottom blue, T) from the high order least-square polynomial fitting (bottom black) with the NRLMSIS-00 empirical model with inputs of altitude: 250 km, Lat.:
The raw temperature observations were fitted via a high-order least-square polynomial fit and the residual temperatures were derived from the difference of the raw and fitted temperatures and are plotted in Figure 1. The Kp index for each hour of observations are plotted against the temperature measurements to show the current geomagnetic conditions, as well as the neutral temperatures from the NRLMSISE-00 empirical model (Picone et al., 2002) to show thermal variations of the thermosphere temperature at 250 km and at the approximate latitude and longitude of JO. Kp index was used to highlight the general level of geomagnetic activity that may affect the thermosphere. Wave fluctuations in the temperature residuals on the order of
Figure 2 shows the phase differences between the residual temperature series and the vertical wind oscillation series using a hodogram graphic. Data selected for the period from 03:00–04:00 UT, the time of the proposed monochromatic GW event, is shown in Figure 2 with the residual temperature and vertical wind velocity presented as the abscissa and ordinate, respectively. A circle is created in a hodogram when the temperature residuals leads the vertical winds by a phase angle of

Figure 2. Hodogram from HODI residual temperature (T ′) observations and vertical wind velocities (w) from 25 July 2022 from 03:00–04:00 UT. S marks the start of the observations at 03:00 UT, E marks the end of the observations at 04:00 UT.
A keogram (composite of meridional cross-sections) was utilized to examine the dTEC of the approximate location of JO (
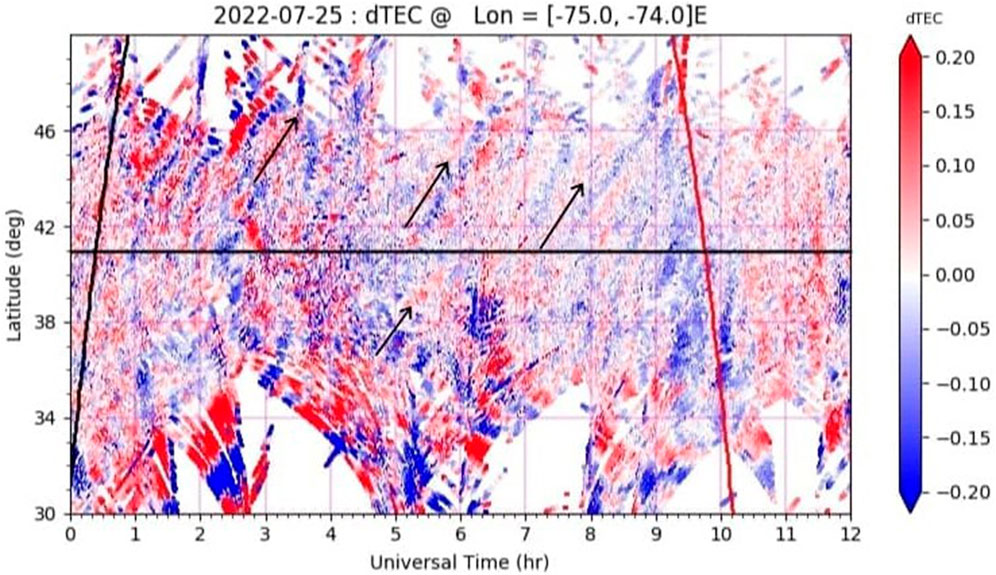
Figure 3. dTEC between
3.2 Active and quiet geomagnetic observation wave analysis
We conducted case studies of vertical wind velocity and temperature observations for a selection of geomagnetic active and quiet nights observed by HODI. Clear skies prevailed for these nights except for the duration of the observation period (02:00–09:00 UT) at JO on 26 August 2022 which was partly cloudy. These dates were chosen based on a review of both weather and Kp-indices. The nights with the best clarity as well as the highest and lowest series of Kp indices were chosen for this case study.
Figures 4, 5 present the vertical wind velocities and temperatures observed by HODI for active and quiet geomagnetic nights between 02:00 and 09:00 UT, respectively. These plots include a comparison of wave structure as seen in the vertical wind velocity data and in the temperature residual data observed by HODI. Also included in this graph is the NRLMSIS-00 model curve and Kp index as explained prior. A high-order least-square polynomial fit was used in the calculation of the temperature residuals to probe the high-frequency wave patterns in the raw temperature data. Since the vertical winds have a precision good enough to see high frequency wave structure, the polynomial fit is utilized to demonstrate low frequency, long term periodic behavior of the vertical wind activity.
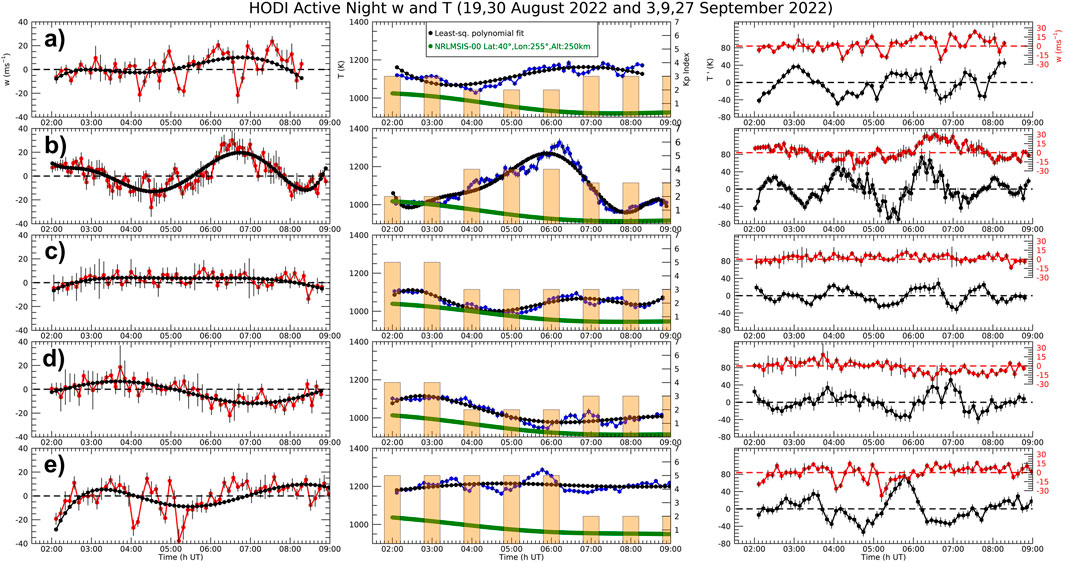
Figure 4. Comparison of vertical winds (red, w) and temperature residuals (right black, T ′) measured by HODI derived from the subtraction of observed temperatures (middle blue, T) from the least-square polynomial fitting (middle black) for the dates: (a) 19 August 2022, (b) 30 August 2022, (c) 3 September 2022, (d) 9 September 2022, (e) 27 September 2022. Temperatures are plotted with the NRLMSIS-00 empirical model with inputs of altitude: 250 km, Lat.:
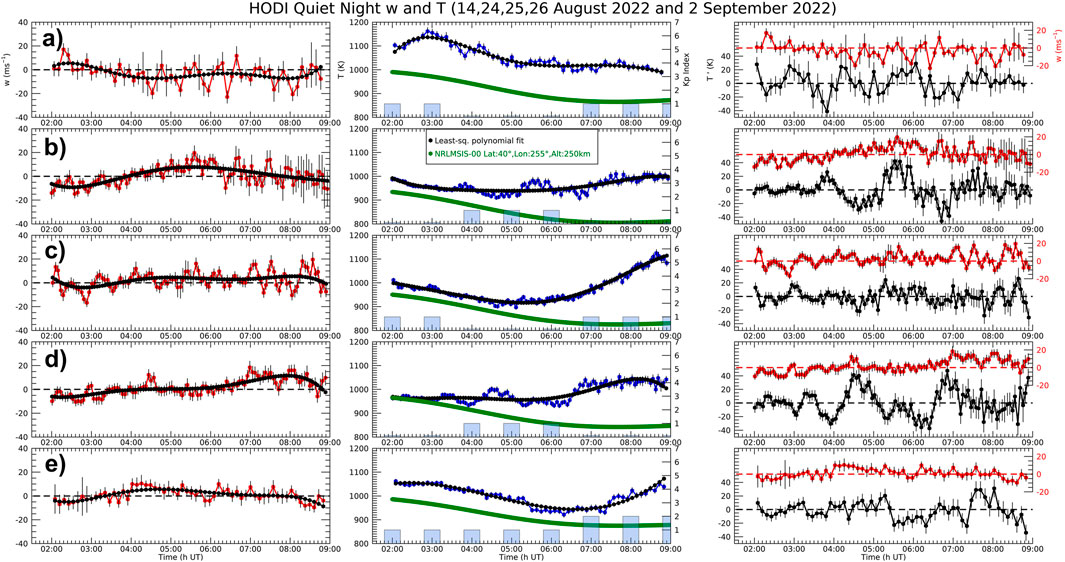
Figure 5. Comparison of vertical winds (red, w) and temperature residuals (right black, T ′) measured by HODI derived from the subtraction of observed temperatures (middle blue, T) from the least-square polynomial fitting (middle black) for the dates: (a) 14 August 2022, (b) 24 August 2022, (c) 25 August 2022, (d) 26 August 2022, (e) 2 September 2022. Temperatures are plotted with the NRLMSIS-00 empirical model with inputs of altitude: 250 km, Lat.:
The dates of nights selected for the case study of active geomagnetic nights observed by HODI include 19, 30 August and 3, 9, 27 September 2022. Inspection of these results show both high and low frequency wave structure in all active vertical wind velocity observations except for 3 September 2022 which was quite a bit less dynamic in spite of the background enhanced geomagnetic activity. Error bars are much less than the amplitudes of the vertical winds and temperature oscillations for all of the selected nights except for 3 September 2022, highlighting that the oscillations are unlikely due to noise. 19 August 2022 observations by HODI showcase high frequency oscillations in the vertical winds on the scale of
The case study based on quiet geomagnetic nights observed by HODI includes dates 14, 24, 25, 26 August and 2 September 2022. In these results, the error bars are much less than the amplitudes of the temperature oscillations for all of the selected nights, but the vertical wind data show fluctuations of similar magnitude to the error bars. Little low frequency wave structure are noted in any of these nights of data, but some high frequency oscillations are prevalent with little discernible pattern in period or amplitude. Some vertical wind wave structure can be seen in the observations from 25 August 2022 around 07:00 to 09:00 UT with amplitudes
3.2.1 30 August 2022 active wind and temperature wave structures
One night of interest from the active geomagnetic and clear nights is 30 August 2022 as shown in Figure 6. There is a temperature spike of from
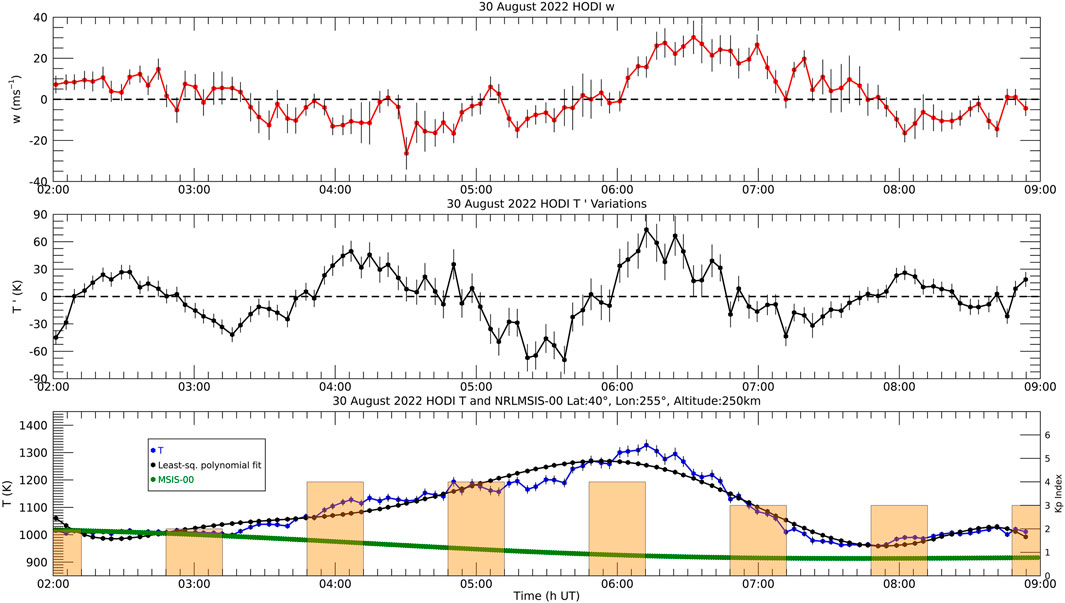
Figure 6. HODI observations of vertical winds (top, w) and residual temperatures (middle, T ′) derived from the subtraction of the observed temperatures (bottom blue, T) from the high order least-square polynomial fitting (bottom black) with the NRLMSIS-00 empirical model with inputs of altitude: 250 km, Lat.:
A keogram (composite of meridional cross-sections) was utilized to examine the dTEC of the approximate location of JO (
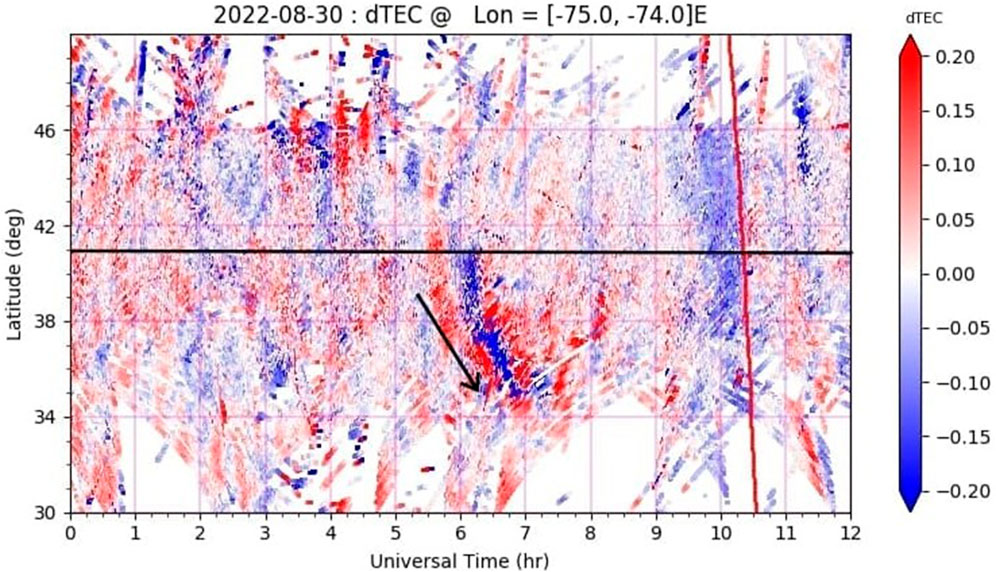
Figure 7. dTEC between
3.2.2 26 August 2022 quiet wind and temperature wave structures
One night of interest from the quiet geomagnetic and clear nights is 26 August 2022 as shown in Figure 8. HODI observed an oscillation in the temperature residuals with an
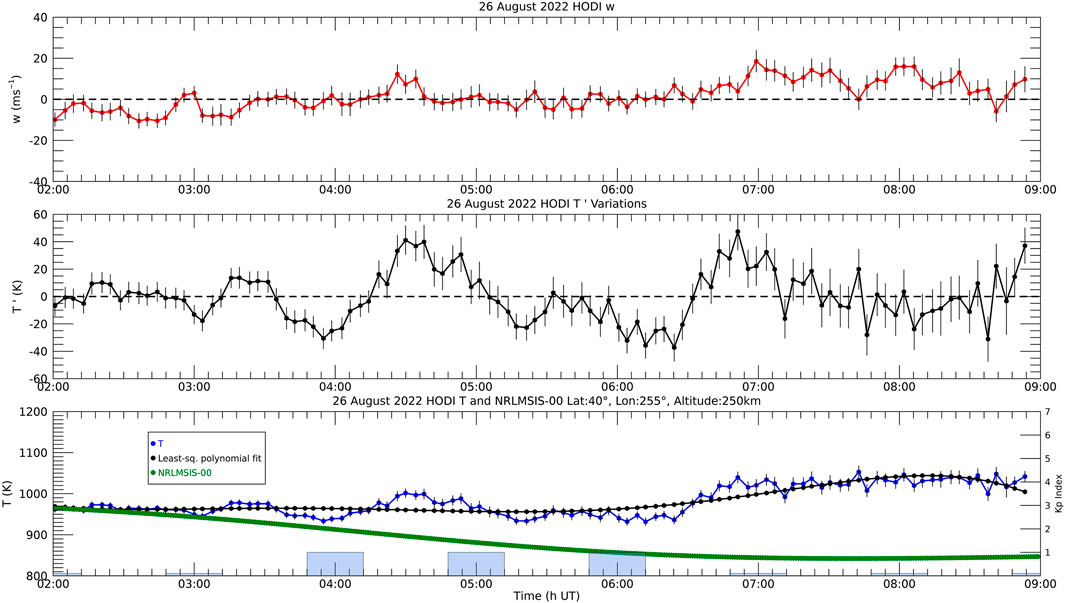
Figure 8. HODI observations of vertical winds (top, w) and residual temperatures (middle, T ′) derived from the subtraction of the observed temperatures (bottom blue, T) from the high order least-square polynomial fitting (bottom black) with the NRLMSIS-00 empirical model with inputs of altitude: 250 km, Lat.:
A keogram was utilized to examine the dTEC of the approximate location of JO (
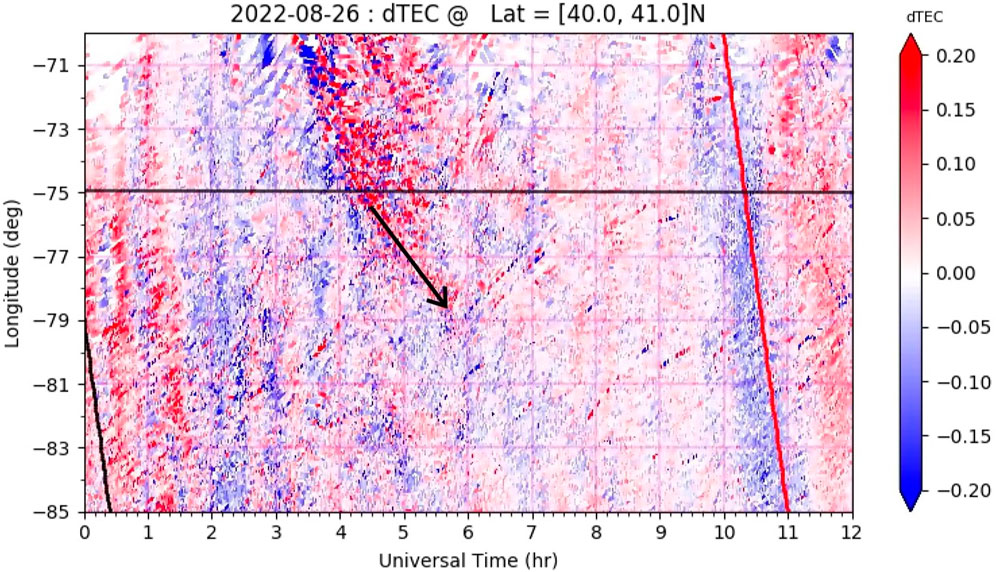
Figure 9. dTEC between
4 Discussion
The HODI first-light campaign proved to be successful in observing thermospheric wave structures. In every night of observations in the case study, oscillations and GW-like events occurred, irrespective of the degree of geomagnetic activity. For each case night, varying scales of TID activity were also apparent via dTEC keograms.
Observations on 30 August 2022 and 26 August 2022 as shown in Figures 6, 8, respectively, show that a close correlation between vertical wind and temperature fluctuations is not always prevalent, but all feature a series of corresponding oscillations with amplitudes less than a few meters per second but with multiple cycles evident each night. 30 August 2022 shows a low frequency oscillation in the vertical wind and wave train in temperatures potentially associated with a passing TID, while 26 August 2022 shows similar trends in oscillations during a quiet night, with dTEC activity implying propagating TIDs with less discernible structure. The 30 August 2022 night of observation was of particular interest as it was an active night with a large temperature peak near 07:00 UT and vertical wind and temperature oscillations. After visually comparing the dTEC signature of the TID in the 30 August 2022 keogram from Figure 7 and the flows in vertical wind from HODI in Figure 6, it is apparent that the depletion in dTEC does compare well with the vertical wind upward flows observed by HODI. Heating at low altitudes can cause neutral upwelling as well as GWs. This process is well known at auroral latitudes, however, at midlatitudes some processes can provide similar heating effects, such as subauroral polarization streams (SAPS). As a result, an upwelling of vertical winds can normally cause O/N2 depletion which could explain the depletion in observed dTEC. SAPS heating has been reported in previous studies such as Zhang et al. (2017b). Guo et al. (2018) simulated the GWs excited at subauroral latitudes through SAPS.
Examination of these case study results show that during periods of active geomagnetic conditions, wave structure is prevalent in temperature and often accompanied by long term periodic behavior in the vertical wind. During quiet geomagnetic conditions, wave structure is also prevalent in the temperature and wind data, but with decreased amplitudes. Namely, we observed vertical wind activity to be more vigorous for periods of greater geomagnetic activity. In general, no connection was apparent between temperature and vertical winds except for the one case of what looks to be a monochromatic wave event on 25 July 2022, based on Figure 2 which showcases a near
It is possible that HODI observed multiple superimposed GW events, which would make a connection between vertical wind and temperature wave activity nearly impossible to visualize. It is not clear how this superposition will be manifested, but what may be happening is that the high frequency content of the temperature data is converted into a low frequency wave structure by the superposition of GW events with different phases, and the temperature superposition would be additive. This may explain why the temperature wave structure is highly prominent in nights such as 30 and 26 August 2022. Due to this mixing, it would be difficult to quantify exactly how many nights GW behavior was apparent, but we expect these events to appear quite frequently. This behavior may also be seen for the superposition of wind velocities, but because the vertical wind is a vector quantity, this filtering of high frequency content would result in a low frequency wave in vertical winds that is no longer closely correlated with the temperature wave, based on visual inspection. Because this blending of multiple GW events takes place differently for the temperature and wind components, there is no reason to expect a correlation to appear. There is also the consideration that these observations of wind and temperature behavior in the zenith represent an average over the vertical extent of 50–70 km which is the typical range of the OI volume emission profile centered at 240–250 km. The background temperature profile will vary by 5–10
The viscosity of the thermosphere allows for the absorption of energy from GWs as a result of the transfer of waves from below to the thermosphere medium, but the proportion of energy transfer to the thermosphere from below and the energy transfer from mid to high latitudes have not undergone adequate study. Figure 2 showcases a case of thermospheric viscous dissipation of a potential monochromatic GW event as described by Pitteway and Hines (1963); Nicolls et al. (2012); Vadas and Nicolls (2012) among others. Instruments such as HODI are needed to make progress on understanding the detailed composition of the energy budget in terms of GW transfer, solar heating, and Joule heating that come about as a result of frictional heating due to the interaction of neutral transport with plasma drifts and momentum transfer.
As discussed in Section 2, the possible OH spectral contamination is an important caveat to consider within these results. More observations are needed to further examine these phenomena with greater statistical coverage and further consideration into potential OH contamination. New thermospheric 630 nm emission observations will be obtained with MaxFPI, a novel 20 cm aperture FPI instrument undergoing construction by Keo Scientific which will have
5 Conclusion
We have presented the first set of findings from the Hot Oxygen Doppler Imager first light campaign at Jeffer Observatory located in northwestern New Jersey. With the heightened sensitivity of its 15 cm aperture etalon, HODI is able to resolve wave activity in the neutral thermospheric vertical winds and temperature residuals with uncertainties of approximately 3–5 m
Data availability statement
The raw data supporting the conclusions of this article will be made available by the authors, without undue reservation.
Author contributions
AS: Methodology, Writing – review and editing, Writing – original draft, Visualization. JM: Supervision, Conceptualization, Data curation, Writing – review and editing, Investigation. MC: Writing – review and editing, Data curation. AG: Conceptualization, Writing – review and editing, Resources, Investigation, Supervision, Data curation. LG: Conceptualization, Writing – review and editing. S-RZ: Visualization, Methodology, Writing – review and editing. YY: Visualization, Writing – review and editing.
Funding
The author(s) declare that financial support was received for the research and/or publication of this article. NJIT authors recognize support from NSF Grant AGS-2230439. TEC data processing and Madrigal database system are provided to the community by MIT under NSF Grant AGS-1952737 support. Work at MIT is also supported by 80NSSC21K1310 and 80NSSC22K1074, and AGS-2149698, and AGS-2437054.
Acknowledgments
We are pleased to acknowledge the efforts and support of Gilbert Jeffer, Chris Callie, and the United Astronomy Clubs of New Jersey to help achieve the deployment of the HODI instrument to the Jeffer Observatory in Jenny Jump State Forest to obtain the observations described in this report. We would also like to acknowledge funds from the New Jersey Institute of Technology Center for Solar-Terrestrial Research.
Conflict of interest
Author MC was employed by Orion Space Solutions.
The remaining authors declare that the research was conducted in the absence of any commercial or financial relationships that could be construed as a potential conflict of interest.
The author(s) declared that they were an editorial board member of Frontiers, at the time of submission. This had no impact on the peer review process and the final decision.
Generative AI statement
The author(s) declare that no Generative AI was used in the creation of this manuscript.
Publisher’s note
All claims expressed in this article are solely those of the authors and do not necessarily represent those of their affiliated organizations, or those of the publisher, the editors and the reviewers. Any product that may be evaluated in this article, or claim that may be made by its manufacturer, is not guaranteed or endorsed by the publisher.
References
Armstrong, E. (1969). Doppler shifts in the wavelength of the OI λ6300 line in the night airglow. Planet. Space Sci. 17, 957–974. doi:10.1016/0032-0633(69)90101-9
Biondi, M. A., and Feibelman, W. A. (1968). Twilight and nightglow spectral line shapes of oxygen λ6300 and λ5577 radiation. Planet. Space Sci. 16, 431–443. doi:10.1016/0032-0633(68)90158-X
Coakley, M. M. (1995). Application of the CCD Fabry-Perot annular summing technique to thermospheric. The University of Wisconsin - Madison. Copyright - Database copyright ProQuest LLC; ProQuest does not claim copyright in the individual underlying works.
Ford, E. A. K., Aruliah, A. L., Griffin, E. M., and McWhirter, I. (2007). High time resolution measurements of the thermosphere from Fabry-Perot interferometer measurements of atomic oxygen. Ann. Geophys. 25, 1269–1278. doi:10.5194/angeo-25-1269-2007
Guo, J.-P., Deng, Y., Zhang, D.-H., Lu, Y., Sheng, C., and Zhang, S.-R. (2018). The effect of subauroral polarization streams on ionosphere and thermosphere during the 2015 st. patrick’s day storm: global ionosphere-thermosphere model simulations. J. Geophys. Res. Space Phys. 123, 2241–2256. doi:10.1002/2017JA024781
Harding, B. J., Gehrels, T. W., and Makela, J. J. (2014). Nonlinear regression method for estimating neutral wind and temperature from Fabry-Perot interferometer data. Appl. Opt. 53, 666–673. doi:10.1364/AO.53.000666
Hays, P. B., Nagy, A. F., and Roble, R. G. (1969). Interferometric measurements of the 6300 a Doppler temperature during a magnetic storm. J. Geophys. Res. (1896-1977) 74, 4162–4168. doi:10.1029/JA074i016p04162
Hernandez, G. (1982). Vertical motions of the neutral thermosphere at midlatitude. Geophys. Res. Lett. 9, 555–557. doi:10.1029/GL009i005p00555
Hernandez, G. (1986). Fabry-Perot interferometers: cambridge studies in modern optics 3. Cambridge University Press.
Hines, C. O. (1960). Internal atmospheric gravity waves at ionospheric heights. Can. J. Phys. 38, 1441–1481. doi:10.1139/p60-150
Huang, C.-S., Miller, C. A., and Kelley, M. C. (1994). Basic properties and gravity wave initiation of the midlatitude F region instability. Radio Sci. 29, 395–405. doi:10.1029/93RS01669
Innis, J., Greet, P., Murphy, D., Conde, M., and Dyson, P. (1999). A large vertical wind in the thermosphere at the auroral oval/polar cap boundary seen simultaneously from Mawson and Davis, Antarctica. J. Atmos. Solar-Terrestrial Phys. 61, 1047–1058. doi:10.1016/S1364-6826(99)00060-7
Innis, J. L., and Conde, M. (2001). Thermospheric vertical wind activity maps derived from Dynamics Explorer-2 Wats observations. Geophys. Res. Lett. 28, 3847–3850. doi:10.1029/2001GL013704
Kelley, M. C., and Fukao, S. (1991). Turbulent upwelling of the mid-latitude ionosphere: 2. theoretical framework. J. Geophys. Res. Space Phys. 96, 3747–3753. doi:10.1029/90JA02252
Kelley, M. C., and Makela, J. J. (2001). Resolution of the discrepancy between experiment and theory of midlatitude F-region structures. Geophys. Res. Lett. 28, 2589–2592. doi:10.1029/2000GL012777
Kerr, R. B., Kapali, S., Harding, B. J., Riccobono, J., Migliozzi, M. A., Souza, J. R., et al. (2023). Spectral contamination of the 6300Å emission in single-etalon Fabry-Perot interferometers. J. Geophys. Res. Space Phys. 128, e2023JA031601. doi:10.1029/2023JA031601
Larsen, M. F., and Meriwether, J. W. (2012). Vertical winds in the thermosphere. J. Geophys. Res. Space Phys. 117. doi:10.1029/2012JA017843
Makela, J. J., and Otsuka, Y. (2012). Overview of nighttime ionospheric instabilities at low- and mid-latitudes: coupling aspects resulting in structuring at the mesoscale. Space Sci. Rev. 168, 419–440. doi:10.1007/s11214-011-9816-6
Martinis, C., Baumgardner, J., Mendillo, M., Su, S.-Y., and Aponte, N. (2009). Brightening of 630.0 nm equatorial spread-F airglow depletions. J. Geophys. Res. Space Phys. 114. doi:10.1029/2008JA013931
Matzka, J., Bronkalla, O., Tornow, K., Elger, K., and Stolle, C. (2021). Geomagnetic Kp index. doi:10.5880/Kp.0001
Meriwether, J. W., Makela, J. J., Huang, Y., Fisher, D. J., Buriti, R. A., Medeiros, A. F., et al. (2011). Climatology of the nighttime equatorial thermospheric winds and temperatures over Brazil near solar minimum. J. Geophys. Res. Space Phys. 116. doi:10.1029/2011JA016477
Nicolls, M. J., and Kelley, M. C. (2005). Strong evidence for gravity wave seeding of an ionospheric plasma instability. Geophys. Res. Lett. 32. doi:10.1029/2004GL020737
Nicolls, M. J., Vadas, S. L., Meriwether, J. W., Conde, M. G., and Hampton, D. (2012). The phases and amplitudes of gravity waves propagating and dissipating in the thermosphere: application to measurements over Alaska. J. Geophys. Res. Space Phys. 117. doi:10.1029/2012JA017542
Otsuka, Y., Suzuki, K., Nakagawa, S., Nishioka, M., Shiokawa, K., and Tsugawa, T. (2013). GPS observations of medium-scale traveling ionospheric disturbances over Europe. Ann. Geophys. 31, 163–172. doi:10.5194/angeo-31-163-2013
Perkins, F. (1973). Spread F and ionospheric currents. J. Geophys. Res. (1896-1977) 78, 218–226. doi:10.1029/JA078i001p00218
Picone, J. M., Hedin, A. E., Drob, D. P., and Aikin, A. C. (2002). NRLMSISE-00 empirical model of the atmosphere: statistical comparisons and scientific issues. J. Geophys. Res. Space Phys. 107, 15–16. doi:10.1029/2002JA009430
Pitteway, M. L. V., and Hines, C. O. (1963). The viscous damping of atmospheric gravity waves. Can. J. Phys. 41, 1935–1948. doi:10.1139/p63-194
Shiokawa, K., Otsuka, Y., Ihara, C., Ogawa, T., and Rich, F. J. (2003). Ground and satellite observations of nighttime medium-scale traveling ionospheric disturbance at midlatitude. J. Geophys. Res. Space Phys. 108. doi:10.1029/2002JA009639
Shiokawa, K., Otsuka, Y., and Ogawa, T. (2009). Propagation characteristics of nighttime mesospheric and thermospheric waves observed by optical mesosphere thermosphere imagers at middle and low latitudes. Earth, Planets Space 61, 479–491. doi:10.1186/bf03353165
Shiokawa, K., Otsuka, Y., Oyama, S., Nozawa, S., Satoh, M., Katoh, Y., et al. (2012). Development of low-cost sky-scanning Fabry-Perot interferometers for airglow and auroral studies. Earth, Planets Space 64, 1033–1046. doi:10.5047/eps.2012.05.004
Sipler, D., Biondi, M., and Zipf, M. (1995). Vertical winds in the midlatitude thermosphere from Fabry-Perot interferometer measurements. J. Atmos. Terr. Phys. 57, 621–629. doi:10.1016/0021-9169(94)00102-T
Trinh, Q. T., Ern, M., Doornbos, E., Preusse, P., and Riese, M. (2018). Satellite observations of middle atmosphere–thermosphere vertical coupling by gravity waves. Ann. Geophys. 36, 425–444. doi:10.5194/angeo-36-425-2018
Unick, C., Trondsen, T., Wyatt, D., and Meriwether, J. (2019). An apochromatic lens based Fabry-Pérot interferometer for accurate measurements of lower thermospheric neutral wind velocity and temperature. AGU Fall Meet. Abstr. 2019, SA33B–3155.
Vadas, S. L., and Nicolls, M. J. (2012). The phases and amplitudes of gravity waves propagating and dissipating in the thermosphere: theory. J. Geophys. Res. Space Phys. 117. doi:10.1029/2011JA017426
Zhang, S.-R., Erickson, P. J., Gasque, L. C., Aa, E., Rideout, W., Vierinen, J., et al. (2021). Electrified postsunrise ionospheric perturbations at Millstone Hill. Geophys. Res. Lett. 48, e2021GL095151. doi:10.1029/2021GL095151
Zhang, S.-R., Erickson, P. J., Goncharenko, L. P., Coster, A. J., Rideout, W., and Vierinen, J. (2017a). Ionospheric bow waves and perturbations induced by the 21 august 2017 solar eclipse. Geophys. Res. Lett. 44 (12), 067–12,073. doi:10.1002/2017GL076054
Zhang, S.-R., Erickson, P. J., Zhang, Y., Wang, W., Huang, C., Coster, A. J., et al. (2017b). Observations of ion-neutral coupling associated with strong electrodynamic disturbances during the 2015 St. Patrick’s Day storm. J. Geophys. Res. Space Phys. 122, 1314–1337. doi:10.1002/2016JA023307
Keywords: aeronomy, airglow, gravity wave, vertical winds, thermosphere
Citation: Schmidt AL, Meriwether JW, Cooper MB, Gerrard AJ, Goodwin LV, Zhang S-R and Ye Y (2025) Detection of wave activity in measurements of thermospheric vertical winds and temperatures at subauroral latitudes. Front. Astron. Space Sci. 12:1613164. doi: 10.3389/fspas.2025.1613164
Received: 16 April 2025; Accepted: 06 June 2025;
Published: 25 June 2025.
Edited by:
Larry Lyons, University of California, Los Angeles, United StatesReviewed by:
Rajan Itani, University of Alaska Fairbanks, United StatesGarima Malhotra, University of Colorado Boulder, United States
Copyright © 2025 Schmidt, Meriwether, Cooper, Gerrard, Goodwin, Zhang and Ye. This is an open-access article distributed under the terms of the Creative Commons Attribution License (CC BY). The use, distribution or reproduction in other forums is permitted, provided the original author(s) and the copyright owner(s) are credited and that the original publication in this journal is cited, in accordance with accepted academic practice. No use, distribution or reproduction is permitted which does not comply with these terms.
*Correspondence: Anneliese L. Schmidt, YWxzNTNAbmppdC5lZHU=