 Jacob Bortnik
 Lunjin Chen2*
 Nigel P. Meredith
- 1Department of Atmospheric and Oceanics Sciences, University of California at Los Angeles, Los Angeles, CA, United States
- 2Department of Physics, University of Texas at Dallas, Richardson, TX, United States
- 3Department of Earth, Planetary, and Space Sciences, University of California, Los Angeles, Los Angeles, CA, United States
- 4British Antarctic Survey, Natural Environment Research Council, Cambridge, United Kingdom
Plasmaspheric hiss is an incoherent, broadband, whistler-mode emission that is found primarily in the Earth’s dense plasmasphere and is believed to be largely responsible for the formation of the slot region between the inner and outer radiation belts. Beginning with the earliest observations of plasmaspheric hiss in the 1970s, it was noticed that duskside hiss emissions tended to disappear during the main phase of geomagnetic storms, and reappear again during the recovery phase. Here, we perform extensive ray tracing in a realistic, three-dimensional cold plasma density model that evolves during the course of a storm. On the basis of these simulations, we show that the formation of a broad, dayside plasmaspheric plume during the main phase of the storm prevents access of dayside chorus rays to the plasmaspheric dusk-midnight region, which explains the observed disappearance of plasmaspheric hiss waves in this region. In the recovery phase of the storm, however, the narrow, rotated plume and eroded plasmasphere create the ideal conditions for dayside chorus rays to propagate into the plasmasphere, attain a large azimuthal propagation component, and ‘hop’ over the narrow plume, thus enabling them to access the dusk-midnight region and explaining the observed reappearance of duskside hiss waves in the storm recovery phase.
1 Introduction
Plasmaspheric hiss (PH) is a structureless, broadband, naturally occurring whistler-mode emission that is generally confined to the Earth’s dense plasmasphere region (e.g., Russell et al., 1969; Thorne et al., 1973) as well as high density plasmaspheric drainage plumes (Summers et al., 2008). The PH wave power is predominantly confined to the frequency range from ∼200 Hz to a few kHz, and is concentrated below 1 kHz (Hayakawa and Sazhin, 1992), although recent studies have identified a low-frequency hiss component (Li et al., 2013; Ni et al., 2014, Malaspina et al., 2017), as well as a high frequency hiss component (He et al., 2019; He et al., 2020) both of which appear to be relatively transient and associated with high energy electron injections from the magnetotail (Zhu et al., 2019). The amplitude of PH has been shown to depend on the level of geomagnetic activity, and can range from ∼10 pT during quite times, up to >100 pT during active periods (e.g., Smith et al., 1974; Meredith et al., 2004; 2018; Li et al., 2015).
Following its discovery, it was quickly understood that PH was critical in controlling the two-zone equilibrium structure of the radiation belts (Lyons et al., 1972; Lyons and Thorne, 1973; Abel and Thorne, 1998a; 1998b; Meredith et al., 2007; Meredith et al., 009). Later studies reveal its further role in the formation of the slot region (Ma et al., 2016), the decay of relativistic electrons following strong acceleration events (Thorne et al., 2013), and potentially rapid loss of outer radiation belt energetic electrons due to hiss in plumes (Summers et al., 2008). Since the radiation belts are a known hazard to orbiting satellites (Choi et al., 2011; Baker and Lanzerotti, 2016), PH is thus a key component of the space weather system.
Despite its recognized importance, the origin of PH hiss remains a hotly debated topic. Early suggestions involved the growth of PH waves from the background plasma emissivity due to unstable energetic electron populations (Thorne et al., 1973) coupled with a ‘recycling’ process within the plasmasphere (Thorne et al., 1979), but subsequent studies that attempted to quantify this growth soon concluded that the growth rates within the plasmasphere were far too low to provide the needed amplification (Huang and Goertz, 1983; Huang et al., 1983), leading Church and Thorne (1983) to conclude that the hot plasma could not amplify the incoherent background emissivity sufficiently, but some kind of weak ‘embryonic source’ of waves was needed for further amplification, which would require significantly less overall amplification to achieve observable levels.
Subsequent work by Bortnik et al. (2008) demonstrated for the first time, through the use of extensive ray tracing simulations in a realistic plasma density model (that includes a plasmasphere) and statistically constructed suprathermal electron density model (to compute the Landau damping rates experienced by waves along their propagation paths) that whistler-mode chorus waves (e.g., Burton and Holzer, 1974; Li et al., 2009) naturally excited in the low density trough region outside the plasmapause, could propagate to high latitudes, enter the plasmasphere, and naturally evolve into the incoherent plasmaspheric hiss emission. This model naturally explained the major characteristics of PH, including the geomagnetic activity dependence of PH, its day-night asymmetry, frequency structure, incoherent nature, L-shell dependence as well as ancillary features such as exo-hiss. Subsequently, a fortuitous observation by the THEMIS spacecraft (Angelopoulos, 2008) was able to capture an event of simultaneous chorus and PH waves at separate locations, showing that the two waves were closely correlated, frequency by frequency, with a time lag that could only be explained by whistler-mode propagation (Bortnik et al., 2009). Subsequent works elucidated the three-dimensional (3D) propagation of chorus and its evolution into PH across a range of local times (Chen et al., 2009), and the effects cold plasma and chorus wave characteristics in controlling PH distribution (Bortnik et al., 2011a; Bortnik et al., 2011b; Chen et al., 2012a; Chen et al., 2012b), as well as the importance of density guiding and modest amplification to bring the resultant PH emission to the observed amplitude levels (Chen et al., 2012c; Chen et al., 2012d).
Observational studies examining at the distribution of the chorus and PH emissions (Meredith et al., 2013; 2021; Li et al., 2015; Malaspina et al., 2016) were able to demonstrate that while chorus and hiss wave distributions near the geomagnetic equator tended to be separate in L-shell and were slightly offset from each other in MLT, as the geomagnetic latitude of the waves increased, chorus and PH rotated towards each other in MLT and merged in L-shell, consistent with the chorus to hiss mechanism. Additionally, the wave normal angle distribution of PH as a function of latitude was shown to be remarkably consistent with model predictions (Agapitov et al., 2013) and subsequently, a comprehensive study that examined 11 years of multipoint observations of coincident chorus-hiss events using 5 THEMIS spacecraft (resulting in ∼106 2-min intervals), has shown the high correlation of chorus and PH, with hiss observed slightly behind chorus, indicating that chorus was the causative wave (Agapitov et al., 2018).
A potential issue was identified in the study of Hartley et al. (2019) which showed that chorus waves near the source region apparently did not contain wave power at sufficiently high wave normal angles, which would then propagate and evolve into PH, casting doubt on the chorus-hiss mechanism. However, it should be noted that these authors examined 6-s, survey mode time intervals, which average out all the wave normal variability within the individual chorus elements and typically produce wave normal angles close to ∼0°. However, examining the detailed, high time-resolution wave normal variability within each chorus element (∼0.1 s timescale) revealed (Santolik et al., 2014; Crabtree et al., 2017) that the wave normal angle rotates rapidly and occupies the range ∼10°–60°, which is precisely the wave normal angle range required to produce PH.
An interesting feature was noted in early observations of PH made on the Ogo 6 spacecraft (Smith et al., 1974, Figure 2), in that PH wave power tended to disappear during the main phase of geomagnetic storms in the dusk-midnight sector, only to reappear again, more intensely in the recovery phase of the storm (e.g., Ibid, Figure 2). A similar association with geomagnetic activity can be seen in modern observations. Figure 1 shows an example of PH observations made with the EMFISIS instrument (Kletzing et al., 2013) on board Van Allen Probe B (Mauk et al., 2012) on 12 October 2018. The green horizontal bar above panel a indicates periods when the spacecraft was located in the region of interest, i.e., in the dusk-midnight sector, corresponding to 18–24 MLT, and within the plasmasphere (as indicated by the UHR line in panel b). Panel a shows the AL index in this period, indicating the onset of enhanced geomagnetic activity at ∼0800 UT, and panels c-f show the observed whistler-mode waves at this time. Panel g highlights PH observed in this period, and indicates that PH was observed at nominal levels prior to the onset of geomagnetic activity at ∼0800UT, but disappeared almost entirely from the plasmasphere as soon as geomagnetic activity increased (highlighted by the pink vertical stripes running across panels a-d). When geomagnetic activity started to diminish after ∼1600UT, PH waves again began to reappear in the dusk-midnight region within the plasmasphere (purple vertical bar in panels a-d). Another example observed by the Combined Release and Radiation Effects Satellite (e.g., Anderson et al., 1992; Meredith et al., 2004) is provided in the Supplementary Information, showing a similar disappearance of PH in the dusk-midnight sector during the main phase of an intense storm the took place during 9–11 July 1991 (compared to pre-storm levels) and a reappearance in the recovery phase to pre-storm levels.
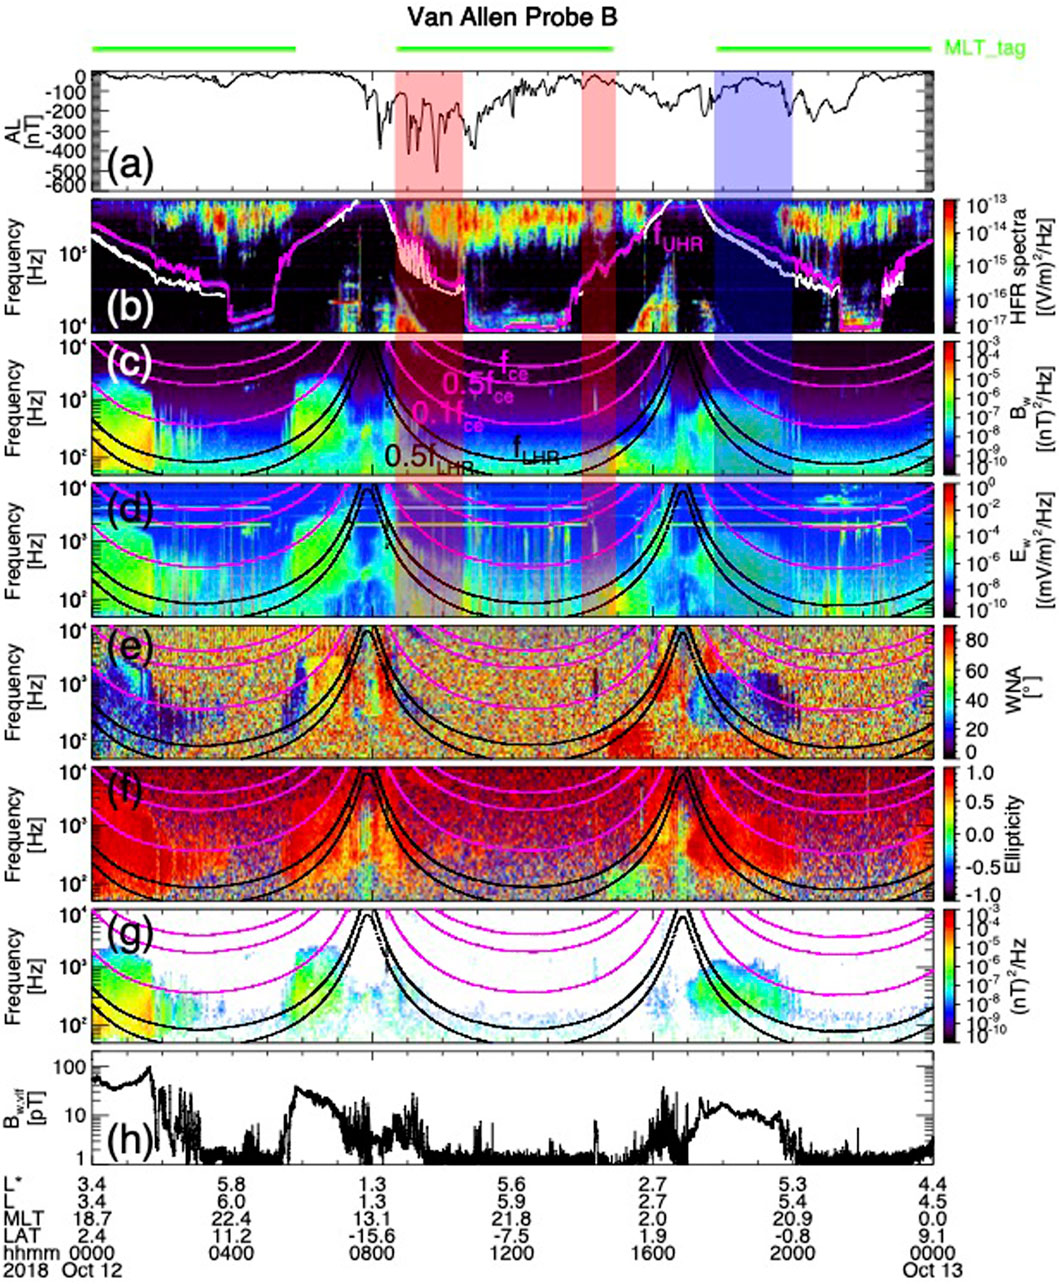
Figure 1. Example of the disappearance of plasmaspheric hiss in the dusk-midnight sector during the onset of geomagnetic activity and subsequent reappearance, as observed on RBSP-B on 12 October 2018. (a) AL index during the event period, with green horizontal bar across the top, indicating periods when RBSP-B was located in the plasmasphere in the 18–24 MLT sector; (b) HFR spectrum; (c) wave magnetic and (d) electric field intensities; (e) wavenormal angle; (f) wave ellipticity; (g) VLF tag indicating wave power in the 0.2–2 kHz frequency band, and (h) integrated wave power in the VLF band. Red shaded vertical regions in panels (a–d) highlight the disappearance of hiss waves in the dusk-midnight sector inside the plasmasphere and the blue shaded vertical region highlights the corresponding re-appearance of hiss waves at the late (recovery) stage of the preceding substorm.
A similar trend is evident in statistical data, as shown in Figure 2. Here, a multi-satellite data set is used to construct a PH database which includes approximately 3 years of data from the Dynamics Explorer 1 (DE1) satellite, 1 year of data from the Double Star TC1 satellite, 10 years of data from Cluster 1, 17 months of data from each probe of the Time History of Events and Macroscale Interactions during Substorms (THEMIS)-A, THEMIS-D, and THEMIS-E, and 3 years of data from the Van Allen probes, Radiation Belt Storm Probes (RBSP)-A and RBSP-B (as described in Meredith et al. (2018)). PH wave intensity in the frequency range f = 200–500 Hz is plotted in Figure 2 as a function of MLT, at two L-shell regions (1.5 < L < 2.5 and 2.5 < L < 3.5 in the lower and upper panels, respectively), parameterized by levels of geomagnetic activity, indicated by the line-color. The results show that in the dayside region, PH wave power increases with increasing geomagnetic activity, but in the dusk-midnight sector (highlighted with the grey vertical bar), the opposite trend is observed: increasing levels of geomagnetic activity result in lower PH wave amplitudes, consistent with the case shown in Figure 1 above, and the early observations of Smith et al. (1974).
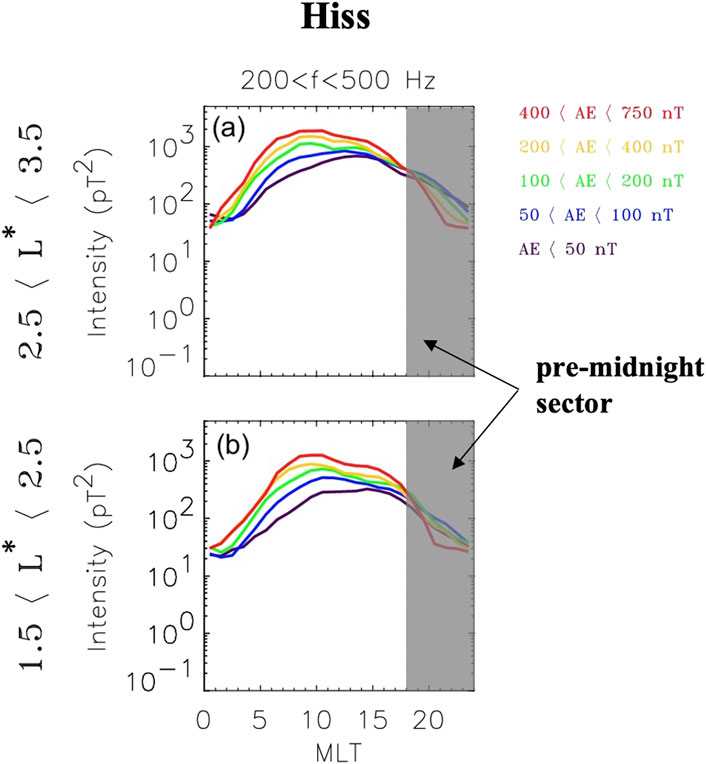
Figure 2. Average wave intensity of plasmaspheric hiss in the frequency range 200 < f < 500 Hz in the near-equatorial region, 0∘ < |λm| < 15∘, as a function of MLT for five levels of geomagnetic activity parameterized by the AE index in the region (a) 2.5 < L∗ < 3.5 and (b) 1.5 < L∗ < 2.5.
Here, we investigate this disappearance of PH in the dusk-midnight sector, during periods of enhanced geomagnetic activity, using ray tracing and a realistic plasma density model that evolves in time during the course of the geomagnetic storm. Section 2 describes the plasma density, magnetic field, and suprathermal flux density that we use in our study, while Section 3 presents the results of our extensive ray tracing and damping simulations. Section 4 gives a discussion and summary of our proposed mechanism.
2 Materials and methods
In order to study the three-dimensional (3D) propagation of chorus waves from their source region outside the plasmasphere, through to their evolution into plasmaspheric hiss inside the plasmasphere, we perform extensive ray tracing simulations using the HOTRAY code (Horne, 1989). Following the approach outlined in Chen et al. (2009), an axisymmetric dipole magnetic field model is used to represent the geomagnetic field, and the equatorial cold plasma distribution is obtained from a simulation performed by Jordanova et al. (2006) where an arbitrary electric field drives the plasmaspheric density model described by Rasmussen et al. (1993). In this study, as in Chen et al. (2009), the Rice Convection Model (RCM) electric field is used to drive the plasmasphere model, for the parameters representing the 21 April 2001 geomagnetic storm. Since it was already well-studied and carefully modeled, we re-examine this typical, moderate storm event (minimum Dst= -103 nT) in the present study but here we focus on the effects of the time-varying cold plasma distribution and plasmaspheric drainage plume on the propagation and evolution of chorus waves into plasmaspheric hiss. In order to complete the 3D specification of the cold plasma density, the equatorial values are extended along magnetic field lines using the latitudinal distribution as specified by Denton et al. (2002).
The equatorial cold plasma density distribution is shown in Figure 3, during the course of a geomagnetic storm whose Dst index is shown in Figure 3A. Four snapshots are shown of the density, including a “nominal” pre-storm density distribution taken at 10 h (Figure 3B) after the reference time T0 (00 UT on 21 April 2001), an “initial phase” distribution taken at the onset of strong convection (Figure 3C) when the plasmasphere starts to erode, a “maximum” phase distribution taken at the peak of plasmaspheric erosion (Figure 3D), and a “recovery phase” distribution, taken during the storm recovery phase (Figure 3E) when the convection electric field diminished, and the eroded plasmasphere with a narrow plume beings to corotate.
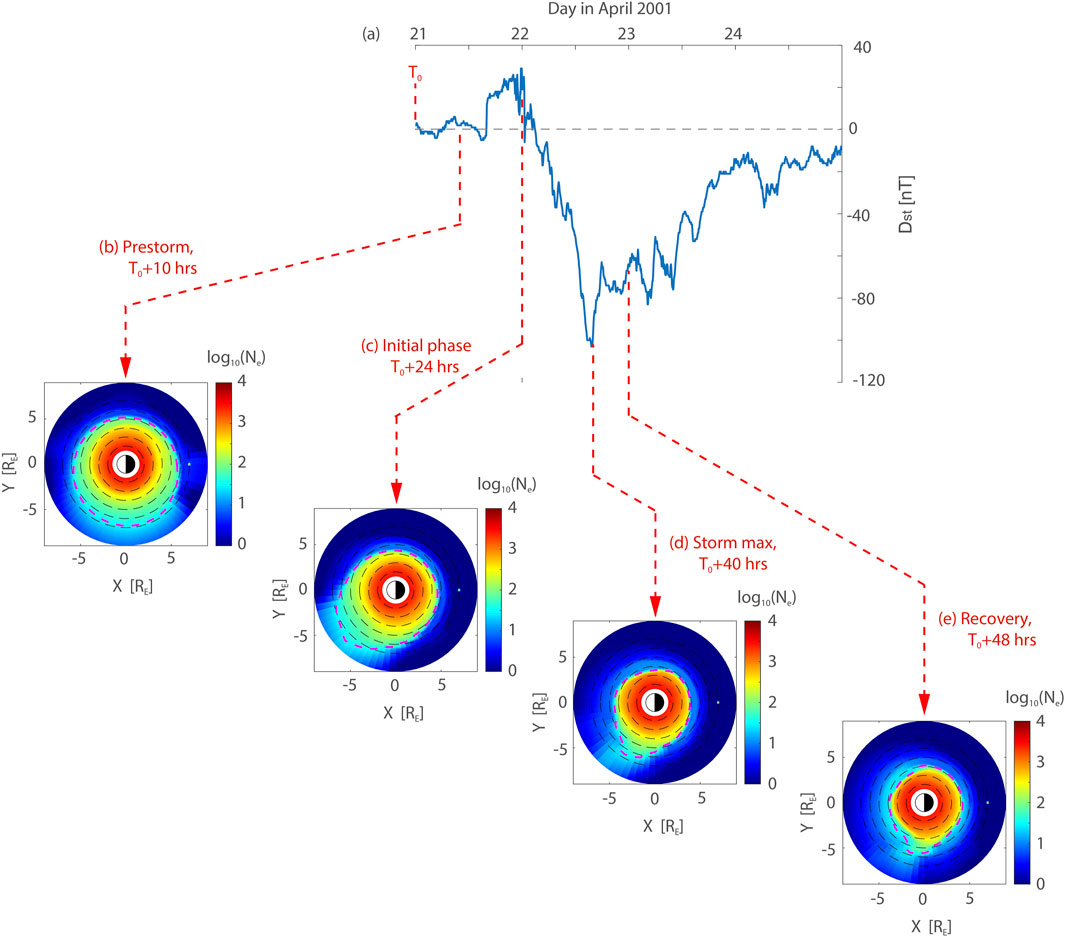
Figure 3. Plasmaspheric density evolution during the April 21–25, 2001 geomagnetic storm. (a) Dst index during the event, with start time T0 = 0 UT indicated at 2001/04/21; (b) The state of the pre-storm plasmasphere at t = T0+10 h, (c) Initial phase of the storm at t = T0+24 h during outward convection of cold plasma on the day side, (d) storm “maximum” at t = T0+40 h showing maximum erosion of the plasmasphere, with Dst (min) = -103 nT, and (e) storm recovery phase when the fully eroded plasmasphere and narrow plume begins to corotate at t = T0+48 h. The purple dashed contour represents the plasmapause at Ne = 30 el/cc.
These four snapshots form the basis of our analysis, and we now perform ray tracing simulations to study how chorus waves injected at a representative L-shell (L = 7) and a range of representative magnetic local times (MLTs) would propagate and access the plasmasphere.
At each injection location, rays are injected with a range of initial wave normal angles ψ0 ranging from 0° to 90° and azimuthal angles η0 ranging from 0° to 360°, where the angles η0 = 0°, 90°, 180°, and 270°, correspond to the radially outward, East, inward, and West directions, respectively.
For each ray that is launched with initial parameters (L0, MLT0, ψ0, η0) and frequency f0 = 500 Hz, the Landau damping rate is calculated using the suprathermal fluxes reported in Li et al. (2010) that are fitted with an isotropic power law distribution Avn at every location (where A and n are both fitting parameters) similar to Bortnik et al. (2007) and the damping rate is calculated following the approach of Kennel (1966). As shown by Church & Thorne (1983), cyclotron damping can also contribute to the total damping in general, but for relatively low normalized wave frequencies, as is the case presently (f ∼ 0.2 fce) the damping is dominated by the Landau resonant electrons, with cyclotron damping playing a negligible effect, and as such is omitted in the present study for simplicity. The variation of the wave power density due to geometric field line convergence is also taken into account, but this represents a small contribution compared to Landau damping. Each ray is initiated with a wave power of unity in dimensionless units, and followed until its power is decreased to 10–4 of its initial value, at which point the ray is terminated and its total propagation time until that point (i.e., the ray “lifetime”) is recorded. As in previous studies (Bortnik et al., 2011a; Bortnik et al., 2011b; Chen et al., 2012a; Chen et al., 2012b; Chen et al., 2012c) we do not model any aspects of the chorus wave excitation and simply assume that it appears with full power at its initial location at the equator. In reality, there will likely be a region near the equator where the chorus waves grow due to rapid wave-particle energy exchange (e.g., Omura et al., 2008; Omura et al., 2009; Omura and Nunn, 2011; Katoh and Omura, 2013), but for the purposes of the present study, only the propagation and damping are relevant for chorus evolution into hiss.
3 Results
Figures 4–7 show the results of the ray tracing simulation described above, which models the access of chorus waves that are initiated at different locations outside the plasmasphere, and evolve into plasmspheric hiss within the plasmasphere, at different snapshots during the geomagnetic storm, and demonstrate how the cold plasma density distribution is able to guide the rays, and specifically control access of the chorus rays to the dusk-midnight sector.
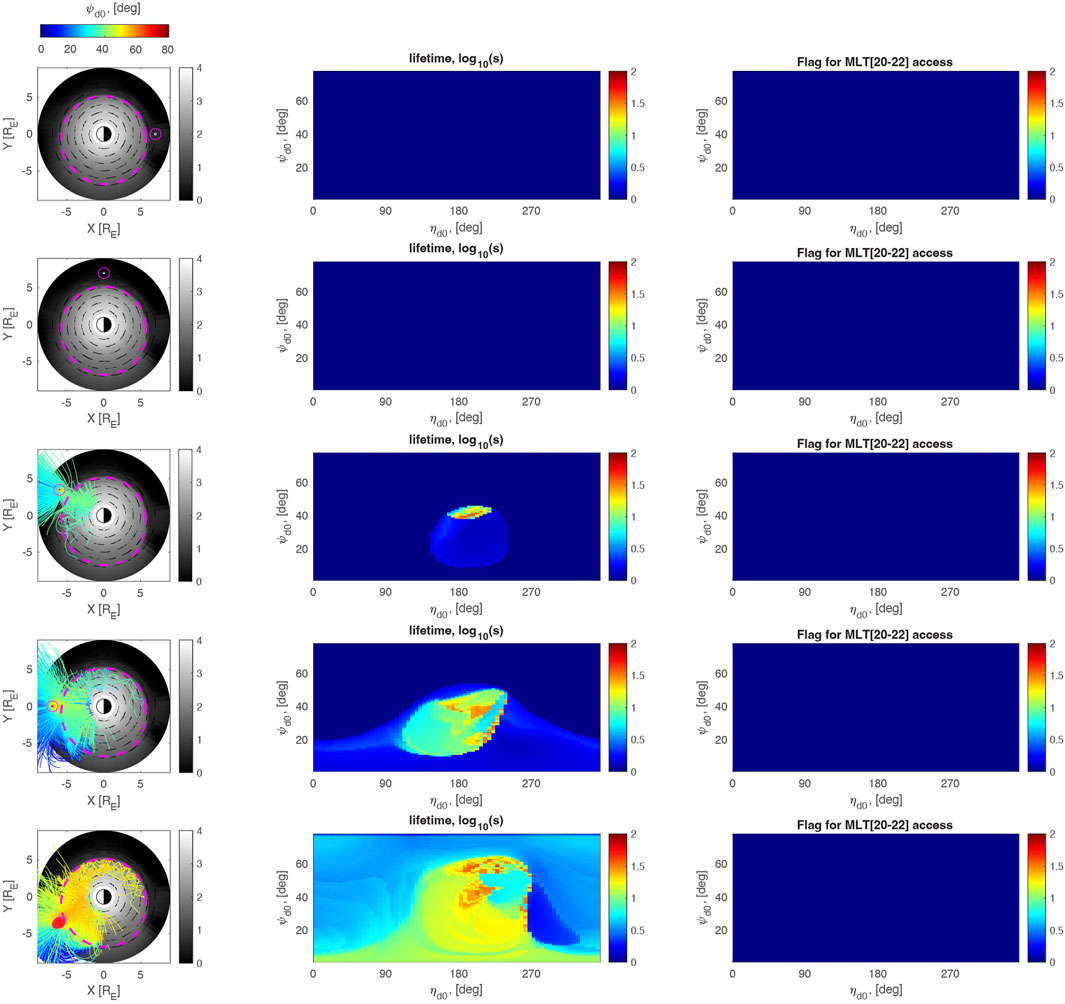
Figure 4. Propagation and access of chorus ray paths into the plasmasphere during the pre-storm phase, at t = t0+10 h. Left column: distribution of plasma density (shown in the background color) and propagation of chorus ray paths originating from L = 7, at 0, 6, 9,12, and 15 MLT (respectively shown in the top to bottom rows, color-coded by their initial wave normal angle, as shown by the colorbar at the top of the left column). Middle column: lifetimes of each ray (in log10 (seconds), originating from the corresponding MLT in the left column, having an initial WNA with a polar angle with respect to the background B-field of
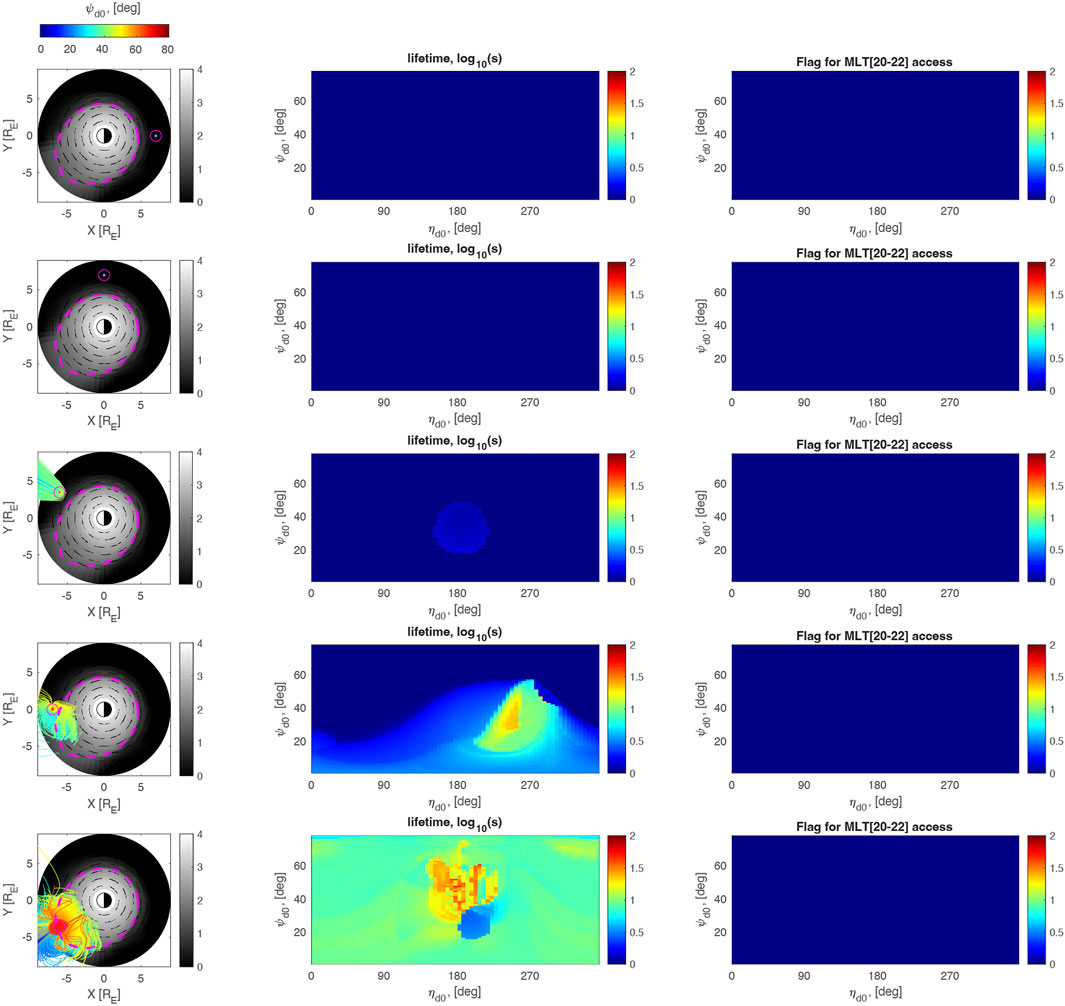
Figure 5. same as in Figure 4, but showing the propagation and access of chorus ray paths into the plasmasphere during the initial phase, at t = t0+24 h.
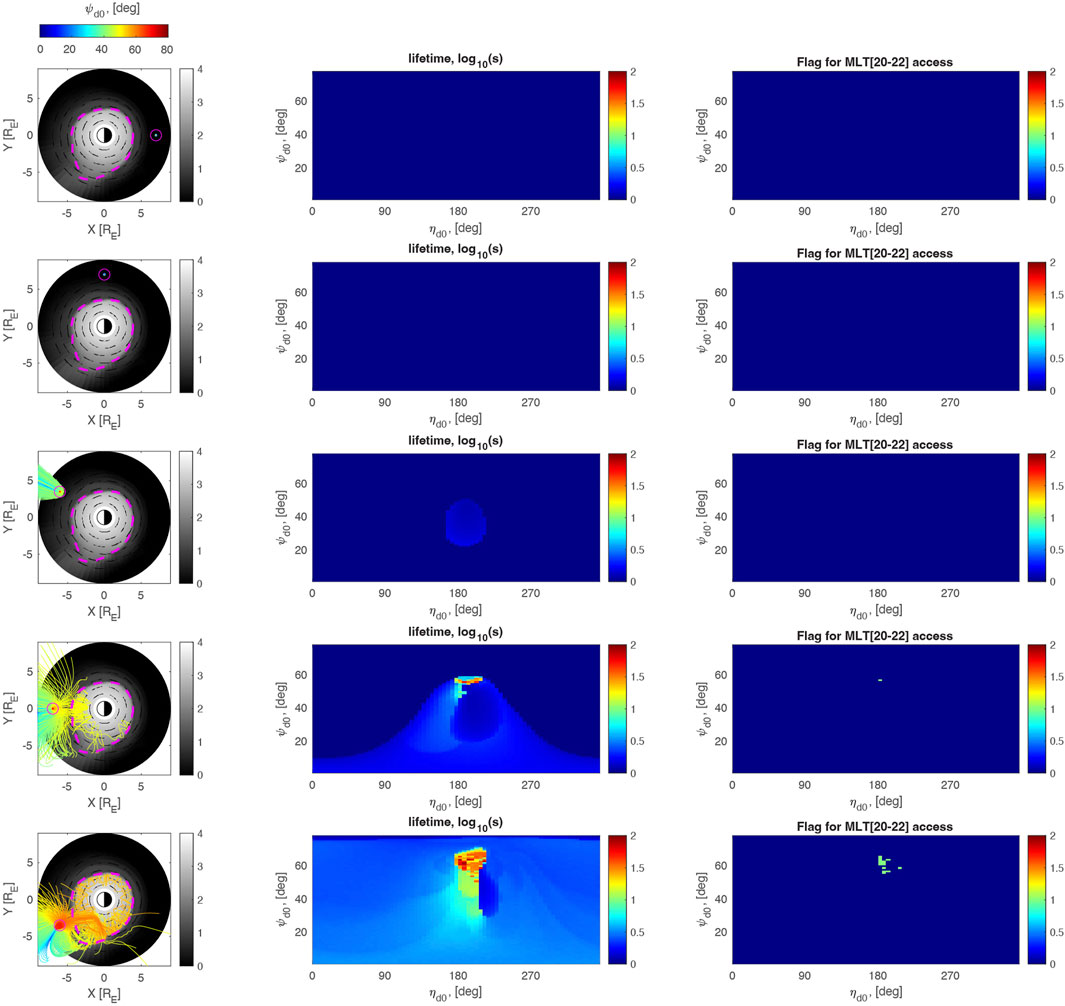
Figure 6. same as in Figure 4, but showing the propagation and access of chorus ray paths into the plasmasphere during the storm maximum phase, at t = t0+40 h.
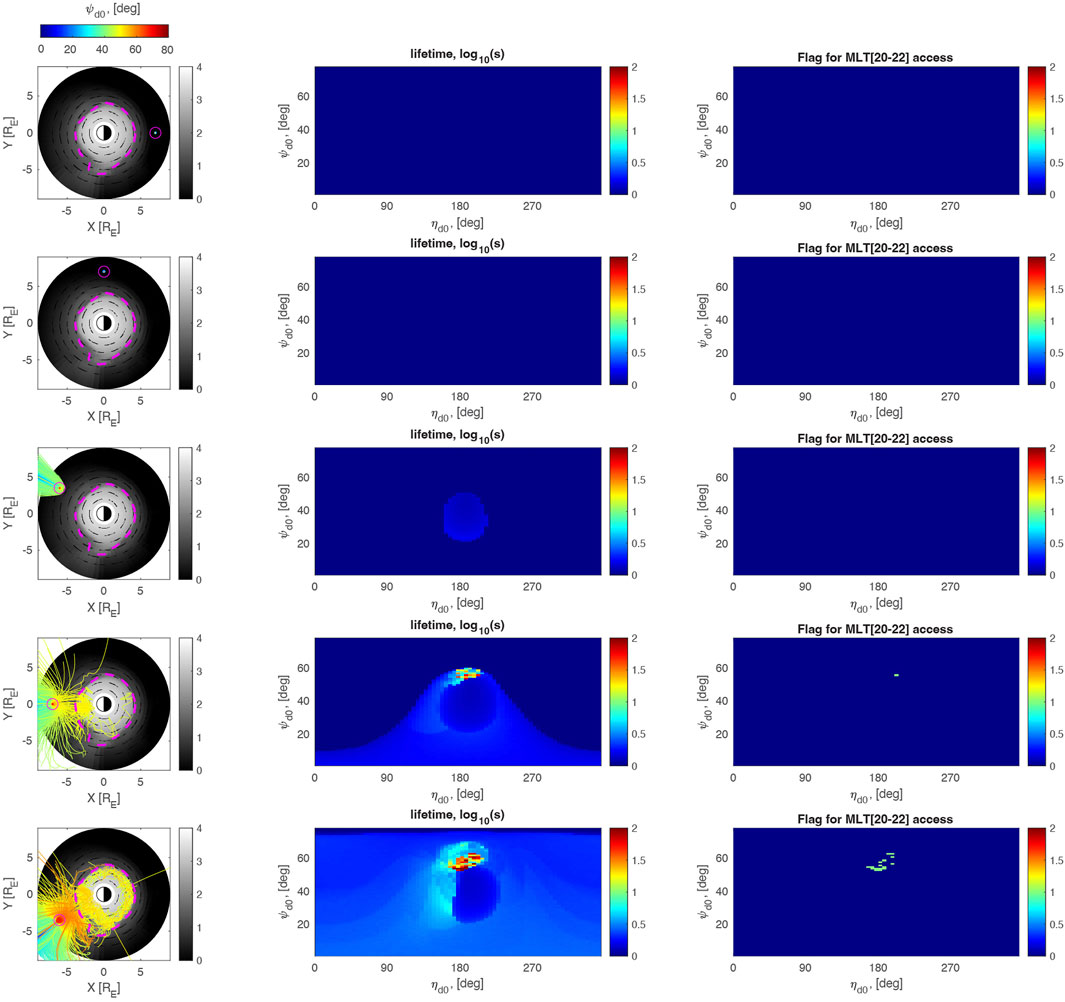
Figure 7. same as in Figure 5, but showing the propagation and access of chorus ray paths into the plasmasphere during the recovery phase, at t = t0+48 h.
3.1 Pre-storm phase
Figure 4 (left column) shows the distribution of chorus rays that propagate in the pre-storm plasmasphere, corresponding to Figure 3B at T0+10 h. The injection L-shell is always taken to be L = 7, and the rows correspond to different injection local times, including MLT = 0, 6, 9, 12, and 15 corresponding to the rows from top to bottom. At each injection location, the lifetimes of the chorus rays are displayed in the middle column in log10 (seconds) as a function of the initial wavenormal and azimuthal angles (described in the figure caption), ψ0 and η0. The right column is a flag indicating whether the ray has reached the region of interest in the dusk-midnight sector (MLT = 20–22).
Consistent with previous work (Chen et al., 2009), the prestorm phase simulation shows that chorus rays initiated in the midnight to dawn sectors (top two rows) propagate roughly along their initial L-shells and are damped out relatively quickly, such that they are not able to propagate all the way to the plasmasphere (e.g., Bortnik et al., 2007). On the dayside at 9 and 12 MLT (rows 3 and 4), the suprathermal fluxes have diminished substantially, such that Landau damping is sufficiently reduced to allow the chorus to propagate all the way to the plasmasphere and evolve into plasmaspheric hiss. The corresponding lifetimes of the rays in the region ψ0 ∼20°–40° and η0∼180° show a dramatic increase from <1 s to 10 s of seconds, indicating that they have entered the plasmasphere where Landau damping is severely reduced and lifetimes are enhanced. The bottom row corresponding to injection at 15 MLT, shows the most dramatic example of the azimuthal cold plasma gradients guiding the rays into the plasmasphere, with a much enlarged region in (ψ0, η0) space having long >10 s lifetimes. Nevertheless, there is limited access to the dusk-midnight sector, as shown in the right column of Figure 4, indicating that azimuthal propagation of the chorus rays injected from 15 MLT essentially stops at around 18 MLT and does not contribute to dusk-midnight hiss waves.
3.2 Initial phase
Figure 5 shows the distribution and lifetime of chorus rays that propagate in the initial storm phase, in the same format as Figure 4, corresponding to Figure 3C at T0+24 h.
While the top 3 rows (MLT = 0, 6, and 9) of Figures 4, 5 are very similar, showing that chorus rays are unable to enter the plasmasphere, the bottom two rows (MLT = 12 and 15) show that while chorus can propagate to high latitudes and enter the plasmasphere, the initial phase plasmasphere now limits the azimuthal extent to which the rays can extend once they enter the plasmasphere. As in the prestorm phase, chorus rays originating on the dayside are not able to cross beyond ∼18MLT and do not contribute to dusk-midnight hiss.
3.3 Maximum phase
Figure 6 shows the distribution and lifetime of chorus rays that propagate in the storm “maximum” phase, i.e., at the point of Dst minimum, in the same format as Figure 4, corresponding to Figure 3D at T0+40 h.
In this phase, the plasmasphere has been maximally eroded, and the plasmaspheric drainage plume (Goldstein et al., 2004) has narrowed and rotated from midday to beyond ∼15 MLT. As in the previous storm phases (Figures 4, 5), the top 3 rows of Figure 6 show that chorus rays originating from MLT = 0,6, and 9 are not able to enter into the plasmasphere and contribute to the plasmaspheric hiss wave power.
The bottom two rows, however, not only show chorus rays entering into the plasmasphere, but the combination of an eroded plasmasphere and narrow, rotated plume structure allow chorus rays to travel significantly in azimuth, such that rays injected at 12 MLT begin to show up in the dusk-midnight region (MLT = 20–22) weakly, and when chorus is injected at 15 MLT (bottom row), a significant number of rays is able to ‘hop’ over the plasmaspheric plume and show up in the dusk-midnight region, as seen in the third column, bottom row of Figure 6.
This simulation suggests that in the “maximum” phase of a geomagnetic storm (around Dst minimum), the combination of the plasmasphere becoming highly eroded and the plasmaspheric drainage plume narrowing and rotating to high MLTs produces favourable conditions for dayside chorus waves to enter into the plasmasphere. Further, these rays can attain a significant azimuthal propagation velocity due to the azimuthal density gradients in the postnoon sector, and are able to ‘hop’ over the entire plume (without being trapped) such that they can be observed on the dusk-midnight region and contribute to the observed plasmaspheric hiss wave power there.
3.4 Recovery phase
Figure 7 shows the distribution and lifetime of chorus rays that propagate in the early recovery phase of the storm, in the same format as Figure 4, corresponding to Figure 3E at T0+48 h.
In this phase, the plasmasphere remains highly eroded, the convection electric field has decreased significantly from the storm main phase, and the plume is narrow and has begun to corotate such that it is located primarily around 18 MLT.
Similar to Figure 6, the cold plasma distribution in the storm recovery phase creates conditions that are able to ‘steer’ the propagation of the chorus rays originating on the dayside at 12 and 15 MLT (bottom two rows in Figure 7) towards larger MLTs due to strong azimuthal gradients, and at the same time have a plume that is sufficiently narrow that the rays can hop over it, and show up in the dusk-midnight MLT sector. Chorus injection at larger MLTs is able to access the dusk-midnight region more readily, with 12 MLT injection showing up only weakly, and 15 MLT injection showing up more significantly in the 20–22 MLT region in the plasmasphere, contributing to the plasmaspheric hiss observed in that region. A 3D hiss ray propagation path example is shown in Figure 1 of Chen et al. (2009), and although the controlling effects of plume width on propagation paths have not been studied in detail yet, it appears from our simulation that rays are able to ‘hop’ over plumes that are ∼1-2 MLT wide, but are trapped in plumes that are >3 MLT in width and cannot propagate in azimuth to larger MLT regions.
4 Conclusions and discussion
The ray tracing simulation results presented in Section 3 above suggest that the evolution of the cold plasma density in the course of a geomagnetic storm can have a dramatic effect on the propagation and evolution of dayside chorus waves into plasmaspheric hiss, and particularly on the ability of dayside chorus waves to evolve into the population of dusk-midnight plasmaspheric hiss waves.
Specifically, these simulations resolve the decades-long question (Smith et al., 1974) about why dusk-midnight plasmaspheric hiss waves seem to disappear in the main phase of a geomagnetic storm, and reappear (more intensely) in the recovery phase, in the same region.
Figure 8 graphically summarized the process we envision:
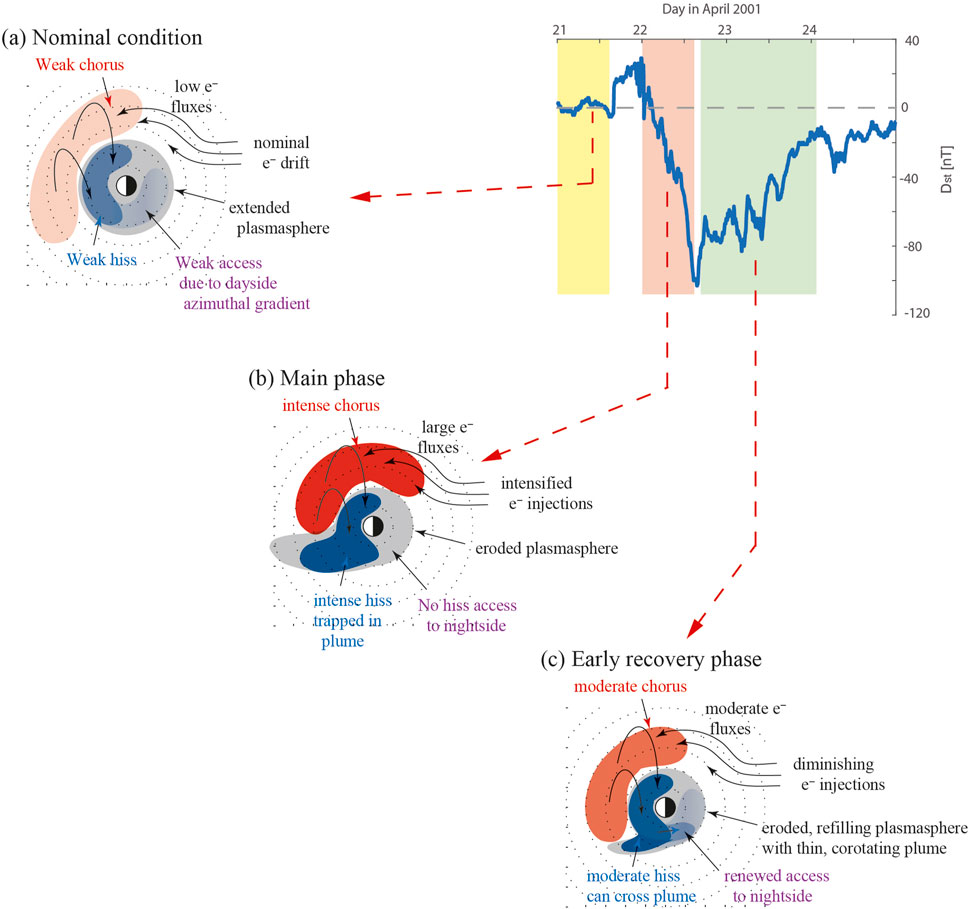
Figure 8. Schematic illustration of the chorus access to the dusk-midnight region according to storm phase. (a) Nominal access under quiet/pre-storm conditions; (b) main phase storm conditions, showing the development of intense dayside chorus and hiss, but restricted access to the dusk-midnight region due to broad plume; (c) recovery phase of storm with a narrowing plasmaspheric plume, and renewed access of chorus to the dusk-midnight hiss region.
In the pre-storm phase, the “nominal” conditions shown in Figure 8A are such that plasmasheet electrons with typical energies of ∼1–10 keV drift from the magnetotail into the inner plasmsphere, where they become energized along their drift orbits (e.g., Li et al., 2010 Figure 1). They then drift through the dawn to the dayside, become more anisotropic and hence unstable to whistler wave growth, and excite chorus waves of weak to moderate intensities which propagate into the plasmasphere and form weak plasmaspheric hiss (Meredith et al., 2013, Meredith et al., 2021), consistent with the bottom two rows of Figure 4. At this stage, the plasmasphere is extended and does not have strong azimuthal gradients and as a result there is weak azimuthal steering of the waves and poor access of the dayside chorus waves into the dusk-midnight region.
When geomagnetic activity becomes intensified, as illustrated in Figure 8B for the main phase of the storm, the convection electric field increases and erodes the nightside plasmasphere, whilst simultaneously extending the dayside plasmasphere towards the dayside magnetopause in a broad plume. This geomagnetic activity also brings in large fluxes of energetic electrons from the magnetotail in the form of injections (REF), which drift from the night sector through the dawn to the dayside and produce intense chorus waves on the dayside. These chorus waves are able to propagate to high latitudes and access the plasmasphere on the dayside, but the broad plume tends to trap these waves and prevent them from traveling very far in azimuth, effectively stopping them by ∼18 MLT, consistent with the simulations results shown in Figure 5. It is this broad-plume trapping effect which we believe to be responsible for the observed disappearance of plasmaspheric hiss in the dusk-midnight region, during enhanced levels of geomagnetic activity.
In the early recovery phase of geomagnetic storms, illustrated in Figure 8C, the convection electric field decreases, the plasmasphere has not yet refilled and is still severely eroded, and the plasmaspheric drainage plume has become thinned and is beginning to corotate under the influence of the Earth’s corotation electric field. While the rate of electron injections into the inner magnetosphere begins to diminish relative to the main phase, there is still a high flux of plasmasheet electrons remaining from the main phase that is available on the dayside which excite chorus waves. These chorus waves can propagate and evolve into plasmaspheric hiss on the dayside, but in addition, the unique combination of large azimuthal cold plasma density gradients on the dayside, together with an eroded plasmasphere and narrowed, rotated plume, allow the entering chorus waves to be steered and gain an azimuthal propagation component, then ‘hop’ over the narrow plume such that they show up (again) in the dusk-midnight sector. This recovery phase behaviour is also consistent with observations of plasmaspheric hiss on the duskside which tend to disappear during the storm main phase, but reappear (more intensely) in the recovery phase.
Data availability statement
The datasets presented in this study can be found in online repositories. The names of the repository/repositories and accession number(s) can be found below: https://emfisis.physics.uiowa.edu/data/index.
Author contributions
JB: Investigation, Writing – original draft, Formal Analysis, Project administration, Conceptualization, Writing – review and editing, Methodology, Supervision. LC: Visualization, Software, Methodology, Writing – review and editing, Investigation. X-JZ: Writing – review and editing, Investigation, Visualization, Methodology. NM: Visualization, Methodology, Writing – review and editing, Investigation, Software.
Funding
The author(s) declare that financial support was received for the research and/or publication of this article. JB gratefully acknowledges support from NASA award 80NSSC20K1270, 80NSSC22K1637, and NSF award 2225613. LC acknowledges NASA grant 80NSSC22K1637, 80NSSC20K1324, and AFOSR grant FA9550-23-1-0568. NM would like to acknowledge funding from the Natural Environment Research Council grants NE/V00249X/1 (Sat-Risk), NE/X000389/1 and NE/R016038/1.
Acknowledgments
The authors acknowledge the Van Allen Probes team which allowed for the creation of the data presented in Figure 1, the THEMIS team which created the data required for the ray tracing simulations (damping rates), and Vania Jordanova for running the RAM model originally, which created the evolving plasmasphere model.
Conflict of interest
The authors declare that the research was conducted in the absence of any commercial or financial relationships that could be construed as a potential conflict of interest.
The handling editor EK declared a past co-authorship with the author LC.
Generative AI statement
The author(s) declare that no Generative AI was used in the creation of this manuscript.
Publisher’s note
All claims expressed in this article are solely those of the authors and do not necessarily represent those of their affiliated organizations, or those of the publisher, the editors and the reviewers. Any product that may be evaluated in this article, or claim that may be made by its manufacturer, is not guaranteed or endorsed by the publisher.
Supplementary material
The Supplementary Material for this article can be found online at: https://www.frontiersin.org/articles/10.3389/fspas.2025.1619877/full#supplementary-material
References
Abel, B., and Thorne, R. M. (1998a). Electron scattering loss in earth's inner magnetosphere 1. Dominant physical processes. J. Geophys. Res. 103 (A2), 2385–2396. doi:10.1029/97JA02919
Abel, B., and Thorne, R. M. (1998b). Electron scattering loss in earth's inner magnetosphere 2. Sensitivity to model parameters. J. Geophys. Res. 103 (A2), 2397–2407. doi:10.1029/97JA02920
Agapitov, O., Artemyev, A., Krasnoselskikh, V., Khotyaintsev, Y. V., Mourenas, D., Breuillard, H., et al. (2013). Statistics of whistler-mode waves in the outer radiation belt: cluster STAFF-SA measurements. J. Geophys. Res. Space Phys. 118, 3407–3420. doi:10.1002/jgra.50312
Agapitov, O., Mourenas, D., Artemyev, A., Mozer, F. S., Bonnell, J. W., Angelopoulos, V., et al. (2018). Spatial extent and temporal correlation of chorus and hiss: statistical results from multipoint THEMIS observations. J. Geophys. Res. Space Phys. 123, 8317–8330. doi:10.1029/2018JA025725
Anderson, R. R., Gurnett, D. A., and Odem, D. L. (1992). CRRES plasma wave experiment. J. Spacecr. Rockets 29, 570–573. doi:10.2514/3.25501
Angelopoulos, V. (2008). The THEMIS mission. Space Sci. Rev. 141, 5–34. doi:10.1007/s11214-008-9336-1
Baker, D. N., and Lanzerotti, L. J. (2016). Resource letter SW1: space weather. Am. J. Phys. 84 (3), 166–180. doi:10.1119/1.4938403
Bortnik, J., Chen, L., Li, W., Thorne, R. M., Meredith, N. P., and Horne, R. B. (2011b). Modeling the wave power distribution and characteristics of plasmaspheric hiss. J. Geophys. Res. 116, A12209. doi:10.1029/2011JA016862
Bortnik, J., Chen, L., Li, W., Thorne, R. M., and Horne, R. B. (2011a). Modeling the evolution of chorus waves into plasmaspheric hiss. J. Geophys. Res. 116, A08221. doi:10.1029/2011JA016499
Bortnik, J., Li, W., Thorne, R. M., Angelopoulos, V., Cully, C., Bonnell, J., et al. (2009). An observation linking the origin of plasmaspheric hiss to discrete chorus emissions. Science 324, 775–778. doi:10.1126/science.1171273
Bortnik, J., Thorne, R. M., and Meredith, N. P. (2007). Modeling the propagation characteristics of chorus using CRRES suprathermal electron fluxes. J. Geophys. Res. 112, A08204. doi:10.1029/2006JA012237
Bortnik, J., Thorne, R. M., and Meredith, N. P. (2008). The unexpected origin of plasmaspheric hiss from discrete chorus emissions. Nature 452, 62–66. doi:10.1038/nature06741
Burton, R. K., and Holzer, R. E. (1974). The origin and propagation of chorus in the outer magnetosphere. J. Geophys. Res. 79, 1014–1023. doi:10.1029/JA079i007p01014
Chen, L., Bortnik, J., Li, W., Thorne, R. M., and Horne, R. B. (2012b). Modeling the properties of plasmaspheric hiss: 1. Dependence on chorus wave emission. J. Geophys. Res. 117, A05201. doi:10.1029/2011JA017201
Chen, L., Bortnik, J., Thorne, R. M., Horne, R. B., and Jordanova, V. K. (2009). Three-dimensional ray tracing of VLF waves in a magnetospheric environment containing a plasmaspheric plume. Geophys. Res. Lett. 36, L22101. doi:10.1029/2009GL040451
Chen, L., Bortnik, J., Thorne, R. M., Li, W., and Horne, R. B. (2012a). Modeling the properties of plasmaspheric hiss: 2. Dependence on the plasma density distribution. J. Geophys. Res. 117, A05202. doi:10.1029/2011JA017202
Chen, L., Li, W., Bortnik, J., and Thorne, R. M. (2012d). Amplification of whistler-mode hiss inside the plasmasphere. Geophys. Res. Lett. 39, L08111. doi:10.1029/2012GL051488
Chen, L., Thorne, R. M., Li, W., Bortnik, J., Turner, D., and Angelopoulos, V. (2012c). Modulation of plasmaspheric hiss intensity by thermal plasma density structure. Geophys. Res. Lett. 39, L14103. doi:10.1029/2012GL052308
Choi, H.-S., Lee, J., Cho, K.-S., Kwak, Y.-S., Cho, I.-H., Park, Y.-D., et al. (2011). Analysis of GEO spacecraft anomalies: space weather relationships. Space weather. 9, S06001. doi:10.1029/2010SW000597
Church, S. R., and Thorne, R. M. (1983). On the origin of plasmaspheric hiss: Ray path integrated amplification. J. Geophys. Res. 88, 7941–7957. doi:10.1029/ja088ia10p07941
Crabtree, C., Tejero, E., Ganguli, G., Hospodarsky, G. B., and Kletzing, C. A. (2017). Bayesian spectral analysis of chorus subelements from the Van Allen probes. J. Geophys. Res. Space Phys. 122, 6088–6106. doi:10.1002/2016JA023547
Denton, R. E., Goldstein, J., and Menietti, J. D. (2002). Field line dependence of magnetospheric electron density. Geophys. Res. Lett. 29 (24), 2205. doi:10.1029/2002GL015963
Goldstein, J., Sandel, B. R., Thomsen, M. F., Spasojevic ´, M., and Reiff, P. H. (2004). Simultaneous remote sensing and in situ observations of plasmaspheric drainage plumes. J. Geophys. Res. 109, A03202. doi:10.1029/2003JA010281
Hartley, D. P., Kletzing, C. A., Chen, L., Horne, R. B., and Santolík, O. (2019). Van Allen probes observations of chorus wave vector orientations: implications for the chorus-to-hiss mechanism. Geophys. Res. Lett. 46, 2337–2346. doi:10.1029/2019GL082111
Hayakawa, M., and Sazhin, S. S. (1992). Mid-latitude and plasmaspheric HISS—A review. Planet. Space Sci. 40, 1325–1338. doi:10.1016/0032-0633(92)90089-7
He, Z., Chen, L., Liu, X., Zhu, H., Liu, S., Gao, Z., et al. (2019). Local generation of high-frequency plasmaspheric hiss observed by Van Allen probes. Geophys. Res. Lett. 46 (3), 1141–1148. doi:10.1029/2018GL081578
He, Z., Yu, J., Chen, L., Xia, Z., Wang, W., Li, K., et al. (2020). Statistical study on locally generated high-frequency plasmaspheric hiss and its effect on suprathermal electrons: Van Allen probes observation and quasi-linear simulation. J. Geophys. Res. Space Phys. 125 (10). doi:10.1029/2020ja028526
Horne, R. B. (1989). Path-integrated growth of electrostatic waves: the generation of terrestrial myriametric radiation. J. Geophys. Res. 94, 8895–8909. doi:10.1029/ja094ia07p08895
Huang, C. Y., and Goertz, C. K. (1983). Ray-tracing studies and path-integrated gains of ELF unducted whistler-mode waves in the Earth’s magnetosphere. J. Geophys. Res. 88, 6181–6187. doi:10.1029/ja088ia08p06181
Huang, C. Y., Goertz, C. K., and Anderson, R. R. (1983). A theoretical study of plasmaspheric hiss generation. J. Geophys. Res. 88, 7927–7940. doi:10.1029/ja088ia10p07927
Jordanova, V. K., Miyoshi, Y. S., Zaharia, S., Thomsen, M. F., Reeves, G. D., Evans, D. S., et al. (2006). Kinetic simulations of ring current evolution during the geospace environment modeling challenge events. J. Geophys. Res. 111, A11S10. doi:10.1029/2006JA011644
Katoh, Y., and Omura, Y. (2013). Effect of the background magnetic field inhomogeneity on generation processes of whistler-mode chorus and broadband hiss-like emissions. J. Geophys. Res. Space Phys. 118, 4189–4198. doi:10.1002/jgra.50395
Kletzing, C. A., Kurth, W. S., Acuna, M., MacDowall, R. J., Torbert, R. B., Averkamp, T., et al. (2013). The electric and magnetic field instrument suite and integrated science (EMFISIS) on RBSP. Space Sci. Rev. 179, 127–181. doi:10.1007/s11214-013-9993-6
Li, W., Ma, Q., Thorne, R. M., Bortnik, J., Kletzing, C. A., Kurth, W. S., et al. (2015). Statistical properties of plasmaspheric hiss derived from Van Allen probes data and their effects on radiation belt electron dynamics. J. Geophys. Res. Space Phys. 120, 3393–3405. doi:10.1002/2015JA021048
Li, W., Thorne, R. M., Angelopoulos, V., Bortnik, J., Cully, C. M., Ni, B., et al. (2009). Global distribution of whistler-mode chorus waves observed on the THEMIS spacecraft. Geophys. Res. Lett. 36, L09104. doi:10.1029/2009GL037595
Li, W., Thorne, R. M., Bortnik, J., Nishimura, Y., Angelopoulos, V., Chen, L., et al. (2010). Global distributions of suprathermal electrons observed on THEMIS and potential mechanisms for access into the plasmasphere. J. Geophys. Res. 115, A00J10. doi:10.1029/2010JA015687
Li, W., Thorne, R. M., Bortnik, J., Reeves, G. D., Kletzing, C. A., Kurth, W. S., et al. (2013). An unusual enhancement of low-frequency plasmaspheric hiss in the outer plasmasphere associated with substorm-injected electrons. Geophys. Res. Lett. 40, 3798–3803. doi:10.1002/grl.50787
Lyons, L. R., and Thorne, R. M. (1973). Equilibrium structure of radiation belt electrons. J. Geophys. Res. 78 (13), 2142–2149. doi:10.1029/JA078i013p02142
Lyons, L. R., Thorne, R. M., and Kennel, C. F. (1972). Pitch-angle diffusion of radiation belt electrons within the plasmasphere. J. Geophys. Res. 77, 3455–3474. doi:10.1029/JA077i019p03455
Ma, Q., Li, W., Thorne, R. M., Bortnik, J., Reeves, G. D., Kletzing, C. A., et al. (2016). Characteristic energy range of electron scattering due to plasmaspheric hiss. J. Geophys. Res. Space Phys. 121 (11), 737–749. doi:10.1002/2016JA023311
Malaspina, D. M., Jaynes, A. N., Boulé, C., Bortnik, J., Thaller, S. A., Ergun, R. E., et al. (2016). The distribution of plasmaspheric hiss wave power with respect to plasmapause location. Geophys. Res. Lett. 43, 7878–7886. doi:10.1002/2016GL069982
Malaspina, D. M., Jaynes, A. N., Hospodarsky, G., Bortnik, J., Ergun, R. E., and Wygant, J. (2017). Statistical properties of low-frequency plasmaspheric hiss. J. Geophys. Res. Space Phys. 122, 8340–8352. doi:10.1002/2017JA024328
Mauk, B. H., Fox, N. J., Kanekal, S. G., Kessel, R. L., Sibeck, D. G., and Ukhorskiy, A. (2012). Science objectives and rationale for the radiation belt storm probes mission. Space Sci. Rev. 179, 3–27. doi:10.1007/s11214-012-9908-y
Meredith, N. P., Horne, R. B., Kersten, T., Li, W., Bortnik, J., Sicard, A., et al. (2018). Global model of plasmaspheric hiss from multiple satellite observations. J. Geophys. Res. Space Phys. 123 (6), 4526–4541. doi:10.1029/2018JA025226
Meredith, N. P., Bortnik, J., Horne, R. B., Li, W., and Shen, X.-C. (2021). Statistical investigation of the frequency dependence of the chorus source mechanism of plasmaspheric hiss. Geophys. Res. Lett. 48, e2021GL092725. doi:10.1029/2021GL092725
Meredith, N. P., Horne, R. B., Bortnik, J., Thorne, R. M., Chen, L., Li, W., et al. (2013). Global statistical evidence for chorus as the embryonic source of plasmaspheric hiss. Geophys. Res. Lett. 40, 2891–2896. doi:10.1002/grl.50593
Meredith, N. P., Horne, R. B., Glauert, S. A., and Anderson, R. R. (2007). Slot region electron loss timescales due to plasmaspheric hiss and lightning generated whistlers. J. Geophys. Res. 112, A08214. doi:10.1029/2006JA012413
Meredith, N. P., Horne, R. B., Glauert, S. A., Baker, D. N., Kanekal, S. G., and Albert, J. M. (2009). Relativistic electron loss timescales in the slot region. J. Geophys. Res. 114, A03222. doi:10.1029/2008JA013889
Meredith, N. P., Horne, R. B., Thorne, R. M., Summers, D., and Anderson, R. R. (2004). Substorm dependence of plasmaspheric hiss. J. Geophys. Res. 109, A06209. doi:10.1029/2004JA010387
Ni, B., Li, W., Thorne, R. M., Bortnik, J., Ma, Q., Chen, L., et al. (2014). Resonant scattering of energetic electrons by unusual low-frequency hiss. Geophys. Res. Lett. 41, 1854–1861. doi:10.1002/2014GL059389
Omura, Y., Hikishima, M., Katoh, Y., Summers, D., and Yagitani, S. (2009). Nonlinear mechanisms of lower-band and upper-band VLF chorus emissions in the magnetosphere. J. Geophys. Res. 114, A07217. doi:10.1029/2009JA014206
Omura, Y., Katoh, Y., and Summers, D. (2008). Theory and simulation of the generation of whistler-mode chorus. J. Geophys. Res. 113, A04223. doi:10.1029/2007JA012622
Omura, Y., and Nunn, D. (2011). Triggering process of whistler mode chorus emissions in the magnetosphere. J. Geophys. Res. 116, A05205. doi:10.1029/2010JA016280
Rasmussen, C. E., Guiter, S. M., and Thomas, S. G. (1993). A two-dimensional model of the plasmasphere: refilling time constants. Planet. Space Sci. 41, 35–43. doi:10.1016/0032-0633(93)90015-T
Russell, C. T., Holzer, R. E., and Smith, E. J. (1969). OGO 3 observations of ELF noise in the magnetosphere: 1. Spatial extent and frequency of occurrence. J. Geophys. Res. 74, 755–777. doi:10.1029/JA074i003p00755
Santolík, O., Kletzing, C. A., Kurth, W. S., Hospodarsky, G. B., and Bounds, S. R. (2014). Fine structure of large-amplitude chorus wave packets. Geophys. Res. Lett. 41, 293–299. doi:10.1002/2013GL058889
Smith, E. J., Frandsen, A. M. A., Tsurutani, B. T., Thorne, R. M., and Chan, K. W. (1974). Plasmaspheric hiss intensity variations during magnetic storms. J. Geophys. Res. 79 (16), 2507–2510. doi:10.1029/ja079i016p02507
Summers, D., Ni, B., Meredith, N. P., Horne, R. B., Thorne, R. M., Moldwin, M. B., et al. (2008). Electron scattering by whistler-mode ELF hiss in plasmaspheric plumes. J. Geophys. Res. 113, A04219. doi:10.1029/2007JA012678
Thorne, R. M., Church, S. R., and Gorney, D. J. (1979). On the origin of plasmaspheric hiss: the importance of wave propagation and the plasmapause. J. Geophys. Res. 84, 5241–5247. doi:10.1029/ja084ia09p05241
Thorne, R. M., Li, W., Ni, B., Ma, Q., Bortnik, J., Baker, D. N., et al. (2013). Evolution and slow decay of an unusual narrow ring of relativistic electrons near L∼3.2 following the September 2012 magnetic storm. Geophys. Res. Lett. 40, 3507–3511. doi:10.1002/grl.50627
Thorne, R. M., Smith, E. J., Burton, R. K., and Holzer, R. E. (1973). Plasmaspheric hiss. J. Geophys. Res. 78, 1581–1596. doi:10.1029/JA078i010p01581
Keywords: plasmaspheric hiss, chorus, plume, ray tracing, magnetosphere
Citation: Bortnik J, Chen L, Zhang X-J and Meredith NP (2025) Evolution of dayside chorus into nightside plasmaspheric hiss. Front. Astron. Space Sci. 12:1619877. doi: 10.3389/fspas.2025.1619877
Received: 28 April 2025; Accepted: 21 July 2025;
Published: 25 August 2025.
Edited by:
Elena Kronberg, Ludwig Maximilian University of Munich, GermanyReviewed by:
Kyung-Chan Kim, Chungbuk National University, Republic of KoreaHuayue Chen, Auburn University, United States
Copyright © 2025 Bortnik, Chen, Zhang and Meredith. This is an open-access article distributed under the terms of the Creative Commons Attribution License (CC BY). The use, distribution or reproduction in other forums is permitted, provided the original author(s) and the copyright owner(s) are credited and that the original publication in this journal is cited, in accordance with accepted academic practice. No use, distribution or reproduction is permitted which does not comply with these terms.
*Correspondence: Jacob Bortnik, amJvcnRuaWtAYXRtb3MudWNsYS5lZHU=; Lunjin Chen, bHVuamluLmNoZW5AdXRkYWxsYXMuZWR1