 M. F. L. Meersman
 S. M. Cazaux1*†
 J. Jovanova
- 1Aerospace Engineering Faculty, Technische Universiteit Delft, Delft, Netherlands
- 2Mechanical Engineering Faculty, Technische Universiteit Delft, Delft, Netherlands
Enceladus, one of Saturn’s moons, is considered one of the most promising places in the solar system to find life. The Cassini mission discovered organic-rich water plumes from Enceladus’s subsurface ocean, prompting new lander mission planning. We developed a mechanically simple ice sampling system for autonomous life detection on lander missions. The system is controlled by a single rotary actuator that samples, liquefies, and prepares ice for microscopic observations. Sample acquisition uses a novel conical boundary layer pump that delivers samples to a microfluidic disk. A digital holographic microscope detects microorganisms without mechanical focusing. The single-actuator design enables closed-loop control of velocity, position, and torque, with an operational sequence controlling fluid dynamics in a centrifugal microfluidic disk. Testing demonstrated system feasibility and effectiveness across all subsystems. Open-source software was developed for automated onboard hologram processing, including organism motility detection to assess presence of life. This single-actuator design reduces mechanical complexity for lander missions. Future work focuses on adapting the technology for terrestrial applications and achieving required technology readiness levels for space deployment.
1 Introduction
Enceladus is considered one of the most likely place in the solar system for life to exist beyond Earth (McKay et al., 2008), (Parkinson et al., 2008), (Cable et al., 2021). This moon of Saturn has captured the interest of the scientific community primarily because of the organic compounds detected by the Cassini spacecraft in 2005 (Postberg et al., 2018). The discovery was made as Cassini flew through the plumes of the small, icy moon. The exosphere of Enceladus, composed of a mix of water vapor and icy particles, results from these active plumes, which continuously expel material from its subsurface ocean (Waite et al., 2009). These plumes, which are the result of cracks in the South Pole region, allow the liquid ocean beneath Enceladus’s icy crust to be suctioned into the vacuum of space. This expulsion contributes to Saturn’s E-ring (Postberg et al., 2009) and is the primary source of the exosphere around Enceladus. This discovery has led to proposals for new missions to Enceladus, such as the Ocean Worlds Life Surveyor mission (Wronkiewicz et al., 2024). The European Space Agency reported in their 2024 Science Office Report that they plan to launch a new exploration mission to the Saturnian system by 2050, with Enceladus as the primary target for a lander mission (Martins et al., 2025). Such missions would involve various scientific instruments, where microscopic imaging and spectroscopic instruments would play an important role (Wronkiewicz et al., 2024), (Nadeau et al., 2018).
In response to these scientific goals, this paper introduces a robust ice sampling system that uses a single rotary actuator to control fluid within a microfluidic chip, aligning samples for microscopic examination, as envisioned in Figure 1. The system uses a conical boundary layer pumping technique, which uses the momentum of fluid flow and does not depend on pressure differences. We developed a bladeless pump that interfaces the microfluidic setup, integrating all rotating components into a unified system. We demonstrate the modularity of this sampling system by applying a microscopy method—Digital Holographic Microscopy (DHM)—which allows for the detection of living microorganisms throughout a liquid volume without the need for mechanical focusing.
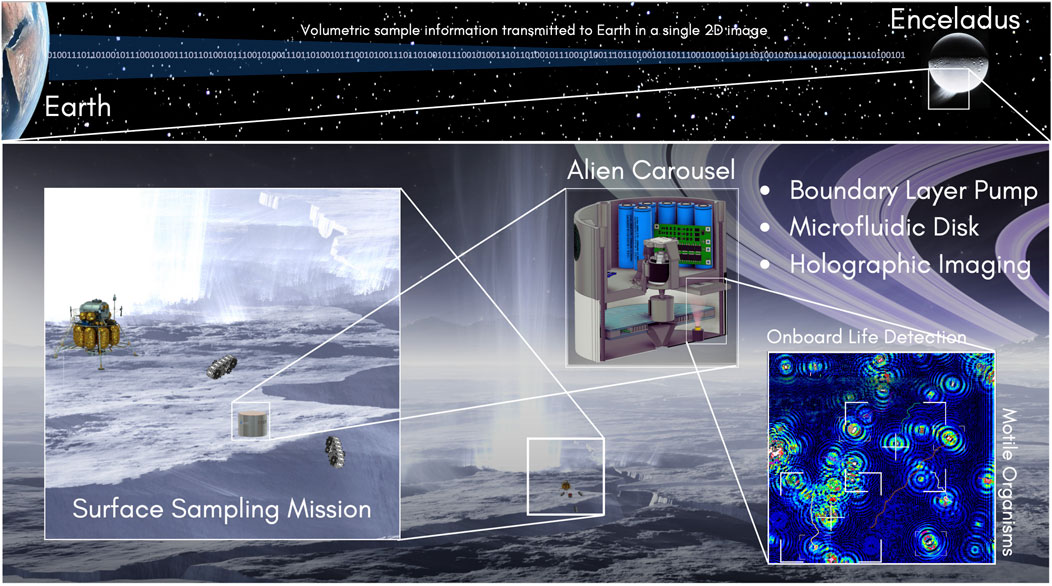
Figure 1. The envisioned mission to Enceladus: A lander mission towards the south polar region deploys the “Alien Carousel” ice sampling system. It integrates microfluidics and digital holographic microscopy setup to image and study the movement of microorganisms in a liquid volume. The mechanical system relies on a single rotary actuator.
2 Materials and methods
2.1 Related work
2.1.1 Environmental considerations operating on enceladus
The surface conditions on Enceladus pose challenges that we do not experience on Earth, which make it hard to operate landers and robotic systems. We highlight several environmental considerations, relevant to this project.
The most challenging surface condition is the cryogenic temperature. For the scientifically interesting South Polar Terrain, the temperature vary from 85 (Spencer et al., 2006), (Spencer, 2009) up to 197 ± 20 K within the cracks (Goguen et al., 2013). These temperatures, coupled with the continuous accumulation of snow on top of the lander due to the fall out of the plumes, can cause the mechanical components to freeze and break down over time. This can limit the lifetime of equipment and therefore the success of the overall mission. Heating is the only real solution to this issue but requires a considerable amount of power. Therefore, minimizing the amount of actuators and moving components is a sensible design objective. Fewer actuators need less total heating. Fewer moving components also make the system inherently more reliable.
Secondly, Enceladus is tectonically very active, which is indicated by the permanent presence of cracks in the ice surface (Porco et al., 2006), (Helfenstein and Porco, 2015). Near the South Polar Terrain, these cracks are approximately 130 km long and are spaced about 35 km apart. However, there is still some uncertainty about the crack width. Various models have been published, estimating a crack width between 0.05 and 5 m (Ingersoll and Nakajima, 2016), (Kite and Rubin, 2016).
Thirdly, it is still uncertain what the actual surface textures are once landed. Although Enceladus is predominantly covered by crystalline water ice near the South Polar Terrain, the mechanical structure of this water phase is yet to be fully understood (Brown et al., 2006). This region also contains patches of amorphous ice, which behave more like loose snow in comparison to the more rigid crystalline ice. Whether the local surface composition behaves more like loose amorphous snow or structured crystalline ice can have significant implications for the landing and sampling strategy. Researchers are even concerned about the risk of a landing sinking into the snow (Martin et al., 2023), (Whitten and Martin, 2019). Power availability is an additional concern. The rotational axis tilt and inclination of Enceladus are nearly zero degrees, leading it to experience similar seasonal changes as Saturn itself. With Saturn having an axial tilt of 26.7
2.1.2 Digital holographic microscopy
DHM provides non-invasive, three-dimensional imaging capabilities at micrometer level without the need for lens-based focusing mechanisms (Serabyn et al., 2016), making it particularly effective in extreme environmental conditions. Unlike traditional microscopes, which rely on mechanical components for focusing, DHM employs numerical methods to adjust the focus. This makes DHM a good imaging technique for environments where physical adjustments through mechanical movements are impractical (Lindensmith et al., 2016).
One advantage of DHM is that it can function without lenses. Lensless setups suffer less from ice build-up, a common challenge in cryogenic vacuum environments (Moeller et al., 2012), and eliminate the need for mechanical focusing. This feature is beneficial in icy or underwater environments where salt, ice, and water can rapidly deteriorate mechanical systems. Additionally, DHM’s ability to numerically propagate the focal plane creates a large, virtual depth of field, enabling detailed imaging at various distances from the sensor along the optical axis. A common challenge for lensless systems is their restricted field of view, which is limited by the detector area. However, this issue can be mitigated by controlling the sample area to sequentially bring different regions into the field of view, which can then be stitched together during post-processing (Zapata-Valencia et al., 2023). DHM’s ability for volumetric sampling has proven to be essential for deep-sea explorations. Most notably, DHM has been successfully demonstrated to sample microorganisms at depths up to 6 km (Bochdansky et al., 2013).
DHM’s robust, compact design is ideal for both terrestrial and extraterrestrial explorations. It has been successfully employed for monitoring underwater ecosystems in polar regions (Lindensmith et al., 2016) and holds potential for astrobiological research in environments as challenging as Mars and the icy moons of Jupiter and Saturn (Bedrossian et al., 2017).
2.1.3 Centrifugal microfluidics
Centrifugal microfluidics, also known as Lab-on-a-CD, involves a circular flat disk with integrated fluid channels. Upon rotating, centrifugal forces act on the disk, directing the flow of fluids to specific areas designated for biochemical diagnostics. Central to these platforms is fluid flow control, achieved through microvalves.
One common type of passive microvalve is the capillary burst valve. These valves utilize geometric modifications to manage fluid flow, leveraging capillary forces for control (Cho et al., 2007). This straightforward yet efficient method simplifies sample preparation, as it relies solely on liquid pressure for regulation.
In addition to capillary burst valves, Peshin et al. (2022) investigated various valving mechanisms, including both passive and active types, to address diverse microfluidic applications. Passive valves, which depend on intrinsic fluidic properties and centrifugal force, are known for their simplicity in operation and fabrication. On the other hand, active valves require external triggers for their operation.
Microvalve technologies, particularly capillary burst and other passive valving strategies, are well-established within microfluidics (Tang et al., 2016). These innovations facilitate complex biochemical analyses to be conducted without the need for actuators beyond a single rotary actuator.
2.1.4 Boundary layer pumping
The boundary layer effect is a fundamental fluid dynamics principle where a thin layer of fluid in immediate contact with a surface moves at a different velocity than the adjacent fluid layers (Lachmann, 2014). This effect is characterized by a viscosity-dominated flow, which allows for flow initiation without the need for an existing pressure difference, a phenomenon referred to as a purely viscous effect.
One of the first practical applications of the boundary layer effect is the Tesla Turbine. This turbine leverages the boundary layer effect by using smooth, closely spaced disks to generate energy from fluid flows. The fluid adheres to the disk surfaces and drags along due to its viscosity, effectively converting the fluid’s kinetic energy into mechanical energy without the use of traditional turbine blades. By adding energy to the system, the turbine can be transformed into a pump to create flow.
2.2 Concept definition
To create a reliable sampling and imaging system capable of operating in challenging environments, the concept envisions a system designed to function effectively in harsh terrains using a minimalist design strategy. The goal is to have a single, handheld unit that can be placed on a flat ice surface. Once positioned, it should operate without the need for intervention from external systems. This means it should be an integrated system in which sample acquisition and disposal, sample preparation and imaging techniques are functioning together.
2.2.1 Conceptual subsystems and operational phases
The proposed system is engineered to function via a solitary mechanical actuator coupled with a thermal element. This simplistic configuration enables the execution of five core operations that together, define the operation of acquiring and analyzing a single ice sample: the melting, sampling, preparation, imaging, and expulsion of specimens. These different modes are depicted in Figure 2.
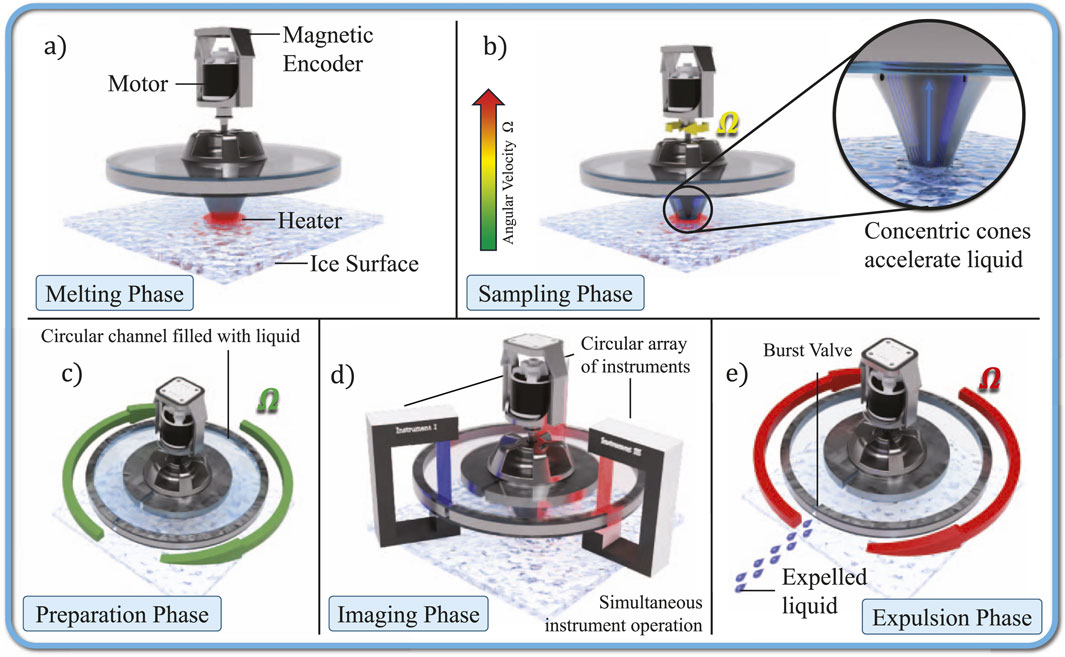
Figure 2. Operational phases for a single sample: (a) The system is placed on an icy surface with its conical shroud touching the surface. A circular heating element brings the water phase from solid to liquid. (b) While maintaining a localized heated region, the system starts rotating. This accelerates the melted fluid towards a higher location within the disk that sits on top. (c) At a different spinning rate, the liquid that originated from the cone enters a circular channel within the disk until the channel is filled. (d) By stopping the rotation, the disk will come to a standstill. Along the full perimeter of the disk, scientific instruments can perform their analysis on the liquid. By changing the angular position of the disk in a stepwise motion, the complete channel can be analyzed by every instrument in one go. (e) By spinning at a much higher angular velocity, the capillary burst valve at the outer perimeter bursts, allowing the complete volume of liquid to be emptied.
In the initial operational phase, positioning a ring-shaped heater on a frozen surface induces localized melting, generating a circular liquid pool. The heating element can either be a ceramic heater. The ring configuration is designed to promote the formation of a liquid puddle centrally within the confines of the ring. From this circular region, fluid can be efficiently extracted. This heater is schematically depicted in Figure 2a.
At the heart of the system is a conical shroud embedded with concentric cones, each spaced very closely to the next. This design is detailed in Figure 2b. Upon rotation, induced by the motor, the cone begins to spin, causing any liquid in contact with the cones to accelerate tangentially. Due to its conically shaped design, the liquid is compelled to move upwards and outwards being the only viable direction due to the geometry of the setup. This creates an accelerated flow towards a microfluidic disk. This disk with embedded microchannels plays an important role in sample preparation. By spinning at specific angular velocities, the centrifugal forces direct the liquid to a circular channel on the disk such that it can be imaged, as shown in Figure 2c.
The rotation positions the liquid inside the microfluidic disk directly in line with an optical imaging system, thus placing the sample within the field of view of the respective instrument. This is visualized in Figure 2d. In this study, we demonstrate the disk’s functionality with a single instrument well suited for volumetric sample analysis: a holographic microscope that uses a laser diode to illuminate the sample. As light travels through the liquid, the diffracted wavefront is captured by a Complementary Metal Oxide Semiconductor (CMOS) detector. This interference pattern gathers three-dimensional data about the liquid sample in a two-dimensional format. This setup is beneficial because it allows a single image to hold tomographic information about the volume, offering a compact way to encode data.
Secondly, the disk’s design facilitates sequential imaging of the sample by rotating the disk. This rotation ensures that all regions on the disk can be analyzed. The circular channel design supports the integration of additional scientific instruments along its perimeter, as shown in Figure 2d. These could include devices for UV-Vis spectroscopy and fluorescence microscopy, among others. By simply rotating the sample in the field of view of the instrument in question, the sample can be analyzed from multiple scientific perspectives, maximizing the data acquired from each sampling event.
To expel the analyzed sample and prepare for subsequent collections, the system employs a capillary burst valve. This component is triggered at a higher angular speed than that used for filling the circular channel, efficiently clearing the microfluidic disk by overcoming the fluid resistance in the outer channels. This capability allows the system to quickly test new samples without the need for extensive mechanical adjustments. This operational phase is visually described in Figure 2e.
2.2.2 Imaging techniques
As depicted in Figure 2d, the disk features closed-loop position control. This allows for the precise alignment of a region in the fluid channel with the necessary instruments for analysis, which in this study will be a DHM. Importantly, the closed-loop position control enables stepwise rotation of the disk, bringing each segment of the circular channel sequentially into the view of each instrument along the perimeter. This methodical rotation ensures that every instrument can analyze the complete circular channel. By combining every observation of the stepwise rotation, a panoramic image can be created of the complete fluid channel. This configuration enables the application of various observational techniques on the same sample, such as DHM, spectrometry, and multispectral imaging, among others.
To achieve precision imaging, the targeted sample area should remain motionless. This is necessary for imaging techniques that require a stationary sample to avoid motion blur, like microscopy. To achieve this, the motor that drives the disk rotation can slow down to a static holding position, actively controlled through a closed feedback loop rather than simply powering off. This ensures precise and absolute positional control of the disk. It should be noted that obtaining precise position control of the liquid itself imposes new challenges that are not addressed in this study. Instead of step-wise observations, continuous sampling is a possibility, provided the instrument has a sufficiently high frame rate. New algorithms are being developed to enable continuous imaging and overcome motion blur (Fanous and Popescu, 2022), (Conte et al., 2013), but are not yet widely used.
Stray light is another consideration to ensure quality measurements. Stray light is a common issue with instrumentation techniques that rely on their own specific illumination sources, such as coherent monochromatic lasers. If too much stray light, i.e., noise, falls onto the detector, it becomes difficult to extract the signal that contains the measurement. Figure 3 presents a sectional view of the disk, which is surrounded by a shield to effectively form a miniature dark room. It is important to note that the conical section protrudes through this shield from the bottom, as it must maintain contact with the ice surface. This same shield is also visible in Figure 4a.
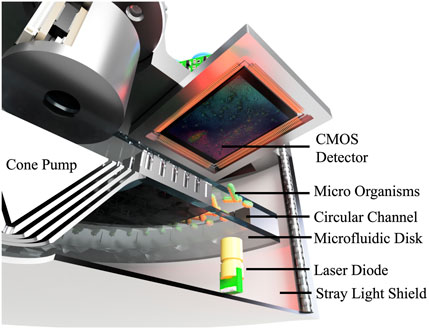
Figure 3. Conceptual cross-section representation of the optical chain, housed within an enclosure. The enclosure shields the instrument from stray light while also protecting and housing the internals.

Figure 4. Proof of Concept of the sampler with integrated holographic imager. Dimensions indicated in figure. (a) With cover to protect from the elements and stray light. (b) Cover removed. Showing the microfluidic disk hidden behind the yellow structural rings (laser and camera not visible).
This sample control not only demonstrates the effectiveness of individual instruments, such as the DHM used in this study but also highlights its capability to simultaneously support different scientific instruments.
2.3 Alien Carousel system overview
The concept was developed into a functional prototype to validate its functionality. This section discusses the mechanical design of the prototype and its principal systems.
2.3.1 Prototype overview
The prototype, as shown in Figure 4, consists of a cylindrical housing with a diameter of 180 mm and a height of 250 mm, which integrates the core concepts introduced in subsection B. This housing is organized into two levels: the lower level accommodates the microfluidic disk and the imaging system, while the upper level contains all necessary electronics for motor control, camera operations, and system power. A rechargeable battery system and the motor controller are all situated in this section. Additionally, the prototype includes a detachable stray light cover to ensure correct alignment of the disk, cone, and optics, and a handle to aid in future field tests.
2.3.2 Conical boundary layer pump
This section details the development and design of the first rotating mechanical component, the conical boundary layer pump, depicted in Figure 5b. The pump transports liquid samples from the icy surface directly to the microfluidic chip. It uses a boundary layer pumping technique, facilitating fluid movement through its conical shape.
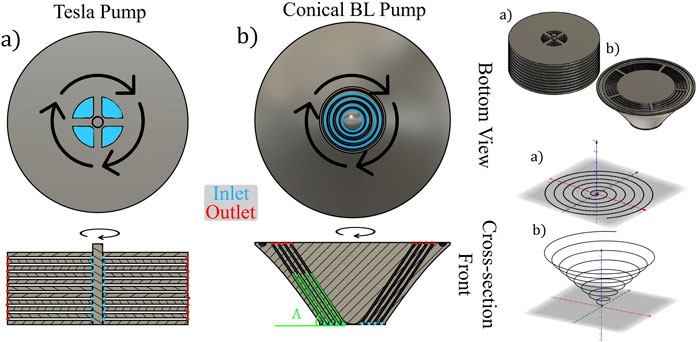
Figure 5. Conical Boundary Layer (b) pump inspired by the Tesla Pump (a): bottom and front cross-section view shows the liquid inlets in blue, outlets in red. The cross-sectional and isometric view shows how (a) is made of planar disks and (b) of concentric cones. The bottom right visualizes the spiraling flow trajectory of a particle through inertial space for the Tesla pump (a) and the conical boundary layer pump (b). In green, the geometry dictating cone angle
To transport liquids upward against gravity, a force must be exerted in the direction opposite to local gravity. Given the design constraint of using a single rotary actuator, with its rotation axis perpendicular to the icy surface, no direct upward force can be exerted on the fluid by rotation alone.
Therefore, a monolithic geometry should be designed to direct the liquid flow upward upon rotation. Our design employs the boundary layer effect, exploiting the no-slip condition at the interface between the liquid and its contact surface with the pump. This is achieved by embedding concentric cones within each other, effectively maximizing the initial contact surface to magnify this effect. Upon rotation, in the rotating reference frame, the liquid at the contact surface remains stationary due to the no-slip condition. Meanwhile, in the inertial reference frame, this rotation induces tangential forces on the liquid. Combined with the conical shape of the assembly, these forces also generate a normal force that propels the liquid upwards against gravity, as depicted in the inlet shrouds shown in blue in Figure 5b.
Our design modifies the Tesla pump,as depicted in Figure 5a, as depicted in Figure 5a,by converting the disks into cones, which direct the flow upwards and outwards as a conical spiral. The centrifugal force pushes the liquid radially outward while the conical shape causes the liquid to hit the cone’s angled walls, resulting in a normal force that moves the liquid upward, forming a spiraling cone trajectory.
The choice of this pump mechanism is based on two considerations:
1. This system establishes flow without “priming” the system with liquid. Pressure-driven pumps typically require priming to establish a pressure difference before flow initiation. This adds unnecessary complexity and is impractical in low-pressure or microgravity environments.
2. This pump is bladeless. Blades can degrade over time and might carve into the icy substrate. Given the uncertainties about the ice structure on Enceladus, as discussed in subsubsection 1, a system that could dig itself into the ice or snow is undesirable as it might get stuck. As long as the ice or snow melts, the pump can operate without significant friction or risk of digging into the surface.
The cone has three important design parameters that describe its geometry:
1. Number of concentric cones: The count of concentric cones is limited by the geometry of the cone, as adding more cones beyond a certain point would not allow effective contact with the ice interface.
2. Spacing between cones: The spacing between the cones affects the boundary layer effect. When the cones are positioned closer together, the boundary layers on each cone surface come into closer proximity. This increases the ratio of fluid volume influenced by viscous effects to the total fluid volume between the cones, thereby enhancing the overall boundary layer effect. Closer spacing also increases the risk of clogging from particulates in the sample. A spacing of 0.2 mm is selected to balance effectiveness with the potential of blockages.
3. Cone angle: The bluntness of the cone is dictated by the cone angle,
The performance parameter investigated is the fluid transport capability of the cone, which is quantified as the required angular velocity to transport liquid from the ice surface to the microfluidic disk for a given cone angle,
2.3.3 Microfluidic chip
Once liquid passes through the inter-cone spacings, it enters a microfluidic disk featuring rectangular microchannels ranging from 0.2 to 0.5 mm in width, designed to direct the flow towards or away from the circular channel where observations are made. The layout of these channels is shown in Figure 6c. This pattern is sandwiched between two transparent circular glasses to seal the system.
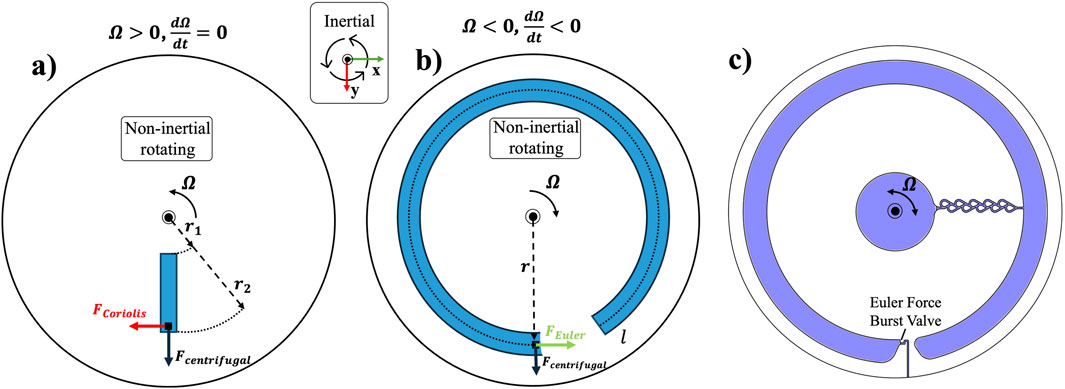
Figure 6. Apparent forces acting on a liquid particle within the co-rotating frame: (a) Constant positive angular velocity
The disk pattern contains two burst valves, as shown in Figure 6c. These valves act as gates to prevent liquid flow until the liquid pressure surpasses the burst pressure of the valve. The burst pressure for a particular valve geometry is expressed as:
where
When the liquid meniscus encounters a sudden expansion in the channel (the burst valve), the contact angle at the new wall is reduced by the channel’s divergence angle
Pressure within the liquid is controlled by two apparent forces within the co-rotating, non-inertial reference frame fixed to the rotating disk: the centrifugal and Euler forces. These forces, depicted in Figures 6a,b, act on the liquid particle and hence build up pressure within the fluid. The centrifugal force moves the liquid radially to the observation channel, whereas the Euler force aids the centrifugal force in ejecting the liquid from the system.
The pressure induced by the centrifugal force across the liquid in the microchannels is given by:
where
The rotation direction is reversed clockwise to eject liquid from the system. The system also no longer maintains a constant angular velocity. Instead, it undergoes a positive angular acceleration, denoted as
The Euler force arises due to angular acceleration. We consider this force acting on the fluid at a constant radius
where
By dividing this force over the channel cross-section areas
In this phase, the pressure within the fluid not only arises from the centrifugal force, which continues to act due to the existing angular velocity
Note that for the expulsion phase,
By controlling three parameters, i.e., the rotation direction and angular velocity and acceleration, the pressure and inertial displacement of the liquid can be controlled. These operational phases were experimentally validated in subsubsection 2.
2.3.4 Digital holographic microscope
The integration of a DHM into the sampling device has the objective to image microorganisms with a spatial resolution in the range of 10 microns. This resolution is sufficient to discern the general shapes of various microorganisms, such as tardigrades and ciliates (Bartels et al., 2011), (Foissner et al., 2009).
The lensless, in-line configuration of the DHM is depicted schematically in Figure 7. The optical chain starts with a 5 mW laser diode with an emission wavelength of 650 nm. A laser is needed as DHM requires a spatially coherent illumination source. Shorter wavelengths, although capable of improving angular resolution, were avoided to prevent potential damage to microorganisms from higher energy radiation. A 25-micron pinhole follows the laser, acting as a spatial filter to approximate a Gaussian beam to illuminate the sample. The captured wavefront is recorded by a CMOS sensor (Sony IMX219; 3,280

Figure 7. Schematic of the optical setup illustrating the path from the laser source to the CMOS sensor with an intermediate microfluidic disk.
The theoretical lateral and axial resolutions of an inline, lensless holography system are defined by the following expressions as per (Amann et al., 2019):
where
While it may initially appear from these equations that decreasing the distance between the object and the image plane would enhance resolution, there exists an optimal distance, denoted as
with
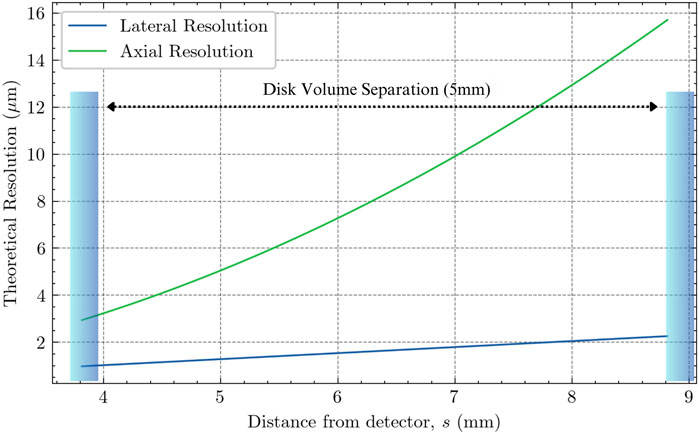
Figure 8. Theoretical attainable resolution within the microfluidic disk. Blue bars resemble the boundaries of the sample volume (left being the closest boundary).
The reconstruction process involves a numerical algorithm known as back-propagation. This technique enables the virtual focusing within the sample volume. The process relies on the known properties of the illumination source, i.e., its monochromatic nature, a quasi-point source, and spatial coherence. As depicted in Figure 7, the captured hologram is brought into the frequency domain by a 2D fast Fourier transform, which is then multiplied by a transfer function derived from the Angular Spectrum propagation method (Konijnenberg et al., 2024). The transfer function is represented by:
where
In addition to the hardware setup, an open-source Python-based software package was developed to replace commercial software typically used for similar setups. This software, available on GitHub (Meersman, 2024), integrates several features in addition to numerical reconstruction: blob detection for simultaneous particle counting and adjustable parameters for hologram reconstruction such as focus correction and height adjustments. The input requirements for the software include the path to the hologram image, the desired reconstruction distances, pixel size, and the wavelength of the light used, allowing for customization to fit various in-line DHM setups. The software prioritizes reconstruction speed by employing parallel processing techniques, effectively speeding up the analysis by a factor of the amount of CPU cores available. For system validation, a twin microscope setup employing the same optical components was developed to compare the DHM’s performance against traditional microscopic calibration targets. This was necessary as the disk cannot house these calibration components.
3 Results
3.1 Experimental validation
The subsystems of the prototype were independently tested. This section assesses the performance of the conical boundary layer pump using an experimental setup, examines the filling and expulsion phases of the microfluidic disk, and quantifies the performance of the DHM.
3.1.1 Sample extraction with conical pump
The experimental validation of the conical boundary layer pump tests the required angular velocity in order to transport liquid to the microfluidic disk. For the experiment, eight cones with varying cone angles,
The experimental setup consisted of each cone’s inlet shroud being positioned in direct contact with the liquid surface of a cup filled with water. This setup was placed on a high-precision scale, capable of measuring changes up to a thousandth of a gram. The cone was attached to an encoded brushless DC motor, and both the scale and the motor were connected to a PC. The PC controls the motor’s rotational velocity and concurrently records the weight data transmitted from a precision scale, which has been modified to include a serial bus. This configuration allowed for the monitoring of liquid mass and motor speed with time synchronization.
As the rotational speed increased, the measured weight remained constant until a critical speed was reached. At this point, the liquid was drawn through the cone pump and exited the cup, evidenced by a noticeable decrease in weight reported by the scale. This decrease marked the angular velocity necessary for initiating liquid flow through the cone. This experiment was repeated 20 times for all 8 cone designs, resulting in 160 data points. The data, visualized in Figure 9, shows a linear relationship between the cone angle and the required angular speed to establish flow.
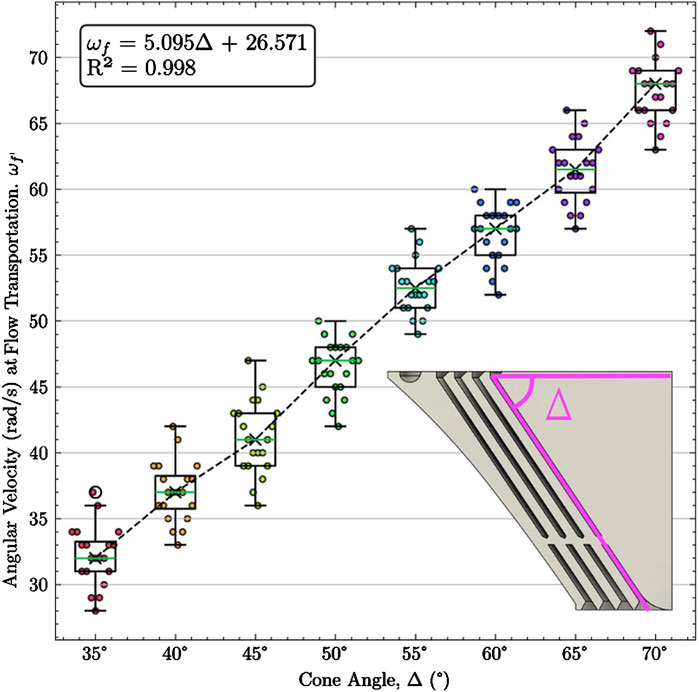
Figure 9. Experimental results of the conical boundary layer pump system. It depicts the angular velocity required to transport liquid to the fluidic disk under Earth’s gravitational acceleration. Linear least-squares regression shows a strong linear relationship.
3.1.2 Microfluidic disk and fluid control
The process of filling and emptying the observation channel through controlled adjustments in angular velocity, acceleration, and direction is validated using high-speed imaging. Black-dyed water, representing the liquid from the conical boundary layer pump, is introduced at the disk’s center. As depicted in Figures 10a,b, the disk rotates counterclockwise at a constant velocity of 40 rad/s, triggering the opening of the primary burst valve with a width of 0.5 mm and subsequent filling of the circular channel. An instantaneous reversal of the rotation rate at a constant angular acceleration of 5 rad/s enhances the Euler force, increasing the liquid pressure. This bursts the exit burst valve, which has a narrower width of 0.2 mm, enabling the emptying of the observation channel, as shown in Figure 10c.
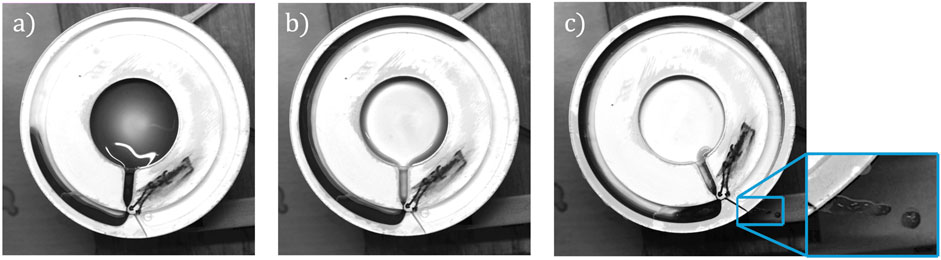
Figure 10. Fluid control phases experimentally validated using high-speed camera, white disk, and black contrast fluid: (a) Counterclockwise rotation at 40 rad/s slowly fills up the circular channel on the outer perimeter from the inner center. (b) After 5.32 s at 40 rad/s counterclockwise, the liquid in the center is now emptied fully into the circular channel. (c) Clockwise rotation at a constant acceleration (5
These specific velocities were determined through an iterative approach. The forces described in subsubsection 3 proved capable of controlling the liquid flow as desired. During the experimental testing of the expulsion phase, it was observed that both the exit burst valve and the primary burst valve opened, which was unwanted. To prevent this backflow through the primary burst valve a Tesla valve was integrated along the connecting line between the inlet and the primary burst valve, as shown in Figure 6c. This one-way valve design effectively prevents reverse flow back towards the inlet. Importantly, the experimental setup was designed to exclude gravitational effects by orienting the disk horizontally.
3.1.3 Microscopic imaging and resolution validation
The resolution of the DHM was assessed using a twin model of the primary microscope system. This auxiliary setup replicates the optical configuration of the primary model and is optimized for calibration using a resolution target. The twin model incorporates a Raspberry Pi Zero interfaced with a CMOS sensor, controlled via Wi-Fi. Its housing and shielding for stray light were fabricated using FDM 3D printing. A depiction of the twin model is shown in Figure 11a.
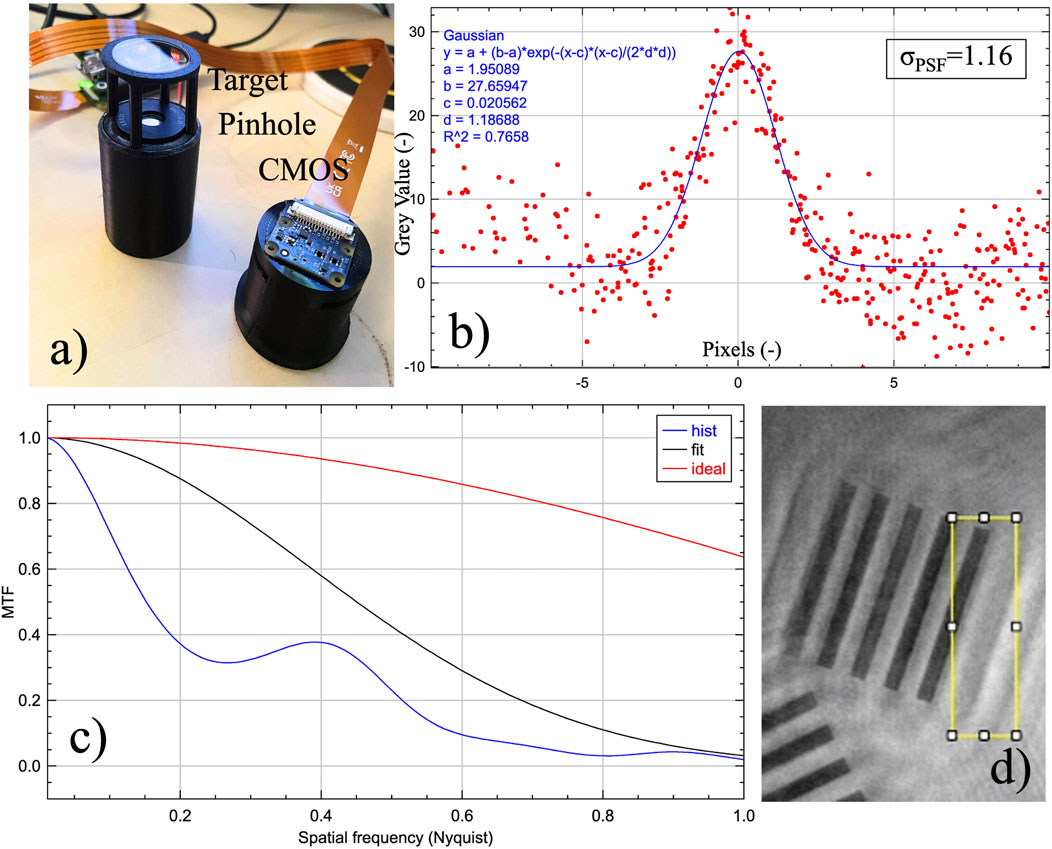
Figure 11. (a) Twin model of the microscope for placement of a resolution target. (b) Line Spread Function with a Gaussian fitted model, derived from the Edge Spread Function. (c) Modulation Transfer Function of the microscope at a distance of 3.84 mm from the detector. (d) The yellow region indicates the edge used for the slanted-edge method.
A calibration target, with the smallest feature size being 50 line pairs per millimeter, was employed to evaluate the system’s ability to resolve small features. The calibration target was positioned at a measured distance of 3.84 and 8.84 mm from the detector plan and a hologram was captured. The hologram was then focused using the Angular Spectrum propagation algorithm and the focused image was analyzed for the interspacing of these line pairs. The analysis confirmed that the system could resolve these features with a contrast ratio of approximately 78.2%.
To determine the system’s resolution limit, a complete modulation transfer function (MTF) was reconstructed. The MTF, shown in Figure 11c, was constructed using the slanted edge method, an ISO-standardized technique for quantifying resolution. Figure 11d highlights the yellow region of the edge used for this method.
The line spread function (LSF), derived from the edge spread function (ESF), was obtained by fitting a Gaussian model through the grayscale data points. The LSF measures the system’s response to a line input, while the ESF describes the system’s response to a step edge. The system exhibited a full width at half maximum of 3.064 µm, which, although sufficient for visualizing microorganisms, is greater than the theoretically predicted lateral resolution of 0.98 µm. The process was repeated at a distance of 8.84 mm from the sensor, which resulted in a lateral resolution of 4.56 µm.
Several factors may contribute to this discrepancy. The optical setup, including the 25-micron pinhole, does not produce a perfect Gaussian beam profile as the light source. Since the reconstruction method relies on this assumption, artifacts may appear in the resulting image (Amann et al., 2019). Furthermore, the precise positioning of the calibration target relative to the sensor, although validated with electronic precision calipers, is subject to some variation in distance. However, this alone does not account for the performance being close to three times worse than predicted. While the aforementioned factors cumulatively degrade performance, we believe the primary contributor is the interaction between the fringes of an individual line and those of all other lines present on the target. One should realize that although the slanted edge method focuses on a specific region of the target (see Figure 11b), that region is also affected by the interference of fringes created by other lines. This interaction significantly affects the resolution (Serabyn et al., 2018).
In practical applications with biological samples, the performance of the system can similarly be impacted when observing densely populated samples with multiple microorganisms or particles. The presence of numerous features within the transparent volume exacerbates performance degradation due to constructive and destructive interference of fringes. This suggests that the MTF of the system is also influenced by the sample it is observing. Although attempts were made to mask specific regions, this was not feasible with the current target. Nonetheless, it is important to note that a resolution of 3.064 µm is more than adequate for imaging microorganisms. However, increased sample density with non-transparent features may result in decreased performance due to fringe interactions, while well-separated features in the system’s view allow for more accurate reconstruction.
3.2 Prototype validation and field tests
As a final validation of the system, we separately tested both the fluid control system and the holographic microscopy with samples collected from the field.
3.2.1 Fluid control
The fluid control segment comprises a conical boundary layer pump and a microfluidic disk, which were integrated into the “Alien Carousel”. The system’s ability to fill and expel liquid from the chamber was confirmed by testing the conical boundary layer pump and the disk as a single unit connected to the shaft of a brushless DC motor, which was controlled and encoded to ensure accurate understanding of flow dynamics and rotational speed.
For the test, we chose a cone angle of 50
Additionally, although the cone successfully supplied liquid to the microfluidic disk, splashing was observed around it. This splashing could pose a risk to the system’s internal components, suggesting that further refinement of the cone’s design is needed to prevent potential damage to the system.
3.2.2 Microscope field tests
Further tests were performed using the holographic microscope on a field-collected sample of creek water. This sample was taken from the Buitenwatersloot Canal in Delft, the Netherlands. The DHM revealed microorganisms such as Ciliophora Paramecium and Volvox, which on average have a size of 174.6 µm (Krenek et al., 2015) and and size range between 50 and 150 µm (El-Bawab, 2020) respectively. The system’s ability to adjust the focus across different depths in the fluid allowed for detailed imaging of these microorganisms at various focal planes. Figure 12 shows such a reconstruction at a depth of 8.45 mm from the detector plane.
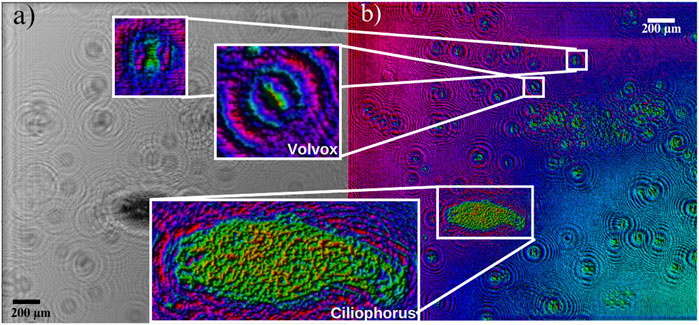
Figure 12. Original and reconstructed freshwater sample collected in the Buitenwatersloot Canal in Delft, the Netherlands: (a) Original unfocused hologram. (b) Reconstructed and focused image, numerically reconstructed at 8.45 mm from the detector plane. Coloration indicates intensity.
Additionally, our software’s ability to perform blob analysis was tested, employing computer vision by OpenCV to identify and count particulate matter based on size and contrast. The analysis demonstrated potential for counting and categorizing cells or particles without manual intervention, although further calibration is required to confirm the accuracy of these measurements. The motility of the specimens, which refers to their ability to move independently using metabolic energy, was studied using a Kalman filter tracking algorithm provided by TrackMate (Ershov et al., 2022). This algorithm tracks the movement of the specimens over time, allowing for detailed analysis of their trajectories and behaviors. See Figure 13 for the blob analysis and organism trajectory tracking overlaid on top of a cropped region of Figure 12. This field-collected sample confirms the functionality of the DHM system, achieving the primary objective of imaging microorganisms.
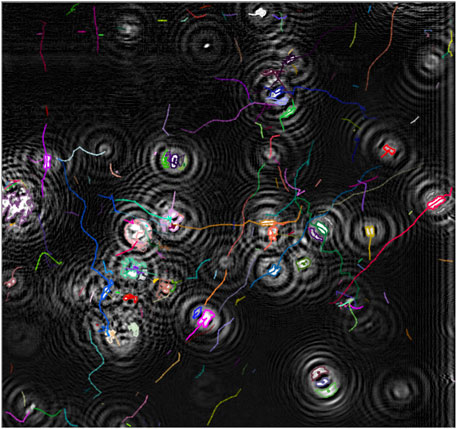
Figure 13. Blob analysis of the creek sample, able to distinguish circular blobs and count them based on contrast and circularity. The path tracking over time was performed using a Kalman filter tracking algorithm provided by TrackMate (Ershov et al., 2022), which was used to study the motility of the specimens, defined as their ability to move independently using metabolic energy.
4 Discussion
4.1 Key findings and context
The prototype has demonstrated the feasibility of a simplified mechanical design using a single rotary actuator. The system effectively samples and controls liquid in an environment suitable for digital holographic microscopy. It shows the potential to operate on different types of ice, from amorphous to crystalline. While this study did not test the system across varied ice sources, it assumed that a circular ring surrounding the conical inlet shroud would supply liquid water. Future studies should investigate this aspect in detail.
Maintaining liquid water on Enceladus is a significant challenge due to its low pressures and temperatures. Water is likely to transition directly from ice to gas upon heating. Maintaining liquid water requires precise temperature and pressure control within the test chamber. Our proposed solution involves either pressurizing the system with an inert gas or heating it to sublimate ice at the sample interface. The gas that originates from the sublimated ice can then facilitate the pressure necessary to maintain a liquid state. Future work should explore whether this is a viable solution.
The system’s modularity has been successfully demonstrated. This initial proof of concept is rather large at 18 by 25 cm, but has the potential to be scaled down in future iterations. Using advanced fabrication methods such as lithography to create smaller liquid channels can allow for further miniaturization. Precision control was achieved using a brushless DC motor with a field-oriented control algorithm and a 12-bit magnetic encoder, allowing for angular positioning accuracy up to 0.087
4.2 Conclusion
This work has resulted in the creation of the “Alien Carousel”, a pioneering sampling system designed to test for life on Enceladus. The development and validation of this prototype system have demonstrated the feasibility of using a single rotary actuator for ice sampling and preparing samples for microscopic observation. The design simplifies mechanical complexity, making it suitable for the harsh conditions of Enceladus.
Field tests confirmed the functionality of the digital holographic microscopy system, achieving the primary objective of imaging and tracking microorganisms and their motility. The integration of a boundary layer pump and microfluidic disk into a single system has proven effective, though further refinements are necessary to address identified challenges.
Future iterations of this system will benefit from continued development and testing, focusing on adapting the technology for broader scientific applications and achieving the required technology readiness level for space missions.
4.3 Recommendations
Developing an adequate heating mechanism is essential to create and maintain the liquid state of water on Enceladus. This aspect was not addressed during this study and should be a priority in future research. The ice-to-gas transition must be tested in a vacuum chamber to ensure the system can handle this process and maintain liquid water for analysis. Design modifications are necessary to incorporate a secondary outlet that facilitates the return of liquid samples to the icy surface.
Miniaturization is an objective, though not the most important for the earliest following iterations. Using advanced fabrication methods, such as lithography, we can further miniaturize the system. This will improve liquid control and reduce bulk.
Testing the system in icy environments on Earth is necessary. This will verify the system’s capabilities, robustness, and modularity in conditions similar to those on Enceladus. It ensures the system can operate effectively in harsh environments. Lastly, future studies should focus on testing the system with different types of ice.
Data availability statement
The datasets presented in this study can be found in online repositories. The names of the repository/repositories and accession number(s) can be found below: https://github.com/MarnixMeersman/Hologram_Reconstructor.
Ethics statement
The manuscript presents research on animals that do not require ethical approval for their study.
Author contributions
MM: Validation, Methodology, Data curation, Visualization, Supervision, Project administration, Conceptualization, Investigation, Software, Resources, Writing – review and editing, Formal Analysis, Writing – original draft. SC: Writing – review and editing, Writing – original draft. JJ: Writing – original draft, Writing – review and editing.
Funding
The author(s) declare that no financial support was received for the research and/or publication of this article.
Conflict of interest
The authors declare that the research was conducted in the absence of any commercial or financial relationships that could be construed as a potential conflict of interest.
Generative AI statement
The author(s) declare that no Generative AI was used in the creation of this manuscript.
Any alternative text (alt text) provided alongside figures in this article has been generated by Frontiers with the support of artificial intelligence and reasonable efforts have been made to ensure accuracy, including review by the authors wherever possible. If you identify any issues, please contact us.
Publisher’s note
All claims expressed in this article are solely those of the authors and do not necessarily represent those of their affiliated organizations, or those of the publisher, the editors and the reviewers. Any product that may be evaluated in this article, or claim that may be made by its manufacturer, is not guaranteed or endorsed by the publisher.
Supplementary material
The Supplementary Material for this article can be found online at: https://www.frontiersin.org/articles/10.3389/fspas.2025.1635332/full#supplementary-material
References
Amann, S., Witzleben, M. v., and Breuer, S. (2019). 3d-printable portable open-source platform for low-cost lens-less holographic cellular imaging. Sci. Rep. 9 (1), 11260. doi:10.1038/s41598-019-47689-1
Bartels, P. J., Nelson, D. R., and Exline, R. P. (2011). Allometry and the removal of body size effects in the morphometric analysis of tardigrades. J. Zoological Syst. Evol. Res. 49, 17–25. doi:10.1111/j.1439-0469.2010.00593.x
Bedrossian, M., Lindensmith, C., and Nadeau, J. L. (2017). Digital holographic microscopy, a method for detection of microorganisms in plume samples from enceladus and other icy worlds. Astrobiology 17 (9), 913–925. doi:10.1089/ast.2016.1616
Bochdansky, A. B., Jericho, M. H., and Herndl, G. J. (2013). Development and deployment of a point-source digital inline holographic microscope for the study of plankton and particles to a depth of 6000 m. Limnol. Oceanogr. Methods 11 (1), 28–40. doi:10.4319/lom.2013.11.28
Brown, R. H., Clark, R. N., Buratti, B. J., Cruikshank, D. P., Barnes, J. W., Mastrapa, R. M. E., et al. (2006). Composition and physical properties of enceladus’ surface. Science 311 (5766), 1425–1428. doi:10.1126/science.1121031
Cable, M. L., Porco, C., Glein, C. R., German, C. R., MacKenzie, S. M., Neveu, M., et al. (2021). The science case for a return to enceladus. Planet. Sci. J. 2 (4), 132. doi:10.3847/psj/abfb7a
Cho, H., Kim, H.-Y., Kang, J. Y., and Kim, T. S. (2007). How the capillary burst microvalve works. J. Colloid Interface Sci. 306 (2), 379–385. doi:10.1016/j.jcis.2006.10.077
Conte, F., Germani, A., and Iannello, G. (2013). A kalman filter approach for denoising and deblurring 3-d microscopy images. IEEE Trans. Image Process. 22 (12), 5306–5321. doi:10.1109/tip.2013.2284873
F. El-Bawab (2020). “Chapter 3 - phylum protozoa,” Invertebrate embryology and reproduction (Academic Press), 68–102.
Ershov, D., Phan, M., Pylväinäinen, J., Rigaud, S., Le Blanc, L., Charles-Orszag, A., et al. (2022). Trackmate 7: integrating state-of-the-art segmentation algorithms into tracking pipelines. Nat. Methods 19, 829–832. doi:10.1038/s41592-022-01507-1
Fanous, M. J., and Popescu, G. (2022). Ganscan: continuous scanning microscopy using deep learning deblurring. Light Sci. & Appl. 11 (1), 265. doi:10.1038/s41377-022-00952-z
Foissner, W., Chao, A., and Katz, L. A. (2009). Diversity and geographic distribution of ciliates (protista: ciliophora). Springer.
Galindo, Y., Reyes-Nava, J. A., Hernández, Y., Ibáñez, G., Moreira-Acosta, J., and Beltrán, A. (2021). Effect of disc spacing and pressure flow on a modifiable tesla turbine: experimental and numerical analysis. Appl. Therm. Eng. 192, 116792. doi:10.1016/j.applthermaleng.2021.116792
Goguen, J., Buratti, B., Brown, R., and Icarus, R. C. (2013). “The temperature and width of an active fissure on enceladus measured with cassini VIMS during the 14 April 2012 south pole flyover,”. Elsevier. doi:10.1016/j.icarus.2013.07.012
Helfenstein, P., and Porco, C. C. (2015). Enceladus’geysers: relation to geological features. Astronomical J. 150 (3), 96. doi:10.1088/0004-6256/150/3/96
Ingersoll, A. P., and Nakajima, M. (2016). Controlled boiling on enceladus. 2. model of the liquid-filled cracks. Icarus 272, 319–326. doi:10.1016/j.icarus.2015.12.040
Kite, E. S., and Rubin, A. M. (2016). Sustained eruptions on enceladus explained by turbulent dissipation in tiger stripes. Proc. Natl. Acad. Sci. U. S. A. 113 (15), 3972–3975.
Konijnenberg, S., Adam, A. J., and Urbach, H. P. (2024). BSc optics: 2nd editionDelft, The Netherlands: Delft University of Technology, Faculty of Applied Sciences. doi:10.59490/tb.91
Krenek, S., Berendonk, T. U., and Fokin, S. I. (2015). New paramecium (ciliophora, oligohymenophorea) congeners shape our view on its biodiversity. Org. Divers. & Evol. 15, 215–233. doi:10.1007/s13127-015-0207-9
Lindensmith, C. A., Rider, S., Bedrossian, M., Wallace, J. K., Serabyn, E., Showalter, G. M., et al. (2016). A submersible, off-axis holographic microscope for detection of microbial motility and morphology in aqueous and icy environments. PloS one 11 (1), e0147700. doi:10.1371/journal.pone.0147700
Martin, E. S., Whitten, J. L., Kattenhorn, S. A., Collins, G. C., Southworth, B. S., Wiser, L. S., et al. (2023). Measurements of regolith thicknesses on enceladus: uncovering the record of plume activity. Icarus 392, 115369. doi:10.1016/j.icarus.2022.115369
Martins, Z. (2025). “Report of the expert committee for the large-class mission in esa’s voyage 2050 plan covering the science theme ”moons of the giant planets. European Space Agency. ESA Science Office Report, 2024, copyright ESA/Science Office.
McKay, C. P., Porco, C. C., Altheide, T., Davis, W. L., and Kral, T. A. (2008). The possible origin and persistence of life on enceladus and detection of biomarkers in the plume. Astrobiology 8 (5), 909–919. doi:10.1089/ast.2008.0265
Meersman, M. F. L. (2024). Hologram reconstructor. Available online at: https://github.com/MarnixMeersman/Hologram_Reconstructor.
Moeller, T. M., Montgomery Smith, L., Collins, F. G., Labello, J. M., Rogers, J. P., Lowry, H. S., et al. (2012). Measurement of the accumulation of water ice on optical components in cryogenic vacuum environments. Opt. Eng. 51 (11), 115601. doi:10.1117/1.oe.51.11.115601
Nadeau, J. L., Bedrossian, M., and Lindensmith, C. A. (2018). Imaging technologies and strategies for detection of extant extraterrestrial microorganisms. Adv. Phys. X 3 (1), 1424032. doi:10.1080/23746149.2018.1424032
NASA Office of Inspector General (2023). “Audit of NASA’s deep space network,” NASA office of inspector general, Washington, D.C. Available online at: https://oig.nasa.gov/reports/audit-reports.html.
Ono, M., Masahiro, , Mitchel, , Karl, , Parness, , Aaron, , et al. (2018). “Enceladus vent explorer concept,” in Outer solar system: prospective energy and material resources, 665–717.
Parkinson, C. D., Liang, M.-C., Yung, Y. L., and Kirschivnk, J. L. (2008). Habitability of enceladus: planetary conditions for life. Orig. Life Evol. Biospheres 38, 355–369. doi:10.1007/s11084-008-9135-4
Peshin, S., Madou, M., and Kulinsky, L. (2022). Microvalves for applications in centrifugal microfluidics. Sensors 22 (22), 8955. doi:10.3390/s22228955
Porco, C. C., Helfenstein, P., Thomas, P. C., Ingersoll, A. P., Wisdom, J., West, R., et al. (2006). Cassini observes the active south pole of enceladus. science 311 (5766), 1393–1401. doi:10.1126/science.1123013
Postberg, F., Kempf, S., Schmidt, J., Brilliantov, N., Beinsen, A., Abel, B., et al. (2009). Sodium salts in E-ring ice grains from an ocean below the surface of enceladus. Nat. Com. 459, 1098–1101. doi:10.1038/nature08046
Postberg, F., Khawaja, N., Abel, B., Choblet, G., Glein, C. R., Gudipati, M. S., et al. (2018). Macromolecular organic compounds from the depths of enceladus. Nature 558 (7711), 564–568. doi:10.1038/s41586-018-0246-4
Qi, W., Deng, Q., Jiang, Y., Yuan, Q., and Feng, Z. (2018). Disc thickness and spacing distance impacts on flow characteristics of multichannel tesla turbines. Energies 12 (1), 44. doi:10.3390/en12010044
Seasly, E., Benardini, J., Spry, J. A., Baker, A., Lalime, E., Pratt, L., et al. (2025). Nasa’s revised planetary protection policy and implementation in COSPAR 2022 44th general assembly (Athens, Greece: National Aeronautics and Space Administration NASA). Available online at: https://www.cosparathens2022.org/.
Sengupta, S., and Guha, A. (2012). A theory of tesla disc turbines. Proc. Institution Mech. Eng. Part A J. Power Energy 226 (5), 650–663. doi:10.1177/0957650912446402
Serabyn, E., Liewer, K., Lindensmith, C., Wallace, K., and Nadeau, J. (2016). Compact, lensless digital holographic microscope for remote microbiology. Opt. express 24 (25), 28540–28548. doi:10.1364/oe.24.028540
Serabyn, E., Liewer, K., and Wallace, J. (2018). Resolution optimization of an off-axis lensless digital holographic microscope. Appl. Opt. 57 (1), A172–A180. doi:10.1364/ao.57.00a172
Sims, M. R., Cullen, D. C., Rix, C. S., Buckley, A., Derveni, M., Evans, D., et al. (2012). Development status of the life marker chip instrument for ExoMars. Planet. Space Sci. 72 (1), 129–137. doi:10.1016/j.pss.2012.04.007
Spencer, J. R., Pearl, J. C., Segura, M., Flasar, F. M., Mamoutkine, A., Romani, P., et al. (2006). Cassini encounters enceladus: background and the discovery of a south polar hot spot. Science 311, 1401–1405. doi:10.1126/science.1121661
Spencer, J. R., John, R., Barr, , Amy, C., Esposito, , Larry, W., et al. (2009). Enceladus: an active cryovolcanic satellite. Springer, 683–724.
Tang, M., Wang, G., Kong, S.-K., and Ho, H.-P. (2016). A review of biomedical centrifugal microfluidic platforms. Micromachines 7 (2), 26. doi:10.3390/mi7020026
Waite, J. H., Lewis, W. S., Magee, B. A., Lunine, J. I., McKinnon, W. B., Glein, C. R., et al. (2009). Liquid water on enceladus from observations of ammonia and 40ar in the plume. Nature 460 (7254), 487–490. doi:10.1038/nature08153
Whitten, J. L., and Martin, E. S. (2019). Icelandic pit chains as planetary analogs: using morphologic measurements of pit chains to determine regolith thickness. J. Geophys. Res. Planets 124 (11), 2983–2999. doi:10.1029/2019je006099
Wronkiewicz, M., Lee, J., Mandrake, L., Lightholder, J., Doran, G., Mauceri, S., et al. (2024). Onboard science instrument autonomy for the detection of microscopy biosignatures on the ocean worlds life surveyor. Planet. Sci. J. 5 (1), 19. doi:10.3847/psj/ad0227
Keywords: digital holography, enceladus, extraterrestrial life, robotic sampling, saturn, astrobiology, microfluidics, life detection
Citation: Meersman MFL, Cazaux SM and Jovanova J (2025) Alien Carousel: In Situ life detection on icy moons with a single-actuator holographic microfluidic platform. Front. Astron. Space Sci. 12:1635332. doi: 10.3389/fspas.2025.1635332
Received: 26 May 2025; Accepted: 02 September 2025;
Published: 22 September 2025.
Edited by:
Christoph Waldmann, Technical University of Applied Sciences Luebeck, GermanyReviewed by:
Svetlana Poddubko, Russian Academy of Sciences (RAS), RussiaLutz Richter, SoftServe Inc, United States
Copyright © 2025 Meersman, Cazaux and Jovanova. This is an open-access article distributed under the terms of the Creative Commons Attribution License (CC BY). The use, distribution or reproduction in other forums is permitted, provided the original author(s) and the copyright owner(s) are credited and that the original publication in this journal is cited, in accordance with accepted academic practice. No use, distribution or reproduction is permitted which does not comply with these terms.
*Correspondence: S. M. Cazaux, cy5tLmNhemF1eEB0dWRlbGZ0Lm5s; J. Jovanova, ai5qb3Zhbm92YUB0dWRlbGZ0Lm5s
†ORCID: Meersman M. F. L., orcid.org/0009-0000-7286-0964; CazauxS. M.,orcid.org/0000-0003-0320-3578; Jovanova J., orcid.org/0000-0001-8347-6386