 Chigomezyo M. Ngwira1,2*
 Yukitoshi Nishimura3
 James M. Weygand4
 Lois J. Landwer5,6Daniel C. Bush7
 John C. Foster8
 Philip J. Erickson8
- 1Space Weather Laboratory, NASA Goddard Space Flight Center, Greenbelt, MD, United States
- 2Department of Physics, The Catholic University of America, Washington, DC, United States
- 3Department of Electrical and Computer Engineering and Center for Space Physics, Boston University, Boston, MA, United States
- 4Department of Earth, Planetary, and Space Sciences, University of California Los Angeles, CA, United States
- 5Cooperative Institute for Research in Environmental Sciences, University of Colorado, Boulder, CO, United States
- 6National Oceanic and Atmospheric Administration Space Weather Prediction Center, Boulder, CO, United States
- 7Missouri Skies Observatory, Albany, MO, United States
- 8Haystack Observatory, Massachusetts Institute of Technology, Westford, MA, United States
On 10 May 2024, a series of coronal mass ejections were detected at Earth followed by one of the most powerful geomagnetic storms since November 2003. Leveraging a multi–technique approach, this paper provides an account of the ground geomagnetic response during the 10–11 May 2024 extreme geomagnetic storm. More specifically, we show that at the mid-latitudes in the American sector, the storm produced extreme ground geomagnetic field perturbations between 01:50 UT and 02:30 UT on 11 May. Then using the Spherical Elementary Current System method, it is shown that the perturbations were associated with an intense westward propagating auroral westward electrojet current. Finally, with the aid of auroral all-sky images from the Missouri Skies Observatory, we demonstrate that an intense isolated substorm event with onset located between the Great Lakes region and the East Coast United States was the main source of the extreme westward electrojet current and the geomagnetic field perturbations at these typical mid-latitude locations. This study emphasizes the increased risk associated with expansion of the auroral oval into the mid-latitudes during extreme geomagnetic activity.
1 Introduction
Space weather is the leading cause of geomagnetic disturbances (GMDs) produced in the near–Earth geomagnetic environment. Large variations in the geomagnetic field created during major GMDs induce electric fields on the surface of the Earth that then elevate the levels of geomagnetically induced currents (GICs) in grounded infrastructure such as electrical power grids, oil or gas pipelines, and navigation and communication systems (Pirjola, 2000; Pulkkinen et al., 2017). This is of critical concern especially during extreme geomagnetic storm events. For instance, GICs have been known to cause blackouts due to failure of electrical power systems (Wik et al., 2009; Boteler, 2019) and to cause damage to equipment, such as high-voltage transformers, in a waste case scenario (North American Electric Reliability Corporation, 1989; Gaunt and Coetzee, 2007).
Extreme GMDs are rare yet can have a detrimental impact on human–made technology. The limited number of extreme events available for study is a major challenge to understanding the solar wind-magnetosphere-ionosphere coupling dynamics under extreme driving conditions. This is because improving our knowledge of the Earth’s geomagnetic environment is key to mitigating the impact of space weather on technology. Due to this growing concern of the potential GIC impact on ground-based technologies, there has been an increasing number of studies to understand the GIC characteristics, the drivers, and the impact on systems (Pulkkinen et al., 2012; Ngwira et al., 2013, 2015; Pulkkinen et al., 2017; Wei et al., 2021; Zou et al., 2022; Weygand et al., 2023; Engebretson et al., 2024; Waghule et al., 2024; Opgenoorth et al., 2024; Ngwira et al., 2025).
Wei et al. (2021) used a multipoint technique that combined space-borne observations with ground geomagnetic field recordings to investigate the characteristic response of the magnetosphere-ionosphere and ground system during the 7 January 2015 storm. Based on the observations, they proposed that localized substorm currents that mapped to conjugate regions of intense geomagnetic field variations, dB/dt, on the ground were driven by multiple bursty bulk flows (BBFs) in the inner magnetosphere. This is consistent with other recent studies showing that BBF-related substorms can produce intense localized geomagnetic perturbations (Sorathia et al., 2023; Waghule et al., 2024; Engebretson et al., 2024; Ngwira et al., 2025). More recently, Milan et al. (2024) linked multiple intensifications convection states to the occurrence of intense dB/dt (“spikes”) on the dawnside. The results from Milan et al. (2024) are similar to the work of Sorathia et al. (2023) that related BBFs to the dawnside current wedge (DCW) that is easily distinguishable from the typical substorm current wedge (SCW). Formation of the DCW is linked to the dawn-dusk ring current asymmetry during storms. Clearly, different current systems are attributed to the development of intense GICs during distinct geomagnetic activity at specific local times. Within the auroral zone, intense GICs are commonly associated with auroral features, such as the poleward boundary intensifications, poleward expanding auroral bulges, auroral streamers, omega bands, and pulsating auroras (Ngwira et al., 2018; Zou et al., 2022; Milan et al., 2023; Sorathia et al., 2023).
More recently, Opgenoorth et al. (2024) conducted a comprehensive review of the near-earth geomagnetic environment that highlights the progress and gaps in understanding, prediction, and impacts of GICs with a focus on enhancing understanding of the GMD characteristics vital for GICs, the production of earth conductivity models, the determination of geoelectric fields, and the modeling of GICs in different systems. That report demonstrates that enormous progress has been achieved over the last two decades in understanding the solar wind-magnetosphere-ionosphere dynamics and the impacts of these coupled domains on human technologies on the surface of the Earth. However, there are also many challenges that remain in our ability to more accurately quantify solar wind driving, magnetosphere-ionosphere-thermosphere (MIT) coupling, and the impacts on specific technologies. This is particularly more pronounced during extreme geomagnetic storm events.
On 10 May 2024, a series of coronal mass ejections (CMEs) were detected at Earth followed by one of the most powerful geomagnetic storms since November 2003. This storm stands as the most powerful event in the current solar cycle 25 at the time of this writing. As a result, this event has received wide attention as evidenced by the collection of reports, for example, (Gonzalez-Esparza et al., 2024; Tulasi Ram et al., 2024; Foster et al., 2024; Piersanti et al., 2025; Zhang et al., 2025; Zou et al., 2025; Hayakawa et al., 2025; Waghule and Knipp, 2025). A recent investigation by Tulasi Ram et al. (2024) shows that the dayside magnetopause was significantly compressed within the geostationary orbit at 6.6 RE for around 5.5-h, continuously driven by elevated solar wind dynamic pressure. Those authors also reveal that the geomagnetic storms was a result of two interplanetary CMEs (ICMEs) arriving at Earth separated by about 5-hours.
The present paper provides an account of the near–Earth geomagnetic environment response during recent 10–11 May 2024 extreme geomagnetic storm, hereafter referred to as the “Gannon storm”. More specifically, the study is focused on the extreme geomagnetic field variations observed in the American sector during the period between 01:50 UT and 02:30 UT on 11 May. We provide new insight on the extreme geomagnetic perturbations and the related magnetosphere-ionosphere electrodynamics. This report is organized as follows: The data and methodology are outlined in Section 2, while in Section 3 we describe the solar drivers and magnetosphere response. The key observations and interpretations are outlined in Sections 4. Finally, a summary and conclusions are presented in Section 5.
2 Data and methods
2.1 Ground magnetometers
The geomagnetic field observations presented in this study were obtained from SuperMAG, a global network comprising of around 600 ground-based magnetometers (Gjerloev, 2009). The SuperMAG data is processed using a uniform data processing technique and made available to the public. For this study, we leverage existing tools and methods, e.g. (Ngwira et al., 2023, 2025), to perform a routine quality check of the geomagnetic field measurements to ensure the extreme perturbations (“spikes”) were not due to artifacts in the data. Details of the ground magnetometer stations that have been used in this study are displayed in Table 1.
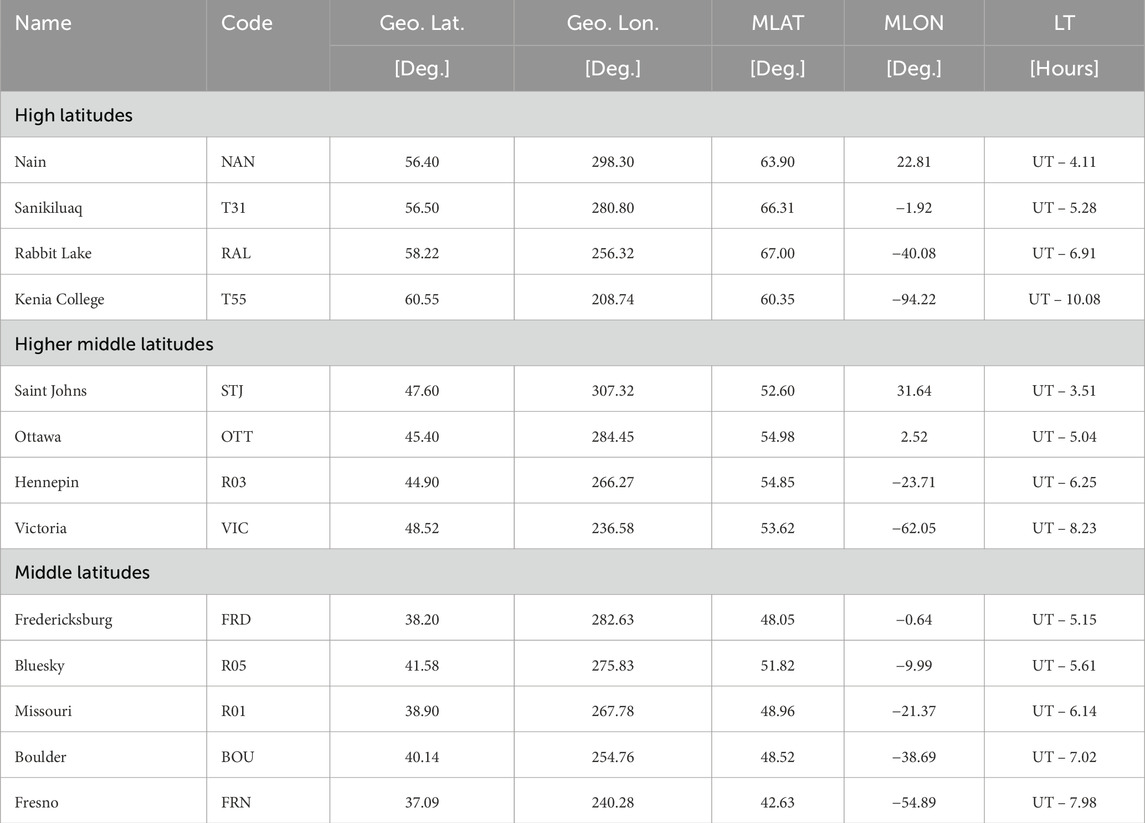
Table 1. The list of ground magnetometer sites used in the analysis presented in this paper. The AACGM coordinate system based on the IGRF 2010 model was adopted for the geomagnetic latitude and longitude. LT represents the local time at each station.
2.2 Equivalent ionospheric currents and current amplitudes
For this study, the Spherical Elementary Current System (SECS) method was adopted to compute the ionospheric currents. In the SECS technique, a two-dimensional picture of the ionospheric currents can be derived with an array of well-spaced ground magnetometers (Amm, 1997; Amm et al., 2002; Weygand et al., 2012). The method has regularly been applied to calculate the equivalent ionospheric currents (EICs), which are parallel to Earth’s surface, and the spherical elementary current (SEC) amplitudes, which are a proxy for the field-aligned-currents (FACs). In general, the EICs are calculated from a matrix inversion of the ground magnetic disturbances. One of the important features of this technique is that it requires no integration time of the magnetometer data. There are two outputs from the SECS inversion. The first output is the EICs, which are a combination of the real Hall and Pedersen currents. The temporal and spatial resolutions of the EICs are 10 s, and 6.9
In the present study, an estimate of the auroral oval equatorward boundary location is performed using the SECS technique outlined by Weygand et al. (2023). In that paper the equatorward boundary location was fitted visually by selecting points along a contour of about 0.5
2.3 Auroral all-sky images
The Missouri Skies Observatory (40.25 N, 94.32 W, www.missouriskies.org) is an amateur-run facility located within the city limits of rural Albany, Missouri. Its main instrument is a 50 cm reflector telescope. As part of citizen science activities, off-the-shelf surveillance camera equipment mounted on the observatory and other points around the property are used. The all sky cameras (ASCs) are unmodified and have settings tweaked to record, at maximum sensitivity, real-time movies of satellite phenomena, airglow, auroras, and meteors. The ASC field of view is 180°. Sometimes, the Observatory hosts live streams of important auroral events for the public interest, such as the Gannon storm. During the May 2024 great auroral event, the Observatory recorded color ASC, wide-angle color north-looking, and black and white east-looking video with an exposure time of 1-s and recording frame rate of 1/30-sec. Selected frames from the Missouri Skies ASC video showing the auroral sequence on 11 May are presented in Section 4 of this study.
3 Solar drivers and magnetospheric reaction
3.1 Solar and interplanetary conditions
In May 2024, solar cycle 25 (SC-25) hit a new high when the monthly sunspot number reached 172 beating the previous high of 160 recorded in June/July of 2023. In comparison to the previous two cycles, the maximum monthly sunspot number reported for SC-25 (217, August 2024) is about 67% higher than the 146 recorded for SC-24 in February 2014, while SC-23 had a maximum of 244 in July 2000. Interestingly, during the period 8–9 May 2024, the Sun continuously unleashed several CMEs in quick succession including Earth-directed ones. All CMEs were linked to X-class or strong M-class solar flares dominated by two powerful X-class flares with magnitude X2.25 and X1.12 (Tulasi Ram et al., 2024). Shortly there after on 10–11 May, another set of powerful X-class flares with magnitude X3.9 and X 5.8 were also launched. According to the NOAA Space Weather Prediction Center (SWPC), the solar Active Region AR3664 was the candidate for Earth-directed CMEs.
In general, the observed CMEs had average speeds ranging from 456 km/s to a maximum exceeding 2000 km/s. Given that, it is very likely that later CMEs may have caught up with preceding ones, leading to collisions or merging events (CME cannibalism). This type of interaction can amplify CME speed, plasma density, and magnetic field strength, substantially intensifying the shock strength upon reaching Earth’s magnetosphere, which can trigger G5-level GMDs. Unlike other extreme events (e.g., Halloween Storm of 2003), the Gannon Storm’s rapid sequence of CMEs led to stronger magnetospheric shocks through CME–CME interactions, thus creating a powerful, long-duration geomagnetic storm. The solar wind and the interplanetary magnetic field (IMF) conditions during the Gannon storm are presented in Figure 1. The data were obtained from the OMNIWeb service available through the NASA/GSFC Space Physics Data Facility provided by CDAWeb (https://omniweb.gsfc.nasa.gov/). The figure contains the IMF magnitude (a), the IMF-By (blue) and Bz (red) components (b), the solar wind density (c) and speed (d), and the geomagnetic field SYM-H index (e), a high-resolution equivalent of the Dst index.
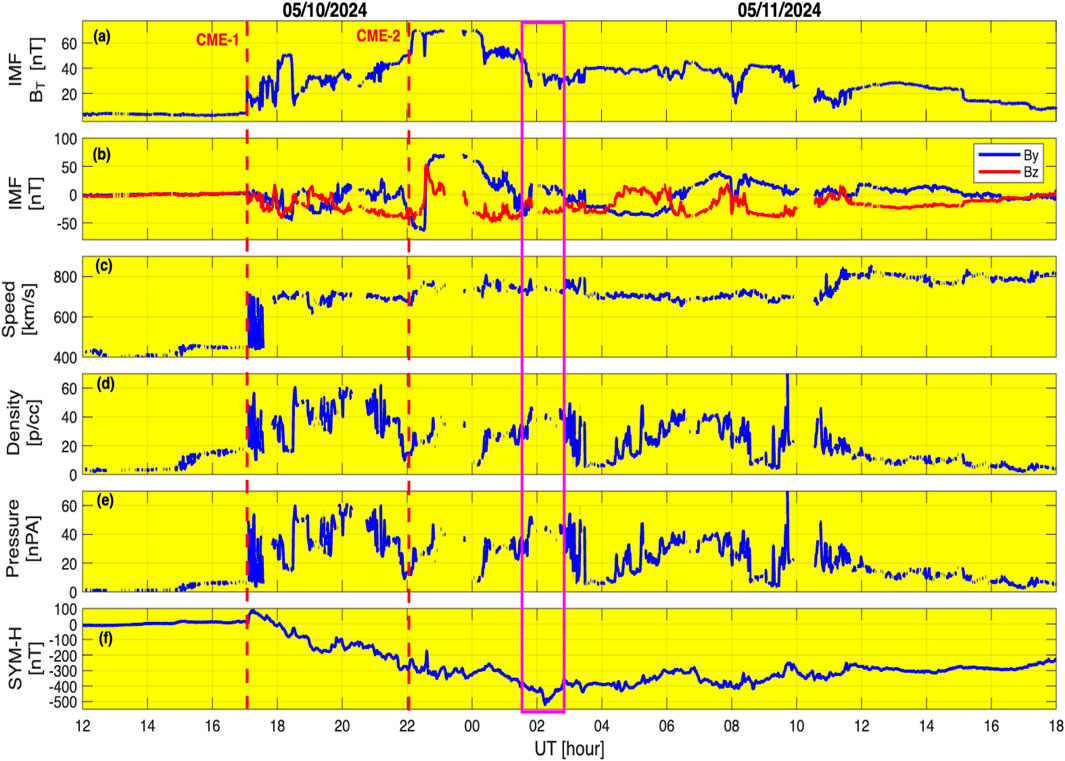
Figure 1. The OMNI solar wind and IMF conditions during the Gannon storm. Panels show: (a) IMF magnitude (|B|), (b) IMF By (blue) and Bz (red), (c) solar wind speed, (d) proton density, (e) dynamic pressure, and (f) the geomagnetic field SYM-H index. The two red dashed lines indicate the CME arrivals, while the magenta rectangle marks the period of interest in the present study.
Following the arrival of the first ICME forward shock (CME-1) around 17:05 UT on 10 May (Figure 1), the IMF magnitude (a), speed (c), the density (d), and the dynamic pressure (e), were all observed to suddenly increase, as traditionally expected for most CMEs. It must be noted that the density and speed were slightly elevated before the first CME arrival starting around 15:00 UT, which is also reflected in the SYM-H index in Figure 1f. It is not clear at present what role these elevated levels of density and speed may have played in the subsequent storm dynamics and strength. Nevertheless, this topic related to pre-conditioning of the magnetosphere will not be addressed in the present paper. A second ICME (CME-2) forward shock was detected shortly after 22:00 UT, as also indicated by the second dashed line in Figure 1. In the early phase and main phase of the storm (first 10 h), the IMF-Bz was predominately southward with a peak value around −53 nT. The high IMF-Bz levels and the sustained southward orientation is one of the reasons for the development of an extreme geomagnetic storm, as is well-known.
3.2 Magnetospheric response
On the Earth’s surface, the first CME arrival is reported to have produced an extreme sudden commencement (SSC), as recorded by ground magnetometers (Piersanti et al., 2025). A comparison of the Gannon storm features to other historical extreme events is displayed in Table 2. The SSC perturbation (
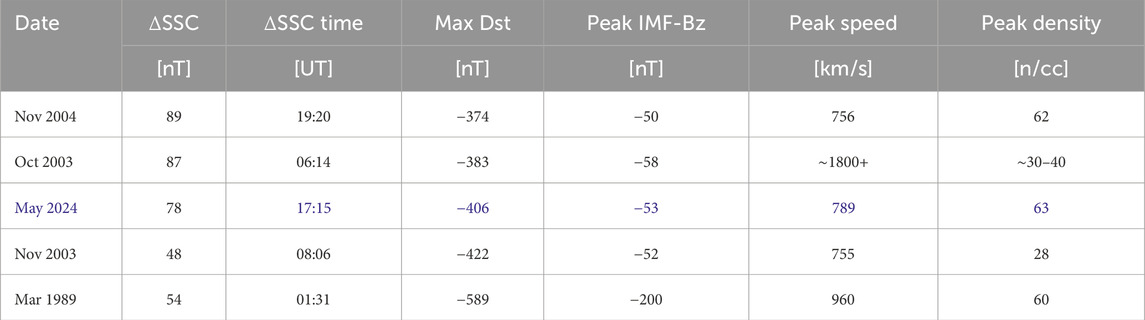
Table 2. Comparison of Gannon storm to other historical geomagnetic storms in the last 40 years. Displayed in the table are the date of storm, the SSC perturbation (
Evidently on the Dst scale, the Gannon storm is one of the most powerful geomagnetic storms of recent times ranking as the third largest storm in modern history (1985–2024) following the March 1989 and November 2003 extreme events, as illustrated in Table 2. With a recorded peak negative excursion of the Dst index at 406 nT according to World Data Center Kyoto (https://wdc.kugi.kyoto-u.ac.jp/) equivalent to the SYM-H index reaching about
4 The ground geomagnetic response
From a space weather perspective, the auroral region is well-known to produce the most dramatic geomagnetic activity during both geomagnetic storms and quiet times. This is largely attributed to the intense current systems that connect this region to the magnetosphere and solar wind domains. To investigate the auroral response during the Gannon storm, we begin by comparing this storm to other historical extreme events using the SuperMAG SML index displayed in Figure 2. The figure contains the SML values for all the five superstorms (color coded) listed in Table 2. Clearly, there are a number of extreme westward electrojet signatures with SML less than −2500 nT, a level considered to represent supersubstorms (Tsurutani et al., 2015; Hajra et al., 2016). According to earlier works, supersubstorms are considered to be distinct SML peaks separated by
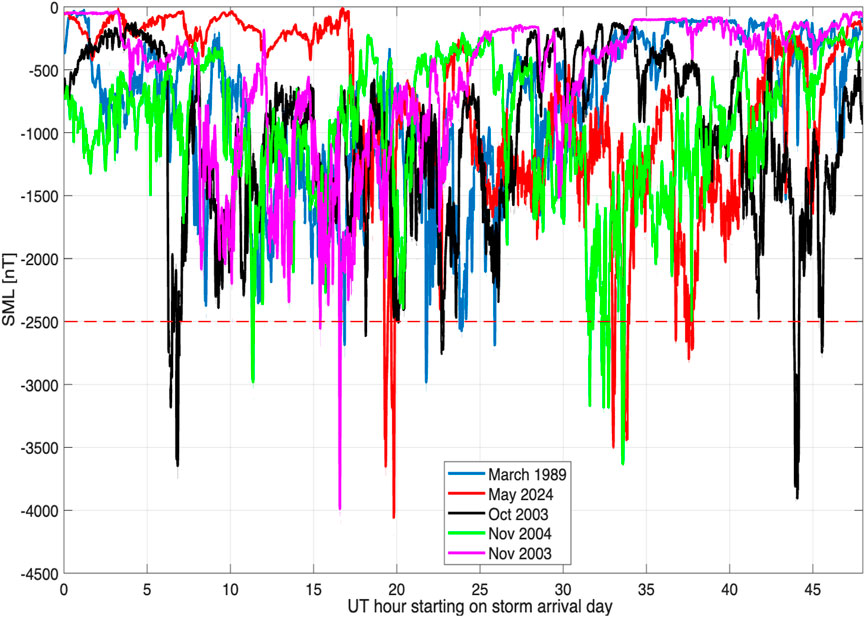
Figure 2. Comparison of the SuperMAG SML index for the superstorms listed in Table 2. Colored lines represent different storm dates: March 1989 (blue), May 2024 (red), October 2003 (black), November 2004 (green), and November 2003 (magenta). The red dotted line indicates the level considered for supersubstorm classification. The time interval shown covers a period of 2 days starting on the day of the associated CME arrived for each event, respectively.
A closer inspection of Figure 2 shows that the Gannon storm of May 2024 (red) produced significantly large geomagnetic deviations in the auroral zone comparable to other historical storms. More specifically, even though there are six times when SML was
In addition to the supersubstorm signatures emphasized above, we have also identified some unique features in the ground geomagnetic field measurements that are now presented and discussed below. In particular, two aspects are emphasized here, which include the extreme geomagnetic field variations observed in the North American sector following an isolated substorm event and the related auroral electrodynamics.
4.1 Extreme mid-latitude geomagnetic perturbations
Here, we focus on the less intense substorm event deep in the main phase of the storm on 11 May. An account by Foster et al. (2024) estimates the onset of this substorm to be between 02:00–02:02 UT (
Figure 3 shows a series of ASI images from the Missouri Skies Observatory (40.25N, 94.32W) taken on 11 May 2024. As seen in Figure 3, before 02:00 UT, the images do not show any auroral activity, but red aurora suddenly appears to the north around 02:05 UT. The red aurora is then observed to extend southwestward with time, as revealed in Figure 3. The western edge of the red aurora is the front of the substorm westward expansion, and it includes an auroral streamer. In a recent report, Foster et al. (2024) investigated the changes in ionospheric total electron content (TEC) triggered by the storm-induced energetic particle precipitation during the Gannon storm. They provide a detailed account of the intense auroral breakup and westward surge occurring at the peak of that storm. Foster et al. (2024) also showed that sudden bursts of significantly elevated vTEC were related to the intense red aurora located on the leading edge of the equatorward and westward TEC enhancement. They attributed this TEC increase to extremely low-energy precipitation following the rapid substorm breakup.
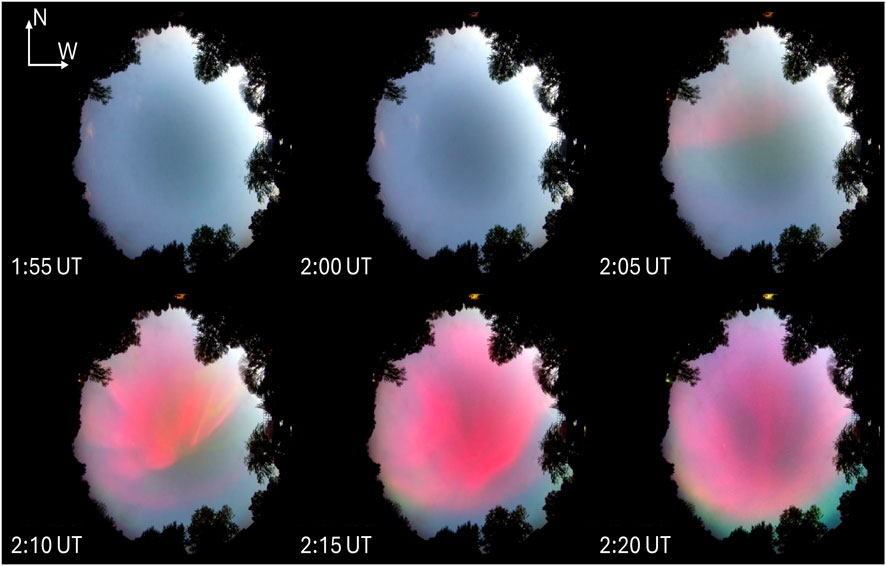
Figure 3. Sky view of selected composite images captured at the Missouri Skies Observatory on 11 May 2024. The images display evidence of red aurora moving over the ground location. Note that North is to the top and west is to the right, as indicated by the arrows in the top left corner of the images.
In Figure 4 we examine the horizontal geomagnetic field observations on the surface of the Earth. Exhibited in this figure are the geomagnetic field
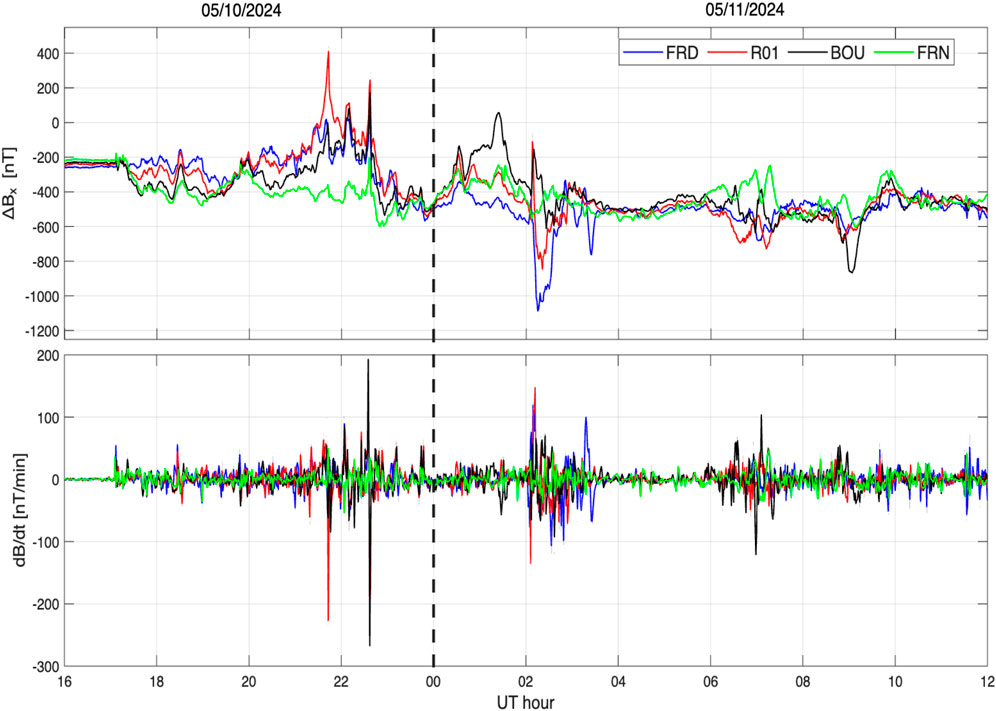
Figure 4. Top: The horizontal geomagnetic field
What is more captivating about this event in Figure 4 is the level of perturbation observed at these mid-latitude locations. Firstly, before the negative excursion, there was a sharp increase of
Notably, the storm’s impact on the
In contrast to the mid-latitudes (Figure 4), the geomagnetic field characteristics at high-latitudes and the higher mid-latitudes are presented in Figure 5. Firstly, the geomagnetic response at the high-latitudes and the higher mid-latitudes are vastly different. For instance, we clearly see large perturbations at higher mid-latitudes around 02:00 UT on 11 May, whereas some high-latitude stations only show perturbations at 30-min before 02:00 UT. As well, the signature of the supersubstorm on 10 May is more visible at high-latitudes than the mid-latitudes. However, the most notable differences are observed during the recovery phase when significantly large perturbations are captured over the high-latitudes. These perturbations are accompanied by equally large fluctuations in the field,
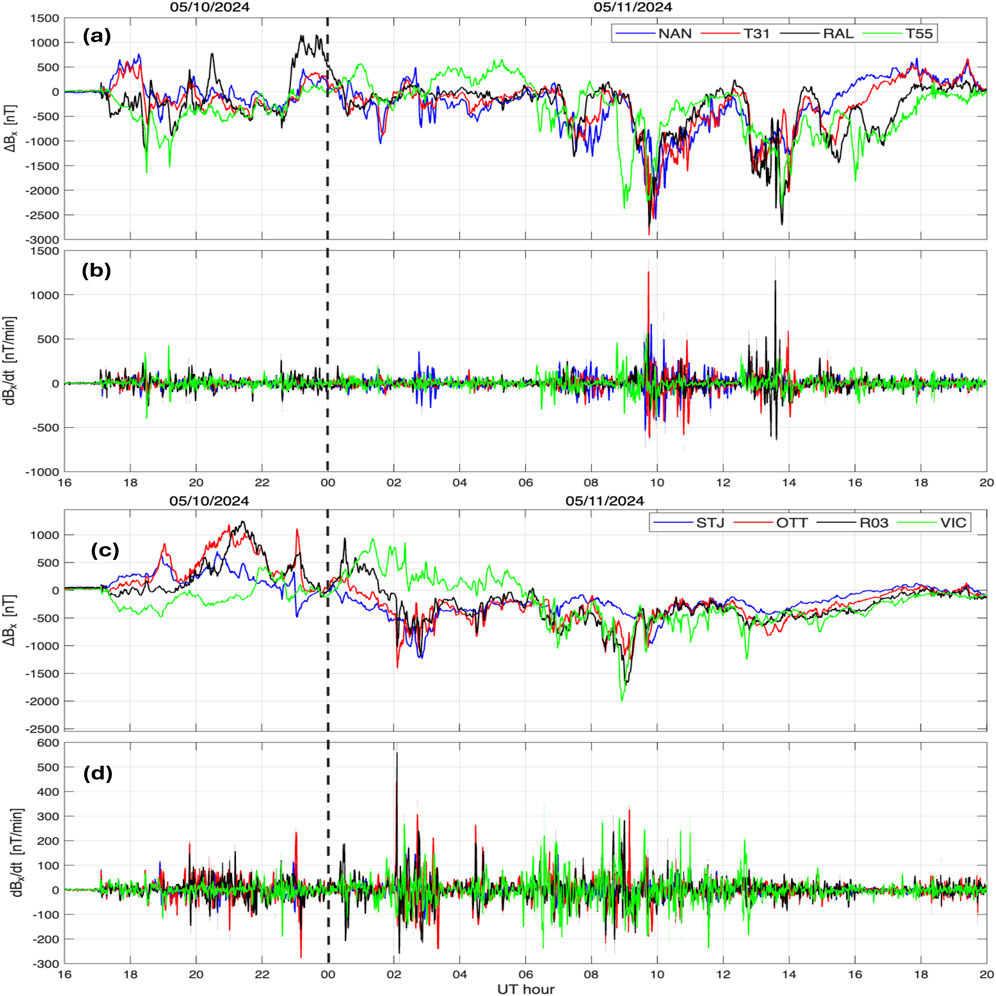
Figure 5. The horizontal geomagnetic field
4.2 Auroral currents and dynamics
Turning our attention to the auroral currents and the boundary dynamics, we utilize the EIC and current amplitude maps derived from the SECS technique outlined earlier. Figure 6 shows a series of SECS maps for this event in the interval between 01:55 UT to 02:15 UT on 11 May. As noted before and seen in Figure 2, this interval does not contain any supersubstorms, however, the isolated intense substorm event during the said period caused extreme geomagnetic field deviations at mid-latitudes in the American Sector, as discussed previously.
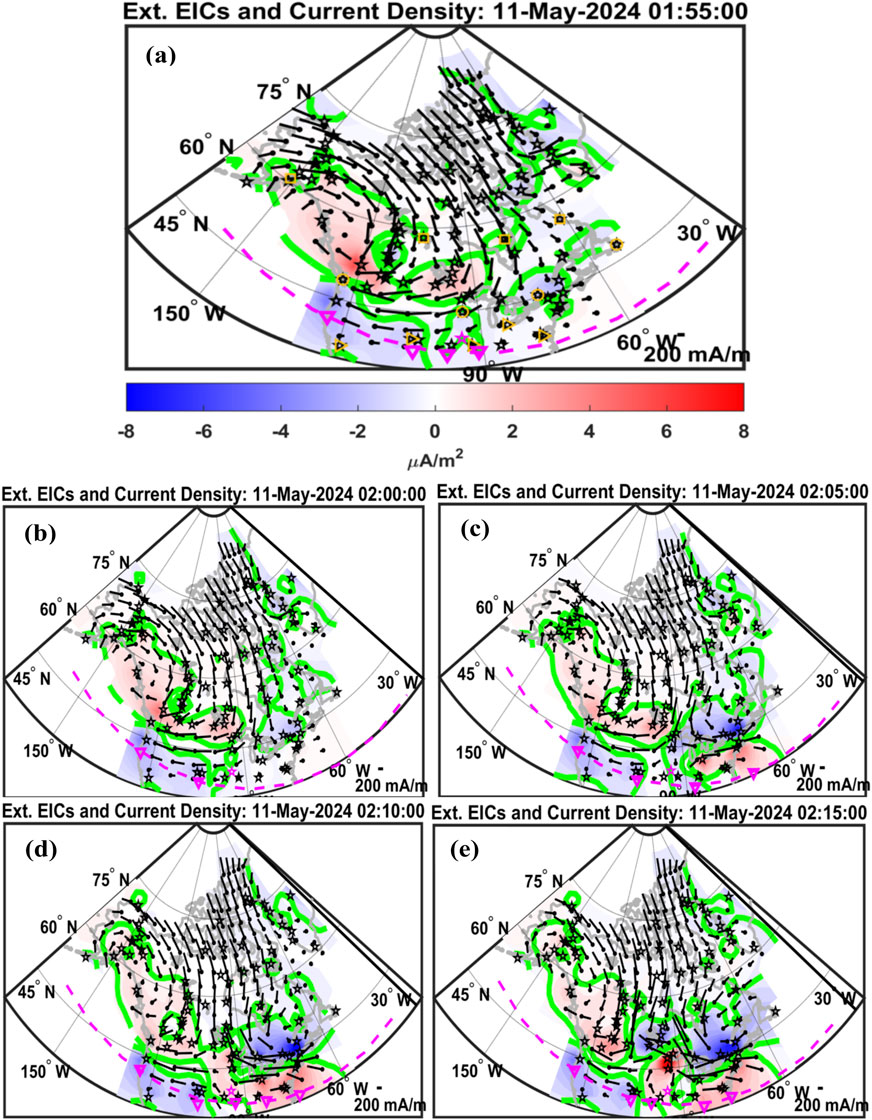
Figure 6. SECS maps of horizontal equivalent currents (black vectors without arrow heads originating at grid points denoted by black dots) and vertical current amplitudes (with intensity and sign given in the color bar at the bottom). The panels (a–e) are SECS maps starting at 01:55 UT to 02:15 UT on 11 May, 2024. In the top panel (a), the orange squares mark the high-Latitudes, orange circles higher mid-latitudes, and the orange triangles mark the mid-latitudes. Missouri Skies observatory is marked with a mauve star. The dashed mauve curve is the estimated equatorward boundary location. The green curves show boundaries of the upward and downward currents, while the black solid line denotes geographic midnight. The geographic coordinate system is used.
Thorough examination of Figure 6 shows that before 02:00 UT the EIC was weak (small arrows) over most of the Continental United States, except to the North Western region, while a clear two cell convention pattern existed to the north in Canada and the Arctic region. The top panel (a) shows orange squares for the high-Latitudes, orange circles for higher mid-latitudes, and orange triangles marking mid-latitudes. The Missouri Skies observatory is represented by a mauve star. At 02:05 UT, a sudden westward intensification of the EIC is observed around the East Coast and Great Lakes region. The intensified current then propagates westward with time. This is consistent with the geomagnetic recordings in Figure 4 showing the
Furthermore, a careful look at the EIC currents in Figure 6 indicates that the strongest geomagnetic perturbations are in the region between the upward (red) and downward (blue) current systems. According to literature, this is the region with the most intense auroral currents, as discussed in previous reports (Ngwira et al., 2018, 2023; Engebretson et al., 2024). Another interesting features is the formation of the Harang (red) upward current system between 02:00 UT to 02:10 UT on 11 May. The Harang reversal (HR), sometimes known as the Harang discontinuity, is a longitudinally extended ionospheric signature near midnight where electric fields and plasma flows reverse direction from westward to eastward with decreasing latitude (Harang, 1946; Erickson et al., 1991). It is well understood that the HR poleward extension maps to the plasmasheet, while its equatorward extension maps close to the inner edge of the plasmasheet (Erickson et al., 1991). In the magnetic midnight sector where the HR region maps to the magnetotail, the reversal is viewed as a fault line isolating the inflated and collapsed magnetic fields during substorms (Maynard, 1974), whereas some studies suggest that substorm injection occurs in the vicinity of the HR (Weygand et al., 2008; Despirak et al., 2022).
In a study on the coupling between the HR evolution and substorm dynamics using a combination of SuperDARN, DMSP, and IMAGE observations, Zou et al. (2009) found that the substorm auroral onset appeared quite near the center of the HR flow shear, which they considered to be related to the development of the substorm upward FACs. The location and characteristics of the HR are controlled by the IMF orientation, including the IMF clock angle. Fundamentally, the IMF clock angle, specifically the IMF-By, can determine the dynamics and properties of the HR by modulating the ionospheric convection pattern, magnetotail configuration, and AEJ strength and distribution (Anderson et al., 2008; Grocott et al., 2010). Therefore, the HR appearance reflects enhanced magnetospheric plasma convection in the magnetotail that involves an upward flowing FACs from the ionosphere due to diamagnetic ion drift. Its latitudinal location is associated with the strength of geomagnetic activity, often propagating equatorward as the intensity of activity increases, as established in Figure 6. Whereas the southward IMF-Bz is considered a primary condition for the development of GMDs, IMF-By also plays a major role, particularly it strongly influences the dawn-dusk asymmetry (Yoshizawa, 1986; Ohtani et al., 2018).
The dependence of GMDs on the orientation of the IMF-By component has continued to receive wide attention (Holappa et al., 2021; Engebretson et al., 2022; Ohtani et al., 2023). During the Gannon storm, there were two particularly interesting intervals when IMF-By experienced sharp reversals going from negative to positive orientation. At the time of the first flip on 10 May, IMF-By changed from around −64 nT at 22:27 UT to 69 nT at 22:48 UT. The dramatic IMF-By flip happened simultaneously with the IMF-Bz sudden rotation from about −40 nT to 50 nT under high solar wind velocity (
In contrast, the second IMF-By flip on 11 May turning from −26 nT at
Finally, we turn our focus to the auroral oval equatorward boundary dynamics. This location is estimated using the SECS technique and is depicted by the dashed mauve curve in Figure 6. Understanding the motion of the boundary is important in terms of the location and magnitude of the geomagnetic effects on the ground. Specifically, the auroral oval moving into regions that are considered less prone to intense auroral currents, e.g., the lower 48 States of the United States. However, it is highly possible that the extent of equatorward boundary may have been much further south than depicted here. There were a number of reported aurora sightings in low latitude regions, including Mexico (Gonzalez-Esparza et al., 2024; Hayakawa et al., 2025). One of the limitations to getting a more accurate location of the boundary is the sparse density of magnetometers over the United States and Mexico, as outlined earlier. Obtaining a boundary is further complicated by the intensity of the Gannon storm, as manifested by the messy current patterns produced in Figure 5. Most of the new USGS variometers are closer to the northern United States boarder and really only two stations contribute to the boundary below 35 deg GLat. Therefore, the majority of the time the boundary could be below the “field of view” of the spherical elementary current grid. In general the equatorward boundary sits between 40 deg and 45 deg MLat at magnetic midnight and possibly lower between 01:30 and 01:45 UT (
5 Summary and conclusion
The powerful geomagnetic storm of May 2024 emphasizes the increased risk associated with expansion of the auroral oval to lower latitudes during extreme geomagnetic activity. While there are a number of prior studies that provided different insights about this storm, the present paper is focused on the ground geomagnetic response at the mid-latitudes in the American sector.
Ground geomagnetic field recordings show that the storm produced extreme perturbations typically not seen at such locations. We see in the present study (Figures 4, 5) that the extraordinary IMF-By flip centered around 22:30 UT on 10 May was associated with some intense geomagnetic perturbations at mid-latitudes with dB/dt exceeding an absolute value of
Furthermore, SECS maps shows the formation of the Harang upward current system whose formation follows the rotation of the IMF-By component. Following this rotation at
Data availability statement
Solar wind measurements were obtained from the NASA/GSFC Space Physics Data Facility OMNIWeb service produced by CDAWeb at https://omniweb.gsfc.nasa.gov/. The SuperMag data is collected at ground magnetometer stations around the world and made available at http://supermag.jhuapl.edu/. Ionospheric currents were derived using the SECS technique at 10 s Resolution in Geographic Coordinates (Weygand, 2009a), whereas the SEC Amplitudes were also derived using the SECS technique at 10 s Resolution in Geographic Coordinates (Weygand, 2009b).
Author contributions
CN: Writing – review and editing, Software, Writing – original draft, Validation, Funding acquisition, Resources, Investigation, Project administration, Formal Analysis, Conceptualization, Methodology, Data curation, Visualization. YN: Validation, Methodology, Conceptualization, Visualization, Investigation, Data curation, Funding acquisition, Writing – review and editing, Formal Analysis. JW: Formal Analysis, Methodology, Data curation, Visualization, Validation, Conceptualization, Funding acquisition, Writing – original draft, Writing – review and editing, Investigation. LL: Resources, Data curation, Writing – review and editing. DB: Visualization, Resources, Writing – review and editing. JF: Writing – review and editing, Investigation, Resources, Formal Analysis. PE: Writing – review and editing, Resources, Formal Analysis.
Funding
The author(s) declare that financial support was received for the research and/or publication of this article. This work was partly supported by NASA Grant Award 80NSSC24K0259. CMN was also supported by NSF Grant Award AGS-2300579. YN was also supported by NASA grants 80NSSC21K1321, 80NSSC23M0193, 80NSSC23K0410, 80NSSC24K1103, and 80NSSC25K0075, NSF grant AGS-2527835, and AFOSR grant FA9550-23-1-0614. JF, PJE, and DCB received no financial support for work on this study.
Acknowledgments
For the ground magnetometer data we gratefully acknowledge: INTERMAGNET, Alan Thomson; CARISMA, PI Ian Mann; CANMOS, Geomagnetism Unit of the Geological Survey of Canada; The S-RAMP Database, PI K. Yumoto and Dr. K. Shiokawa; The SPIDR database; AARI, PI Oleg Troshichev; The MACCS program, PI M. Engebretson; GIMA; MEASURE, UCLA IGPP and Florida Institute of Technology; SAMBA, PI Eftyhia Zesta; 210 Chain, PI K. Yumoto; SAMNET, PI Farideh Honary; IMAGE, PI Liisa Juusola; Finnish Meteorological Institute, PI Liisa Juusola; Sodankylä Geophysical Observatory, PI Tero Raita; UiT the Arctic University of Norway, Tromsø Geophysical Observatory, PI Magnar G. Johnsen; GFZ German Research Centre For Geosciences, PI Jürgen Matzka; Institute of Geophysics, Polish Academy of Sciences, PI Anne Neska and Jan Reda; Polar Geophysical Institute, PI Alexander Yahnin and Yarolav Sakharov; Geological Survey of Sweden, PI Gerhard Schwarz; Swedish Institute of Space Physics, PI Masatoshi Yamauchi; AUTUMN, PI Martin Connors; DTU Space, Thom Edwards and PI Anna Willer; South Pole and McMurdo Magnetometer, PI’s Louis J. Lanzarotti and Alan T. Weatherwax; ICESTAR; RAPIDMAG; British Artarctic Survey; McMac, PI Dr. Peter Chi; BGS, PI Dr. Susan Macmillan; Pushkov Institute of Terrestrial Magnetism, Ionosphere and Radio Wave Propagation (IZMIRAN); MFGI, PI B. Heilig; University of L’Aquila, PI M. Vellante; BCMT, V. Lesur and A. Chambodut; Data obtained in cooperation with Geoscience Australia, PI Andrew Lewis; PENGUIn, co-PIs Bob Clauer, Michael Hartinger, and Zhonghua Xu; MagStar, PI Jennifer Gannon; LISN PI Cesar Valladares; SuperMAG, PI Jesper W. Gjerloev; Data obtained in cooperation with the Australian Bureau of Meteorology, PI Richard Marshall. SuperMAG is funded by NSF, NASA, and ESA.
Conflict of interest
The authors declare that the research was conducted in the absence of any commercial or financial relationships that could be construed as a potential conflict of interest.
Generative AI statement
The author(s) declare that no Generative AI was used in the creation of this manuscript.
Any alternative text (alt text) provided alongside figures in this article has been generated by Frontiers with the support of artificial intelligence and reasonable efforts have been made to ensure accuracy, including review by the authors wherever possible. If you identify any issues, please contact us.
Publisher’s note
All claims expressed in this article are solely those of the authors and do not necessarily represent those of their affiliated organizations, or those of the publisher, the editors and the reviewers. Any product that may be evaluated in this article, or claim that may be made by its manufacturer, is not guaranteed or endorsed by the publisher.
References
Amm, O. (1997). Ionospheric elementary current systems in spherical coordinates and their application. J. Geomagnetism Geoelectr. 49, 947–955. doi:10.5636/jgg.49.947
Amm, O., Engebretson, M. J., Hughes, T., Newitt, L., Viljanen, A., and Watermann, J. (2002). A traveling convection vortex event study: instantaneous ionospheric equivalent currents, estimation of field-aligned currents, and the role of induced currents. J. Geophys. Res. 107, SIA1–SIA11. doi:10.1029/2002JA009472
Anderson, B. J., Korth, H., Waters, C. L., Green, D. L., and Stauning, P. (2008). Statistical Birkeland current distributions from magnetic field observations by the Iridium constellation. Ann. Geophys. 26, 671–687. doi:10.5194/angeo-26-671-2008
Boteler, D. H. (2019). A 21st century view of the March 1989 magnetic storm. Space weather. 17, 1427–1441. doi:10.1029/2019SW002278
Chu, X., McPherron, R. L., Hsu, T. S., and Angelopoulos, V. (2015). Solar cycle dependence of substorm occurrence and duration: implications for onset. J. Geophys. Res. 120, 2808–2818. doi:10.1002/2015JA021104
Despirak, I., Kozelova, T., Koselov, B., and Lubchich, A. (2022). “Observations of substorm activity near the Harang Discontinuity,” in Eighteenth international scientific conference “space, ecology, safety” (SES-2022) (Sofia, Bulgaria), 19–21.
Engebretson, M. J., Simms, L. E., Pilipenko, V. A., Bouayed, L., Moldwin, M. B., Weygand, J. M., et al. (2022). Geomagnetic disturbances that cause GICs: investigating their interhemispheric conjugacy and control by IMF orientation. J. Geophys. Res. 127, e2022JA030580. doi:10.1029/2022JA030580
Engebretson, M. J., Gaffaney, S. A., Ochoa, J. A., Runov, A., Weygand, J. M., Nishimura, Y., et al. (2024). Signatures of dipolarizing flux bundles in the nightside auroral zone. J. Geophys. Res. 129, e2023JA032266. doi:10.1029/2023JA032266
Erickson, G. M., Spiro, R. W., and Wolf, R. A. (1991). The physics of the Harang discontinuity. J. Geophys. Res. 96 (A2), 1633–1645. doi:10.1029/90ja02344
Forsythe, V. V., Duly, T., Hampton, D., and Nguyen, V. (2020). Validation of ionospheric electron density measurements derived from Spire CubeSat constellation. Radio Sci. 55, e2019RS006953. doi:10.1029/2019RS006953
Foster, J. C., Erickson, P. J., Nishimura, Y., Zhang, S. R., Bush, D. C., Coster, A. J., et al. (2024). Imaging the may 2024 extreme aurora with ionospheric total electron content. Geophys. Res. Lett. 51, e2024GL111981. doi:10.1029/2024GL111981
Gaunt, C. T., and Coetzee, G. (2007). “Transformer failure in regions incorrectly considered to have low gic-risks,” in IEEE power tech., conference paper 445 (Lausanne), 807–812.
Gjerloev, J. W. (2009). A global ground-based magnetometer initiative. Eos 90, 230–231. doi:10.1029/2009EO270002
Gonzalez-Esparza, J. A., Sanchez-Garcia, E., Sergeeva, M., Corona-Romero, P., Gonzalez-Mendez, L. X., Valdes-Galicia, J. F., et al. (2024). The mother’s day geomagnetic storm on 10 may 2024: aurora observations and low latitude space weather effects in Mexico. Space weather. 22, e2024SW004111. doi:10.1029/2024SW004111
Grocott, A., Milan, S. E., Yeoman, T. K., Sato, N., Yukimatu, A. S., and Wild, J. A. (2010). Superposed epoch analysis of the ionospheric convection evolution during substorms: IMF BY dependence. J. Geophys. Res. 115. doi:10.1029/2010JA015728
Hajra, R., Tsurutani, B. T., Echer, E., Gjerlov, J. W., and Gjerloev, J. W. (2016). Supersubstorms (SML < −−2500 nT): magnetic storm and solar cycle dependences. Geophys. Res. Lett. 121, 7805–7816. doi:10.1002/2015JA021835
Harang, L. (1946). The mean field of disturbance of polar geomagnetic storms. Terr. Magnetism Atmos. Electr. 51 (3), 353–380. doi:10.1029/te051i003p00353
Hayakawa, H., Ebihara, Y., Mishev, A., Koldobskiy, S., Kusano, K., Bechet, S., et al. (2025). The solar and geomagnetic storms in 2024 may: a flash data report. Astrophysical J. 979, 49. doi:10.3847/1538-4357/ad9335
Henderson, M. G., Reeves, G. D., and Murphree, J. S. (1998). Are north-south aligned auroral structures an ionospheric manifestation of bursty bulk flows? Geophys. Res. Lett. 25 (19), 3737–3740. doi:10.1029/98gl02692
Holappa, L., Robinson, R. M., Pulkkinen, A., Asikainen, T., and Mursula, K. (2021). Explicit IMF by-dependence in geomagnetic activity: quantifying ionospheric electrodynamics. J. Geophys. Res. 126, e2021JA029202. doi:10.1029/2021JA029202
Kleimenova, N., Gromova, L., Gromov, S., and Malysheva, L. (2025). Ground-based geomagnetic disturbances and pi2 pulsations in the main phase of the superstorm on may 10, 2024. Adv. Space Res. doi:10.1016/j.asr.2025.04.025
Lao, C. J., Forsyth, C., Freeman, M. P., Smith, A. W., and Mooney, M. K. (2024). On the association of substorm identification methods. J. Geophys. Res. - Space Phys. 129, e2024JA032762. doi:10.1029/2024JA032762
Lyons, L. R., Nishimura, Y., Kim, H.-J., Donovan, E., Angelopoulos, V., Sofko, G., et al. (2011). Possible connection of polar cap flows to pre- and post-substorm onset PBIs and streamers. J. Geophys. Res. 116. doi:10.1029/2011JA016850
Lyons, L. R., Nishimura, Y., Donovan, E., and Angelopoulos, V. (2013). Distinction between auroral substorm onset and traditional ground magnetic onset signatures. J. Geophys. Res. 118, 4080–4092. doi:10.1002/jgra.50384
Maynard, N. C. (1974). Electric field measurements across the Harang discontinuity. J. Geophys. Res. 79, 4620–4631. doi:10.1029/JA079i031p04620
McPherron, R. L., and Chu, X. (2017). The mid-latitude positive bay and the MPB index of substorm activity. Space Sci. Rev. 206, 91–122. doi:10.1007/s11214-016-0316-6
Milan, S. E., Mooney, M. K., Bower, G., Fleetham, A. L., Vines, S. K., and Gjerloev, J. (2023). Solar wind-magnetosphere coupling during high-intensity long-duration continuous AE activity (HILDCAA). Geophys. Res. Lett. 128, e2023JA032027. doi:10.1029/2023JA032027
Milan, S. E., Bower, G. E., Fleetham, A. L., Imber, S. M., Schillings, A., Opgenoorth, H., et al. (2024). Occurrence and causes of large dB/dt events and AL bays in the pre-midnight and dawn sectors. Geophys. Res. Lett. 129, e2024JA032811. doi:10.1029/2024JA032811
Newell, P. T., and Gjerloev, J. G. (2011). Evaluation of SuperMAG auroral electrojet indices as indicators of substorms and auroral power. J. Geophys. Res. 116, A12211. doi:10.1029/2011JA016779
Ngwira, C. M., Pulkkinen, A., Wilder, F. D., and Crowley, G. (2013). Extended study of extreme geoelectric field event scenarios for geomagnetically induced current applications. Space weather. 11, 121–131. doi:10.1002/swe.20021
Ngwira, C. M., Pulkkinen, A., Bernabeu, E., Eichner, J., Viljanen, A., and Crowley, G. (2015). Characteristics of extreme geoelectric fields and their possible causes: localized peak enhancements. Geophys. Res. Lett. 42, 6916–6921. doi:10.1002/2015GL065061
Ngwira, C. M., Sibeck, D., Silveria, M. V. D., Georgiou, M., Weygand, J. M., Nishimura, Y., et al. (2018). A study of intense local dB/dt variations during two geomagnetic storms. Space weather. 16, 676–693. doi:10.1029/2018SW001911
Ngwira, C. M., Arritt, R., Perry, C., Weygand, J. M., and Rishi, S. (2023). Occurrence of large geomagnetically induced currents within the EPRI SUNBURST monitoring network. Space weather. 21 (12), e2023SW003532. doi:10.1029/2023SW003532
Ngwira, C. M., Nishimura, Y., Weygand, J. M., Engebretson, M. J., Pulkkinnen, A., and Schuck, P. (2025). Observations of localized horizontal geomagnetic field variations associated with a magnetospheric fast flow burst during a magnetotail reconnection event detected by the THEMIS spacecraft. J. Geophys. Res. Space Phys. 130, e2024JA032651. doi:10.1029/2024JA032651
Ohtani, S., and Gjerloev, J. W. (2020). Is the substorm current wedge an ensemble of wedgelets? Revisit to midlatitude positive bays. J. Geophys. Res. 125, e2020JA027902. doi:10.1029/2020JA027902
Ohtani, S., Gjerloev, J. W., Anderson, B. J., Kataoka, R., Troshichev, O., and Watari, S. (2018). Dawnside wedge current system formed during intense geomagnetic storms. J. Geophys. Res. 123, 9093–9109. doi:10.1029/2018JA025678
Ohtani, S., Sorathia, K., Merkin, S. G., Frey, H. U., and Gjerloev, J. W. (2023). External and internal causes of the stormtime intensification of the dawnside westward auroral electrojet. J. Geophys. Res. 128 (10), e2023JA031457. doi:10.1029/2023JA031457
Ohtani, S., Zou, Y., Merkin, V. G., Wiltberger, M., Pham, K. H., Raptis, S., et al. (2025). Ground magnetic response to an extraordinary IMF BY flip during the may 2024 storm: travel time from the magnetosheath to dayside high latitudes. J. Geophys. Res. 130, e2024JA033691. doi:10.1029/2024JA033691
Opgenoorth, H. J., Robinson, R., Ngwira, C. M., Garcia Sage, K., Kuznetsova, M., El Alaoui, M., et al. (2024). Earth’s geomagnetic environment–progress and gaps in understanding, prediction, and impacts. Adv. Space Res. doi:10.1016/j.asr.2024.05.016
Piersanti, M., Oliveira, D. M., D’Angelo, G., Diego, P., Napoletano, G., and Zesta, E. (2025). On the geoelectric field response to the SSC of the may 2024 super storm over europe. Space weather. 23, e2024SW004191. doi:10.1029/2024SW004191
Pirjola, R. (2000). Geomagnetically induced currents during magnetic storms. IEEE Trans. Plasma Sci. 28, 1867–1873. doi:10.1109/27.902215
Pulkkinen, A., Bernabeu, E., Eichner, J., Beggan, C., and Thomson, A. W. P. (2012). Generation of 100-year geomagnetically induced current scenarios. Space weather. 10, S04003. doi:10.1029/2011SW000750
Pulkkinen, A., Bernabeu, E., Thomson, A., Viljanen, A., Pirjola, R., Boteler, D., et al. (2017). Geomagnetically induced currents: science, engineering and applications readiness. Space weather. 15, 828–856. doi:10.1002/2016SW001501
Sorathia, K. A., Michael, A., Merkin, V. G., Ohtani, S., Keesee, A. M., Sciola, A., et al. (2023). Multiscale magnetosphere-ionosphere coupling during stormtime: a case study of the dawnside current wedge. J. Geophys. Res. 128, e2023JA031594. doi:10.1029/2023JA031594
Tsurutani, B. T., Hajra, R., Echer, E., and Gjerloev, J. W. (2015). Extremely intense (SML ≤−2500 nT) substorms: isolated events that are externally triggered? Ann. Geophys. 33, 519–524. doi:10.5194/angeo-33-519-2015
Tulasi Ram, S., Veenadhari, B., Dimri, A. P., Bulusu, J., Bagiya, M., Gurubaran, S., et al. (2024). Super–intense geomagnetic storm on 10–11 may 2024: possible mechanisms and impacts. Space weather. 22, e2024SW004126. doi:10.1029/2024SW004126
Vichare, G., and Bagiya, M. S. (2024). Manifestations of strong imf-by on the equatorial ionospheric electrodynamics during 10 may 2024 geomagnetic storm. Geophys. Res. Lett. 51, e2024GL112569. doi:10.1029/2024GL112569
Waghule, B., and Knipp, D. J. (2025). Ionospheric response during the 10–12 may 2024 geomagnetic storm and it’s connection to GICs. 2025 United States national committee of URSI national Radio science meeting. Boulder, CO, USA: USNC-URSI NRSM, 362–363. doi:10.23919/USNC-URSINRSM66067.2025.10906842
Waghule, B., Knipp, D. J., Gannon, J. L., Billet, D., Vines, S. K., and Goldstein, J. (2024). What drove the GICs >10 A during the 17 March 2013 event at Mäntsälä? Space weather. 22, e2024SW003980. doi:10.1029/2024SW003980
Wei, D., Dunlop, M. W., Yang, J., Dong, X., Yu, Y., and Wang, T. (2021). Intense dB/dt variations driven by near-earth bursty bulk flows (BBFs): a case study. Geophys. Res. Lett. 48, e2020GL091781. doi:10.1029/2020GL091781
Weygand, J. M. (2009a). Spherical elementary currents systems (SECS) technique North American equivalent ionospheric currents (EICs) derived at 10 sec resolution in geographic coordinates. Los Angeles: University of California. doi:10.21978/p8d62b
Weygand, J. M. (2009b). Spherical elementary currents systems (SECS) technique North American spherical elementary current (SEC) amplitudes derived at 10 sec resolution in geographic coordinates [data set]. Los Angeles: University of California. doi:10.21978/p8pp8x
Weygand, J. M., McPherron, R. L., Frey, H., Amm, O., Kauristie, K., Viljanen, A. T., et al. (2008). Relation of substorm onset to Harang discontinuity. J. Geophys. Res. 113, A04213. doi:10.1029/2007JA012537
Weygand, J. M., Amm, O., Viljanen, A., Angelopoulos, V., Murr, D., Engebretson, M. J., et al. (2011). Application and validation of the spherical elementary currents systems technique for deriving ionospheric equivalent currents with the North American and Greenland ground magnetometer arrays. J. Geophys. Res. 116, A03305. doi:10.1029/2010JA016177
Weygand, J. M., Amm, O., Angelopoulos, V., Milan, S. E., Grocott, A., Gleisner, H., et al. (2012). Comparison between SuperDARN flow vectors and equivalent ionospheric currents from ground magnetometer arrays. J. Geophys. Res. 117, A05325. doi:10.1029/2011JA017407
Weygand, J. M., Ngwira, C. M., and Arritt, R. F. (2023). The equatorward boundary of the auroral current system during magnetic storms. J. Geophys. Res. 128, e2023JA031510. doi:10.1029/2023JA031510
Wik, M., Pirjola, R., Lundstedt, H., Viljanen, A., Wintoft, P., and Pulkkinen, A. (2009). Space Weather events in July 1982 and October 2003 and the effects of geomagnetically induced currents on Swedish technical systems. Ann. Geophys. 27, 1775–1787. doi:10.5194/angeo-27-1775-2009
Yoshizawa, K. (1986). Effect of the IMF-By component on the North–South asymmetry of geomagnetic activity. Planet. Space Sci. 34, 639–644. doi:10.1016/0032-0633(86)90041-3
Zhang, Z., Zhang, F., Wang, L., Li, X., Zhima, Z., Wang, Y., et al. (2025). The magnetosphere–ionosphere–ground responses to the May 2024 super solar storm. Space weather. 23, e2024SW004197. doi:10.1029/2024SW004197
Zou, S., Lyons, L. R., Wang, C.-P., Boudouridis, A., uohoniemi, J. M., Dyson, P. C. A. P. L., et al. (2009). On the coupling between the Harang reversal evolution and substorm dynamics: a synthesis of SuperDARN, DMSP, and IMAGE observations. J. Geophys. Res. 114. doi:10.1029/2008JA013449
Zou, Y., Dowell, C., Ferdousi, B., Lyons, L. R., and Liu, J. (2022). Auroral drivers of large dB/dt during geomagnetic storms. Space weather. 20, e2022SW003121. doi:10.1029/2022SW003121
Keywords: space weather, geomagnetic storms, Gannon storm, extreme mid-latitude geomagnetic perturbations, isolated substorm, auroral equatorward expansion
Citation: Ngwira CM, Nishimura Y, Weygand JM, Landwer LJ, Bush DC, Foster JC and Erickson PJ (2025) Evaluating the geomagnetic response to the May 2024 super storm – observations and interpretations. Front. Astron. Space Sci. 12:1652705. doi: 10.3389/fspas.2025.1652705
Received: 24 June 2025; Accepted: 27 August 2025;
Published: 19 September 2025.
Edited by:
Denny Oliveira, University of Maryland, Baltimore County, United StatesReviewed by:
Lauri Holappa, University of Oulu, FinlandJiaojiao Zhang, Chinese Academy of Sciences (CAS), China
Copyright © 2025 Ngwira, Nishimura, Weygand, Landwer, Bush, Foster and Erickson. This is an open-access article distributed under the terms of the Creative Commons Attribution License (CC BY). The use, distribution or reproduction in other forums is permitted, provided the original author(s) and the copyright owner(s) are credited and that the original publication in this journal is cited, in accordance with accepted academic practice. No use, distribution or reproduction is permitted which does not comply with these terms.
*Correspondence: Chigomezyo M. Ngwira, Y2hpZ29tZXp5by5uZ3dpcmFAbmFzYS5nb3Y=