 Pufan Liu1,2
 Hui Li1
 Ziqi Li1,2
 Xiaoyue Cao1,3,4
 Rui Li1*Hao Su5Ran Li6
 Nicola R. Napolitano7Léon V. E. Koopmans8Valerio Busillo9
 Crescenzo Tortora9Liang Gao1,6
- 1Institute for Astrophysics, School of Physics, Zhengzhou University, Zhengzhou, China
- 2International College, Zhengzhou University, Zhengzhou, China
- 3School of Astronomy and Space Science, University of Chinese Academy of Sciences, Beijing, China
- 4National Astronomical Observatories, Chinese Academy of Sciences, Beijing, China
- 5Department of Physics “E. Pancini”, University of Naples Federico II, Naples, Italy
- 6School of Physics and Astronomy, Beijing Normal University, Beijing, China
- 7Department of Physics “E. Pancini”, University Federico II, Naples, Italy
- 8Kapteyn Astronomical Institute, University of Groningen, Groningen, Netherlands
- 9INAF–Osservatorio Astronomico di Capodimonte, Naples, Italy
Strong gravitational lenses are invaluable for tackling fundamental astrophysics questions, such as the nature of dark matter and cosmic expansion. However, current sky surveys’ “crop-and-classify” lens search method faces a critical challenge: it creates massive computational and storage bottlenecks when dealing with billions of potential host galaxies, which is unsustainable for future large-scale surveys. To address this, we propose LenNet, an object detection model that directly identifies lenses in large, original survey images, eliminating the inefficient cropping step. LenNet is first trained on simulated data to learn gravitational lens features. Then, transfer learning is used to fine-tune it on a limited set of real, labeled samples from the Kilo-Degree Survey (KiDS). Experiments show LenNet performs exceptionally well on real survey data, validating its ability as an efficient and scalable solution for lens discovery in massive astronomical surveys. LenNet’s success in direct lens detection in large images resolves the computational and storage issues of traditional methods. The strategy of using simulated data for initial training and transfer learning with real KiDS data is effective, especially given limited real labeled data. Looking forward, LenNet can enable more efficient lens discovery in future large-scale surveys, accelerating research on dark matter and cosmic expansion.
1 Introduction
According to Einstein’s Theory of General Relativity, light from a distant source galaxy travels to the observer along geodesics in spacetime. If a foreground galaxy is closely aligned with such a source, its gravitational potential distorts the intervening spacetime, deflecting the light to form multiple images or extended arcs (Schneider et al., 1992). This phenomenon, analogous to optical lensing, is known as galaxy-galaxy strong gravitational lensing (GGSL) and constitutes a powerful astrophysical tool (Shajib et al., 2024; Treu, 2010). GGSL provides robust estimates of the lens galaxy’s mass distribution (Koopmans et al., 2006; Auger et al., 2010; Sonnenfeld et al., 2015; Shajib et al., 2021; Sheu et al., 2025), including its dark matter subhalos (Vegetti et al., 2012; Nightingale et al., 2024; Ballard et al., 2024; Cao et al., 2025; He et al., 2025); when combined with stellar population synthesis models, these measurements yield constraints on the galaxy’s initial mass function (e.g., Sonnenfeld et al., 2015; Li et al., 2025). Furthermore, GGSL acts as a natural “cosmic telescope”, magnifying background sources to enable the study of their structure (Dye et al., 2015; Shu et al., 2016b; Cheng et al., 2020; Rizzo et al., 2020; Li et al., 2024a), which would otherwise be beyond the capabilities of current instruments. Finally, because light propagates through the cosmological background, GGSL serves as an independent cosmographic probe when the background source exhibits temporal variability (Treu et al., 2022; Birrer et al., 2024) or when multiple sources lie at different redshifts (Gavazzi et al., 2008; Collett and Auger, 2014; Euclid Collaboration et al., 2025a).
GGSL is a rare astrophysical event that necessitates precise alignment, typically within a few arcseconds, between foreground and background galaxies. Consequently, identifying individual lenses within contemporary sky surveys often requires extensive visual inspection of numerous galaxy images, rendering the development of automated detection methods imperative, particularly as forthcoming surveys will catalogue more than billions of galaxies (e.g., LSST Science Collaboration et al., 2009). Traditional automatic lens-finding approaches include spectrum-based techniques (Bolton et al., 2006; Shu et al., 2016a; Cao et al., 2020), which identify anomalous emission lines in foreground galaxies indicative of background sources, and image-based methods (Cabanac et al., 2006; More et al., 2012; Nightingale et al., 2025), which directly inspect galaxy images for characteristic lensing features such as bluish arcs. While these conventional methods have successfully confirmed several hundred GGSLs, recent advances in deep learning, particularly convolutional neural networks (CNNs), have significantly enhanced lens discovery capabilities, yielding thousands of new candidates (e.g., Petrillo et al., 2017; Jacobs et al., 2019; Li et al., 2021; Nagam et al., 2025). Nevertheless, existing lens samples are still insufficient for many strong lens sciences in terms of size and completeness (Shajib et al., 2024). Ongoing and Upcoming telescope facilities, including Euclid (Euclid Collaboration et al., 2025b), the China Space Station Telescope (CSST, Zhan, 2021), the Nancy Grace Roman Space Telescope (Spergel et al., 2015), and the Vera C. Rubin Observatory’s Legacy Survey of Space and Time (LSST, Ivezić et al., 2019), are expected to detect hundreds of thousands of GGSLs (Collett, 2015; Cao et al., 2024; Wedig et al., 2025). This anticipated surge in available data promises to revolutionise the field, but concurrently underscores the critical need to develop more efficient and robust automated lens-finding algorithms to fully exploit this unprecedented opportunity.
The conventional pipeline for identifying gravitational lenses using neural networks typically comprises three main stages. First, potential lens candidates, such as massive elliptical galaxies, are pre-selected from a parent source catalogue generated by software such as Source Extractor (Bertin and Arnouts, 1996). Second, small cutout images centred on these candidates are produced. Third, a neural network, commonly a CNN, classifies each cutout to determine if it contains a strong lens. This methodology has been extensively employed in various large-scale surveys (e.g., Petrillo et al., 2019; Li et al., 2021; Euclid Collaboration et al., 2025b), achieving notable success. However, this approach has several limitations. Firstly, in crowded fields, the source-detection algorithm may fail, leading to cutouts that blend multiple neighbouring objects. Such blending can hinder the network’s ability to accurately recognise genuine lensing features. Secondly, choosing an appropriate cutout size involves a critical trade-off that directly influences detection accuracy. If the cutout is too small, lensed arcs of systems with large Einstein radii may lie outside the field of view, resulting in missed detections. Conversely, overly large cutouts may include nearby contaminating objects, especially in crowded regions, potentially causing the network to misidentify these contaminants as lensing features, thus generating false positives. Thirdly, the cutout-based approach inherently neglects information about the broader environmental context of the lens system. This context can provide subtle yet valuable clues for lens identification; for example, GGSLs are more likely to occur within dense galaxy cluster environments (Oguri et al., 2005). Finally, the pre-selection stage can systematically exclude rare yet scientifically interesting systems, such as those with very low mass (Shu et al., 2017) or disk lensing galaxies (Treu et al., 2011).
To address the limitations inherent in conventional neural-network-based gravitational lens finders, we introduce LenNet, a neural network specifically designed to identify GGSLs directly from full-survey images. This approach eliminates the necessity of pre-selecting target sources and extracting individual image cutouts1. LenNet incorporates advanced feature-extraction techniques explicitly tailored for gravitational lens identification. Initially trained on simulated lensing datasets, LenNet subsequently employs transfer learning to improve its generalisation capabilities for application to real observational data. On mock lensing datasets, LenNet achieves an precision of 96.95 per cent with a recall rate of 97.27 per cent, while on real KIDS lensing datasets, it attains an precision of 97.91 per cent with a recall rate of 89.47 per cent. Additionally, we compare the performance of LenNet with several classical object detection neural networks (e.g., YOLO (Khanam and Hussain, 2024; Redmon and Farhadi, 2018)) and find that LenNet demonstrates superior performance.
This paper is structured as follows. Section 2 describes the methodology used to generate the simulated dataset. Section 3 details the architecture, key components, and training procedure of LenNet. Section 4 presents the results, including performance evaluations of LenNet on both simulated and real observational data. Finally, Section 5 summarises our conclusions.
2 Dataset generation
2.1 KIDS DR4
The Kilo-Degree Survey (KiDS) is a Stage-III optical imaging survey conducted using the OmegaCAM wide-field camera on the VLT Survey Telescope (VST) at the ESO Paranal Observatory (Kuijken et al., 2015). Initiated in 2011, KiDS was designed to map a large area of the extragalactic sky with exceptional image quality. Although its primary scientific goal is weak gravitational lensing for cosmological studies, the survey’s deep, multi-band imaging data provide a rich resource for a broad range of astrophysical investigations, including strong lensing, galaxy evolution, and the characterisation of galaxy clusters. The KiDS footprint covers 1,350
2.2 Lens simulation
Identifying GGSLs using neural networks requires substantial amounts of training data. However, confirmed lenses remain scarce within the KiDS survey (Petrillo et al., 2019; Li et al., 2020; Grespan et al., 2024; N et al., 2024). Therefore, we have developed a specialized GGSL simulation pipeline to generate realistic training samples. This method, described extensively in Li et al. (2021), involves injecting simulated lensing images into real KiDS galaxy observations, as detailed below.
It should be noted that lens-free images are not essential for the model training and validation in this study. On one hand, if lens-free images were to be used for model optimization, they would first require manual visual inspection to screen out valid samples that are free of interference and errors. This process consumes significant labor and time costs, thereby reducing research efficiency. On the other hand, the core objective of this study is to improve the model’s accuracy in recognizing “lenses”. Importantly, lens-free images do not actually participate in the calculation of loss; their auxiliary role in helping the model learn the “key features of lenses” is extremely minimal. Even without incorporating lens-free images, the model can still maintain excellent detection capabilities. Luminous Red Galaxies (LRGs) are selected from the KiDS DR4 catalogue to act as potential lens galaxies. Following the methodology of Li et al. (2021), Section 3.1), the selection is based on both colour and magnitude criteria, with a magnitude limit of
This simulation pipeline yielded 9,147 mock lenses with known labels for network training.
Notably, one simulated field contains only a single lens. The full sample of lenses was simulated with Einstein radii in the range of 1–5 arcsec, lens redshifts
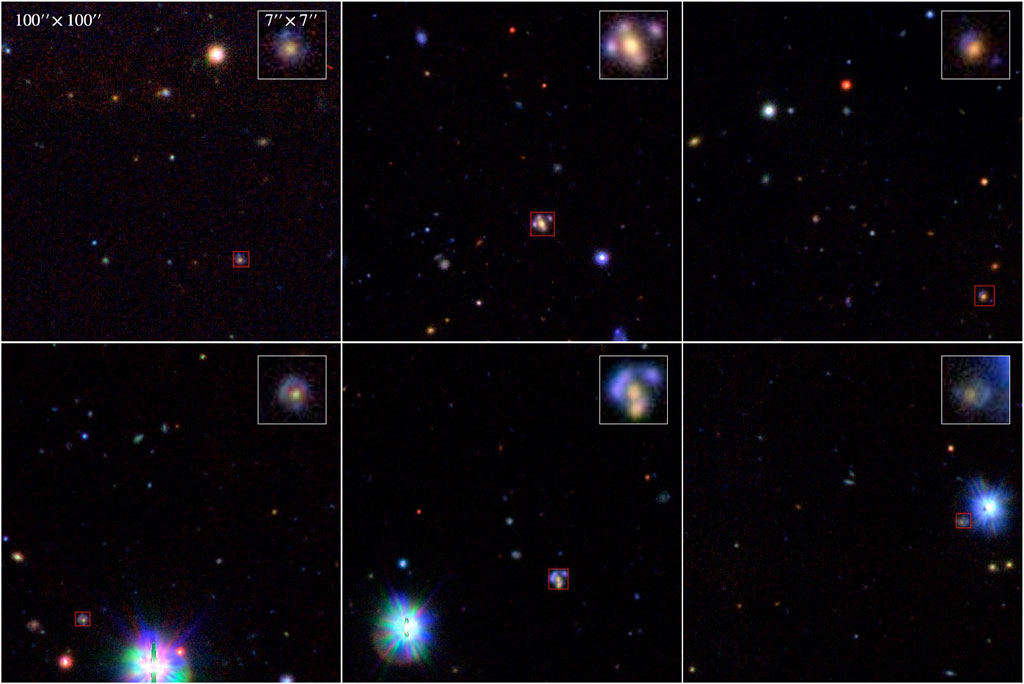
Figure 1. Representative examples of simulated strong lenses in KiDS DR4 imaging. Each system is marked by a red box, and the inset shows a zoomed-in view of the lens.
3 Methods
The performance of LenNet is determined by three core components: its model architecture, loss function, and training procedure. The architecture and loss function define the model’s theoretical performance ceiling, while the training strategy determines how effectively this potential is achieved. The following subsections detail each of these three components.
3.1 Network architecture
Figure 2 provides a simplified schematic of this architecture, omitting intermediate layers for clarity. The model’s architecture is composed of two primary stages: a feature extraction backbone and a feature fusion neck. These modules are followed by a detection head, which processes the fused feature maps at three distinct scales. This multi-scale approach enables the model to effectively detect gravitational lenses of various apparent sizes. The operational workflow diverges for training and inference. During the training phase, the model’s predictions are compared against ground-truth labels to compute a loss value, which guides parameter updates via backpropagation. Conversely, during inference, the raw predictions are aggregated and refined using Non-Maximum Suppression (NMS) (Neubeck and Van Gool, 2006) to produce the final set of detections.
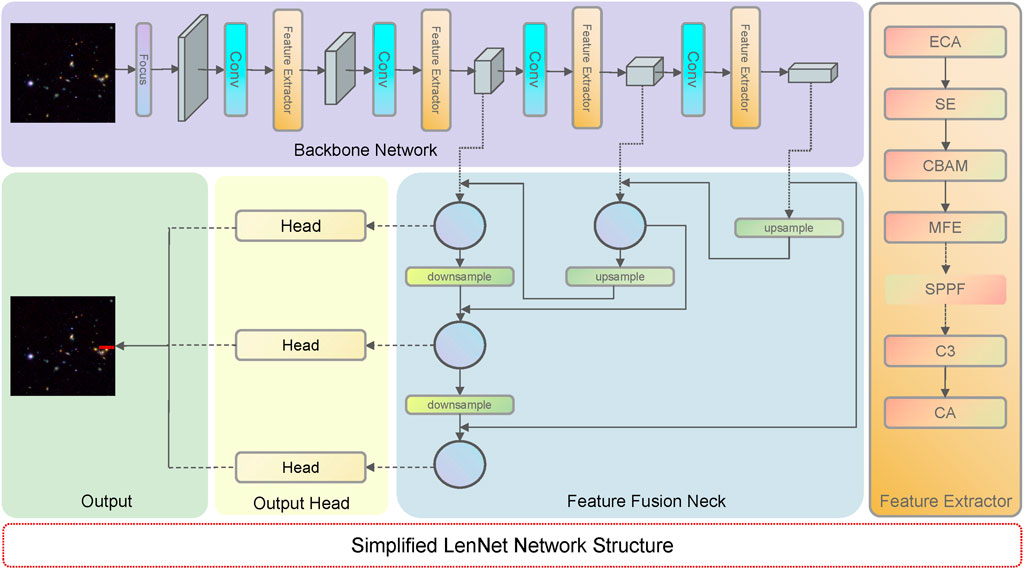
Figure 2. Simplified LeNet Network Structure. This figure is intended solely to provide readers with a general understanding of the overall architecture of LeNet, and does not encompass all components in detail. For example, in the upsampling and downsampling process of the feature fusion neck (i.e., FPN Network), the intermediate feature extraction layers interleaved between these operations have been omitted for clarity. In the diagram, dashed lines represent the connections between different components, with rectangular blocks in the Backbone Network and circular nodes in the Feature Fusion Neck both denoting intermediate feature maps.
The feature extraction module serves as the backbone of LenNet, designed to transform raw input images into a hierarchy of representative and discriminative features. This is achieved by progressively downsampling the spatial dimensions while extracting information critical for lens identification. The module’s architecture is a carefully orchestrated sequence of attention mechanisms, a bespoke Multi-Feature Extraction block (MFEBlock (Xie et al., 2023)), and the efficient C3 module from CSPNet (Wang et al., 2023; Khanam and Hussain, 2024). It starts with a lightweight ECA block (Wang et al., 2020) for initial channel-wise weighting. Following this, an SE block (Hu et al., 2018) further refines these channel weights, focusing computational resources on the most informative channels. Building on this, a CBAM block (Woo et al., 2018) introduces a spatial attention component, creating a comprehensive feature map refined in both channel and spatial domains. After this attention-based refinement, the core feature extraction is performed. The MFEBlock employs dilated convolutions to systematically enlarge the receptive field, enabling the capture of broad contextual information essential for identifying lens systems. The subsequent C3 module then effectively aggregates the multi-scale features generated by the MFEBlock, utilizing residual connections and feature concatenation to produce a semantically rich representation. Finally, the sequence concludes with a Coordinate Attention (CA) block (Hou et al., 2021) to capture direction-aware and position-sensitive information, which is crucial for the fine-grained localization of the target lens. In the final feature extraction stage only, an SPPF block (He et al., 2015) is appended to fuse features at multiple scales efficiently. The output of this entire module is then passed to the next stage of the backbone or serves as one of the three final feature maps for the detection head. The unique presence of the SPPF block in the last stage is highlighted in Figure 2.
In the feature fusion neck section, to effectively integrate features across different scales, we employ a feature fusion neck based on the Path Aggregation Network (PANet) architecture, a well-established enhancement to the classical Feature Pyramid Network (FPN) (Lin et al., 2017). This neck structure creates bidirectional information flow, combining a top-down path to propagate rich semantic features with a bottom-up path to preserve precise localization information. Let P3, P4, and P5 denote the multi-scale feature maps produced by the backbone. Prior to fusion, each map is passed through an SE block to recalibrate channel-wise feature responses. The process then unfolds in two stages.
The resulting feature maps from this bidirectional fusion process—P3, P4, and P5—are information-rich and serve as the final inputs to the detection head for generating predictions.
3.2 Loss function
The overall loss function (4), is a composite objective designed to train the model on three distinct tasks: objectness confidence prediction, class prediction, and bounding box localization. It is a weighted sum of a confidence loss (1), a classification loss (2), and a localization loss (3). Both the confidence and classification losses are implemented using the standard Binary Cross-Entropy (BCE) loss. The localization loss is calculated using the Generalized Intersection over Union (GIoU) (Rezatofighi et al., 2019), which offers more stability than the standard IoU for non-overlapping boxes. The individual loss components are defined as follows:
where
where the weights are set to
3.3 Training
In object-detection frameworks like ours, the training data already includes negative examples via the background regions of images that contain lenses. With enough training images, these backgrounds provide ample negatives, allowing the model to learn discriminative features without additional pure negative images. This follows standard practice in modern object detection networks (e.g., YOLO, Faster R-CNN), which typically do not train on entire negative images.
In our simulation-based pretraining, we supply many simulated lens images, whose background regions already yield numerous negative samples. Adding pure negative images would likely not improve performance and would introduce practical challenges: verifying that large numbers of candidate negatives truly contain no lenses is labor-intensive and error-prone, especially at the scale of the simulated dataset. However, during transfer learning on real data (see Section 4.2), where the training set is much smaller (
The model was trained using the Adam optimizer (Kingma and Ba, 2014) with a batch size of 32. The initial learning rate was set to
4 Results and discussion
To comprehensively assess the performance of LenNet, we employ a combination of quantitative metrics and qualitative analysis. For the quantitative evaluation, we adopt three standard metrics from the field of object detection: Precision, Recall, and the F1-score. The Recall measures the model’s ability to identify all actual gravitational lenses within the dataset, thus quantifying its completeness. Precision measures the reliability of the predictions, indicating what fraction of the identified candidates are actual lenses. A fundamental trade-off exists between these two metrics; for instance, a model can achieve high recall by lowering its detection threshold, but this often leads to an increase in false positives and a decrease in precision. The F1-score, which is the harmonic mean of precision and recall, provides a single, balanced metric that summarizes the model’s overall accuracy. These metrics are defined as:
Where TP is the True Positive, means that a predicted bounding box has an IoU with a ground-truth box that exceeds a predefined threshold (e.g.,
Beyond these numerical scores, it is crucial to understand how the model arrives at its predictions. To this end, we perform a qualitative analysis by visualizing the model’s internal feature maps. This interpretability technique allows us to peer inside the model’s “black box” and gain direct, intuitive insight into its decision-making process. Specifically, this analysis enables us to verify that LenNet learns to activate on physically meaningful structures—such as Einstein rings, arcs, or multiple images—rather than relying on spurious artifacts or background noise. This confirmation is vital for building trust in the model’s scientific utility and ensuring that its high performance is rooted in a genuine understanding of the underlying astrophysics.
4.1 The performance on the simulated dataset
This section details the quantitative performance of LenNet on our simulated dataset. We first characterize the model’s standalone effectiveness using standard evaluation metrics and then contextualize these results through a rigorous comparative analysis against established, state-of-the-art object detection models.
The initial phase of our evaluation focused on quantifying the intrinsic performance of LenNet. On the simulated test set, LenNet attains an F1 score of
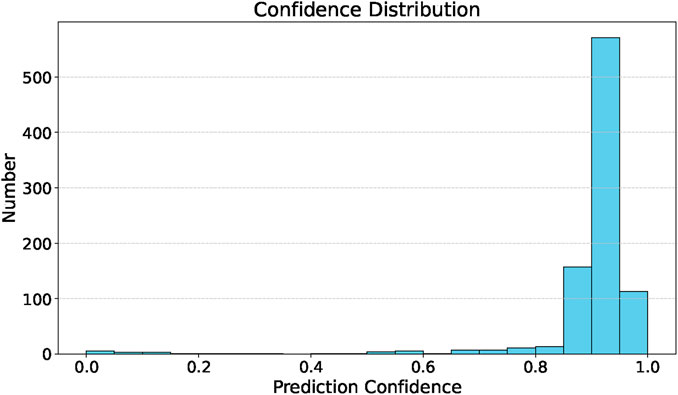
Figure 3. Confidence distribution of LeNet’s predicted candidates among the positive samples in the simulated dataset.
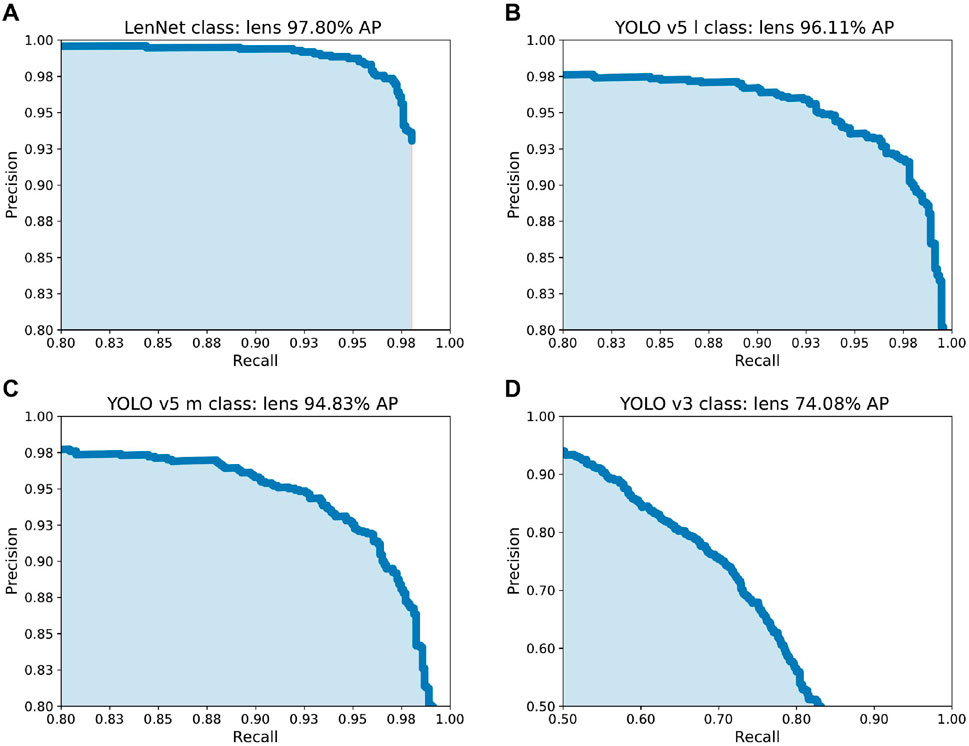
Figure 4. This figure shows the Precision-Recall curves and Average Precision (AP) — which is the area under the precision-recall curve, summarizing a model’s performance by averaging precision across all recall levels — of four different models (A): LenNet, (B): YOLO v5l, (C): YOLO v5m, (D): YOLO v3 on the “lens” category. It is worth noting that the results of Model D (YOLO v3) differ significantly from the other three models (A–C), so the scale of the coordinates has been adjusted.
To benchmark LenNet’s performance against existing technologies, we conducted a comparative analysis against several models from the YOLO family, which are widely regarded as state-of-the-art in general-purpose object detection. We selected three representative baselines: the classic YOLOv3 and two modern variants, YOLOv5m (medium) and YOLOv5l (large). All models, including LeNet and every network under test, were trained and evaluated under identical experimental conditions on our dataset to ensure a fair and unbiased comparison. The summarized results are presented in Table 1. The results unequivocally demonstrate that LenNet achieves superior performance across all evaluated metrics. Notably, LenNet’s F1-score of 97.11% surpasses that of the strongest baseline, YOLOv5l (94.52%), by a significant margin of 2.59 percentage points. This performance gap underscores the primary advantage of a specialized architecture. While the YOLO models are highly optimized for general-purpose object detection, LenNet’s design, particularly its MFEBlock modules, is explicitly tailored to discern the subtle and complex morphological features characteristic of gravitational lenses. This domain-specific adaptation allows it to achieve a level of precision and recall that even state-of-the-art generalist models cannot match, thereby validating our architectural design choices and establishing LenNet as a highly effective tool for this specialized scientific task.
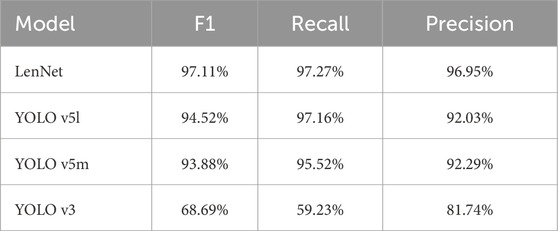
Table 1. Comparison of detection performance among different models on the simulated dataset, evaluated using F1-score, recall, and precision. LenNet achieves superior results across all metrics, significantly outperforming other baseline models.
4.2 Transfer learning to the real dataset
Although deep learning models demonstrate excellent performance on simulated data, their scientific utility is ultimately determined by their ability to generalize to real-world observations. A critical challenge in this transition is the “sim-to-real” gap, where subtle differences between simulated and real data can degrade performance.
For instance, in tasks like ionized nebula classification, strong gravitational lens substructure detection, and galaxy merger identification, differences between real and simulations in spectral features, image noise, and data distributions have been shown to reduce model accuracy (Belfiore et al., 2025; Alexander et al., 2023; Ćiprijanović et al., 2021), underscoring the need for techniques like transfer learning.
In this work, the real observations used for transfer learning consist of high-quality lens candidates identified in KiDS DR4 (Petrillo et al., 2019; Li et al., 2020; Grespan et al., 2024; Chowdhary et al., 2024). Since the criteria for a “high-quality” candidate vary across these publications, we adopt the classification specified in each respective source. While most of these candidates lack spectroscopic confirmation, their distinct morphological features in the images suggest a high likelihood of being genuine lenses. For the purpose of testing our networks, we treated these candidates as confirmed lenses. We collected a total of 401 lens candidates, with randomized positions in the
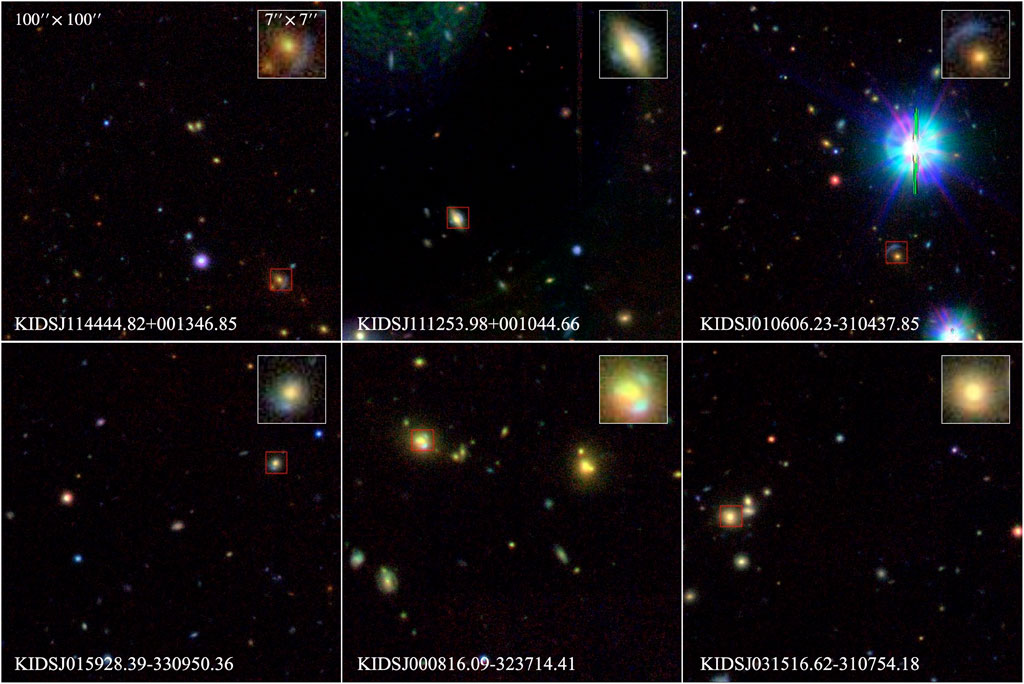
Figure 5. Examples of gravitational lens candidates from KiDS DR4 used for transfer learning. Each
To specifically quantify the impact of the “sim-to-real” gap and the necessity of transfer learning, we investigated the performance of LenNet and YOLO models on real images without transfer learning. The test shows that neither the LenNet nor the YOLO model achieves satisfactory performance on real-world images. When tested on 402 real-world images (including 201 with lenses and 201 without lenses), LenNet can only detect 93 targets with 13 false detections when the confidence threshold is set to 0.1. In contrast, under the same confidence threshold of 0.1, even the YOLO v5 l model, which performed best in tests on the simulated dataset, detected only 77 targets while having 73 false detections. These results clearly show the drawbacks of directly applying models trained on simulated data to real-world scenarios, highlighting why transfer learning is indispensable. Furthermore, the scarcity of labelled real-world astronomical data often precludes the reliable training of deep learning models from scratch. We employ transfer learning to address this challenge; this technique leverages knowledge from a model trained on a large, data-rich source domain (our simulations) and adapts it to a target domain with limited data (real observations) (Weiss et al., 2016). As established in Section 4.1, the superior feature extraction capabilities of LenNet ensure its pre-trained weights offer a robust foundation for fine-tuning on real images. This approach avoids training a model from scratch on a small dataset—a process prone to overfitting—by instead fine-tuning the existing powerful feature representations to the specific nuances of real survey data. The transfer learning experiment proceeded as follows: we utilized the LeNet model, pre-trained on a comprehensive simulated dataset, as the initial weights for fine-tuning on real-world data. Benefiting from the pre-trained weights’ ability to extract general features, this transfer-learning approach exhibits greater stability. To accelerate model convergence, we moderately increased the learning rate and fine-tuned the model on two small, independent datasets of real-world gravitational lens images. One dataset contains 400 images, consisting of 200 real lens-containing samples and 200 real lens-free samples; the other dataset contains 720 images, consisting of 360 real lens-containing samples and 360 real lens-free samples. Since lens-containing samples are the dominant samples for model training, the 400-image dataset is referred to as the “200-set” and the 720-image dataset as the “360-set” in the following context. To provide a direct performance benchmark, we also applied the identical fine-tuning procedure to YOLOv5m—the strongest baseline from our previous analysis—using the 200-image dataset. The comparative performance metrics are presented in Table 2. The fine-tuning experiments yield two key insights. Firstly, when both models are fine-tuned on the identical, limited dataset of 200 real images, LenNet significantly outperforms YOLOv5m. Specifically, LenNet achieves an F1-score of 89.47%, exceeding YOLOv5’s score of 81.77% by about eight percentage points. This outcome strongly suggests that the specialised features learned by LenNet during pre-training are more robust and directly transferable to real-world lens detection. LenNet’s architecture, tailored for astrophysical morphologies, provides a more effective starting point, allowing it to adapt more efficiently with limited target data than its general-purpose counterpart. Secondly, the performance of LenNet demonstrates positive scaling with the quantity of training data. When the fine-tuning dataset was expanded from 200-set to 360-set images, the model’s F1-score improved from 87.63% to 89.47%. This improvement confirms that while LenNet is effective with minimal data, its performance can be systematically enhanced as more labelled examples become available.
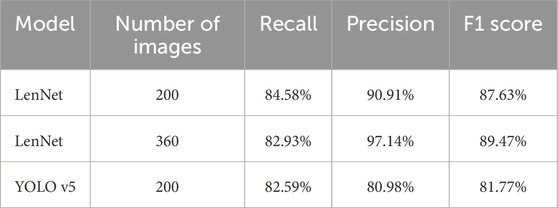
Table 2. Performance comparison of the LenNet and YOLOv5 models. Both models were pre-trained on the simulated dataset and subsequently fine-tuned on real lensing images via transfer learning. The second column specifies the number of real lensing images used for the fine-tuning phase.
In conclusion, these findings validate the effectiveness of our two-stage training strategy (simulation pre-training followed by real-data fine-tuning). The results not only highlight LenNet’s strong potential for immediate application in current astronomical surveys but also illuminate a path forward for its continuous improvement. As new gravitational lenses are discovered and validated, they can be incorporated into the fine-tuning set, creating a virtuous cycle where the model’s detection capabilities are progressively refined and enhanced over time.
4.3 Observe LenNet from the aspect of feature maps
Visualizing the model’s internal feature maps provides qualitative insight into its decision-making process. This interpretability analysis is critical for verifying that the model learns to identify physically meaningful structures and for fostering confidence in its application as a scientific instrument. For this analysis, we selected a representative test image (Figure 6) that features an unobscured gravitational lens. Crucially, this image also contains other astronomical objects with morphologies or sizes that could potentially confound the lens finders. We trace the data’s progression through the two primary architectural stages of LenNet: the backbone is used for initial feature extraction, and the FPN, which is part of the Feature Fusion Neck, facilitates feature fusion and refinement.
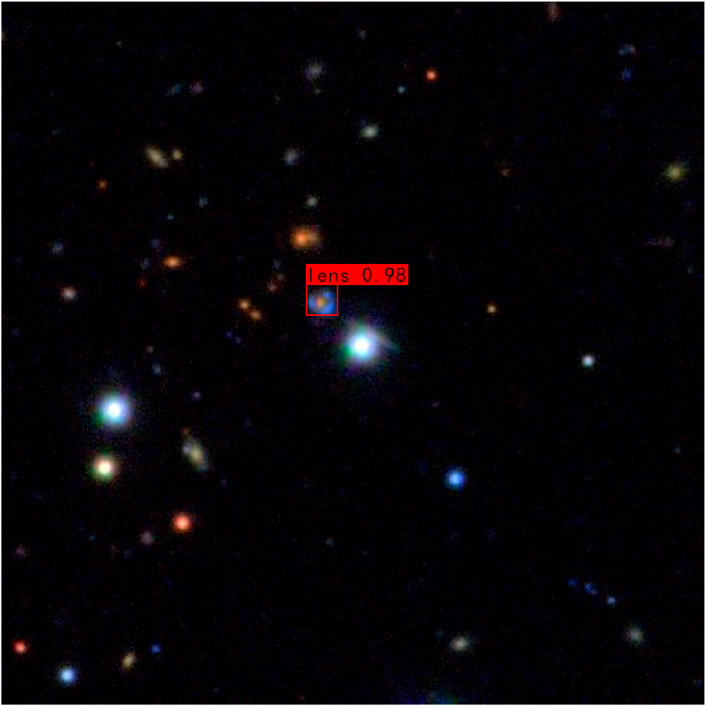
Figure 6. An example of a simulated gravitational lensing image containing an unobscured lens, used to illustrate the interpretability of the LenNet model. The red bounding box indicates the GGSL identified by the model.
The backbone serves as the foundational perception module of the network. Its role is to decompose the raw input image into a rich, hierarchical set of feature representations at multiple scales. Figure 7 displays the feature maps extracted from different layers of the backbone. As observed, the shallower layers capture low-level primitives such as edges, textures, and simple shapes. These activations are distributed across nearly all celestial objects in the frame, indicating that at this stage, the network is performing a broad, class-agnostic analysis of the visual information. As we progress to deeper layers, the features become more abstract and semantically complex, combining the initial primitives into representations of whole objects or significant parts thereof. At this stage, while activations are still present on multiple objects, the network has successfully generated a multi-scale inventory of all potentially salient structures in the image, providing the raw material for the subsequent detection stages.
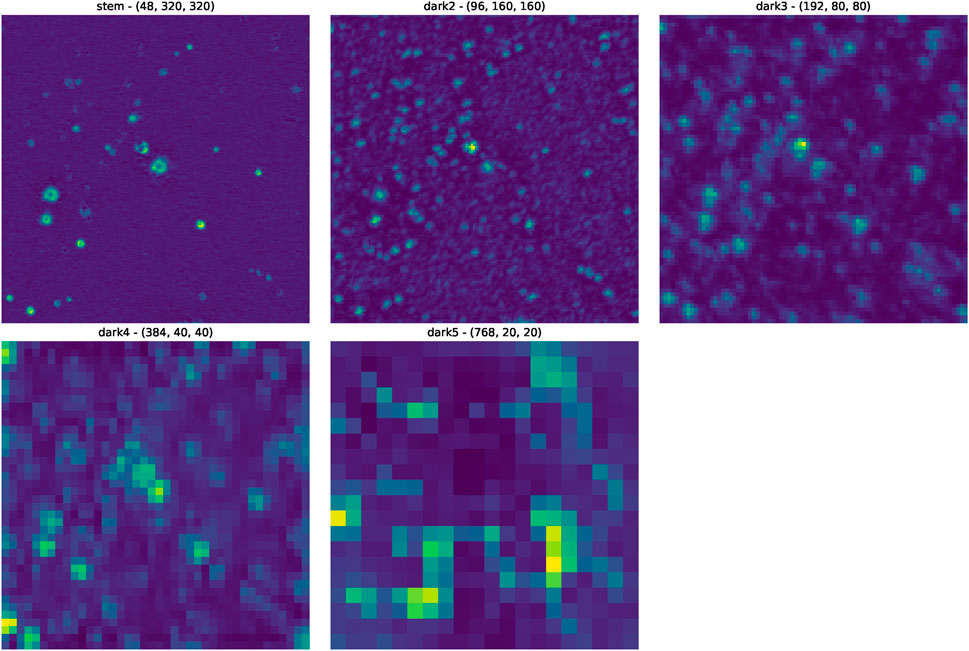
Figure 7. Feature maps from the LenNet backbone for the input survey image presented in Figure 6. In the image, the blue areas indicate regions where the network does not focus its attention. The “stem” layer denotes the feature map following initial feature extraction, with “dark2” to “dark5” representing feature maps processed by subsequent feature extraction blocks. The tensor shapes of these layers are also illustrated in the model architecture diagram.
The features extracted by the backbone are then processed by the FPN. The FPN’s critical function is to fuse information across different scales, enhancing features relevant to the target class (gravitational lenses) while suppressing background noise and features from irrelevant objects. Figure 8 visualizes the output feature maps from the FPN. The transformative effect of the FPN is immediately apparent. A stark contrast emerges between the diffuse activations in the backbone and the highly localized, high-intensity activations in the FPN maps. Across all three scales shown, the features corresponding to the gravitational lens are sharply and decisively enhanced. Simultaneously, the activations on neighboring galaxies and other distractor objects have been significantly attenuated. This visualization powerfully demonstrates that the FPN has learned to function as a highly effective spatial and semantic filter. It successfully integrates the multi-scale information from the backbone to converge on a high-confidence representation of the gravitational lens. This process creates a precise and unambiguous saliency map that provides clear guidance to the final detection head, enabling it to localize the lens with high accuracy. The clarity and focus of these final feature maps directly explain the high precision and recall scores reported in our quantitative analysis.
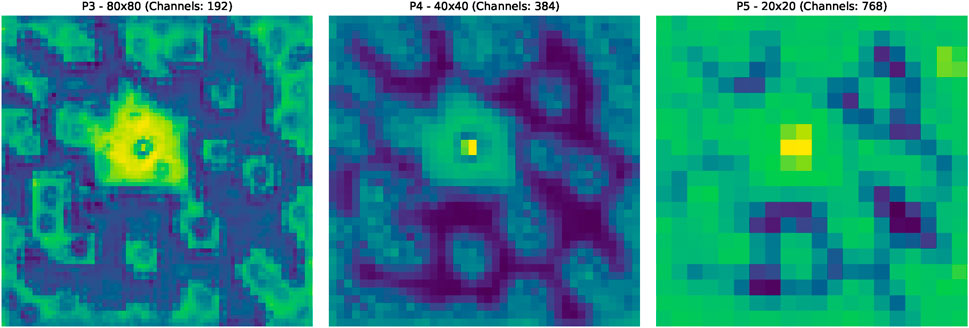
Figure 8. The Feature Pyramid Network (FPN) feature maps of the LenNet model for the input survey image presented in Figure 6. These three images represent the final output of the Feature Fusion Neck, which corresponds to the ultimate feature maps of LenNet. Notably, the yellow regions in the center are highly consistent across the images, suggesting a strong likelihood of the presence of a gravitational lens at these locations. In contrast, the blue areas indicate regions where the model does not focus its attention, implying that it considers these areas unlikely to contain gravitational lenses.
5 Conclusion
This paper presents LenNet, a high-performance model for the automated detection of gravitational lenses. Our results show that LenNet not only excels on simulated datasets but also achieves outstanding performance on real-world data. It significantly outperforms several mainstream detection models, with a recall of 97.27%, a precision of 96.95%, and a high F1-score of 97.11% on simulated test data. Furthermore, feature visualization analysis demonstrates LenNet’s ability to extract key gravitational lens characteristics even in complex astronomical backgrounds, highlighting its robustness and interpretability.
Following its success with simulated data, LenNet maintains strong performance under a transfer learning strategy. The model adapts well to new datasets and requires only a small amount of training data. This approach not only reduces training costs but also preserves high performance, underscoring LenNet’s efficiency and adaptability. Experimental results show that even with just the 200-set, LenNet achieves a recall of 84.58%, a precision of 90.91%, and an F1-score of 87.63%. With the 360-set, the model sees a clear performance boost: recall reaches 82.93%, precision rises to 97.14%, and the F1-score improves to 89.47%. These findings validate the model’s generalization capabilities and demonstrate its practical utility in low-resource scenarios. Compared to training from scratch, transfer learning greatly reduces computational costs, enhancing the model’s scalability.
LenNet clearly exhibits strong potential. With continued training on newly identified lenses, its performance can be further improved. This dynamic adaptability makes LenNet a valuable and evolving tool for gravitational lens detection and astronomical research. Looking ahead, as the volume of sky survey data continues to grow and new samples are accumulated, LenNet can be incrementally optimized through continuous learning. This positions it as a powerful solution for gravitational lens detection in large-scale astronomical imaging. With future deployments, LenNet is expected to support a wide range of practical applications and serve as an important tool in advancing astrophysics and cosmological studies.
Data availability statement
The original contributions presented in the study are included in the article/supplementary material, further inquiries can be directed to the corresponding author.
Author contributions
PL: Writing – original draft, Writing – review and editing, Investigation, Software, Methodology. HL: Writing – review and editing, Writing – original draft, Investigation, Data curation. ZL: Writing – original draft, Writing – review and editing, Methodology, Investigation. XC: Writing – original draft, Writing – review and editing. RuL: Writing – original draft, Investigation, Data curation, Project administration, Methodology, Writing – review and editing, Supervision. HS: Writing – review and editing, Software. RaL: Writing – review and editing. NN: Writing – review and editing. LK: Writing – review and editing. VB: Writing – review and editing. CT: Writing – review and editing. LG: Writing – review and editing.
Funding
The author(s) declare that financial support was received for the research and/or publication of this article. This work is supported by the National Natural Science Foundation of China (Grant No. 12588202), the China Manned Space Program with grant No. CMS-CSST-2025-A03. Rui Li acknowledges the National Natural Science Foundation of China (No. 12203050). Xiaoyue Cao acknowledges the support of the National Natural Science Foundation of China (No. 12303006). Ran Li is supported by the National Natural Science Foundation of China (Nos. 11773032, 12022306).
Acknowledgments
We acknowledge the use of OpenAI’s ChatGPT for assistance with language editing and refinement of this manuscript.
Conflict of interest
The authors declare that the research was conducted in the absence of any commercial or financial relationships that could be construed as a potential conflict of interest.
The author(s) declared that they were an editorial board member of Frontiers, at the time of submission. This had no impact on the peer review process and the final decision.
Generative AI statement
The author(s) declare that Generative AI was used in the creation of this manuscript. Use OpenAI's ChatGPT for assistance with language editing and refinement of this manuscript.
Any alternative text (alt text) provided alongside figures in this article has been generated by Frontiers with the support of artificial intelligence and reasonable efforts have been made to ensure accuracy, including review by the authors wherever possible. If you identify any issues, please contact us.
Publisher’s note
All claims expressed in this article are solely those of the authors and do not necessarily represent those of their affiliated organizations, or those of the publisher, the editors and the reviewers. Any product that may be evaluated in this article, or claim that may be made by its manufacturer, is not guaranteed or endorsed by the publisher.
Footnotes
1Li et al. (2024b) also employ a transformer-based neural network to directly search for GGSLs in full-survey images. However, their method still assumes a fixed “window size”, potentially missing lenses whose Einstein radius exceeds this predefined size
2Due to this choice, the LenNet neural network trained in this study is optimised to find GGSLs with LRG deflectors. Nevertheless, LenNet’s capabilities could be extended to identify GGSLs with disc or low-mass galaxy deflectors by introducing greater diversity and realism into the training set generation
References
Alexander, S., Gleyzer, S., Parul, H., Reddy, P., Tidball, M., and Toomey, M. W. (2023). Domain adaptation for simulation-based dark matter searches with strong gravitational lensing. Astrophysical J. 954, 28. doi:10.3847/1538-4357/acdfc7
Auger, M. W., Treu, T., Bolton, A. S., Gavazzi, R., Koopmans, L. V. E., Marshall, P. J., et al. (2010). The sloan lens ACS survey. X. Stellar, dynamical, and total mass correlations of massive early-type galaxies. Astrophys. J. 724, 511–525. doi:10.1088/0004-637X/724/1/511
Ballard, D. J., Enzi, W. J. R., Collett, T. E., Turner, H. C., and Smith, R. J. (2024). Gravitational imaging through a triple source plane lens: revisiting the ΛCDM-defying dark subhalo in SDSSJ0946+1006. Mon. Not. R. Astron. Soc. 528, 7564–7586. doi:10.1093/mnras/stae514
Belfiore, F., Ginolfi, M., Blanc, G., Boquien, M., Chevance, M., Congiu, E., et al. (2025). Machine learning the gap between real and simulated nebulae-a domain-adaptation approach to classify ionised nebulae in nearby galaxies. Astronomy Astrophysics 694, A212. doi:10.1051/0004-6361/202451934
Bertin, E., and Arnouts, S. (1996). SExtractor: software for source extraction. Astronomy Astrophysics Suppl. Ser. 117, 393–404. doi:10.1051/aas:1996164
Birrer, S., Millon, M., Sluse, D., Shajib, A. J., Courbin, F., Erickson, S., et al. (2024). Time-delay cosmography: measuring the hubble constant and other cosmological parameters with strong gravitational lensing. Space Sci. Rev. 220, 48. doi:10.1007/s11214-024-01079-w
Bolton, A. S., Burles, S., Koopmans, L. V. E., Treu, T., and Moustakas, L. A. (2006). The sloan lens acs survey. i. a large spectroscopically selected sample of massive early-type lens galaxies. Astrophysical J. 638, 703–724. doi:10.1086/498884
Cabanac, R. A., Alard, C., Dantel-Fort, M., Fort, B., Gavazzi, R., Gomez, P., et al. (2006). The cfhtls strong lensing legacy survey: I. survey overview and t0002 release sample. Astronomy. Astrophysics 461, 813–821. doi:10.1051/0004-6361:20065810
Cao, X., Li, R., Shu, Y., Mao, S., Kneib, J.-P., and Gao, L. (2020). LESSER: a catalogue of spectroscopically selected sample of Lyman-α emitters lensed by galaxies. Mon. Not. R. Astron. Soc. 499, 3610–3619. doi:10.1093/mnras/staa3058
Cao, X., Li, R., Li, N., Li, R., Chen, Y., Ding, K., et al. (2024). CSST strong lensing preparation: forecasting the galaxy-galaxy strong lensing population for the China space station telescope. Mon. Not. R. Astron. Soc. 533, 1960–1975. doi:10.1093/mnras/stae1865
Cao, X., Li, R., Nightingale, J. W., Massey, R., He, Q., Amvrosiadis, A., et al. (2025). Probing dark matter substructures with free-form modelling: a case study of the ‘jackpot’ strong lens. arXiv Preprint.
Cheng, C., Cao, X., Lu, N., Li, R., Yang, C., Rigopoulou, D., et al. (2020). ALMA [{N} {II}] 205 μm Imaging Spectroscopy of the Lensed Submillimeter Galaxy ID 141 at Redshift 4.24. Astrophys. J. 898, 33. doi:10.3847/1538-4357/ab980b
Chowdhary, N. B., Koopmans, L. V. E., Valentijn, E. A., Verdoes Kleijn, G., de Jong, J. T. A., Napolitano, N., et al. (2024). Automation of finding strong gravitational lenses in the kilo degree survey with U - DenseLens (denseLens + segmentation). Mon. Not. R. Astron. Soc. 533, 1426–1441. doi:10.1093/mnras/stae1882
Ćiprijanović, A., Kafkes, D., Downey, K., Jenkins, S., Perdue, G. N., Madireddy, S., et al. (2021). Deepmerge–ii. building robust deep learning algorithms for merging galaxy identification across domains. Mon. Notices R. Astronomical Soc. 506, 677–691. doi:10.1093/mnras/stab1677
Collett, T. E. (2015). The population of galaxy-galaxy strong lenses in forthcoming optical imaging surveys. Astrophys. J. 811, 20. doi:10.1088/0004-637X/811/1/20
Collett, T. E., and Auger, M. W. (2014). Cosmological constraints from the double source plane lens SDSSJ0946+1006. Mon. Not. R. Astron. Soc. 443, 969–976. doi:10.1093/mnras/stu1190
Dye, S., Furlanetto, C., Swinbank, A. M., Vlahakis, C., Nightingale, J. W., Dunne, L., et al. (2015). Revealing the complex nature of the strong gravitationally lensed system h-atlas j090311.6+003906 using alma. Mon. Notices R. Astronomical Soc. 452, 2258–2268. doi:10.1093/mnras/stv1442
Edge, A., Sutherland, W., Kuijken, K., Driver, S., McMahon, R., Eales, S., et al. (2013). The VISTA kilo-degree infrared galaxy (VIKING) survey: bridging the gap between low and high redshift. Messenger 154, 32–34. Available online at: https://ui.adsabs.harvard.edu/abs/2013Msngr.154...32E/abstract.
Euclid Collaboration Li, T., Collett, T. E., Walmsley, M., Lines, N. E. P., et al. (2025a). Euclid quick data release (q1). The strong lensing discovery engine d – double-source-plane lens candidates. arXiv Preprint.
Euclid Collaboration Walmsley, M., Holloway, P., Lines, N. E. P., Rojas, K., Collett, T. E., et al. (2025b). Euclid quick data release (Q1): The strong lensing discovery engine A – system overview and lens catalogue. arXiv e-prints. arXiv:2503.15324. doi:10.48550/arXiv.2503.15324
Gavazzi, R., Treu, T., Koopmans, L. V. E., Bolton, A. S., Moustakas, L. A., Burles, S., et al. (2008). The sloan lens ACS survey. VI. Discovery and analysis of a double einstein ring. Astrophys. J. 677, 1046–1059. doi:10.1086/529541
Grespan, M., Thuruthipilly, H., Pollo, A., Lochner, M., Biesiada, M., and Etsebeth, V. (2024). Teglie: transformer encoders as strong gravitational lens finders in kids-from simulations to surveys. Astronomy Astrophysics 688, A34. doi:10.1051/0004-6361/202449929
He, K., Zhang, X., Ren, S., and Sun, J. (2015). Spatial pyramid pooling in deep convolutional networks for visual recognition. IEEE Trans. pattern analysis Mach. Intell. 37, 1904–1916. doi:10.1109/tpami.2015.2389824
He, Q., Robertson, A., Nightingale, J. W., Amvrosiadis, A., Cole, S., Frenk, C. S., et al. (2025). Not so dark, not so dense: an alternative explanation for the lensing subhalo in sdssj0946+1006. arXiv Preprint.
Hou, Q., Zhou, D., and Feng, J. (2021). Coordinate attention for efficient mobile network design. In: Proceedings of the IEEE/CVF conference on computer vision and pattern recognition; 2024 June 16–22; Seattle, WA, USA: IEEE. p. 13713–13722.
Hu, J., Shen, L., and Sun, G. (2018). Squeeze-and-excitation networks. In: Proceedings of the IEEE conference on computer vision and pattern recognition; 2024 June 16–22; Seattle, WA, USA: IEEE. p. 7132–7141.
Ivezić, Ž., Kahn, S. M., Tyson, J. A., Abel, B., Acosta, E., Allsman, R., et al. (2019). LSST: from science drivers to reference design and anticipated data products. Astrophys. J. 873, 111. doi:10.3847/1538-4357/ab042c
Jacobs, C., Collett, T., Glazebrook, K., McCarthy, C., Qin, A. K., Abbott, T. M. C., et al. (2019). Finding high-redshift strong lenses in DES using convolutional neural networks. Mon. Not. R. Astron. Soc. 484, 5330–5349. doi:10.1093/mnras/stz272
Khanam, R., and Hussain, M. (2024). What is yolov5: a deep look into the internal features of the popular object detector. arXiv preprint arXiv:2407.20892. Available online at: https://arxiv.org/abs/2407.20892.
Kingma, D. P., and Ba, J. (2014). Adam: a method for stochastic optimization. arXiv preprint arXiv:1412.6980.
Koopmans, L. V. E., Treu, T., Bolton, A. S., Burles, S., and Moustakas, L. A. (2006). The sloan lens ACS survey. III. The structure and formation of early-type galaxies and their evolution since z ˜1. Astrophys. J. 649, 599–615. doi:10.1086/505696
Korytov, D., Hearin, A., Kovacs, E., Larsen, P., Rangel, E., Hollowed, J., et al. (2019). Cosmodc2: a synthetic sky catalog for dark energy science with lsst. Astrophysical J. Suppl. Ser. 245, 26. doi:10.3847/1538-4365/ab510c
Kuijken, K., Heymans, C., Hildebrandt, H., Nakajima, R., Erben, T., de Jong, J. T. A., et al. (2015). Gravitational lensing analysis of the kilo-degree survey. Mon. Not. R. Astron. Soc. 454, 3500–3532. doi:10.1093/mnras/stv2140
Kuijken, K., Heymans, C., Dvornik, A., Hildebrandt, H., de Jong, J. T. A., Wright, A. H., et al. (2019). The fourth data release of the kilo-degree survey: ugri imaging and nine-band optical-IR photometry over 1000 square degrees. Astron. Astrophys. 625, A2. doi:10.1051/0004-6361/201834918
Li, R., Napolitano, N. R., Tortora, C., Spiniello, C., Koopmans, L. V. E., Huang, Z., et al. (2020). New high-quality strong lens candidates with deep learning in the kilo-degree survey. Astrophys. J. 899, 30. doi:10.3847/1538-4357/ab9dfa
Li, R., Napolitano, N. R., Spiniello, C., Tortora, C., Kuijken, K., Koopmans, L. V. E., et al. (2021). High-quality strong lens candidates in the final kilo-degree survey footprint. Astrophys. J. 923, 16. doi:10.3847/1538-4357/ac2df0
Li, R., Napolitano, N. R., Xie, L., Li, R., Guo, X., Sergeyev, A., et al. (2024a). Multiband analysis of strong gravitationally lensed post-blue nugget candidates from the kilo-Degree survey. Astrophys. J. 973, 145. doi:10.3847/1538-4357/ad684c
Li, X., Sun, R., Lv, J., Jia, P., Li, N., Wei, C., et al. (2024b). CSST strong-lensing preparation: a framework for detecting strong lenses in the multicolor imaging survey by the china survey space telescope (CSST). Astron. J. 167, 264. doi:10.3847/1538-3881/ad395e
Li, R., Napolitano, N. R., Ago, G. D., Shalyapin, V. N., Zhu, K., Guo, X., et al. (2025). Optical+NIR analysis of a newly found einstein ring at z ∼1 from the kilo-degree survey: dark matter fraction, total and dark matter density slope and IMF. arXiv e-prints, arXiv:2503.10180. doi:10.48550/arXiv.2503.10180
Lin, T.-Y., Dollár, P., Girshick, R., He, K., Hariharan, B., and Belongie, S. (2017). Feature pyramid networks for object detection. In: Proceedings of the IEEE conference on computer vision and pattern recognition; 2017 July 21–26; Honolulu, HI, USA: IEEE. p. 2117–2125.
More, A., Cabanac, R., More, S., Alard, C., Limousin, M., Kneib, J.-P., et al. (2012). The cfhtls-strong lensing legacy survey (sl2s): investigating the group-scale lenses with the sarcs sample. Astrophysical J. 749, 38. doi:10.1088/0004-637x/749/1/38
Nagam, B. C., Barroso, J. A. A., Wilde, J., Andika, I. T., Manjón-García, A., Pearce-Casey, R., et al. (2025). Euclid: finding strong gravitational lenses in the early release observations using convolutional neural networks.
Neubeck, A., and Van Gool, L. (2006). Efficient non-maximum suppression. In: 18th international conference on pattern recognition (ICPR’06); 2006 Aug 20-24: IEEE, Vol. 3, 850–855. doi:10.1109/ICPR.2006.479
Nightingale, J. W., He, Q., Cao, X., Amvrosiadis, A., Etherington, A., Frenk, C. S., et al. (2024). Scanning for dark matter subhaloes in hubble space telescope imaging of 54 strong lenses. Mon. Not. R. Astron. Soc. 527, 10480–10506. doi:10.1093/mnras/stad3694
Nightingale, J., Mahler, G., McCleary, J., He, Q., Hogg, N. B., Amvrosiadis, A., et al. (2025). The cosmos-web lens survey (cowls) i: discovery of> 100 high redshift strong lenses in contiguous jwst imaging. arXiv preprint arXiv:2503.08777. doi:10.1093/mnras/staf1253
Oguri, M., Keeton, C. R., and Dalal, N. (2005). The impact of lens galaxy environments on the image separation distribution. Mon. Notices R. Astronomical Soc. 364, 1451–1458. doi:10.1111/j.1365-2966.2005.09697.x
Petrillo, C. E., Tortora, C., Chatterjee, S., Vernardos, G., Koopmans, L. V. E., Verdoes Kleijn, G., et al. (2017). Finding strong gravitational lenses in the kilo degree survey with convolutional neural networks. Mon. Notices R. Astronomical Soc. 472, 1129–1150. doi:10.1093/mnras/stx2052
Petrillo, C. E., Tortora, C., Vernardos, G., Koopmans, L. V. E., Verdoes Kleijn, G., Bilicki, M., et al. (2019). LinKS: discovering galaxy-scale strong lenses in the kilo-degree survey using convolutional neural networks. Mon. Not. R. Astron. Soc. 484, 3879–3896. doi:10.1093/mnras/stz189
Redmon, J., and Farhadi, A. (2018). Yolov3: an incremental improvement. arXiv preprint arXiv:1804.02767.
Rezatofighi, H., Tsoi, N., Gwak, J., Sadeghian, A., Reid, I., and Savarese, S. (2019). Generalized intersection over union: a metric and a loss for bounding box regression. In: Proceedings of the IEEE/CVF conference on computer vision and pattern recognition; 2019 June 15-20; Long Beach, CA, USA: IEEE. p. 658–666.
Rizzo, F., Vegetti, S., Powell, D., Fraternali, F., McKean, J. P., Stacey, H. R., et al. (2020). A dynamically cold disk galaxy in the early universe. Nature 584, 201–204. doi:10.1038/s41586-020-2572-6
Schneider, P., Ehlers, J., and Falco, E. E. (1992). Gravitational lenses. Berlin, Heidelberg: Springer. doi:10.1007/978-3-662-03758-4
Science Collaboration, LSST, Abell, P. A., Allison, J., Anderson, S. F., Andrew, J. R., Angel, J. R. P., et al. (2009). Lsst science book, version 2.0. arXiv preprint.
Shajib, A. J., Treu, T., Birrer, S., and Sonnenfeld, A. (2021). Dark matter haloes of massive elliptical galaxies at z ∼ 0.2 are well described by the navarro-frenk-white profile. Mon. Not. R. Astron. Soc. 503, 2380–2405. doi:10.1093/mnras/stab536
Shajib, A. J., Vernardos, G., Collett, T. E., Motta, V., Sluse, D., Williams, L. L. R., et al. (2024). Strong lensing by galaxies. Space Sci. Rev. 220, 87. doi:10.1007/s11214-024-01105-x
Sheu, W., Shajib, A. J., Treu, T., Sonnenfeld, A., Birrer, S., Cappellari, M., et al. (2025). Project dinos ii: redshift evolution of dark and luminous matter density profiles in strong-lensing elliptical galaxies across 0.1< z< 0.9. Mon. Notices R. Astronomical Soc., staf976. doi:10.1093/mnras/staf976
Shu, Y., Bolton, A. S., Kochanek, C. S., Oguri, M., Pérez-Fournon, I., Zheng, Z., et al. (2016a). The BOSS emission-line lens survey. III. Strong lensing of Lyα emitters by individual galaxies. Astrophys. J. 824, 86. doi:10.3847/0004-637X/824/2/86
Shu, Y., Bolton, A. S., Mao, S., Kochanek, C. S., Pérez-Fournon, I., Oguri, M., et al. (2016b). The BOSS emission-line lens survey. IV. Smooth lens models for the BELLS GALLERY sample. Astrophys. J. 833, 264. doi:10.3847/1538-4357/833/2/264
Shu, Y., Brownstein, J. R., Bolton, A. S., Koopmans, L. V. E., Treu, T., Montero-Dorta, A. D., et al. (2017). The sloan lens ACS survey. XIII. Discovery of 40 new galaxy-scale strong lenses. Astrophys. J. 851, 48. doi:10.3847/1538-4357/aa9794
Sonnenfeld, A., Treu, T., Marshall, P. J., Suyu, S. H., Gavazzi, R., Auger, M. W., et al. (2015). The sl2s galaxy-scale lens sample. v. dark matter halos and stellar imf of massive early-type galaxies out to redshift 0.8. Astrophysical J. 800, 94. doi:10.1088/0004-637x/800/2/94
Spergel, D., Gehrels, N., Baltay, C., Bennett, D., Breckinridge, J., Donahue, M., et al. (2015). Wide-field infrarred survey telescope-astrophysics focused telescope assets wfirst-afta 2015 report. arXiv preprint.
Su, H., Yi, Z., Liang, Z., Du, W., Liu, M., Kong, X., et al. (2024). Lsbgnet: an improved detection model for low-surface brightness galaxies. Mon. Notices R. Astronomical Soc. 528, 873–882. doi:10.1093/mnras/stae001
Treu, T. (2010). Strong lensing by galaxies. Annu. Rev. Astronomy Astrophysics 48, 87–125. doi:10.1146/annurev-astro-081309-130924
Treu, T., Dutton, A. A., Auger, M. W., Marshall, P. J., Bolton, A. S., Brewer, B. J., et al. (2011). The swells survey - i. a large spectroscopically selected sample of edge-on late-type lens galaxies: the swells survey - i. Mon. Notices R. Astronomical Soc. 417, 1601–1620. doi:10.1111/j.1365-2966.2011.19378.x
Treu, T., Suyu, S. H., and Marshall, P. J. (2022). Strong lensing time-delay cosmography in the 2020s. Astronomy Astrophysics Rev. 30, 8. doi:10.1007/s00159-022-00145-y
Vegetti, S., Lagattuta, D. J., McKean, J. P., Auger, M. W., Fassnacht, C. D., and Koopmans, L. V. E. (2012). Gravitational detection of a low-mass dark satellite galaxy at cosmological distance. Nature 481, 341–343. doi:10.1038/nature10669
Wang, Q., Wu, B., Zhu, P., Li, P., Zuo, W., and Hu, Q. (2020). Eca-net: efficient channel attention for deep convolutional neural networks. In: Proceedings of the IEEE/CVF conference on computer vision and pattern recognition; 2020 June 13-19; Seattle, WA: IEEE. p. 11534–11542.
Wang, C.-Y., Bochkovskiy, A., and Liao, H.-Y. M. (2023). Yolov7: trainable bag-of-freebies sets new state-of-the-art for real-time object detectors. In: Proceedings of the IEEE/CVF conference on computer vision and pattern recognition; 2023 June 17-24: Vancouver, BC, Canada: IEEE. p. 7464–7475.
Wedig, B., Daylan, T., Birrer, S., Cyr-Racine, F.-Y., Dvorkin, C., Finkbeiner, D. P., et al. (2025). The roman view of strong gravitational lenses. Astrophys. J. 986, 42. doi:10.3847/1538-4357/adc24f
Weiss, K., Khoshgoftaar, T. M., and Wang, D. (2016). A survey of transfer learning. J. Big data 3, 9–40. doi:10.1186/s40537-016-0043-6
Woo, S., Park, J., Lee, J.-Y., and Kweon, I. S. (2018). Cbam: convolutional block attention module. In: Proceedings of the European conference on computer vision (ECCV); 2018 September 8–14; Munich, Germany. p. 3–19.
Xie, L., Li, C., Wang, Z., Zhang, X., Chen, B., Shen, Q., et al. (2023). Shisrcnet: super-resolution and classification network for low-resolution breast cancer histopathology image. In: International conference on medical image computing and computer-assisted intervention; 2025 September 23-27. Berlin, Heidelberg: Springer. p. 23–32.
Keywords: machine learning, gravitational lensing, strong lensing, object detection, transfer learning, KiDS
Citation: Liu P, Li H, Li Z, Cao X, Li R, Su H, Li R, Napolitano NR, Koopmans LVE, Busillo V, Tortora C and Gao L (2025) LenNet: direct detection and localization of strong gravitational lenses in wide-field sky survey images. Front. Astron. Space Sci. 12:1656917. doi: 10.3389/fspas.2025.1656917
Received: 30 June 2025; Accepted: 23 September 2025;
Published: 14 October 2025.
Edited by:
Emilia Järvelä, University of Oklahoma, United StatesReviewed by:
Margherita Grespan, University of Oxford, United KingdomHanna Parul, Observatoire de Paris, France
Copyright © 2025 Liu, Li, Li, Cao, Li, Su, Li, Napolitano, Koopmans, Busillo, Tortora and Gao. This is an open-access article distributed under the terms of the Creative Commons Attribution License (CC BY). The use, distribution or reproduction in other forums is permitted, provided the original author(s) and the copyright owner(s) are credited and that the original publication in this journal is cited, in accordance with accepted academic practice. No use, distribution or reproduction is permitted which does not comply with these terms.
*Correspondence: Rui Li , bGlydWl3d0BnbWFpbC5jb20=