 Shengwen Zhang1,2
 Yanxia Zhang
- 1National Astronomical Observatories, Chinese Academy of Sciences, Beijing, China
- 2University of Chinese Academy of Sciences, Beijing, China
Stellar spectral classification plays a crucial role in understanding the intrinsic properties of stars, such as their temperature, composition, and luminosity. Current methods for star classification primarily rely on template fitting, color-magnitude cuts, or machine learning models that process raw 1D spectra or 2D spectral images. These approaches, however, are limited by two main factors: (i) degeneracies in spectral features that lead to confusion between adjacent spectral types, and (ii) an overreliance on flux-versus-wavelength representations, which may overlook complementary structural information. To address these limitations, we propose a novel multimodal framework for stellar spectral classification that combines 1D and 2D spectral data with audio-derived features. Motivated by the structural similarities between stellar spectra and audio signals, we introduce—for the first time—audio-inspired feature extraction techniques, including Mel spectrograms, MFCC, and LFCC, to capture frequency-domain patterns often ignored by conventional methods. Our framework employs an eight-layer CNN for processing spectral data, an EPSANet-50 for spectral images, and a three-layer CNN for audio-derived features. The outputs of these models are mapped to 256-dimensional vectors and fused via a fully connected layer, with attention mechanisms further enhancing the learning process. Experimental results demonstrate that while 1D spectral data with Coord Attention achieves an accuracy of 89.75
1 Introduction
Spectroscopic analysis is essential in modern astronomy, as spectra encode a wealth of physical information through their characteristic features, such as absorption and emission lines. These spectral signatures serve as powerful diagnostics for key astrophysical parameters, including effective temperature, surface gravity (logg), metallicity, and chemical abundances, often yielding the highest precision measurements among astronomical data sets.
Star-type classification from low-resolution spectra has received comparatively less attention than variable-star classification. Early surveys relied on manual MK standards (Gray and Corbally, 2014), while recent pipelines (Moradi et al., 2024; Zeraatgari et al., 2024) focus on star/quasar/galaxy separation rather than the nuanced O–M typing required for stellar population studies. Variable-star work benefits from abundant light-curve data and clear scientific drivers (period searches, distance ladders), whereas static spectral typing is often treated as a solved sub-task. We argue that residual degeneracies among adjacent spectral sub-types still limit current accuracy and that these can be mitigated by richer, audio-inspired representations.
Most existing approaches rely on raw flux values, continuum-normalized spectra, or dimensionality reduction techniques such as principal component analysis (PCA). These methods primarily treat spectra as one-dimensional sequences, while largely overlooking their signal-processing nature. In contrast, the field of audio processing has developed a rich set of feature extraction techniques, such as Mel spectrograms, linear frequency cepstral coefficients (LFCC), and Mel-frequency cepstral coefficients (MFCC), which are highly effective in capturing fine-grained spectral patterns. This gap motivates our work. In this study, we introduce for the first time the use of audio-inspired feature extraction techniques for stellar spectra. By transforming spectra into an “audio modality”, we extract complementary representations that highlight frequency-domain characteristics often missed by conventional approaches. Furthermore, we integrate these audio-derived features into a multimodal classification framework, demonstrating that they significantly enhance stellar spectral classification accuracy. Our contributions are twofold: (1) we bridge audio signal processing and astrophysical spectroscopy by adapting established audio feature extraction methods to stellar spectra, and (2) we show that incorporating this novel modality into multimodal learning improves classification performance beyond state-of-the-art baselines.
With the advent of large-scale spectroscopic surveys like Sloan Digital Sky Survey (SDSS), The Large Sky Area Multi-Object Fiber Spectroscopic Telescope (LAMOST), The Dark Energy Spectroscopic Instrument (DESI), and Gaia, the volume of available spectral data has grown exponentially, rendering traditional manual inspection by experts obsolete. Human-based classification and analysis are not only impractical for such vast data sets but also time-consuming and prone to subjective biases. To address these challenges, template-fitting techniques were initially adopted for automated spectral processing (e.g., Gray and Corbally, 2014). However, their accuracy is inherently limited by the completeness of template libraries and the degeneracies among physical parameters. In recent years, machine learning (ML) has emerged as a transformative tool for spectroscopic analysis, offering superior performance in parameter extraction and spectral classification. By leveraging the full information content of spectra—including subtle features often overlooked by conventional methods—ML algorithms can uncover complex patterns and correlations, thereby enabling more precise and robust measurements of stellar and galactic properties.
ML encompasses a diverse array of algorithms, each exhibiting distinct strengths and applicability in astronomical research. Li et al. (2025) employed a random forest (RF) algorithm to predict the luminosities of early-type stars from LAMOST spectra using effective temperature, surface gravity (log g), and metallicity as inputs, subsequently leveraging the predicted luminosities to estimate stellar masses. Similarly, Fang et al. (2025) utilized RF to identify M-type Young Stellar Object (YSO) candidates from low-resolution LAMOST spectra, demonstrating its efficacy in stellar classification tasks. Beyond stellar astrophysics, Ghaderi et al. (2025) combined Support Vector Machines (SVM) with 1D Convolutional Neural Networks (CNNs) for morphological classification of galaxies, showing that this hybrid approach significantly improved computational efficiency without sacrificing accuracy.
In the domain of extragalactic astronomy, Zeraatgari et al. (2024) systematically evaluated multiple ML models—including
In order to further improve the model’s ability to analyze spectral data, deep learning methods and multimodal models have been widely used in astronomical research. Moradi et al. (2024) proposed Fnet, which integrates a one-dimensional CNN with ResNet architectures of varying sizes to classify spectral data from stars, quasars, and galaxies into three distinct categories. Junell et al. (2025) combined four data modalities (photometry, image cutouts, metadata, spectra) to automatically classify subtypes of supernovae. Farr et al. (2020) employed Quasar Net, a ML-based classifier, to identify high-redshift quasars within the DESI dataset. Liu et al. (2018) demonstrated that CNNs can effectively extract valuable information from stellar spectra for classification, surpassing traditional methods. Fox Fortino et al. (2025) applied the attention mechanism model to the automatic classification of supernova subtypes and found that the classification accuracy was greatly improved compared to the DASH model (Muthukrishna et al., 2019). Recently, multi-modal approaches have gained prominence for enhancing model performance. By combining different types of data, these techniques can produce results that outperform those based on a single modality. For instance, Wu et al. (2023) put forward a model called IEF-SCNN, based on spectral 2D plotted images and 1D data, and improved the spectral classification performance. Kang et al. (2023) input the light curve into the Recurrent Neural Network (RNN) and the image modality of the light curve into the CNN. The two networks were combined to form an ensemble model. They found that the addition of the image modality data of the light curve improved the classification performance of periodic variable stars. Ait Ouahmed, R. et al. (2024) applied multi-modal CNNs for redshift measurements from photometric data, achieving remarkable accuracy. The CLIP algorithm, designed specifically for aligning multi-modal data, has also been utilized in astronomical applications. Rizhko and Bloom (2025) introduced the AstroM model, which employs CLIP-based self-supervised learning to align photometric metadata, light curves, and spectra, thereby improving classification results for variable stars.
Previous studies on stellar and variable star classification have extensively explored improvements from multiple perspectives, including the design of novel neural network architectures, the incorporation of additional data modalities such as photometry and spectra, the adoption of self-supervised learning strategies, and methods to mitigate data imbalance. While these approaches have significantly advanced classification performance, they primarily rely on either architectural innovations or the introduction of external data sources. In contrast, our work focuses on the intrinsic representation of the spectroscopic data itself. By drawing an analogy between stellar spectra and audio signals, we apply established audio signal processing techniques (e.g., Mel spectrogram, MFCC, LFCC) to derive complementary representations from the same spectral data. This allows us to construct a multimodal framework that leverages multiple perspectives of spectra—1D flux, 2D plotted images, and audio-derived features—without requiring additional observational data. To the best of our knowledge, this is the first study to introduce audio-inspired representations into stellar spectral classification, thereby providing a novel dimension of information extraction beyond conventional approaches.
Stellar spectra encode rich physical information that is essential for estimating astrophysical parameters and classifying stars. The more effectively we can extract and utilize these spectral features in various aspects, the more accurate and insightful our understanding of stellar properties becomes. In the era of big data astronomy, leveraging advanced data-driven approaches to maximize the utility of spectral information is key to achieving higher precision in astrophysical inference and uncovering novel discoveries. One such promising direction is inspired by an intriguing analogy: stellar spectra and audio signals both represent amplitude variations across a domain—wavelength for flux and time for audio—revealing patterns that are often subtle and complex.
This similarity suggests that techniques developed for audio signal processing may be effectively adapted for spectral analysis. In the field of audio analysis, feature extraction is a crucial step for capturing meaningful characteristics such as pitch, timbre, and energy. Methods like Mel spectrograms and MFCCs have been widely adopted for tasks such as speech recognition and sentiment analysis. For instance, Kundu et al. (2024) leveraged deep learning models applied to audio features such as MFCC and Mel spectrograms for sentiment analysis. Berriche et al. (2024) explored various ML models, including SVM, KNN, Decision Tree, and ResNet-18, for speech recognition. Alve et al. (2024) employed CNNs to analyze these features for diagnosing respiratory diseases, while Asadulaev et al. (2024) used Mel spectrograms for speech conversion tasks. Additionally, Lei et al. (2022) combined LFCC and Constant Q Cepstral Coefficients (CQCC) audio features with GMM-ResNet and GMMSENet architectures for spoofing speech detection.
This paper presents a multimodal model designed to extract numerical, visual and audio features from spectral data for stellar classification. We conduct experiments to evaluate the classification performance when different modalities of data are incorporated into the model. The results demonstrate that the inclusion of audio features significantly enhances the accuracy of spectral classification. The structure of this paper is as follows: Section 2 outlines the dataset and feature processing methods used. Section 3 describes the model architecture and attention mechanism employed. Section 4 presents and analyzes the experimental results. Finally, Section 5 provides a summary of our work, draws conclusions, and offers directions for future research.
2 Dataset
LAMOST (Cui et al., 2012; Luo et al., 2015) has generated tens of millions of spectra. To evaluate the effectiveness of our proposed method, we select low-resolution spectral data from LAMOST DR11. Specifically, we focus on eight types of star spectra, including O, B, A, F, G, K, and M types, as well as carbon stars, while screening the signal-to-noise ratio (SNR). For spectra with an

Table 1. The number of different type stars with
To process spectral data, it is essential to extract multiple data modalities. The first numerical modality is the spectral data itself. Since CNNs require fixed-length input, the spectral array must be truncated. Given that most spectral lines are concentrated in the blue region, we propose truncating the spectral array to the first 3 700 data points. The second visual modality uses plotted spectra as images, which is then fed into the model for classification. In addition to these two modalities, we incorporate techniques from the field of audio processing to preprocess the spectral data, extracting three key audio features: Mel spectrogram, MFCCs, and LFCCs. These audio features provide additional information, enriching the input data for improved classification performance.
Audio-derived features (Mel Spectrogram, MFCC, LFCC) are quantitative descriptors extracted from sound signals, mainly used in speech/audio processing and ML. These features each offer unique characteristics and are applied across various domains, for instance, Mel Spectrogram can be used for genre classification, MFCC for speech recognition, LFCC for spoofing speech detection.
Mel Spectrogram: The Mel spectrogram represents a time-frequency distribution where the frequency axis is transformed using the Mel scale, which approximates human auditory perception. This transformation is particularly useful in applications where the human-like perception of frequency is beneficial, such as in the analysis of stellar spectra for feature extraction or classification tasks in astronomy. The Mel spectrogram is also widely employed in areas such as speech and music analysis and deep learning tasks like automatic speech recognition (ASR) and genre classification.
MFCC: MFCC are derived by applying a discrete cosine transform (DCT) to the Mel spectrogram, capturing the spectral envelope of the signal. This feature representation is commonly used in speech recognition and speaker identification because it effectively models phonetic characteristics. In an astronomical context, MFCC can be adapted to capture key features in spectral data, such as the harmonic structure of emissions from celestial bodies.
LFCC: LFCC are similar to MFCC in that they provide a cepstral representation, but instead of using the Mel scale, LFCC utilize a linear frequency scale. This approach emphasizes higher-frequency components, which may be more prominent in certain types of astronomical spectra, such as in the analysis of light curves from variable stars or high-resolution spectral lines from distant galaxies. LFCC are particularly valuable in applications requiring sensitivity to fine spectral details, such as anti-spoofing mechanisms in speaker verification systems.
In this study, spectral feature extraction is performed using torchaudio’s built-in transforms. Specifically, the Mel spectrogram is computed using torchaudio.transforms.MelSpectrogram, with the following parameter settings:
The first step in processing the spectral data involves treating the input spectrum as an audio signal. A short-time Fourier transform (STFT) is then applied to convert the time-domain signal into a frequency-domain representation, enabling further extraction of time-frequency features for subsequent analysis. The calculation formula of STFT is as follows Equation 2:
where
A Mel filter bank consists of a series of triangular filters, where the center frequencies are evenly distributed according to the Mel scale. The total number of filters is governed by the
where
MFCC is defined as follows Equation 5:
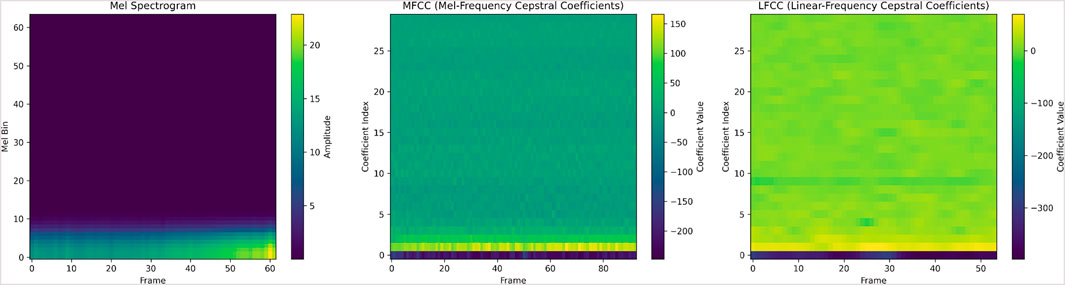
Figure 1. An example showing the Mel spectrogram, MFCC, and LFCC—three common audio features for an A-type star.
3 Methods
3.1 Workflow
For the same spectral dataset, we extract features from multiple modalities. The first numerical modality corresponds to spectral 1D data, the second visual modality to spectral 2D plotted images, the third audio modality to the Mel spectrogram derived by treating the spectral data as an audio signal, the fourth audio modality to the MFCC obtained through audio processing, and the fifth audio modality to the LFCC derived via audio processing. Figure 2 presents the workflow of our proposed model, which outlines a multimodal framework designed for stellar classification. This framework integrates various data representations, each contributing uniquely to the classification process. The components of the model are as follows:
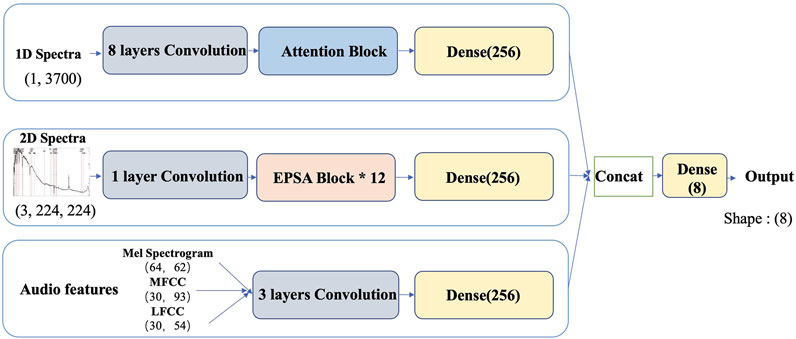
Figure 2. Overall model architecture.
Top branch: A CNN processes specrtal flux data, extracting frequency patterns.
Middle branch: The EPSANet (Efficient Pyramid Split Attention Network; Zhang et al., 2022) backbone analyzes 2D spectral images, leveraging PSA modules to resolve multiscale spectral features (e.g., absorption lines, and continuum shapes).
Bottom branch: Three parallel CNNs handle audio-derived features (Mel Spectrogram, MFCC, LFCC), each transformed via identical 3-layer CNNs to ensure consistency.
To process the 1D spectral data, we utilize an eight-layer CNN. For the 2D spectral image data, we deploy the Epsanet-50 model, a deep CNN architecture, for feature extraction. For the audio-based data (Mel spectrogram, MFCC, and LFCC), we apply a simple three-layer CNN.
Each modality is mapped to a 256-dimensional vector via a linear transformation, concatenated, and passed through a fully connected layer for classification. This unified approach enhances performance in classifying complex astronomical datasets, outperforming ResNet-based models in both accuracy and efficiency. We evaluate the classification performance both independently for each modality and after combining them. When modalities are combined, their features are first projected to 256-dimensional vectors, then merged and processed through a fully connected layer to produce the final 8-class output.
3.2 Model
EPSANet is a deep learning architecture designed to enhance feature representation through the integration of Pyramid Split Attention (PSA) modules. In contrast to ResNet, which primarily leverages residual connections, EPSANet introduces an efficient attention mechanism that adaptively captures cross-channel and spatial dependencies at multiple scales, enabling richer contextual information extraction with reduced computational overhead.
The SE (Squeeze-and-Excitation) weight module serves as a fundamental building block for the attention mechanisms in EPSANet, although it is ultimately superseded by the more sophisticated PSA design. The SE block is recalibrating channel-wise feature responses by modeling the interdependencies between channels. By adaptively adjusting the channel-wise weights, the SE module enhances feature representation, but its limitations in handling multiscale spatial patterns are addressed by the more advanced PSA mechanism in EPSANet.
The PSA mechanism represents a key innovation in EPSANet. As illustrated in Figure 3, the PSA module operates by splitting the input features into multiple branches, each utilizing different kernel sizes (e.g., 3
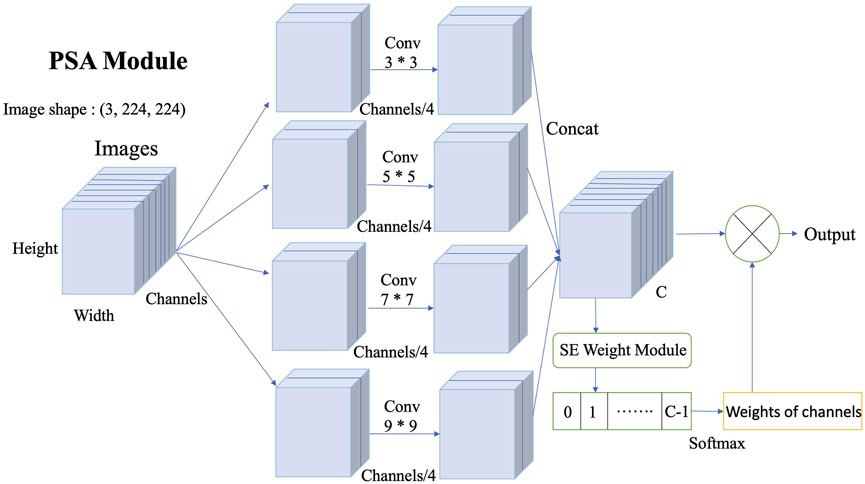
Figure 3. PSA Module. PSA Module divides the input image into four parts of the channel, applies different sizes of convolution kernels (3*3, 5*5, 7*7, 9*9) to each of the four parts of the channel, and then merges the different channels, and then generates the attention weights of the different channels through SEWeight Module, and multiplies the data of the different channels by the attention weights of the different channels, to obtain the output result, which is obtained through PSA Module. Then we can obtain different scales of features in different channels of the image and give them different attention weights, avoiding the single-size convolution kernel that focuses only on local features or global features.
The EPSA block, as illustrated in Figure 4, integrates PSA modules within a residual block framework. Each block processes features through parallel convolutional paths, applies attention-based fusion, and incorporates skip connections to maintain effective gradient flow. This hierarchical refinement allows the network to progressively extract high-level features, such as complex celestial structures in astronomical images, while preserving computational efficiency. By leveraging multi-scale attention and residual connections, the EPSA block enhances the network’s ability to capture intricate spatial relationships within astronomical data, facilitating more precise feature extraction and analysis.
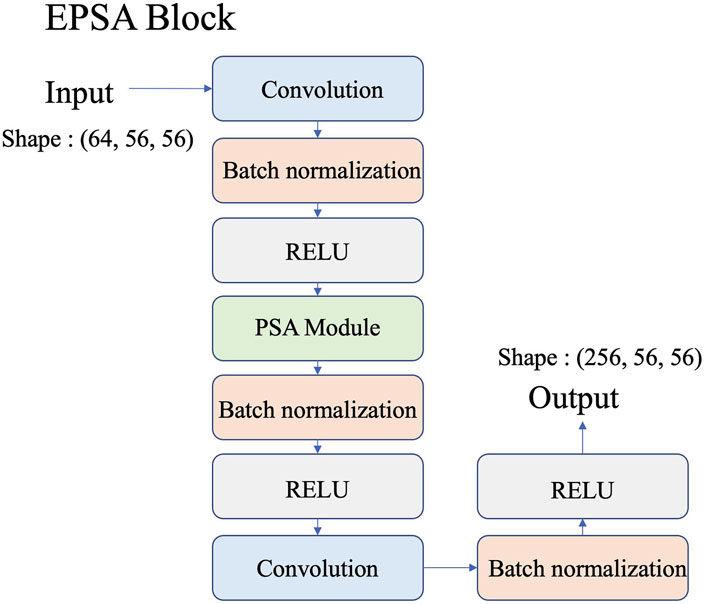
Figure 4. EPSA block.
3.3 Attention mechanisms
While the base CNN architecture provides a strong foundation for spectral classification, incorporating attention mechanisms may allow the model to focus on more informative spectral features. Therefore, we explore the impact of different attention modules on classification accuracy.
Gated Channel Transformation (GCT): GCT is a lightweight and effective channel attention mechanism designed to model inter-channel dependencies with minimal computational overhead. It begins by computing the L2 norm of each feature channel to capture its global activation strength. These responses are then normalized across channels and a learnable gating mechanism is applied, involving scale and bias parameters followed by tanh activation, to produce adaptive channel-wise weights. Finally, these weights modulate the original feature maps, enabling the model to selectively emphasize informative channels while suppressing less relevant ones.
SE Module: The SE module recalibrates channel-wise feature responses by explicitly modeling interdependencies between channels (Hu et al., 2018). It utilizes global average pooling to extract channel descriptors, which are then processed through two fully connected layers with a bottleneck design. After passing through a sigmoid activation, the output is used to reweight the input feature maps, emphasizing the most discriminative spectral features.
Efficient Channel Attention (ECA): ECA refines the SE module by eliminating dimensionality reduction while maintaining efficient cross-channel interactions (Wang et al., 2020). Rather than using fully connected layers, ECA employs a 1D convolution with an adaptively determined kernel size based on the number of channels. This results in improved computational efficiency and facilitates effective channel attention learning with minimal parameter overhead.
Bilateral Attention Module (BAM): BAM incorporates both channel and spatial attention for enhanced feature refinement (Zhang et al., 2021). The channel attention submodule applies global average pooling followed by a multi-layer perceptron, while the spatial attention submodule consists of convolutional layers with dilated convolutions. The outputs of these submodules are combined multiplicatively with the input feature maps, focusing on salient spectral-spatial patterns.
Coordinate Attention (CoordAtt): CoordAtt improves spatial attention by decomposing global pooling into separate height- and width-wise pooling operations (Hou et al., 2021). The pooled features are concatenated and passed through a shared transformation layer before being split into two attention branches. These branches produce attention weights that are applied to the original feature map, capturing long-range dependencies effectively along both spatial dimensions.
Criss-Cross Attention (CCA): CCA introduces an efficient self-attention mechanism that focuses on contextual information along both horizontal and vertical directions (Huang et al., 2023). By aggregating features from cross-shaped receptive fields at each spatial location, CCA captures long-range dependencies while reducing computational complexity compared to conventional self-attention mechanisms. The attention maps are iteratively refined, enhancing spatial feature modeling.
These attention mechanisms are integrated into CNN architectures to evaluate their influence on spectral classification accuracy. Their ability to refine feature representations and improve model robustness is assessed, highlighting their effectiveness in enhancing the network’s ability to learn discriminative patterns from spectral data, particularly in applications like astronomical image analysis.
3.4 Performance metrics
A confusion matrix (see Table 2) is a widely utilized tool in the evaluation of classification models (or “classifiers”), particularly in the context of testing datasets with known true values. It provides a comprehensive view of the model’s performance by presenting a detailed breakdown of its predictions. Below, the equations for accuracy, (Equation 6) precision, (Equation 7) recall and (Equation 8) F1-score (Equation 9) is provided, respectively.
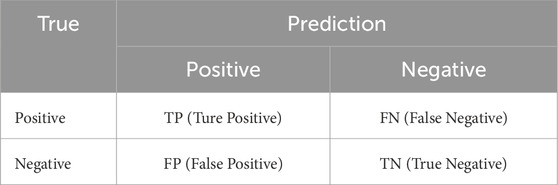
Table 2. Confusion matrix.
Accuracy provides an overall measure of the proportion of correctly classified samples among all predictions.
Precision focuses on positive predictions, measuring the proportion of correctly classified positive samples among all samples predicted as positive. High precision indicates that the model is less likely to misclassify negative cases as positive.
Recall evaluates coverage of the actual positive class, quantifying the proportion of correctly identified positive samples among all true positives. High recall implies that the model effectively captures most positive cases, minimizing missed detections.
F1-score is the harmonic mean of precision and recall, providing a balanced assessment when there is a trade-off between these two metrics. It is particularly valuable in scenarios with imbalanced classes or unequal error costs.
By jointly considering these metrics, we obtain a holistic view of model performance: accuracy reflects overall correctness, precision and recall highlight class-specific behaviors, and the F1-score integrates both to provide a balanced evaluation.
4 Results
To evaluate the classification performance of different modalities, we conduct a series of comparative experiments. By testing the classification accuracy for each individual modality on the same dataset, we are able to directly compare the effectiveness of spectral 1D data, 2D images, and audio modalities against the performance achieved by combining these modalities. This provides further insight into how the inclusion of audio modality data can improve spectral classification results. For different experiments, we use confusion matrix and accuracy, precision, recall, F1-score to evaluate the model performance. All tests are performed using the same dataset, specifically the eight-class star classification experiment based on the LAMOST spectral data, as described in Section 2. Our experiments are implemented within the PyTorch framework. During training, we employ the Adam optimizer and use the cross-entropy loss function. We ensure model convergence by training for 500 epochs in each experiment, with a learning rate set to 0.0005. All experiments are conducted on an NVIDIA A100 GPU.
For 1D spectral data, we investigate the impact of integrating various attention mechanisms, alongside the baseline case without any attention mechanism, into a CNN for classifying spectral data. The performance results are summarized in Table 3. In the absence of an attention mechanism, the CNN achieves a classification accuracy of 87.17% on the spectral dataset. Introducing the BAM module boosts the accuracy to 89.13%, while incorporating the GCT module yields a further improvement, reaching 89.19%. The SE attention mechanism produces an accuracy of 88.54%, with the ECA and Criss-Cross Attention modules achieving accuracies of 88.13% and 88.41%, respectively. Notably, the Coord Attention mechanism achieves the highest classification accuracy of 89.37%. These findings underscore the consistent enhancement in classification performance when attention mechanisms are added to the CNN compared to the baseline model without attention. Since the Coord Attention mechanism delivers the best performance, it is selected for use in all subsequent experiments involving spectral data.
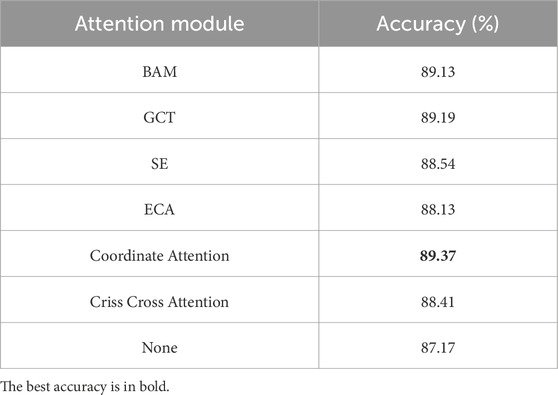
Table 3. Classification performance for different attention modules.
Next, we perform multimodal experiments to compare the impact of different modal data on classification accuracy. We conduct ten experiments on data from different modalities, setting different random number seeds to ensure that the dataset is divided into different training, validation, and test sets for each experiment. The mean and standard deviation of the accuracy of the ten experiments are calculated. To assess whether the classification performance differences between models trained with 1D spectral data alone and those trained with additional modalities (image and audio) are statistically significant, we conduct a power analysis based on independent two-sample
For the comparison between the spectral-only model and the multimodal (spectrum + image + audio) model, the observed effect size is Cohen’s
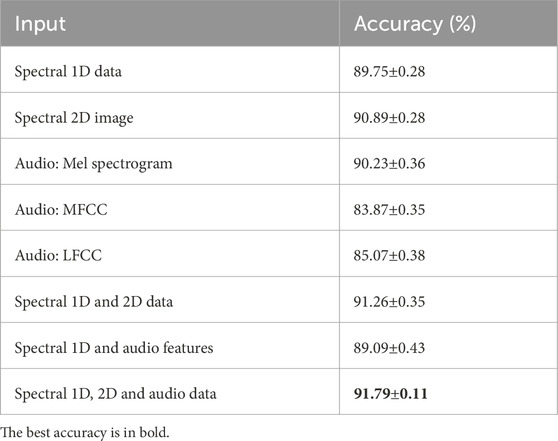
Table 4. Classification performance with different inputs.
Subsequently, we combine multiple modalities to boost the performance of the model. When both spectral 1D data and 2D images are input together, the classification accuracy increases to 91.26
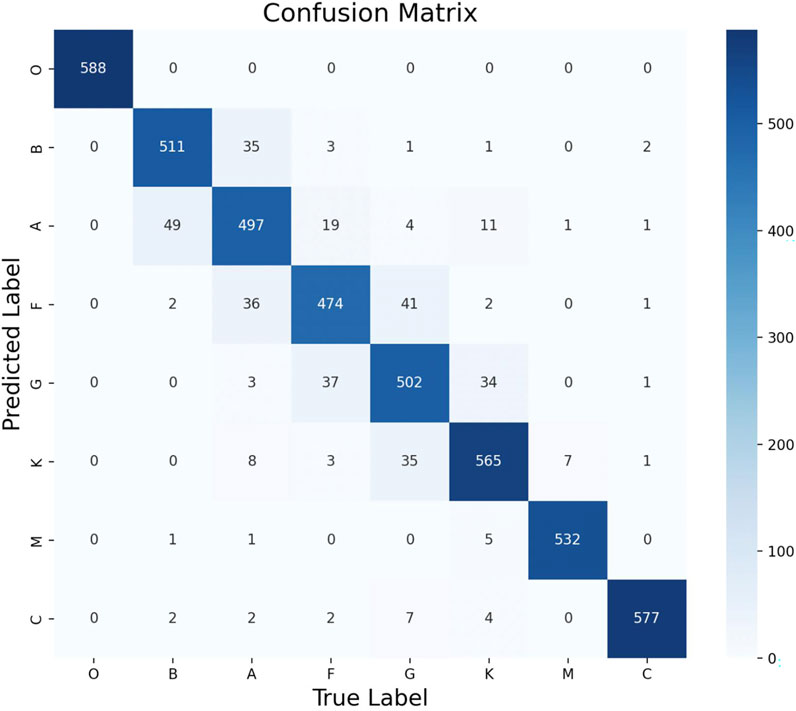
Figure 5. Classification confusion matrix with spectral 1D data, 2D images and audio features. “C” means carbon star.
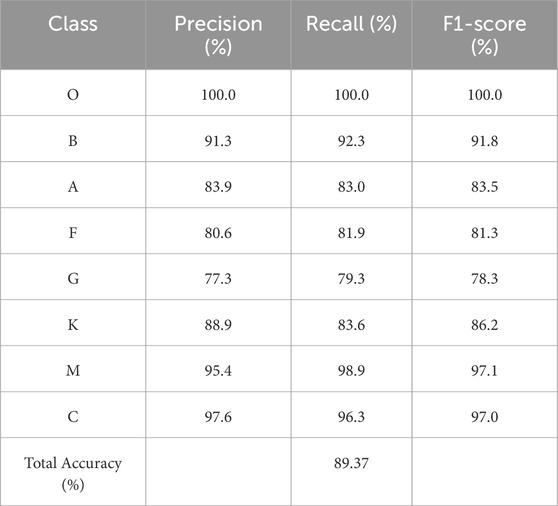
Table 5. The classification performance only with 1D spectra.
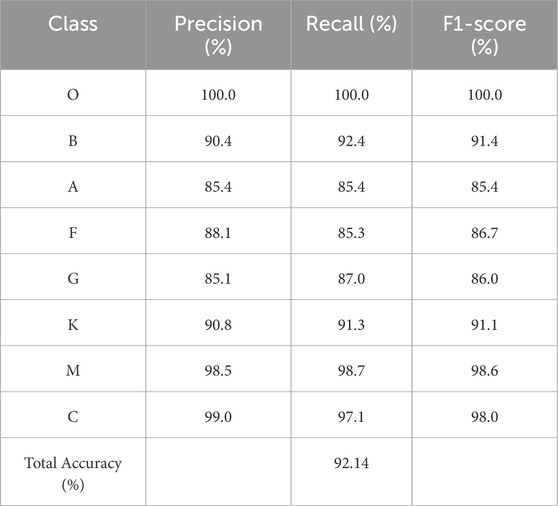
Table 6. The classification performance with spectral 1D and 2D data as well as audio features.
5 Conclusion
This study introduces an innovative multimodal framework that combines spectral 1D data, 2D plotted images, and audio-transformed features, significantly enhancing spectral classification performance. Our experimental results demonstrate that: (1) audio-based representations of LAMOST low-resolution spectra outperform conventional 1D spectral analysis in classification accuracy, and (2) the integrated multimodal approach leads to further performance improvements, positioning audio feature extraction as a promising complementary approach in spectral data analysis.
Going beyond conventional deep learning architectures, our work spearheads a data-centric revolution by:
The successful integration of audio processing techniques with spectral analysis opens new avenues for:
Our results suggest that the audio-based representation is not merely a mathematical transformation but may also preserve the underlying physical characteristics of stellar spectra. In particular, the distinctive absorption lines that are essential for differentiating stellar types appear to be reflected in their corresponding audio features, allowing neural networks to potentially identify these physical signatures from the audio domain. This further implies that some of the key physical features used in classifying variable stars from their light curves might also be captured in the audio representation, where such transformations could enhance the visibility of subtle variability patterns. In addition, the fact that absorption and emission features may be embedded in the audio domain indicates that, in the future, this approach could potentially be extended to other celestial object classification, physical parameter measurement, although further investigations are required to validate this possibility. All implementation details and source code are available at our GitHub repository: https://github.com/leon129101-leo/spectrum-with-audio-feature.
In summary, by transcending traditional spectral analysis through innovative multimodal integration, this study provides immediate improvements in classification tasks and offers a framework for data representation innovation in astronomy. It positions audio-feature analysis as a valuable tool in the era of big astronomical data. The success of this framework suggests that future breakthroughs in astrophysical data analysis may increasingly emerge from the creative cross-pollination of astronomy and other data-rich fields, rather than solely from advancements in neural network architectures.
Data availability statement
Publicly available datasets were analyzed in this study. This data can be found here: https://www.lamost.org/lmusers/.
Author contributions
SZ: Data curation, Formal Analysis, Investigation, Methodology, Software, Writing – original draft. YZ: Data curation, Funding acquisition, Project administration, Supervision, Validation, Visualization, Writing – review and editing. CL: Data curation, Funding acquisition, Project administration, Supervision, Validation, Visualization, Writing – review and editing.
Funding
The author(s) declare that financial support was received for the research and/or publication of this article. This paper is funded by the National Key R&D Program of China grants No. 2019YFA0405500, and the National Natural Science Foundation of China (Grant Nos.12273076 and 12133001).
Acknowledgments
We are very grateful to the reviewers for their valuable feedback and constructive suggestions, which have greatly improved the quality of this work. The Guoshoujing Telescope (the Large Sky Area Multi-object Fiber Spectroscopic Telescope, LAMOST) is a National Major Scientific Project built by the Chinese Academy of Sciences. Funding for the project has been provided by the National Development and Reform Commission. LAMOST is operated and managed by the National Astronomical Observatories, Chinese Academy of Sciences.
Conflict of interest
The authors declare that the research was conducted in the absence of any commercial or financial relationships that could be construed as a potential conflict of interest.
The author(s) declared that they were an editorial board member of Frontiers, at the time of submission. This had no impact on the peer review process and the final decision.
Generative AI statement
The author(s) declare that Generative AI was used in the creation of this manuscript. Generative AI was used solely for grammar checking and language polishing in the preparation of this manuscript.
Any alternative text (alt text) provided alongside figures in this article has been generated by Frontiers with the support of artificial intelligence and reasonable efforts have been made to ensure accuracy, including review by the authors wherever possible. If you identify any issues, please contact us.
Publisher’s note
All claims expressed in this article are solely those of the authors and do not necessarily represent those of their affiliated organizations, or those of the publisher, the editors and the reviewers. Any product that may be evaluated in this article, or claim that may be made by its manufacturer, is not guaranteed or endorsed by the publisher.
References
Ait Ouahmed, R., Arnouts, S., Pasquet, J., Treyer, M., and Bertin, E. (2024). Multimodality for improved cnn photometric redshifts. A&A 683, A26. doi:10.1051/0004-6361/202347395
Alve, S. R., Mahmud, M. Z., Islam, S., and Khan, M. M. (2024). Chronic obstructive pulmonary disease prediction using deep convolutional network. ArXiv abs/2411.02449. doi:10.48550/arXiv.2411.02449
Asadulaev, A., Korst, R., Shutov, V., Korotin, A., Grebnyak, Y., Egiazarian, V., et al. (2024). Optimal transport maps are good voice converters. CoRR. doi:10.48550/arXiv.2411.02402
Audenaert, J., Kuszlewicz, J. S., Handberg, R., Tkachenko, A., Armstrong, D. J., Hon, M., et al. (2021). TESS data for asteroseismology (T’DA) stellar variability classification pipeline: setup and application to the kepler Q9 data. Astronomical J. 162, 209. doi:10.3847/1538-3881/ac166a
Berriche, L., Driss, M., Almuntashri, A. A., Lghabi, A. M., Almudhi, H. S., and Almansour, M. A. (2024). A novel speech analysis and correction tool for Arabic-speaking children. Corr. abs/2411, 13592. doi:10.48550/arXiv.2411.13592
Cui, X. Q., Zhao, Y. H., Chu, Y. Q., Li, G. P., Li, Q., Zhang, L. P., et al. (2012). The large Sky area multi-object fiber spectroscopic telescope (LAMOST). Res. Astronomy Astrophysics 12, 1197–1242. doi:10.1088/1674-4527/12/9/003
Fang, X. S., Shi, J. R., Ding, M. Y., and Cao, Z. H. (2025). Lamost young stellar objects. i. spectroscopically identifying and characterizing m-type ysos. Astrophysical J. 984, 194. doi:10.3847/1538-4357/adc394
Farr, J., Font-Ribera, A., and Pontzen, A. (2020). Optimal strategies for identifying quasars in desi. J. Cosmol. Astropart. Phys. 2020 (015), 015. doi:10.1088/1475-7516/2020/11/015
Fox Fortino, W., Bianco, F. B., Protopapas, P., Muthukrishna, D., and Brockmeier, A. (2025). ABC-SN: attention based classifier for supernova spectra. doi:10.48550/arXiv.2507.22106
Ghaderi, H., Alipour, N., and Safari, H. (2025). Galaxy morphological classification with zernike moments and machine learning approaches. Astrophysical J. Suppl. Ser. 277, 10. doi:10.3847/1538-4365/ada8ab
Gray, R. O., and Corbally, C. J. (2014). An expert computer program for classifying stars on the mk spectral classification system. Astronomical J. 147, 80. doi:10.1088/0004-6256/147/4/80
Hou, Q., Zhou, D., and Feng, J. (2021). “Coordinate attention for efficient mobile network design,” in 2021 IEEE/CVF conference on computer vision and pattern recognition (CVPR), 13708–13717. doi:10.1109/CVPR46437.2021.01350
Hu, J., Shen, L., and Sun, G. (2018). “Squeeze-and-excitation networks,” in 2018 IEEE/CVF conference on computer vision and pattern recognition, 7132–7141. doi:10.1109/CVPR.2018.00745
Huang, Z., Wang, X., Wei, Y., Huang, L., Shi, H., Liu, W., et al. (2023). Ccnet: Criss-cross attention for semantic segmentation. IEEE Trans. Pattern Analysis Mach. Intell. 45, 6896–6908. doi:10.1109/TPAMI.2020.3007032
Junell, A., Sasli, A., Fontinele Nunes, F., Xu, M., Border, B., Rehemtulla, N., et al. (2025). Applying multimodal learning to classify transient detections early (AppleCiDEr) I. Data set, methods, infrastructure. doi:10.48550/arXiv.2507.16088
Kang, Z., Zhang, Y., Zhang, J., Li, C., Kong, M., Zhao, Y., et al. (2023). Periodic variable star classification with deep learning: handling data imbalance in an ensemble augmentation way. Publ. Astronomical Soc. Pac. 135, 094501. doi:10.1088/1538-3873/acf15e
Kundu, N. K., Kobir, S., Ahmed, M. R., Aktar, T., and Roy, N. (2024). Enhanced speech emotion recognition with efficient channel attention guided deep cnn-bilstm framework. Available online at: https://arxiv.org/abs/2412.10011,arXiv:2412.10011.
Lei, Z., Yan, H., Liu, C., Ma, M., and Yang, Y. (2022). “Two-path gmm-resnet and gmm-senet for asv spoofing detection,” in Icassp 2022 - 2022 IEEE international conference on acoustics, speech and signal processing (ICASSP) (IEEE), 6377–6381. doi:10.1109/icassp43922.2022.9746163
Li, Q., Xiong, J., Li, J., Guo, Y., Han, Z., Chen, X., et al. (2025). Mass, luminosity, and stellar age of early-type stars from the LAMOST survey. Astrophysical J. Suppl. Ser. 276, 19. doi:10.3847/1538-4365/ad8fa9
Liu, W., Zhu, M., Dai, C., He, D. Y., Yao, J., Tian, H. F., et al. (2018). Classification of large-scale stellar spectra based on deep convolutional neural network. Mon. Notices R. Astronomical Soc. 483, 4774–4783. doi:10.1093/mnras/sty3020
Luo, A. L., Zhao, Y. H., Zhao, G., Deng, L. C., Liu, X. W., Jing, Y. P., et al. (2015). The first data release (DR1) of the LAMOST regular survey. Res. Astronomy Astrophysics 15, 1095–1124. doi:10.1088/1674-4527/15/8/002
Molnar, T. A., Sanders, J. L., Smith, L. C., Belokurov, V., Lucas, P., and Minniti, D. (2022). Variable star classification across the Galactic bulge and disc with the VISTA Variables in the Vía Láctea survey. Mon. Notices R. Astronomical Soc. 509, 2566–2592. doi:10.1093/mnras/stab3116
Moradi, R., Rastegarnia, F., Wang, Y., and Mirtorabi, M. T. (2024). FNet II: spectral classification of quasars, galaxies, stars, and broad absorption line (BAL) quasars. Mon. Notices R. Astronomical Soc. 533, 1976–1985. doi:10.1093/mnras/stae1878
Muthukrishna, D., Parkinson, D., and Tucker, B. E. (2019). Dash: deep learning for the automated spectral classification of supernovae and their hosts. Astrophysical J. 885 (85), 85. doi:10.3847/1538-4357/ab48f4
Rizhko, M., and Bloom, J. S. (2025). AstroM3: a self-supervised multimodal model for astronomy. Astronomical J. 170, 28. doi:10.3847/1538-3881/adcbad
Sithajan, S., and Meethong, S. (2023). Applied machine-learning models to identify spectral sub-types of M dwarfs from photometric surveys, Applied Machine-Learning Models Identify Spectr. Sub-Types M Dwarfs Photometric Survey. San Francisco, CA: Publications of the Astronomical Society of the Pacific 135, 044502. doi:10.1088/1538-3873/acc974
Wang, Q., Wu, B., Zhu, P., Li, P., Zuo, W., and Hu, Q. (2020). “Eca-net: efficient channel attention for deep convolutional neural networks,” in 2020 IEEE/CVF conference on computer vision and pattern recognition (CVPR), 11531–11539. doi:10.1109/CVPR42600.2020.01155
Wu, J., Zhang, Y., Qu, M., Jiang, B., and Wang, W. (2023). Automatic classification of spectra with IEF-SCNN. Universe 9, 477. doi:10.3390/universe9110477
Zeraatgari, F. Z., Hafezianzadeh, F., Zhang, Y., Mei, L., Ayubinia, A., Mosallanezhad, A., et al. (2024). Machine learning-based photometric classification of galaxies, quasars, emission-line galaxies, and stars. Mon. Notices R. Astronomical Soc. 527, 4677–4689. doi:10.1093/mnras/stad3436
Zhang, Z., Lin, Z., Xu, J., Jin, W., Lu, S. P., and Fan, D. P. (2021). Bilateral attention network for rgb-d salient object detection. IEEE Trans. Image Process. (TIP) 30, 1949–1961. doi:10.1109/TIP.2021.3049959
Zhang, H., Zu, K., Lu, J., Zou, Y., and Meng, D. (2022). “Epsanet: an efficient pyramid squeeze attention block on convolutional neural network,” in Computer vision – accv 2022: 16th asian conference on computer vision, Macao, China, december 4–8, 2022, proceedings, Part III (Berlin, Heidelberg: Springer-Verlag), 541–557. doi:10.1007/978-3-031-26313-2_33
Keywords: astrostatistics, deep learning, machine learning, star classification, spectra
Citation: Zhang S, Zhang Y and Liu C (2025) Listening to stars: audio-inspired multimodal learning for star classification. Front. Astron. Space Sci. 12:1659534. doi: 10.3389/fspas.2025.1659534
Received: 04 July 2025; Accepted: 23 September 2025;
Published: 16 October 2025.
Edited by:
Didier Fraix-Burnet, UMR5274 Institut de Planétologie et d'Astrophysique de Grenoble (IPAG), FranceReviewed by:
Francisco Pérez-Galarce, University of the Americas, ChileYue Sun, Deutsches Elektronen Synchrotron (DESY), Germany
Copyright © 2025 Zhang, Zhang and Liu. This is an open-access article distributed under the terms of the Creative Commons Attribution License (CC BY). The use, distribution or reproduction in other forums is permitted, provided the original author(s) and the copyright owner(s) are credited and that the original publication in this journal is cited, in accordance with accepted academic practice. No use, distribution or reproduction is permitted which does not comply with these terms.
*Correspondence: Yanxia Zhang, enl4QGJhby5hYy5jbg==; Chao Liu, bGl1Y2hhb0BuYW8uY2FzLmNu