 C. Martinis
 J. W. Meriwether
 L. A. Navarro
- 1Center for Space Physics, Astronomy Department, Boston University, Boston, MA, United States
- 2Center for Solar-Terrestrial Research, New Jersey Institute of Technology, Newark, NJ, United States
- 3Space Weather Technology, Research, and Education Center, University of Colorado, Boulder, CO, United States
A Fabry–Perot interferometer (FPI) installed at El Leoncito Observatory, Argentina (31.8o S, 69.3o W, 18o mag lat), provides data on neutral winds and temperature over southern South America, a region lacking ground-based thermospheric observations. We present the climatology of neutral winds obtained from 630.0 nm airglow emissions. Results are shown for different seasons and different levels of solar activity. Temperature results are shown only for medium-to-high solar activity conditions. The modeled neutral winds show better agreement during high solar activity conditions. The modeled temperatures underestimate the observed values and do not reproduce the midnight temperature maximum observations. These observations will help improve model predictions of thermospheric parameters for this region.
1 Introduction
A Fabry–Perot interferometer (FPI) was installed at El Leoncito Observatory, Argentina (31.8o S, 69.3o W, 18o mag lat), in October 2018. Thermospheric models of neutral winds and temperature, such as the different versions of the horizontal wind model (HWM) and the mass spectrometer incoherent scatter radar (MSIS), respectively, incorporate limited data from a handful of low-earth orbit satellites passing over this region. No ground-based diagnostic has been available to study the thermospheric dynamics of this region until now. El Leoncito Observatory can be considered a mid-latitude site (∼32o glat) when describing neutral thermospheric events, but, due to the offset of the configuration of the Earth’s magnetic field relative to geographic coordinates, it is typically a low-latitude site (18o mag lat) when describing electrodynamical processes involving the neutral atmosphere interacting with the ionospheric plasma.
Measurements of low-latitude thermospheric winds, temperatures, and 630.0-nm relative intensities have been obtained at different locations (Mosarraf Hossain et al., 2023; Okoh et al., 2022; Meriwether et al., 2008). Temperatures typically show a strong dependence on solar flux conditions (Hernandez, 1982; Makela et al., 2013). The observed thermospheric zonal winds typically show an initial increase in eastward speed after sunset, which is then followed by a reduction in the midnight and early morning hours. This reduction in the zonal flow is most rapid in the local summer months. A study by Meriwether et al. (2008) using FPIs near the magnetic equator in western South America at Nazca and Jicamarca, Peru, showed nighttime winds that are eastward and equatorward. Navarro and Fejer (2020) derived wind-field observations from FPIs deployed at Jicamarca, Nazca, and Arequipa and obtained a long-term quiet-time climatological wind average over Peru, in agreement with the results from Meriwether et al. (1997). In the African sector, a review by Okoh et al. (2022) compared measurements from three FPIs at different latitudes. A study by Makela et al. (2013) showed 3 years of data from two equatorial stations in northeast Brazil. The thermospheric meridional winds show the expected signature of trans-equatorial flow from the summer to winter hemisphere. Meriwether et al. (2016) compared the thermospheric parameters measured over Peru and Brazil for September. The maximum zonal winds’ peak speeds for Peru and Brazil were 130 m/s–140 m/s and 80 m/s–90 m/s, respectively. The meridional wind behavior is dominated by a double-peaked structure, with the two peaks of equatorward (northward) winds separated by ∼6 h. At both locations, temperature variations showed the development of a midnight temperature maximum (MTM) near the local midnight.
Regarding the longitudinal sector where El Leoncito FPI is installed (∼70o W), previous results from the FPI operating at Arequipa, Peru (18.4o S, 73o W), show that the typical patterns included eastward winds until approximately 05:00 UT and meridional winds being equatorward, with decreased magnitudes, or even reversing, when the MTM was present (Meriwether et al., 1986). Near the equinox, the magnitude of the meridional winds was small (<50 m/s) throughout the night, with poleward (southward) flow after local midnight. In the June solstice, the meridional winds are southward with a magnitude of 50 m/s–100 m/s directed toward the winter hemisphere (southward). The results for other months show a smooth variation in the meridional wind from the equinoctial pattern of virtually no trans-hemispheric flow to the maximum poleward flow in the early evening hours in June. The magnitude of zonal winds near the equinox is close to zero by the early morning hours, while in the June solstice, they persist throughout the night, with the maximum near 22 LT–23 LT (∼03 UT–04 UT).
Biondi et al. (1991) observed increases in zonal wind velocities over Arequipa as the solar activity increased from minimum to maximum. The meridional winds show small velocities throughout the solar cycle. At the equinoxes, the early-night ∼50 m/s poleward (southward) meridional flow at the solar minimum becomes equatorward at the solar maximum, while at the winter solstice, the poleward early-night flow at the solar minimum is stronger (∼100 m/s), but, near the solar maximum, it becomes a weaker (<50 m/s) poleward flow.
The FPIs near the magnetic equator at the Jicamarca Radio Observatory, Nazca and Arequipa have provided long-term measurements (Meriwether et al., 2016; Navarro and Fejer, 2020) that have been used to improve empirical models such as the horizontal wind model (HWM; Drob et al., 2015). However, at higher latitudes close to the southern crest of the equatorial ionization anomaly (EIA), no long-term ground-based data have been recorded. Data from a campaign mode were obtained from an FPI in Carmen Alto, Chile (23.1° S, 69.4° W, −10.2° mag lat), during the solar minimum periods of September–October 1996 and July–October 1997. Martinis et al. (2001) compared Arequipa and Carmen Alto winds using a data set of 39 nights from Arequipa and 14 nights for Carmen Alto (September–October 1997) with 8 nights of simultaneous observations. Winds at Arequipa and Carmen Alto during the fall equinoxes and low solar activity are eastward all night long. The peak evening eastward zonal winds observed from Carmen Alto, which is located near the southern crest of the EIA, occurred ∼0.5 hs later and were weaker than the Arequipa winds. These measurements represent the first case of ground-based FPI observations of the so-called equatorial temperature and wind anomaly (ETWA) over such a small latitude range in the same longitude sector. The reduction in speed of ∼20%–25% at Carmen Alto relative to that at Arequipa was attributed to increased ion drag at Carmen Alto caused by the higher electron density within the EIA region at altitudes of 220 km–300 km.
In this study, we present results from an FPI located at El Leoncito Observatory operating almost continuously since October 2018. This location represents the southernmost place in the American sector where an FPI is operating.
2 The Fabry–Perot interferometer instrument
The FPI at El Leoncito Observatory (LEO FPI) measures winds and temperature for nightglow intensities of 100 R–200 R with an accuracy of ∼5 ms−1 and ∼15 K, respectively, for typical exposure times ranging from 150 to 300 s. The design of the instrument is similar to the design of the FPIs currently in operation at Jicamarca and Nazca in Peru (Meriwether et al., 2011; Makela et al., 2009), and it is nearly three times more sensitive than those in operation in Brazil (Meriwether et al., 2011). A filter wheel allows the selection of 630.0 nm or 557.7 nm wavelengths.
The LEO FPI uses a 70-mm clear-aperture etalon with a reflectivity of 77% at 630.0 nm and 90% at 557.7 nm. It has a 1.5 cm optically contacted etalon gap. The interference pattern is imaged onto a 1,024 × 1,024 pixel, 1.33 cm × 1.33 cm, CCD camera (Andor iKon 934 BV) equipped with a 4-stage thermoelectric cooler. A 2 × 2 binning is specified to reduce the effect of the readout noise. This CCD camera has low readout and low dark noise, allowing for the long integration times (150 s–300 s) required for excellent detection of the dim low-latitude 630.0 nm emission. A narrow-band filter with a 77-mm diameter and a full width at half maximum transmission (FWHM) of ∼0.8 nm and peak transmission T = 55% was initially used. Due to concerns of OH contamination in the 630.0-nm signal (Hernandez, 1974; Harding et al., 2018; Kerr et al., 2023), this filter was replaced by a narrower filter with a FWHM of 0.34 nm and a peak transmission of 92%. The interference ring pattern includes nearly eleven orders, covering a field of view of ∼1.5o.
The FPI is hosted in the same building as the all-sky imager that belongs to the Boston University network of all-sky imagers (ASIs) (Martinis et al., 2018). The top left of Figure 1 shows a picture of the shed where the FPI is installed, with the sky-scanner on the top of the roof. To the right is a map illustrating the location of El Leoncito and four points indicating the positions at 250 km for the four cardinal directions at a 45o elevation angle.
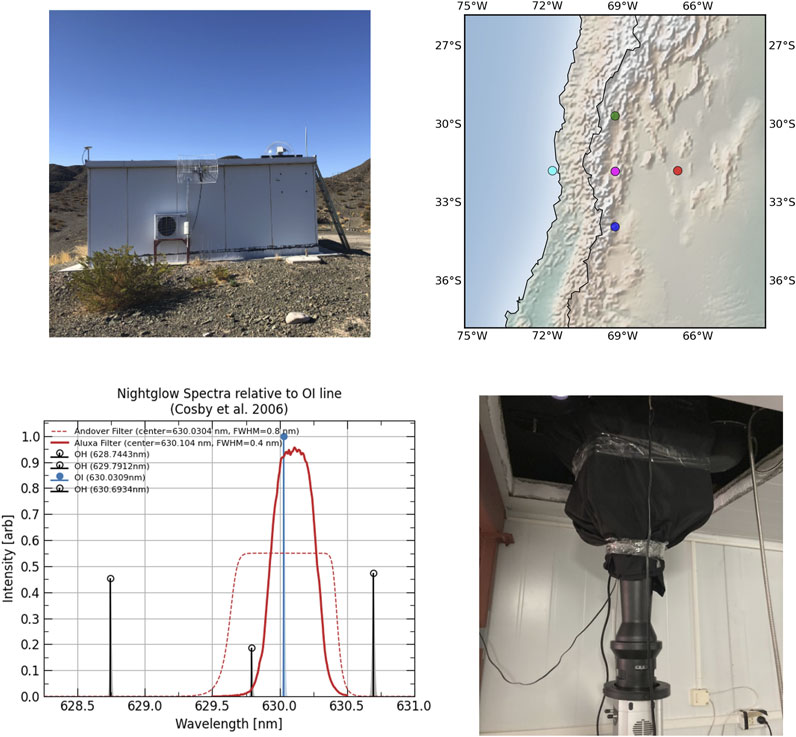
Figure 1. (Top left) Shed where the FPI is installed; (top right) location of El Leoncito FPI and the points at 250 km altitude for the cardinal directions at 45o elevation angle where observations were made; (bottom left) transmission curves of the filters of the FPI system. The dashed line shows the wide filter originally used, and the solid line shows the current narrower filter, also shown are OH spectral lines; (bottom right) inside view of the FPI system, located at the bottom is the camera with the apochromatic lens assembly attached and a black tarp covering the etalon and filter wheel on the top.
The shape of the 630.0-nm filter passband measured for the narrower filter using parallel rays of illumination is illustrated in the bottom left panel of Figure 1. The cone angle shift of the 630.0-nm passband caused by the 1.5o field of view is computed to be 0.02 nm, so the filter peak wavelength was specified to be 630.0325 to have the peak transmission wavelength be the same as the 630.0-nm nightglow line. The change in the transmission at the OH 628.9 nm was negligible. Comparison of the 630.0-nm nightglow results with both filters using the filter wheel to switch between them in sequential measurements revealed that the temperature was reduced by an average of ∼20 K using the narrower filter, with larger variations occurring when the 630.0-nm signal intensity was weak. No changes in the Doppler shift were seen for the 630.0-nm emission when comparing the two filters.
A sky-scanner placed above the FPI optics is used to observe the sky in any direction and downward toward a calibration chamber illuminated with a He–Ne laser. The sky-scanner is constructed with two parallel planar mirrors, one of which rotates to vary the elevation, and the other rotates to vary the azimuth. The absolute coordinate calibration of each axis is determined by the reference to the ephemeris of celestial objects (the Sun or the Moon). An absolute pointing accuracy of 0.2o is typically achieved. The FPI instrument function, which is required for the determination of temperatures, is obtained by observing for each order the emission from a frequency-stabilized He–Ne laser that illuminates a calibration chamber, which is essentially an integrating sphere. The laser creates a ring pattern at 632.8 nm. A shutter inserted between the laser and the fiber optics cable to the scattering chamber is kept closed by the computer to avoid contaminating each sky exposure with any laser emission signal.
In addition to the replacement of the interference filter by a narrower one to remove the potential contamination from OH spectral lines, another modification was made to the instrument configuration. The initial results showed that the temperatures measured were consistently higher than the model results from NRL-MSIS by ∼200 K, which we attributed in part to the poor quality of the objective lens used in the initial design. We concluded that the reason for this increase was the inability of the FPI optics to achieve a sharp focus. Thus, in September 2023, the original 310-mm objective lens was replaced by a 300-mm apochromatic lens assembly purchased from Keo Scientific, which allowed us to achieve a sharper focus for all the rings. The apochromatic design provides a curvature correction to the objective lens focal plane so that the resulting interferogram image can be closely matched to the flatness of the CCD chip within the Andor camera body with the precise adjustment of the focal distance between the etalon and the CCD chip (Trondsen et al., 2019). This focal distance remains the same regardless of the wavelength within the designated spectrum ranging from 600 nm to 900 nm. The lens assembly is shown in the bottom right panel along with the CCD camera and the black tarp covering the filter wheel and etalon. There was no notable change in the zonal and meridional winds observed as a result of this objective lens upgrade, but the temperature values did decrease by ∼120 K.
The methodology applied in the analysis of the FPI images to obtain wind and temperature values follows the approach described in Harding et al. (2014), and it has been applied elsewhere (Navarro and Fejer, 2019; Schmidt et al., 2025).
In this study, winds since October 2018 were analyzed, and their climatology and solar cycle dependence were evaluated. The temperature data were evaluated only after the corrections described above were applied, allowing the investigation of absolute temperatures only after September 2023. It is important to note that for data before this date, temperature structures such as the MTM can still be observed, but absolute values need to be carefully computed.
3 Results
3.1 Day-to-day averages
Figure 2 shows an example of FPI data during 7 consecutive days in October 2023. Geomagnetic conditions during this period were quiet, with Dst reaching a maximum of −30 nT on 8 October. From the top to the bottom, Figure 2 shows zonal winds, meridional winds, temperature, airglow intensity, and vertical winds. The colors used in the plots refer to the different cardinal directions, as shown in Figure 1 (top right). Highly reliable results are obtained when vertical wind magnitude is close to 0 and the 630-nm airglow intensity is strong. For this 5-day period, only few data points around 06:00 UT on the first night are unreliable, when vertical winds are very large and the airglow intensity very low (less that a threshold of 0.23, determined statistically from outliers to account for periods of weak OI emissions and unfavorable observing conditions) and shown as a dashed line in the intensity plot). The observed zonal winds are higher than the HWM-14 zonal winds. Observed meridional winds tend to be closer to the modeled winds, although large variability on each night is observed. Temperatures appear to show consistent higher values than results from the NRL-MSIS model. At the end of each night, there are bumps in the temperature data that are not reproduced in the model. These bumps indicate the presence of the MTM. The increases in temperature are approximately 50 K–100 K and occur at ∼06 UT (∼02 LT).
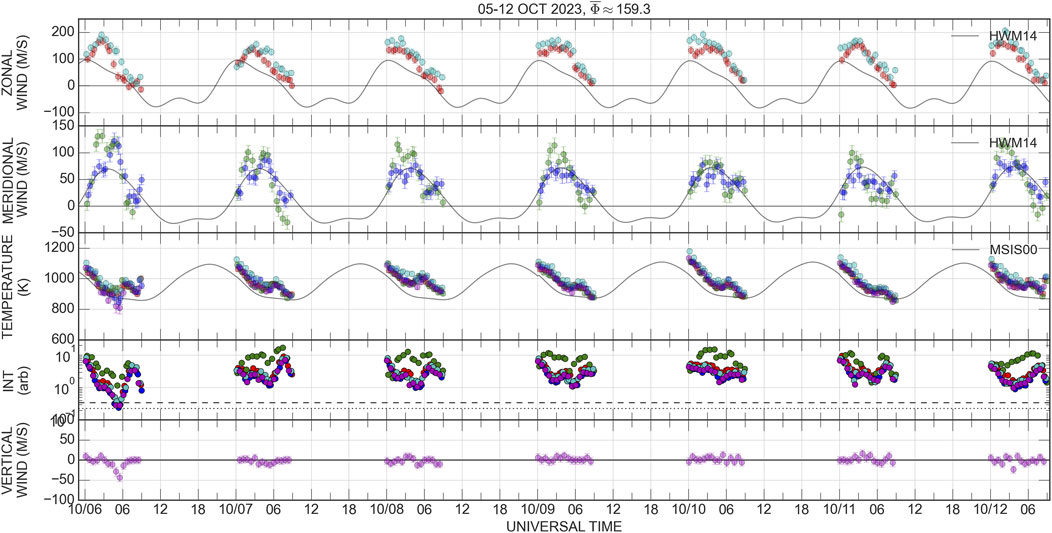
Figure 2. Results for 7 consecutive days in October 2023 where the average F10.7 was 159.3 sfu. From top to bottom: zonal winds, meridional winds, temperature, airglow intensity, and vertical winds.
The behavior of neutral winds during low solar activity is explored by looking at data taken during the year 2021 (average F10.7 = 80 sfu) and shown in Figure 3. From the top to the bottom, the panels represent data points for zonal winds, meridional winds, and temperature. The yearly behavior of the zonal winds shows peak values of ∼100 m/s occurring early in the night (20 LT–22 LT). The reversal to westward winds occurs later during the June solstice (local winter). The meridional winds are initially southward (poleward), reverse to northward, and by the end of the night, they are southward again. Winds switch northward later during June solstice. The late reversal back to poleward is not obvious during the December solstice. During this period, no clear evidence of a net southward wind is observed.
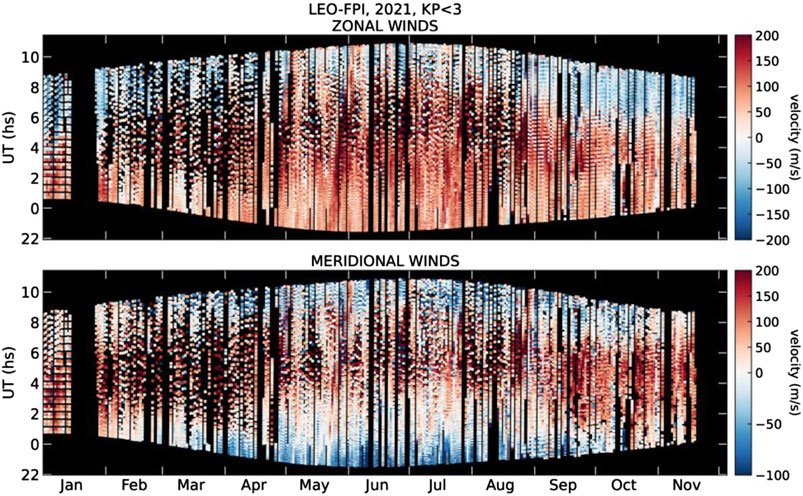
Figure 3. Zonal winds (top) and meridional winds (bottom) for the year 2021, a year with average F10.7 = 80. Color scales indicate that positive velocities (eastward/northward) are red and negative velocities (westward/southward) are blue. The x-axis represents a full year of data. The y-axis represents universal time, UT (LT = UT-4).
3.2 Monthly and seasonal behavior of winds
The seasonal behavior of winds for the period of October 2018–March 2023 is obtained by averaging the daily data, as shown in Figures 2, 3. Figure 4 shows the daily values and monthly average values of the 630.0-nm airglow intensity. Each panel covers three solar activity conditions: low (F10.7 < 100), medium (100 < F10.7 < 135), and medium/high (F10.7 > 135). Each solar activity level includes 332, 78, and 122 nights, respectively. A common feature observed at El Leoncito is that the intensity of the 630.0-nm airglow decreases significantly during local midnight hours, which sometimes renders unreliable data points. This is contrary to observations near the equatorial region, where airglow is very weak early in the night and increases later in the night. While data points obtained when airglow intensity was too low do not necessarily imply “bad data,” they are indicated as gray circles to contrast with the reliable data that are shown as black circles.
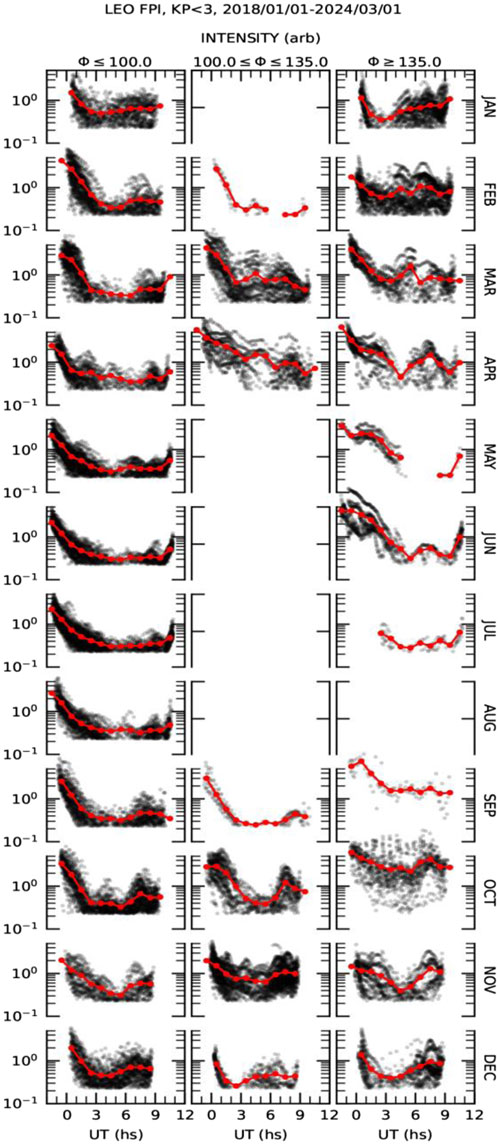
Figure 4. Airglow intensity of 630.0 nm for three levels of solar activity (left) low, F10.7 < 100; (center) medium, 100 < F10.7 < 135; (right) and medium/high, F10.7 > 135. The red points represent hourly averages.
Figure 5 shows scatter and 1 hour-average plots of zonal and meridional winds for the three solar activity conditions defined before. The green lines represent results from HWM-14. Data during medium and medium/high solar activities were not taken every night, and, as a consequence, sparse results are obtained, with some months showing limited or no values at all. Overall, a reasonable agreement between the model and data is observed. The peak modeled meridional winds appear to better match the peak values observed. The speeds of the modeled zonal winds are less than those of the observed winds, particularly during high solar activity conditions.
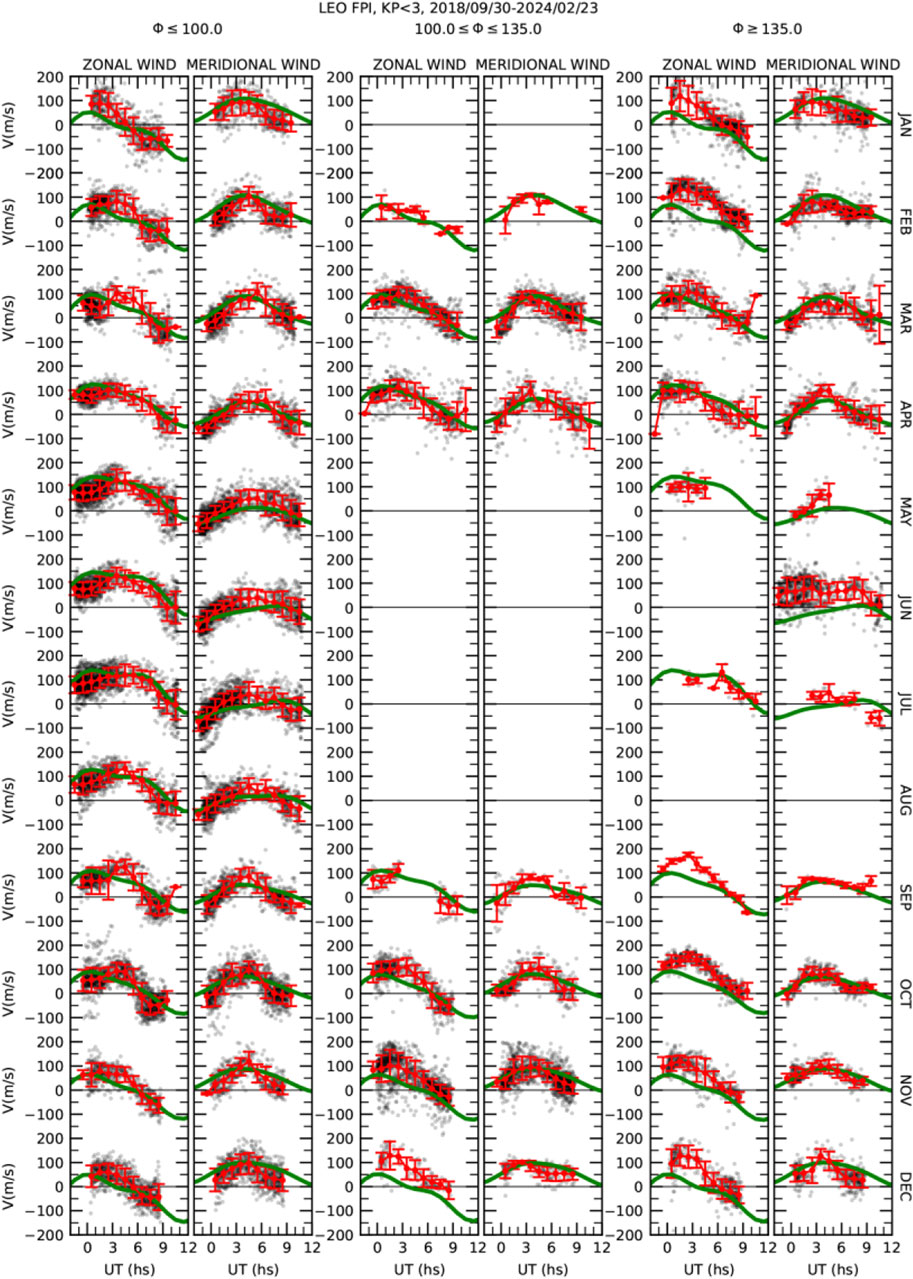
Figure 5. Zonal and meridional winds for each of the three levels of solar activity used in Figure 4. At each level, the black and gray points show scatter plots, and the red lines with circles represent 1-h average plots with their variability computed as the standard deviation of the individual points (red circles). The green lines show HWM-14 outputs.
Figure 6 shows the seasonal behavior of zonal and meridional winds for low and high solar activity levels. We define the seasons as Dec solstice (Nov, Dec, Jan, and Feb), equinox (Mar, Apr, Sep, and Oct), and Jul solstice (May, Jun, Jul, and Aug). The left panel includes zonal and meridional winds for F10.7 < 100. The number of nights used is 332, with 11,143 data points. The right panel includes similar plots for F10.7 > 135 (with only a few nights with F10.7 > 150). The number of nights used was 122, with 4,555 data points.
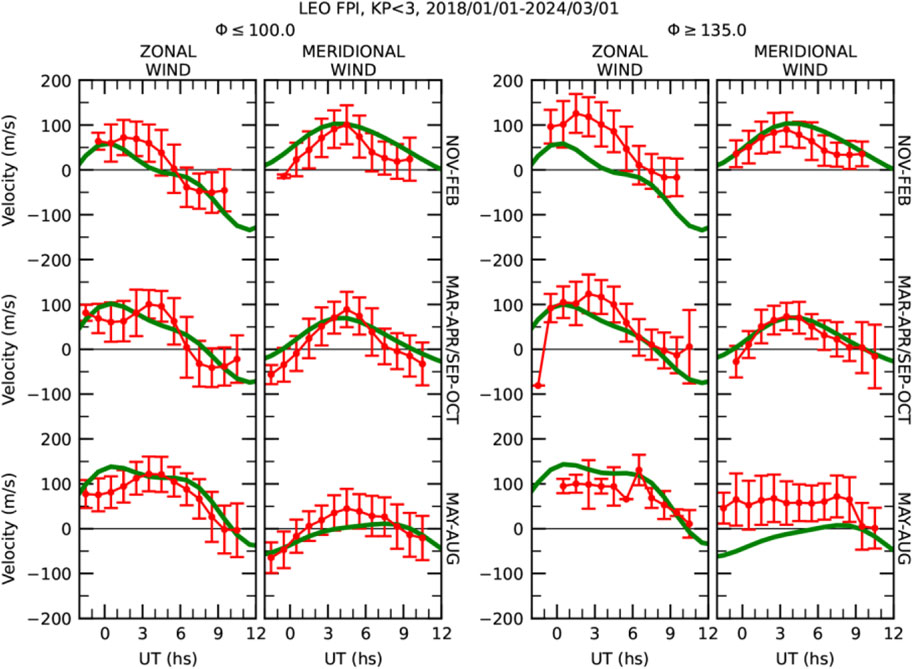
Figure 6. Seasonal behavior of zonal and meridional winds for low and medium/high solar activity levels. The left panel includes zonal and meridional winds for F10.7 < 100. The right panel includes zonal and meridional winds for F10.7 > 135. The red points represent 1-h average values, and the error bars indicate their variability. The green lines show HWM-14 outputs.
The averaged zonal winds show peak values between 100 m/s–120 m/s. During low solar activity, they occur later than the model predictions. The reversal to westward winds at the end of the night is observed later during the Jul solstice (local winter), a pattern that is reproduced in the model outputs. The meridional winds’ behavior during low solar activity shows an initial small southward (poleward) motion, reversing to northward in the middle of the night. By the end of the night they become southward again. This pattern is relatively well-reproduced by the model, although with a more extended northward-dominant direction. During high solar activity, meridional winds are mostly northward, with peak values close to midnight, and small southward winds observed only during equinox early and at the end of the night. The model outputs show similar behavior, except during Jul solstice, when modeled winds are poleward and close to 0 near dawn. The measured meridional winds show equatorward winds throughout the night.
To further investigate the wind speeds at different solar activity conditions, we selected five nights under geomagnetically quiet conditions with the lowest F10.7 (avg F10.7 = 73) and five nights with the highest F10.7 (avg F10.7 = 180) during December solstice. Figure 7 shows wind speed measurements during solar minimum and solar maximum. The plots to the left show zonal winds (top) and meridional winds (bottom) for solar minimum conditions. The plots to the right show the results for solar maximum conditions. Colors represent different viewing components, as indicated in the legend and in Figure 1. An asymmetry in the wind components is evident only during low solar activity. Wind speeds measured in the west and south are consistently higher during low solar activity, but they are similar at high solar activity. Potential explanations for this lack of uniformity involve ion-drag effects due to enhanced plasma density from the southern crest of the EIA. It could also be possible that tides, gravity waves, or orographic waves from lower altitudes have a different effect on thermospheric winds to the west and east of the Andes Mountain.
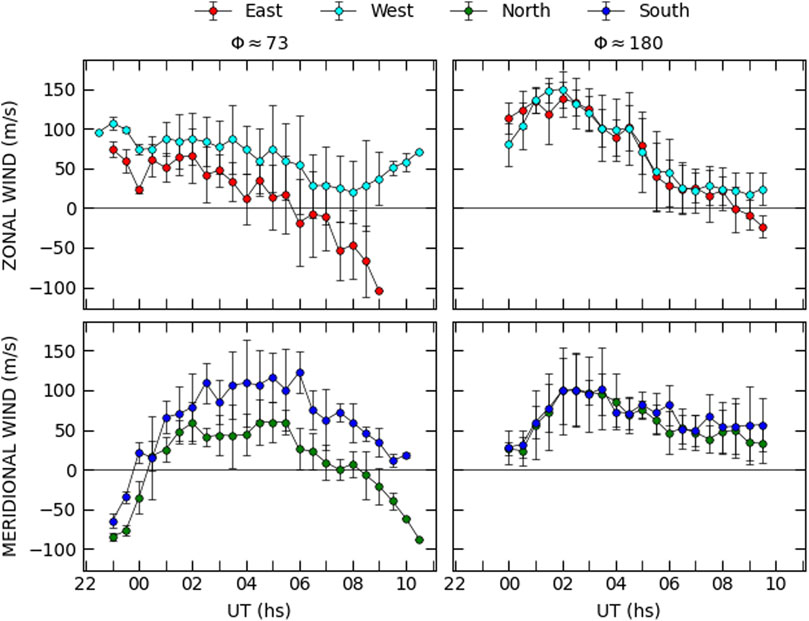
Figure 7. Average wind measurements during five nights with the lowest F10.7 values (left) and with the highest F10.7 values (right). Zonal components are at the top and meridional components are at the bottom. A clear asymmetry is observed only during solar minimum.
3.3 Temperature during the medium/high solar activity conditions
Due to the initial problems in determining the absolute values for temperatures described above, only data starting from September 2023, when the corrections and upgrades in the system were performed, are presented here. Previous data can still be used to investigate relative variations or perturbations, such as the MTM signature. Figure 8 shows the monthly temperature averages for the period September 2023–December 2024. The orange (blue) lines with circles and error bars correspond to the FPI data for the year 2023 (2024). The solid lines correspond to the respective averages from NRL-MSIS. The temperatures measured are higher during higher solar activity. Even during these monthly averages, bumps near or after the local midnight are observed, indicating that the presence of the MTM is not reproduced by the model. This feature will be investigated in future studies. A consistent underestimation in the modeled results is observed (only May 2023 and October 2024 show good agreement). No clear solar activity dependence in the offset is observed. For example, from January 2024 to September 2024, it appears that the model results are converging toward the measured values, but the F10.7 index does not show a linear increase; small offsets between the model and data are observed when F10.7 values are 167 sfu and 194 sfu. The NRL-MSIS model results show a linear and constant increment from 2023 to 2024 with no evidence of any seasonal dependence. The lack of FPI data in the NRL-MSIS model for the location of El Leoncito Observatory could be the reason for the lack of agreement between the model results and the data. Some results are unexpected, such as in December 2023 and December 2024, when a maximum difference in F10.7 is observed (157 vs. 197), but the temperatures are similar.
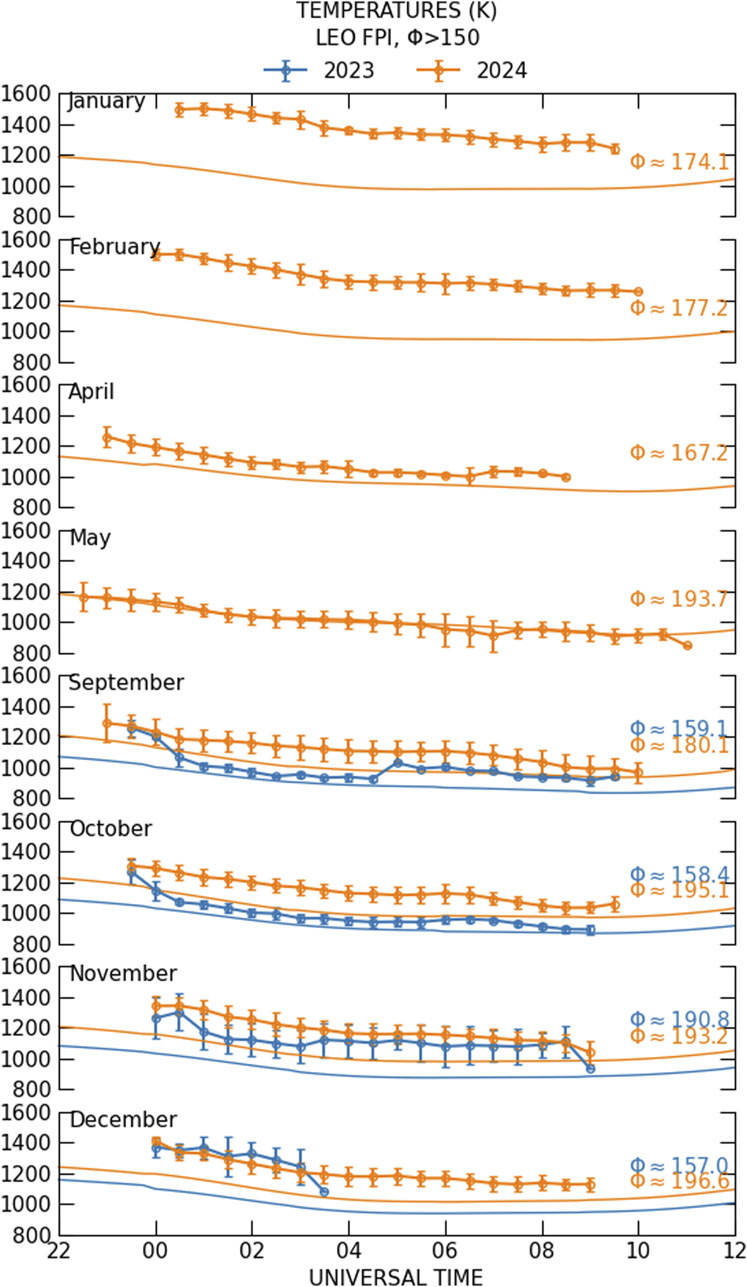
Figure 8. Temperature measurements from September 2023 to December 2024 shown in orange (2023) and blue (2024). Lines with no circles represent the respective NRL-MSIS outputs. Overall, a poor representation of the observed values is observed, with the exception of May 2023 and October 2024.
4 Conclusion
Results from a FPI operating over southern South America at El Leoncito Observatory are presented. The period analyzed extends from October 2018 to December 2024, allowing us to determine the monthly climatologies of zonal and meridional winds. This region was devoid of ground-based winds and temperature measurements. Zonal winds peak at ∼ 100 m/s–120 m/s, which is similar to the HWM-14 model results but later in time by ∼ 2 hs–3 hs. During low solar activity, meridional winds are southward (poleward) early in the night during equinoxes and Jul solstice with speeds of ∼50 m/s, reversing to northward (equatorward) around midnight, and becoming southward again around dawn. The northward phase around midnight is longer during high solar activity. Meridional winds during Dec solstice are initially close to 0. During high solar activity, early night meridional winds are not southward. Model outputs from HWM-14 reproduce data more accurately during low solar activity conditions. The modeled meridional winds show better agreement with the data during high solar activity, with the exception seen for the May–August period, when large discrepancies are observed.
When looking at the individual components in the cardinal directions, zonal and meridional winds are not uniform during low solar activity, with winds measured in the west and in the south being consistently higher. However, for the data associated with high solar activity (F10.7 > 135), this asymmetry is no longer evident. Follow-up studies will investigate this finding.
Neutral temperature results during 7 consecutive nights on October 2023 and average monthly results during September 2023 to December 2024 are presented. A clear increase in the temperature absolute values as solar activity increases is observed in the monthly averages. Model outputs underestimate the observed values at ∼100 K–200 K. The MTM is clearly observed during 5–10 October 2023, and hints of an MTM signature are observed during some of the averaged monthly results. The model outputs do not show any hint of an MTM.
Finally, the current and ongoing FPI observations from El Leoncito Observatory will help improve the model predictions of thermospheric parameters for this region.
Data availability statement
The raw data supporting the conclusions of this article will be made available by the authors, without undue reservation.
Author contributions
CM: Writing – original draft, Writing – review and editing, Conceptualization, Investigation, Validation, Methodology, Supervision, Resources. JM: Data curation, Writing – review and editing, Investigation, Methodology, Validation, Supervision. LN: Investigation, Methodology, Validation, Writing – review and editing, Data curation, Resources, Visualization.
Funding
The author(s) declare that financial support was received for the research and/or publication of this article. This work was supported by funds from NSF awards AGS-2152365, CEDAR-2230440, AGS-241129, and NASA 80NSSC23K1066.
Acknowledgments
The authors thank the director and personnel of El Leoncito Observatory for their continued support of the BU Fabry–Perot interferometer.
Conflict of interest
The authors declare that the research was conducted in the absence of any commercial or financial relationships that could be construed as a potential conflict of interest.
Generative AI statement
The author(s) declare that no Generative AI was used in the creation of this manuscript.
Any alternative text (alt text) provided alongside figures in this article has been generated by Frontiers with the support of artificial intelligence and reasonable efforts have been made to ensure accuracy, including review by the authors wherever possible. If you identify any issues, please contact us.
Publisher’s note
All claims expressed in this article are solely those of the authors and do not necessarily represent those of their affiliated organizations, or those of the publisher, the editors and the reviewers. Any product that may be evaluated in this article, or claim that may be made by its manufacturer, is not guaranteed or endorsed by the publisher.
References
Biondi, M. A., Meriwether, J. W., Fejer, B. G., Gonzalez, S. A., and Hallenbeck, D. C. (1991). Equatorial thermospheric wind changes during the solar cycle: measurements at Arequipa, Peru, from 1983 to 1990. J. Geophys. Res. 96 (15), 15917–15930. doi:10.1029/91JA01645
Drob, D. P., Emmert, J. T., Meriwether, J. W., Makela, J. J., Doornbos, E., Conde, M., et al. (2015). An update to the Horizontal Wind Model (HWM): the quiet time thermosphere. Earth Space Sci. 2, 301–319. doi:10.1002/2014EA000089
Harding, B. J., Gehrels, T. W., and Makela, J. J. (2014). Nonlinear regression method for estimating neutral wind and temperature from Fabry-Perot interferometer data. Appl. Opt. 53, 666–673. doi:10.1364/AO.53.000666
Harding, B. J., Drob, D. P., Buriti, R. A., and Makela, J. J. (2018). Nightside detection of a large-scale thermospheric wave generated by a solar eclipse. Geophys. Res. Lett. 45, 3366–3373. doi:10.1002/2018GL077015
Hernandez, G. (1974). Contamination of the O I (3P2–1D2) emission line by the (9–3) band of OH X2II in high-resolution measurements of the night sky. J. Geophys. Res. 79 (7), 1119–1123. doi:10.1029/JA079i007p01119
Hernandez, G. (1982). Mid-latitude thermospheric neutral kinetic temperatures, 1, Solar, geomagnetic, and long-term effects. J. Geophys. Res. 87 (A3), 1623–1632. doi:10.1029/JA087iA03p01623
Kerr, R. B., Kapali, S., Harding, B. J., Riccobono, J., Migliozzi, M. A., Souza, J. R., et al. (2023). Spectral contamination of the 6300 Å emission in single-etalon Fabry-Perot interferometers. J. Geophys. Res. Space Phys. 128, e2023JA031601. doi:10.1029/2023JA031601
Makela, J. J., Meriwether, J. W., Lima, J. P., Miller, E. S., and Armstrong, S. J. (2009). The remote equatorial nighttime observatory of ionospheric regions project and the international heliospherical year. Earth Moon Planets 104, 211–226. doi:10.1007/s11038-008-9289-0
Makela, J., Fisher, D., Meriwether, J., Buriti, R., and Medeiros, A. (2013). Near-continual ground-based nighttime observations of thermospheric neutral winds and temperatures over equatorial Brazil from 2009 to 2012. J. Atmos. Solar-Terrestrial Phys. 103, 94–102. doi:10.1016/j.jastp.2012.11.019
Martinis, C., Meriwether, J., Niciejewski, R., Biondi, M., Fesen, C., and Mendillo, M. (2001). Zonal neutral winds at equatorial and low latitudes. J. Atmos. Sol. Terr. Phys. 63 (14), 1559–1569.
Martinis, C., Baumgardner, J., Wroten, J., and Mendillo, M. (2018). All-sky-imaging capabilities for ionospheric space weather research using geomagnetic conjugate point observing sites. Adv. Space Res. 61, 1636–1651. doi:10.1016/j.asr.2017.07.021
Meriwether, J. W., Faivre, M., Fesen, C., Sherwood, P., and Veliz, O. (2008). New results on equatorial thermospheric winds and the midnight temperature maximum. Annales Geophysicae 26 (3), 447–466. doi:10.5194/angeo-26-447-2008
Meriwether, J. W., Moody, J. W., Biondi, M. A., and Roble, R. G. (1986). Optical interferometric measurements of nighttime equatorial thermospheric winds at Arequipa, Peru. J. Geophys. Res. 91 (A5), 5557–5566. doi:10.1029/JA091iA05p05557
Meriwether, J. W., Biondi, M. A., Herrero, F. A., Fesen, C. G., and Hallenback, D. C. (1997). Optical interferometric studies of the nighttime equatorial thermosphere: enhanced temperatures and zonal wind gradients. J. Geophys. Res. 102 (A9), 20041–20058. doi:10.1029/97JA01463
Meriwether, J. W., Makela, J. J., Huang, Y., Fisher, D. J., Buriti, R. A., Medeiros, A. F., et al. (2011). Climatology of the nighttime equatorial thermospheric winds and temperatures over Brazil near solar minimum. J. Geophys. Res. 116, A04322. doi:10.1029/2011JA016477
Meriwether, J. W., Makela, J. J., and Fisher, D. J. (2016). “Simultaneous measurements and monthly climatologies of thermospheric winds and temperatures in the Peruvian and Brazilian longitudinal sectors,” in Ionospheric Space weather. Editors T. Fuller-Rowell, E. Yizengaw, P. H. Doherty, and S. Basu, doi:10.1002/9781118929216.ch15
Mosarraf Hossain, Md., Kumar Pant, T., and Vineeth, C. (2023). Nocturnal thermospheric neutral wind and temperature measurement using a Fabry-Perot Interferometer: first results from an equatorial Indian station. Adv. Space Res. 72 (2), 598–613. doi:10.1016/j.asr.2023.03.040
Navarro, L. A., and Fejer, B. G. (2019). Storm-time thermospheric winds over Peru. J. Geophys. Res. Space Phys. 124, 10415–10427. doi:10.1029/2019JA027256
Navarro, L. A., and Fejer, B. G. (2020). Storm-time coupling of equatorial nighttime F region neutral winds and plasma drifts. J. Geophys. Res. Space Phys. 125, e2020JA028253. doi:10.1029/2020JA028253
Okoh, D., Bounhir, A., Habarulema, J. B., Rabiu, B., Katamzi-Joseph, Z., Ojo, T., et al. (2022). Thermospheric neutral wind measurements and Investigations across the African region—a review. Atmosphere 13, 863. doi:10.3390/atmos13060863
Schmidt, A., Meriwether, J. W., Cooper, M., Gerrard, A., Goodwin, L., Zhang, S., et al. (2025). Detection of wave activity in measurements of thermospheric vertical winds and temperatures at subauroral latitudes. Front. Astron. Space Sci. 12, 1613164–2025. doi:10.3389/fspas.2025.1613164
Keywords: themospheric winds, FPI, 630 nm airglow, neutral temperature, low latitude
Citation: Martinis C, Meriwether JW and Navarro LA (2025) Thermospheric wind and temperature observations from El Leoncito Observatory in southern South America. Front. Astron. Space Sci. 12:1666096. doi: 10.3389/fspas.2025.1666096
Received: 15 July 2025; Accepted: 18 August 2025;
Published: 25 September 2025.
Edited by:
Daniel Okoh, The National Space Research and Development Agency (NASRDA), NigeriaReviewed by:
Taiwo Ojo, University of Toronto, CanadaAderonke Adekemi Akerele, National Space Research and Development Agency, Nigeria
Copyright © 2025 Martinis, Meriwether and Navarro. This is an open-access article distributed under the terms of the Creative Commons Attribution License (CC BY). The use, distribution or reproduction in other forums is permitted, provided the original author(s) and the copyright owner(s) are credited and that the original publication in this journal is cited, in accordance with accepted academic practice. No use, distribution or reproduction is permitted which does not comply with these terms.
*Correspondence: C. Martinis, bWFydGluaXNAYnUuZWR1