 Devojyoti Kansabanik1,2*
 Marcel Gouws3
 Deepan Patra4
 Angelos Vourlidas2Pieter Kotzé3,5
 Divya Oberoi4
 Shaheda Begum Shaik6,7Sarah Buchner3Fernando Camilo3
- 1NASA Jack Eddy Fellow, University Corporation for Atmospheric Research, Boulder, CO, United States
- 2The Johns Hopkins University Applied Physics Laboratory, Laurel, MD, United States
- 3South African Radio Astronomy Observatory, Liesbeek House, Cape Town, South Africa
- 4National Centre for Radio Astrophysics, Tata Institute of Fundamental Research, S. P. Pune University Campus, Pune, India
- 5National Radio Astronomy Observatory, Charlottesville, VA, United States
- 6George Mason University, Fairfax, VA, United States
- 7U.S. Naval Research Laboratory, Washington, DC, United States
Solar radio emissions offer unique diagnostic insights into the solar corona. However, their dynamic and multiscale nature, along with several orders of magnitude variations in intensity, pose significant observational challenges. To date, at gigahertz frequencies, MeerKAT stands out globally with high potential of producing high-fidelity, spectroscopic snapshot images of the Sun, enabled by its dense core, high sensitivity, and broad frequency coverage. Yet, as a telescope originally designed for observing faint galactic and extragalactic sources, observing the Sun at the boresight of the telescope requires customized observing strategies and calibration methods. This work demonstrates the technical readiness of MeerKAT for solar observations at the boresight of the telescope in the UHF (580–1015 MHz) and L-band (900–1670 MHz) frequency ranges, including optimized modes, a dedicated calibration scheme, and a tailored, entirely automated calibration and imaging pipeline. The quality of solar images is validated through morphological comparisons with the solar images at other wavelengths. Several unique early science results showcase the potential of this new capability of MeerKAT. Once fully commissioned and operational, this will unlock novel solar studies, significantly expand the scientific portfolio of MeerKAT, and lay the groundwork for solar observations with the mid-frequency telescope of the upcoming Square Kilometre Array Observatory, for which MeerKAT serves as a precursor.
1 Introduction
The solar atmosphere consists of hot, magnetized plasma, with thermal and non-thermal electrons producing radio emissions across a broad frequency range (kHz to GHz) through processes like thermal bremsstrahlung, plasma emission, gyro-resonance, gyro-synchrotron, and electron-cyclotron maser emission. Solar radio emissions have been studied extensively from a few kHz to hundreds of GHz (e.g., Pick and Vilmer, 2008; Gary, 2023). Most observations rely on spectrograms, which provide spectrotemporal data but lack spatial information. Solar imaging at radio wavelengths has been carried out for decades by a small number of dedicated interferometers, including the Nançay Radio Heliograph (NRH; Bonmartin et al., 1983) and Gauribidanur Radio Heliographs (GRAPH; Sundaram and Subramanian, 2004), both still operational, and the Nobeyama Radioheliograph (NoRH; Nakajima et al., 1994), which is no longer active. This has changed with new-generation radio interferometers such as the Murchison Widefield Array (MWA; Lonsdale et al., 2009; Tingay et al., 2013), LOw Frequency ARray (LOFAR; van Haarlem et al., 2013), upgraded Giant Metrewave Radio Telescope (uGMRT; Gupta et al., 2017), Jansky Very Large Array(JVLA; Perley et al., 2009), the Expanded Owens Valley Solar Array (EOVSA; Gary et al., 2012), and Atacama large millimeter-submillimeter array (ALMA; Bastian et al., 2022; Shimojo et al., 2024). Although not all of them focus solely on solar observations, they have been instrumental in advancing our understanding of solar physics.
MeerKAT, a new-generation radio interferometric telescope in South Africa (Jonas and MeerKAT Team, 2016) and a precursor to the mid-frequency telescope of the upcoming Square Kilometre Array Observatory (SKAO, Dewdney et al., 2009; Santander-Vela et al., 2021), comprises 64 cryogenically cooled 13.5 m dishes with excellent sensitivity. It operates across UHF (580–1015 MHz), L (900–1670 MHz), and S (1750–3500 MHz) bands. Its dense core, 39 dishes within 1 km, and extended baselines up to 8 km provide superb surface brightness sensitivity and a well-sampled Fourier coverage, enabling high-fidelity spectroscopic snapshot imaging, even off-boresight (Kansabanik et al., 2024). These characteristics make MeerKAT an ideal instrument for studying the dynamic Sun at GHz frequencies, including active emissions, coronal mass ejection (CME) magnetometry (e.g., Kansabanik et al., 2023; Kansabanik et al., 2024), and faint transient detections. Although significant advances have been made at meter wavelengths with SKA-Low precursor (MWA) (Oberoi et al., 2023, and references therein) and pathfinders (LOFAR, uGMRT) (e.g., Magdalenić et al., 2020; Zhang et al., 2024; Mondal et al., 2024), solar studies using precursor and pathfinders at mid-frequency of SKAO remain in early stages.
The first MeerKAT application to solar science was conducted by Kansabanik et al. (2024), showcasing its potential for high-fidelity solar imaging. These observations placed the Sun in a sidelobe of the primary beam of the telescope, rather than at boresight, to sufficiently attenuate the intense solar emission and enable stable operation of the signal chain. However, the large angular size of the Sun and the chromaticity of the primary beam sidelobes posed significant challenges, necessitating attenuation that reduced sensitivity by a factor of
This paper demonstrates the technical readiness of MeerKAT for solar observations with the Sun positioned at the boresight of the telescope, including a dedicated pipeline for calibrating these non-standard observations. The structure of the paper is as follows: Section 2 details system optimization and observing procedures. Section 3 addresses the effects of the motion of the Sun on the sky, followed by a description of the data processing pipeline, including calibration, imaging, and mitigation strategies for the effects of non-sidereal solar motions in Section 4. Section 6 verifies system performance and demonstrates the technical readiness. We highlight several preliminary interesting science results in Section 7. Section 8 concludes the paper with a discussion about future works.
2 Configuring MeerKAT for solar observations
2.1 Challenges in observing the sun with MeerKAT
The Sun is the source with the highest flux density at GHz frequencies and has a large angular size
2.2 Description of signal power management at MeerKAT for solar observations
In general, the low-noise amplifier (LNA) – the first component in the signal chain of a radio telescope–is designed to have a linear response over a wide dynamic range, enabling it to accommodate strong signals such as those from the Sun. However, downstream sub-systems, including those of MeerKAT, have more limited dynamic ranges, and the default configuration is optimized for observing faint astronomical sources. To manage strong solar signals, MeerKAT employs attenuators within the Radio Frequency Conditioning Unit (RFCU). This is a room-temperature subsystem located just before the analog-to-digital converter (ADC) in the signal chain. These attenuators offer 0–63 dB attenuation in 1 dB steps. To calibrate this attenuation, we have used a built-in noise diode. The built-in noise diode injects noise with a temperature approximately equal to system temperature on cold sky, leading to an increase in power by approximately 3 dB. Hence, measuring the change corresponding to the power injected by the noise diode when using attenuators allows us to measure the effective attenuation.
We estimated the additional signal attenuation required for MeerKAT solar observations to maintain the input power to the ADCs near the nominal level, based on source flux density and the band-averaged System Equivalent Flux Density (SEFD). Under cold-sky conditions, MeerKAT sets attenuation to align ADC input power to the nominal
yielding
These estimates are based on quiet solar flux density and are designed to set the ADC power to the nominal power level, which is the minimum input power level required for optimal operation of the ADC. Hence, this value of
2.3 Characterization of the attenuators
Since attenuators introduce an additional element into the signal path, it is essential to assess their impact on spectral properties, as well as their influence on visibility amplitudes and phases. To achieve this, we analyze the variations in visibility amplitudes and phases for various attenuation levels, while ensuring that the ADC power stays within its optimal operating range. The latter is needed to ensure that the signal-to-noise ratio (SNR) of visibility does not change significantly.
2.3.1 Phase and amplitude distortion
To understand the phase response of attenuators, we compared visibility phases on the baseline between antennas m000 and m001 (baseline length of 37 m) across multiple scans on the Sun with varying attenuation levels
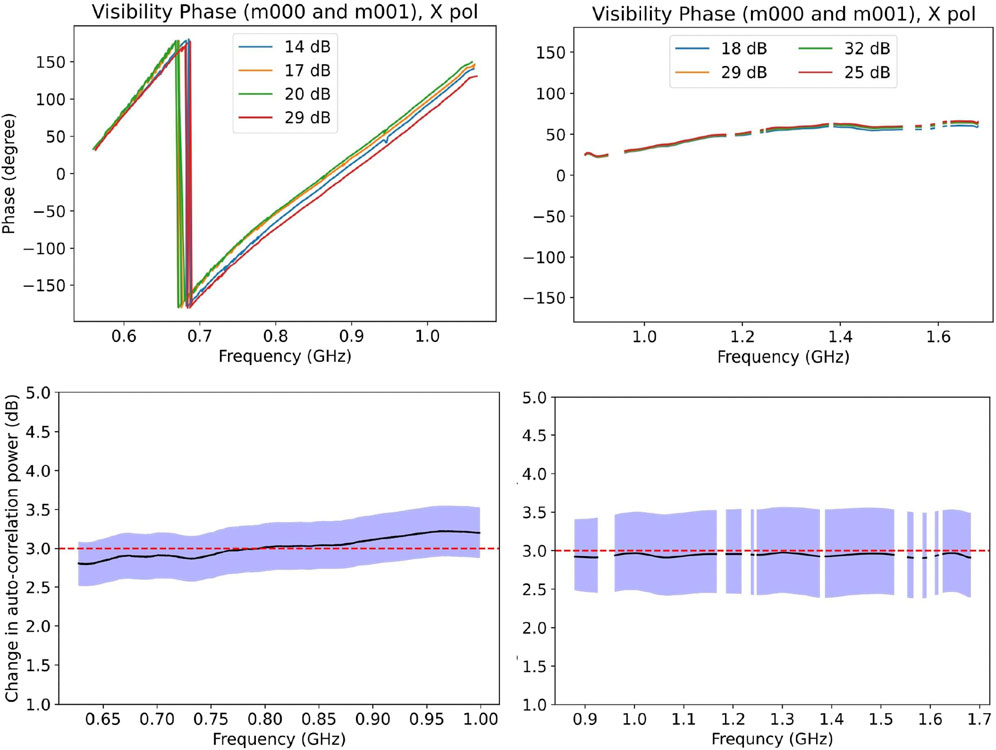
Figure 1. Top panels: Visibility phases for X-polarization for baseline between antennas m000 and m001 (baseline length of 37 m) for different values of
To assess the spectral behavior of the amplitude response of attenuators, we analyzed the auto-correlation power of all antennas in both UHF and L-bands, with
2.3.2 Antenna-to-antenna variation
While
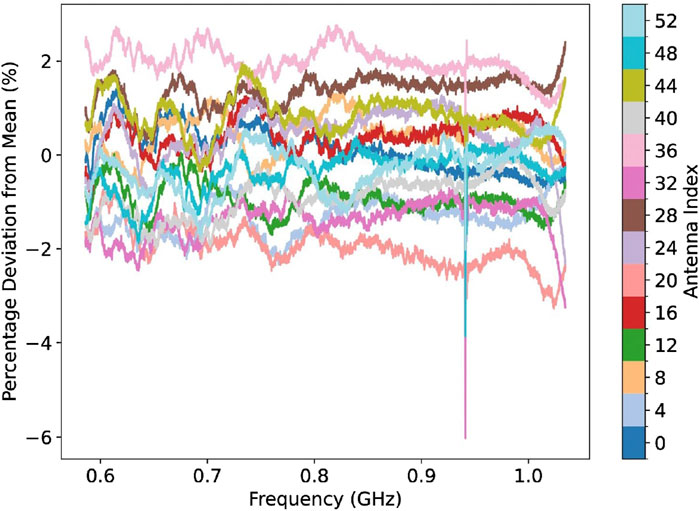
Figure 2. The relative variation in power level across different antennas, resulting from a 3 dB change in
2.4 Observing strategy with noise diode for flux density calibration
As discussed in Sections 2.1, 2.3, standard calibrators including the A-team sources cannot be observed with the same attenuation as used for the Sun, and the applied
2.5 Standard observing procedure of solar observation with MeerKAT
In preparation for solar observations with MeerKAT, we conducted tests in the engineering mode and arrived at the following observing procedure for routine solar observations.
1. Flux calibrator scan: Observe a standard MeerKAT flux/bandpass calibrator (e.g., J1939-6342 or J0408-6545 (MeerKAT flux and bandpass calibrators) with nominal attenuation.
2. Calibrator observation with noise diode: Perform a 3–5 min scan on the same calibrator, switching the noise diode on and off for every successive correlator integration, so that consecutive data records alternate between noise-on and noise-off states. (Currently implemented via engineering mode).
3. Phase and polarization calibrator: Observe suitable phase and polarization calibrators with nominal attenuation settings.
4. Point to the Sun: Slew to the Sun with nominal attenuation still active. Switching on solar attenuation before the Sun is in the primary beam may cause system issues.
5. Enable solar attenuation: Once on the Sun, activate the additional solar attenuation
6. Solar scan with noise diode: Conduct solar scans with the noise diode toggled on alternate correlator dumps. It is recommended to limit the scan duration to 30 min for phase calibrator observations.
7. Disable attenuation: After the solar scan, disable
8. Post-scan calibrator: Re-observe the phase calibrator with standard attenuation.
9. Repeat cycle: Repeat steps 4-8 for the remaining observing time.
We note that once the functionality required for inserting appropriate attenuation in the signal path and for toggling the noise diode on alternate correlator dumps is implemented in the MeerKAT Observation Planning Tool, all essential requirements for enabling a solar observing mode will have been met.
2.6 Minimum pointing distance of calibrators from the sun
When the telescope points near the Sun, the system temperature can increase significantly. For the MeerKAT beam, this minimum angular distance,
where
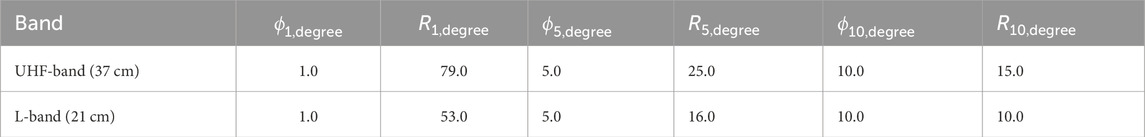
Table 1. Minimum angular distance of the calibrators from the Sun for specified expected phase errors.
3 Effects of motion of the sun
The apparent motion of the Sun in the sky is unlike that of most astronomical sources. It is governed by two key components: the non-sidereal motion of the Sun on the sky, and the movement of solar features on the solar disc due to differential solar rotation. Both these effects must be considered when observing and analyzing solar data.
3.1 Sidereal motion
The Sun, being a non-sidereal source, its Equatorial coordinates (RA-Decl.) drift across the sky at an average rate of
3.2 Differential rotation
In addition to the non-sidereal motion, the Sun also exhibits differential rotation–the rotation period at its equator is
We note that differential solar rotation breaks the “rigid-sky” assumption of radio interferometric imaging, making corrections in the visibility domain or during the imaging and deconvolution non-trivial. Current tools like Common Astronomy Software Application (CASA; The CASA Team et al., 2022) and W-Stacking CLEAN (WSClean; Offringa et al., 2014) do not support such corrections. This limitation will become more critical for the SKAO, with its higher spatial resolution, where uncorrected differential rotation may smear fine-scale features even when integrating over short times. For example, maximum integration time should be less than
4 Description of the calibration and imaging pipeline
Boresight solar observations with MeerKAT are non-standard and demand specialized calibration and imaging strategies. Existing tools such as
Its key features include:
1. Support for both Full-Stokes (polarization) calibration and imaging of solar observations.
2. Process-based parallelization using
3. Efficient operation on memory-constrained machines, allowing large dataset processing where traditional tools may fail.
4. Remote monitoring of pipeline progress.
The pipeline uses
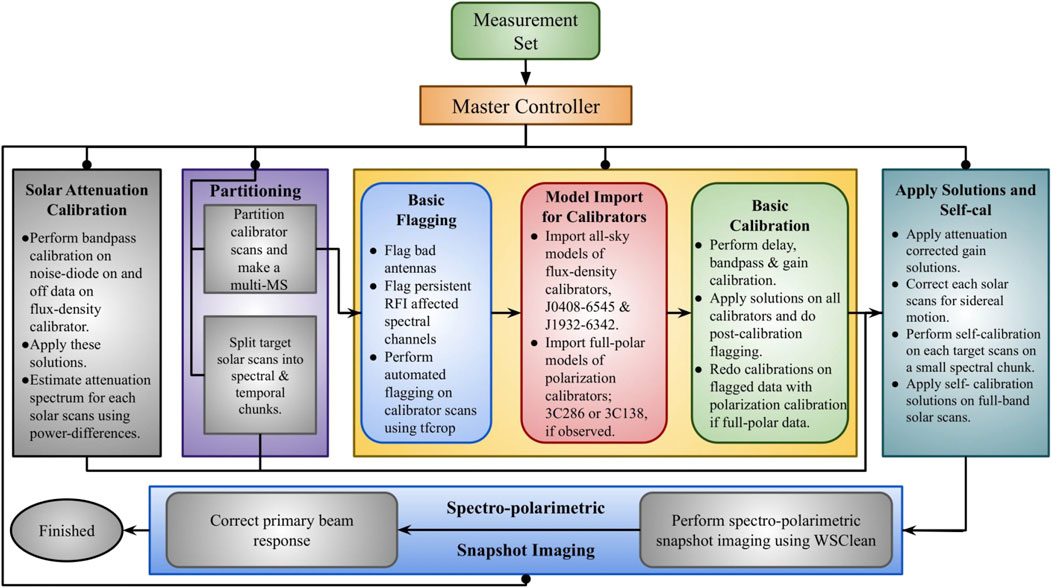
Figure 3. A flowchart of the pipeline for calibration and imaging of solar observations with MeerKAT. The master controller controls the workflow of the pipeline. Tasks inside individual rectangular blocks are executed in parallel and controlled by the master controller.
4.1 Data partitioning, flagging and calibration
The Measurement Set (MS) is partitioned by scans and converted into multi-MS format for parallel processing using
4.2 Flux density calibration using noise diodes
Absolute flux density calibration of solar observations is performed in two steps. First, the instrumental bandpass is calibrated without applying
While power variations due to the noise diode are easily detectable in calibrator scans without averaging, this is not the case for solar scans due to the suppression by
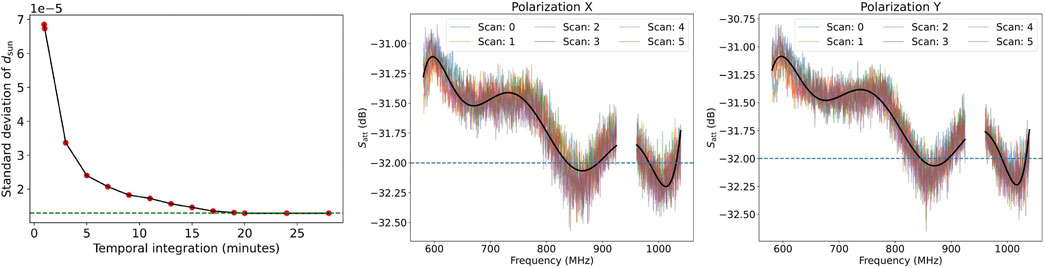
Figure 4. Left panel: Variation of band-averaged standard deviation of
4.3 Spectroscopic snapshot self-calibration
Solar radio emission exhibits strong spectral and temporal variability, making the solar sky model inherently time-dependent. The time and frequency scale of the variation depends on solar activity and can range from a few seconds to several minutes and a few kHz to several MHz. To address this dynamic temporal and spectral variability scale, the spectral and temporal axes are adaptively divided into chunks such that deviations from the mean remain below certain thresholds (default is 10% for frequency, 1% for time). This ensures that variability is preserved while enabling computationally efficient self-calibration. A spectral chunk from the lower part of the band is selected to maximize surface brightness sensitivity and improve modeling on shorter baselines. The self-calibration procedure follows the convergence criteria in Kansabanik et al. (2022), Kansabanik et al. (2023), starting with phase-only calibration and advancing to joint amplitude-phase calibration upon convergence. CLEAN thresholding is progressively reduced, and the process is stopped when no further improvement in image dynamic range is observed. Convergence is defined as a relative change in dynamic range below a user-defined threshold
4.4 Spectroscopic snapshot imaging
At GHz frequencies, solar radio emission exhibits structure across a broad range of angular scales—from arcseconds to the full solar disc—often with significant complexity. The imaging pipeline supports user-defined baseline selection and weighting strategies, and by default adopts Briggs weighting (Briggs, 1995) with a robust parameter of 0.0 to achieve a balance between resolution and sensitivity. Multiscale deconvolution is employed with frequency-dependent multiscale parameters. These choices, detailed in Supplementary Appendix S9.1, are made to avoid deconvolution artifacts.
4.5 Primary beam correction
As the Sun is an extended source, its observed emission must be corrected for the direction-dependent primary beam response. We apply image-based primary beam correction using the array-averaged MeerKAT beam model from holography measurements (de Villiers and Cotton, 2022; de Villiers, 2023). The beam is described by the Jones matrix
To apply correction, the beam is first mapped from
where the parallactic rotation matrix is:
The frequency-averaged Stokes I beam is computed as:
where
5 Observation details
MeerKAT, with its field of view of roughly
We have used data taken as part of engineering tests (project ID: EXT-20221114-PK-01) and the SARAO (South African Radio Astronomy Observatory) Science Verification (SSV) observations (project ID: SSV-20240609-DK-01). Engineering tests are performed in both UHF- and L-band, while SSV observations were taken only in the UHF-band. Results from observations performed on 04 December 2023 and 10 June 2024 are presented in this paper. All spectroscopic snapshot images presented in this paper are generated using a 50 MHz bandwidth and 15 min of temporal averaging for the ease of data analysis.
6 System verification
To evaluate the accuracy of calibration and image reconstruction in the presence of attenuators, we compare radio images with co-temporal extreme ultraviolet (EUV) observations. Figure 5 shows this comparison using EUV images from Atmospheric Imaging Assembly (AIA, Lemen et al., 2012) onboard Solar Dynamics Observatory (SDO; Pesnell et al., 2012), closest in time to the radio image. The MeerKAT image centered at 942.11 MHz is produced using 50 MHz and 15 min of data. Key features are highlighted with colored arrows, which are identical across all panels. The large coronal hole (region 7) appears with similar morphology in both bands. An additional, smaller coronal hole is also marked (region 10). On-disk active regions (regions 8 and 9) and eastern limb active regions (regions 1 and 6) are identifiable. Additional filamentary structures are indicated by regions 2, 3, 4, and 5.
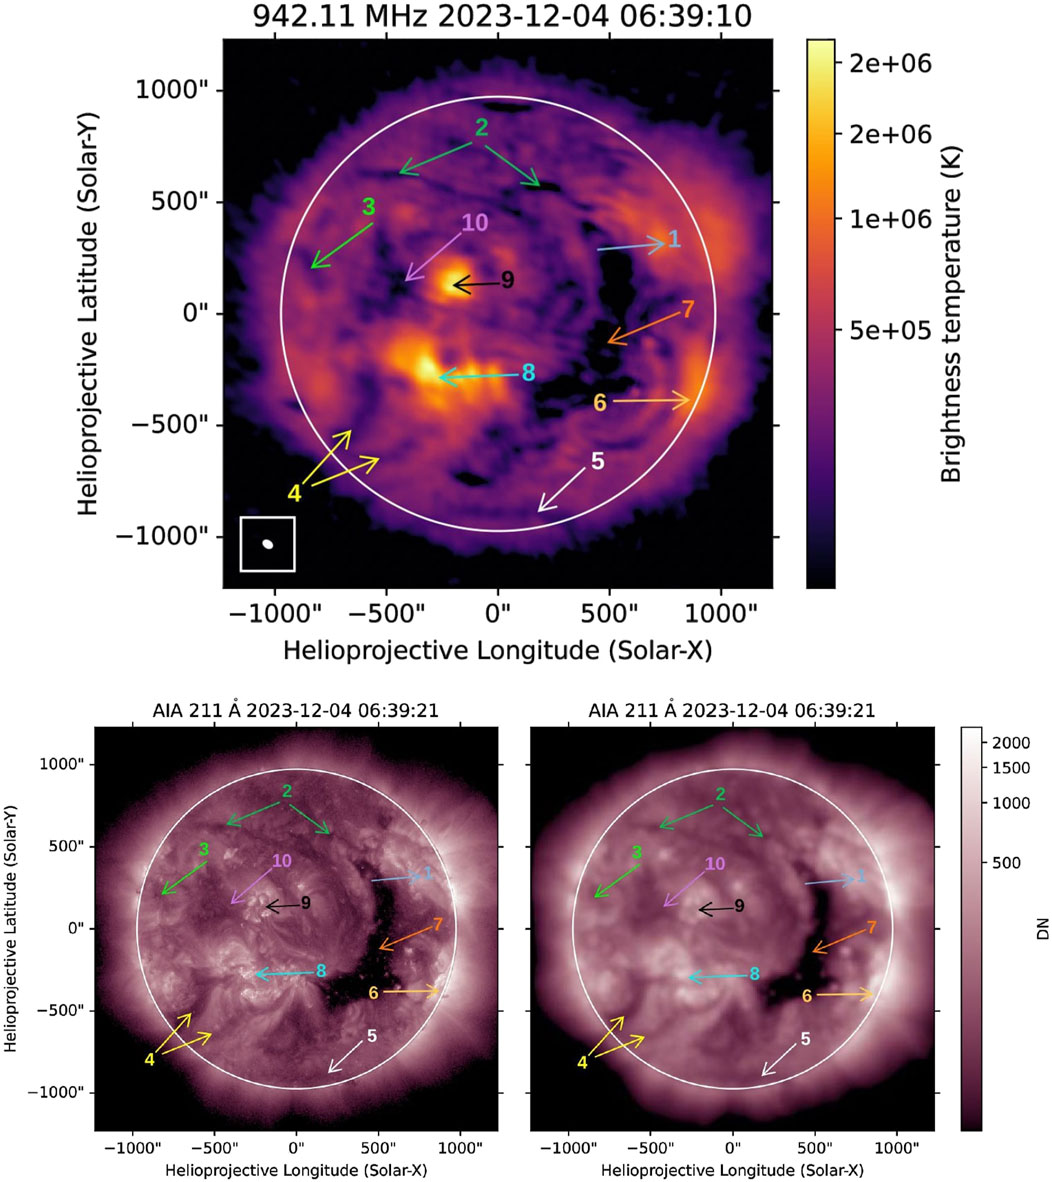
Figure 5. Morphological comparison between MeerKAT UHF band image with 211Å EUV image from SDO/AIA. The top panel shows the radio image from MeerKAT (averaged data over 50 MHz spectral and 15 min of temporal chunk) showing emissions at more than
Despite the high surface brightness sensitivity of MeerKAT, its shortest baseline is not short enough to detect structures comparable in size to the solar disc at the upper end of the L-band, the minimum baseline length of approximately
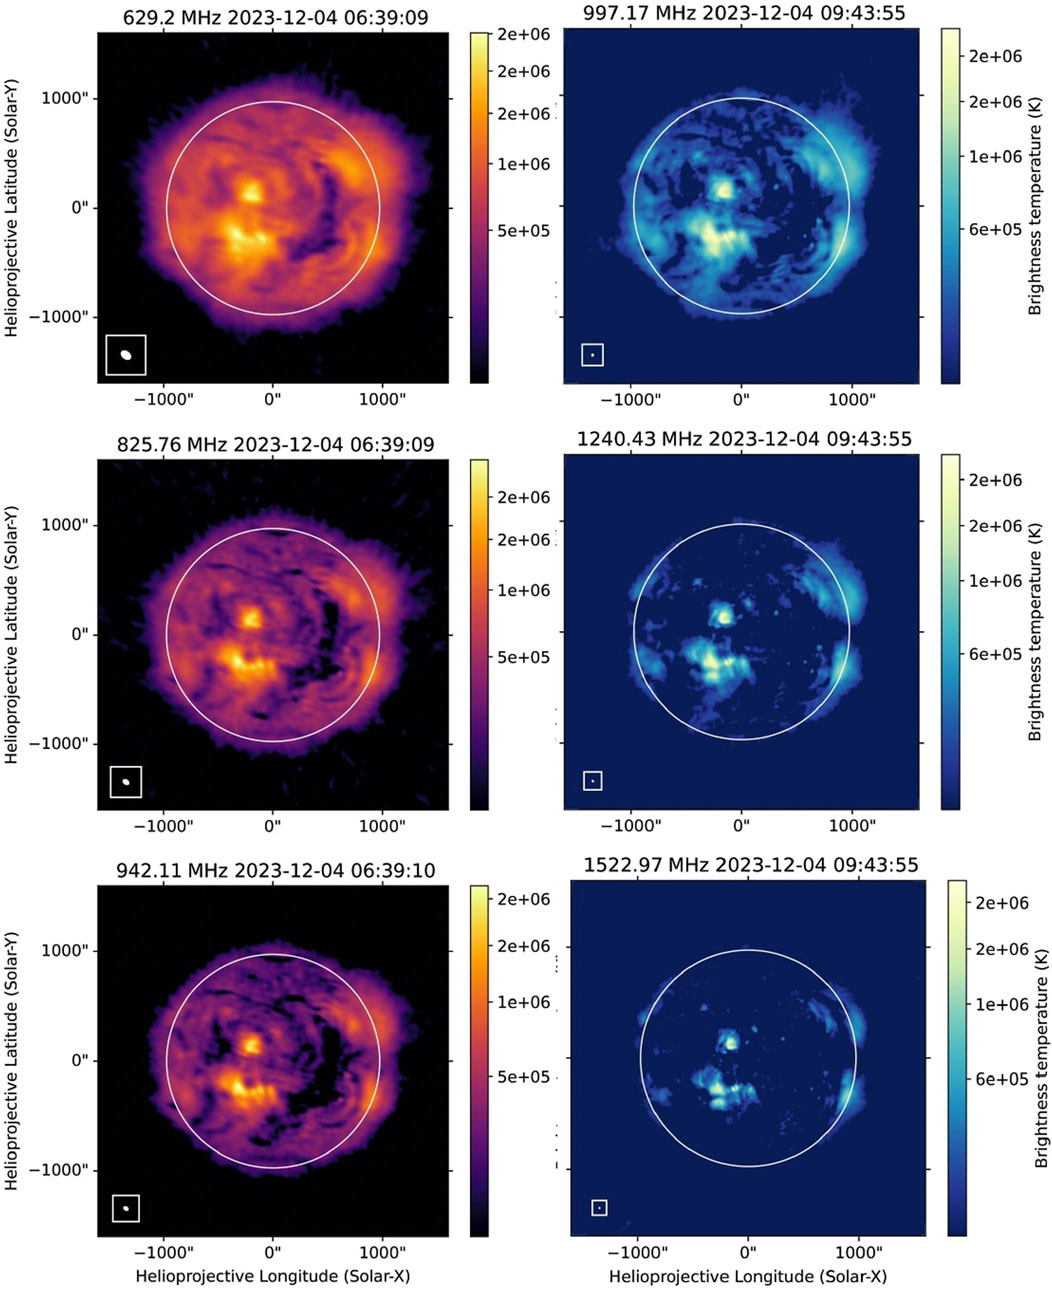
Figure 6. Spectroscopic radio images from MeerKAT observations on 4 December 2023 are shown (50 MHz and 15 min integrations). The left and right panels display images from the UHF and L-band observations, respectively, above
7 Glimpses of early science results
At metre wavelengths, high-quality spectro-polarimetric snapshot imaging with SKA-low precursors like the MWA and pathfinders such as LOFAR and uGMRT has already demonstrated the ability to observe a wide range of solar phenomena (Oberoi et al., 2023)— from the quiet Sun (e.g., Vocks et al., 2018; Sharma and Oberoi, 2020; Zhang et al., 2022), coronal holes (McCauley et al., 2019; Rahman et al., 2019) and weak transient events (Sharma et al., 2018; Mondal et al., 2020a; Mondal, 2021), to faint emissions from CME plasma (Mondal et al., 2020b; Kansabanik et al., 2023; Kansabanik et al., 2024), high-resolution imaging of solar noise storms (Mondal et al., 2024; Mondal et al., 2025), intense active emissions from high energy particles (e.g., Mohan et al., 2019; Mohan, 2021; Mohan, 2021), CME shocks (e.g., Bhunia et al., 2023; Zhang et al., 2024; Kumari et al., 2025). Recent high-fidelity polarimetric studies (e.g., McCauley et al., 2019; Rahman et al., 2019; Morosan et al., 2022; Dey et al., 2025) also started providing new insights on the radio emission from the solar corona,
MeerKAT solar observations enable unprecedented spectroscopic snapshot imaging of the Sun at centimeter wavelengths. The high image fidelity, as demonstrated through comparisons with EUV images from AIA, will advance the study of the solar corona and eruptive events and open up discovery potential. This section provides glimpses of a range of new science objectives that can potentially be achieved using MeerKAT solar observations already available. Detailed analyses and discussion of individual science targets with higher spectro-temporal resolution are deferred to forthcoming publications.
7.1 A complementary diagnostic of multi-thermal solar atmospheric plasma
EUV spectral lines (Khan and Nagaraju, 2022) and soft X-ray observations are widely used to probe the thermal structure of the solar atmosphere. Slit-based spectrographs like EUV Imaging Spectrometer onboard Hinode (Hinode/EIS; Culhane et al., 2007) and Coronal Diagnostic Spectrometer onboard Solar and Heliospheric Observatory (SOHO/CDS; Del Zanna et al., 2001) offer good spectral resolution and broad temperature coverage (log
In contrast, full-disk EUV imagers such as SDO/AIA, Solar Ultraviolet Imager onboard Geostationary Operational Environmental Satellite (GOES/SUVI; Darnel et al., 2022) and mid- and near-UV imagers like the Solar Ultraviolet Imaging Telescope onboard Aditya-L1 (SUIT/Aditya-L1; Tripathi et al., 2025), provide high-cadence observations in multiple broad UV channels. While EUV-imagers nominally span log
Radio observations directly measure the free–free continuum emission from all of the plasma along the line of sight (LoS), providing sensitivity to the total emission measure across a broad temperature range. Hence, high-fidelity spectroscopic and snapshot imaging observation using MeerKAT offers a complementary tool to probe the full-disk TR and coronal plasma dynamics, filling the gap between slit-based spectrographs and EUV imagers.
7.1.1 Study of quiescent sun plasma above the chromosphere
Radio waves cannot escape from regions where the local plasma frequency exceeds the emission frequency. Since the local plasma frequency is inversely related to local electron density and electron density varies with altitude above the solar surface, each frequency probes down to a specific atmospheric depth. Resolving the height structure of the solar atmosphere with spectroscopic radio imaging requires high spectral resolution and a broad frequency coverage across the characteristic plasma frequencies
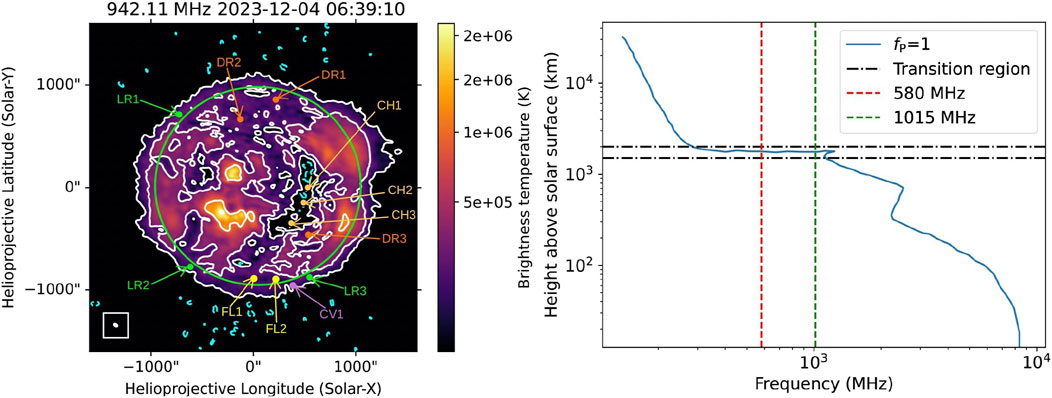
Figure 7. The left panel shows an image from MeerKAT at 942 MHz on 2023 December 04. The PSF is shown at the bottom left of the image. The contour levels are at
High-frequency (
Figure 8 shows spatially resolved radio spectra from the quiescent Sun regions. Each of these has been extracted from PSF-sized regions marked in the left panel of Figure 7. The observed spectra (red points) are fitted with a power law,
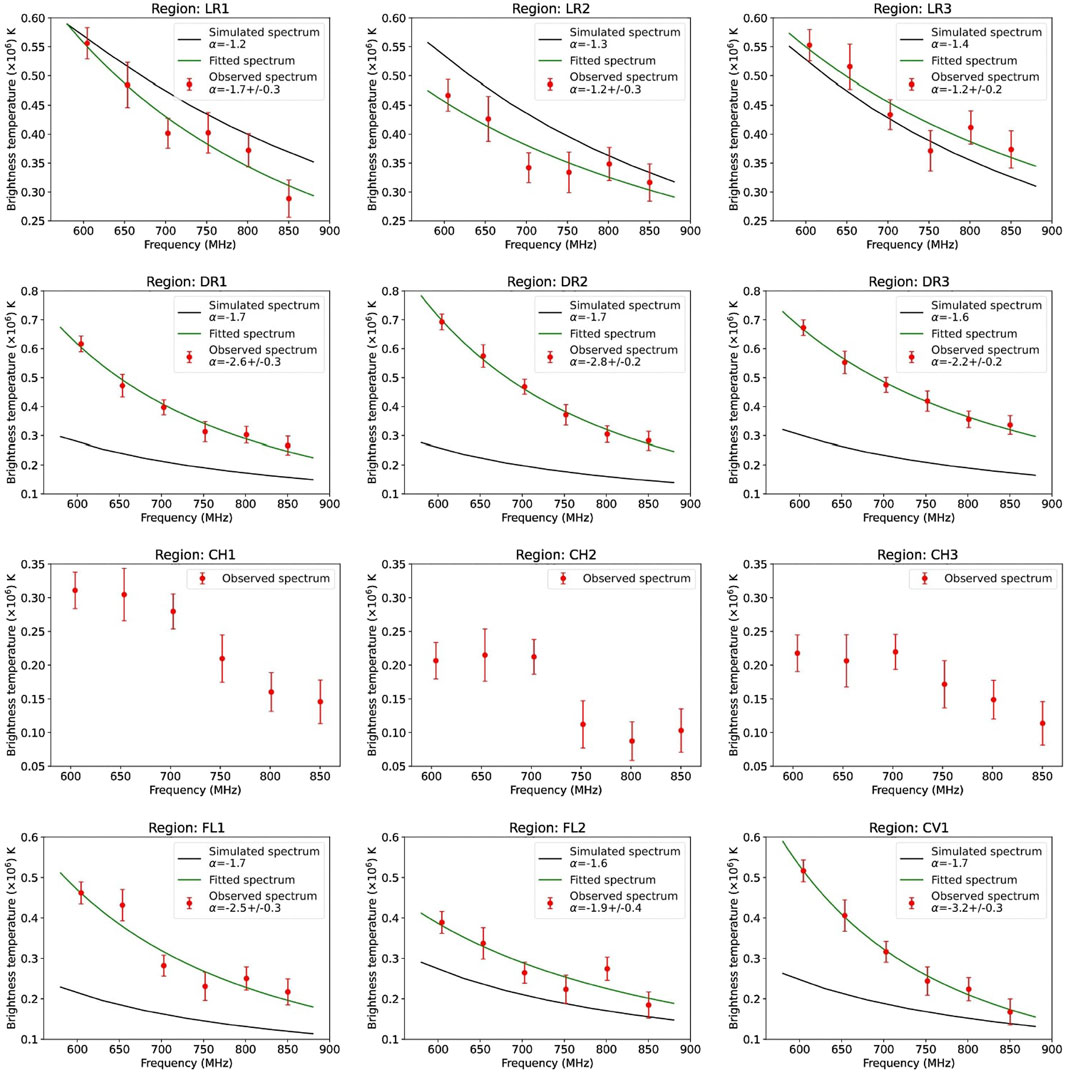
Figure 8. Spatially resolved spectra from the marked PSF-sized regions in Figure 7. Only spectral points with more than 3
Slit-based EUV spectrograph observations have shown that there is a temperature minimum of EM at log
7.1.2 Study of coronal holes, filaments and coronal cavities
Coronal holes (CHs), characterized by open magnetic fields and reduced density and temperature (Cranmer, 2009), appear as dark regions in EUV and are key sources of fast solar wind. A prominent CH, labeled as region 7 in Figure 5, shows spectra from three PSF-sized regions (CH1–CH3) in the third row of Figure 8. Unlike other regions, CH spectra flatten below
Coronal filaments and prominences (Parenti, 2014) are cool, dense, elongated structures suspended in the corona along polarity inversion lines and supported by sheared magnetic fields, typically observed in H
7.2 Study of solar eruptions and non-thermal energy release: flares, CMEs and associated radio bursts
Solar eruptions are explosive phenomena that occur in the solar atmosphere, involving the sudden release of vast amounts of energy stored in the magnetic field due to coronal dynamics. These events include solar flares, CMEs, and eruptive prominences, and are manifestations of magnetic reconnection and plasma instabilities in the solar corona. They can accelerate particles to high energies and expel large amounts of magnetized plasma in the form of CMEs into the heliosphere. These energetic particles and CMEs play a crucial role in driving space weather. Understanding the evolution of magnetic fields during their initiation, evolution, and propagation is essential for a deeper understanding of these phenomena. Spectroscopic radio imaging plays a crucial role in providing the magnetic field measurements remotely during these eruptions (Vourlidas et al., 2020; Alissandrakis and Gary, 2021; Carley et al., 2021) as well as providing an estimation of non-thermal particles associated with these processes. Both high-frequency (
We observed the Sun with MeerKAT from 2024 June 9–11 as part of SSV observations, targeting the active region (AR) NOAA (National Oceanic and Atmospheric Administration) AR 13711 and the reappearance of AR 13664, which was responsible for the May 2024 geomagnetic storm, anticipating continued activity. The top left panel of Figure 9 shows a composite image of a CME event which erupted from the western limb on 10 June 2024, at 09:40 UTC, as generated using JHelioviewer (Müller et al., 2017), with the central image showing GOES/SUVI 195 Å EUV image, and the outer panel showing SOHO/LASCO (Brueckner et al., 1995; Domingo et al., 1995) C2 base-difference coronagraph image. The top right panel shows an image from MeerKAT at 629 MHz with contours overlaid on the SUVI image, with the eruption site marked by the red box. During this observing window, a long-duration X-class flare peaking at 11:07 UTC (blue line in the bottom panel of Figure 9) occurred and remained above M-class level for a large period, from approximately 09:48 to 12:22 UTC (blue shaded region).
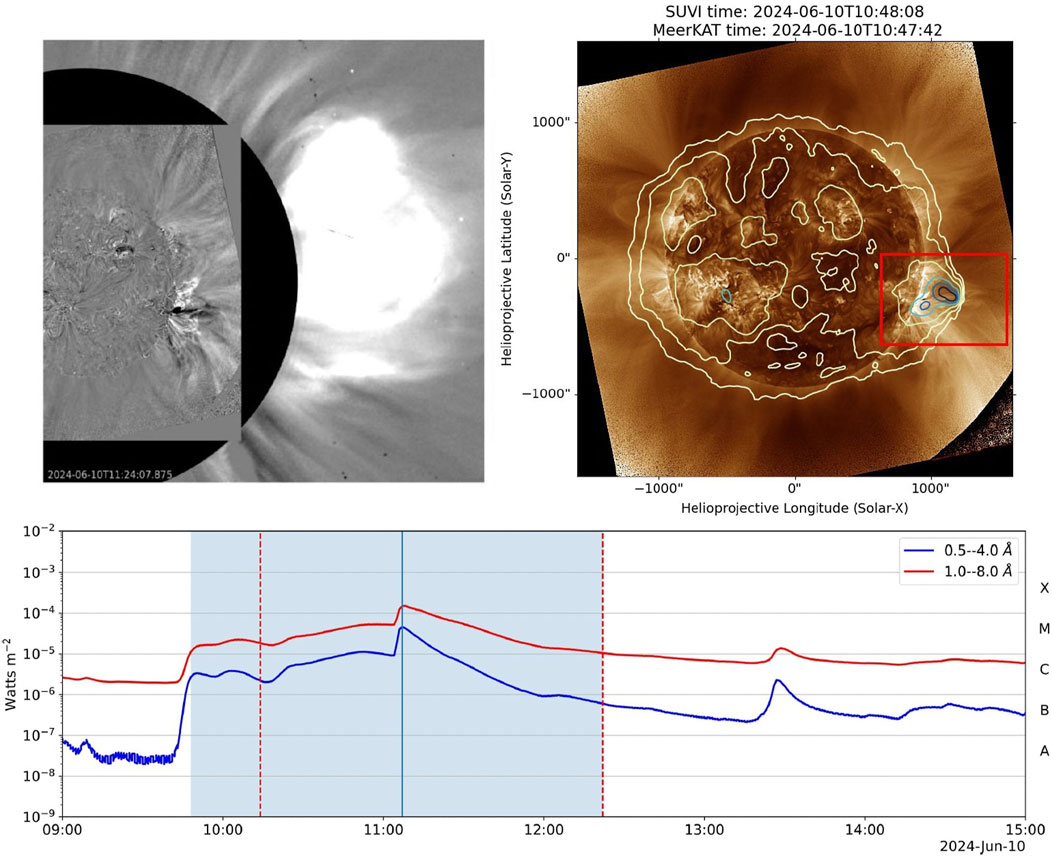
Figure 9. Flare and CME eruption on 2024 June 10. The top left panel shows base-difference composite images of the western limb eruption, with SUVI 195 Å EUV images at the center and LASCO C2 coronagraph images around. In the top-right panel, MeerKAT 629 MHz radio contours at 5%, 10%, 20%, 40%, 60%, and 80% of the peak are overlaid on SUVI, with the red box marking the eruption site. The bottom panel shows the GOES X-ray light curve; the shaded region (09:48–12:22 UTC) indicates M-class flux levels. Red dashed lines mark the MeerKAT observation window.
Several intense solar radio bursts were observed during this period in MeerKAT total power normalized dynamic spectrum, as shown in the top panel of Figure 10. A prominent, broadband burst around 10:46 UTC is highlighted in the bottom left panel, while several reverse-drifting bursts, typically associated with sunward-traveling electrons, are seen in the bottom right panel. Since dynamic spectra provide only spatially integrated information, distinguishing overlapping emissions requires spatially resolved dynamic spectra (SPREDS; Mohan and Oberoi, 2017). Previously demonstrated at meter wavelengths using the MWA, the high-dynamic-range spectroscopic snapshot capability of MeerKAT at GHz frequencies offers similar potential. A detailed SPREDS-based analysis of these radio bursts is beyond the scope of this work.
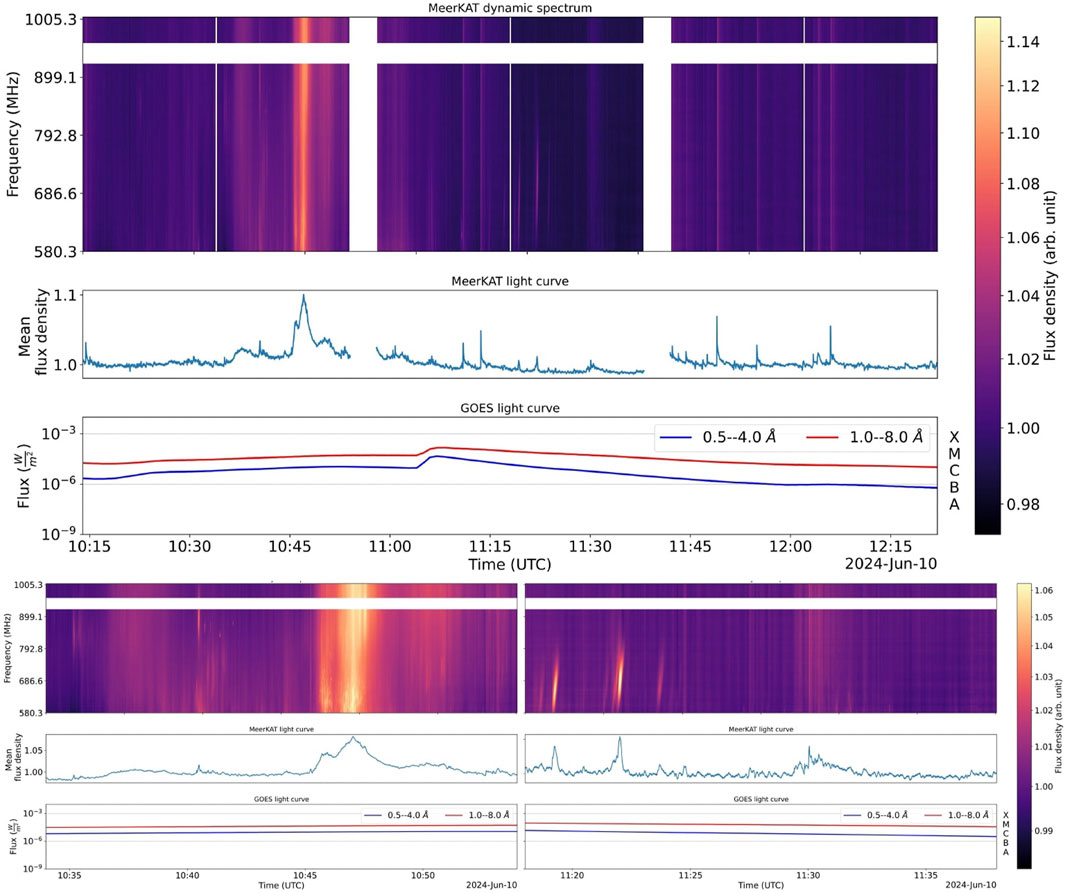
Figure 10. The top panel displays the complete duration of solar observations with MeerKAT on 2024 June 10. The bottom panels provide a zoomed-in view of the second and fourth scans. In all figures, the upper subpanels show MeerKAT total power dynamic spectrum, the middle subpanels present the band-averaged time series, and the lower subpanels plot the corresponding GOES X-ray light curve.
Three snapshot radio images at 629 MHz overlaid on SUVI images during the CME eruption are shown in the top panels of Figure 11. The bottom left panel highlights the eruption site. The region from where the spectra have been extracted at multiple timestamps is marked and the spectra are shown in the bottom right panel. A progressive steepening of the spectra with time is observed, suggesting a non-thermal origin of the emission. Spectroscopic snapshot imaging at high spectral and temporal cadence can offer valuable insights into the evolving physical conditions at the eruption site, from pre-eruption to post-eruption. A detailed analysis will be presented in a future study.
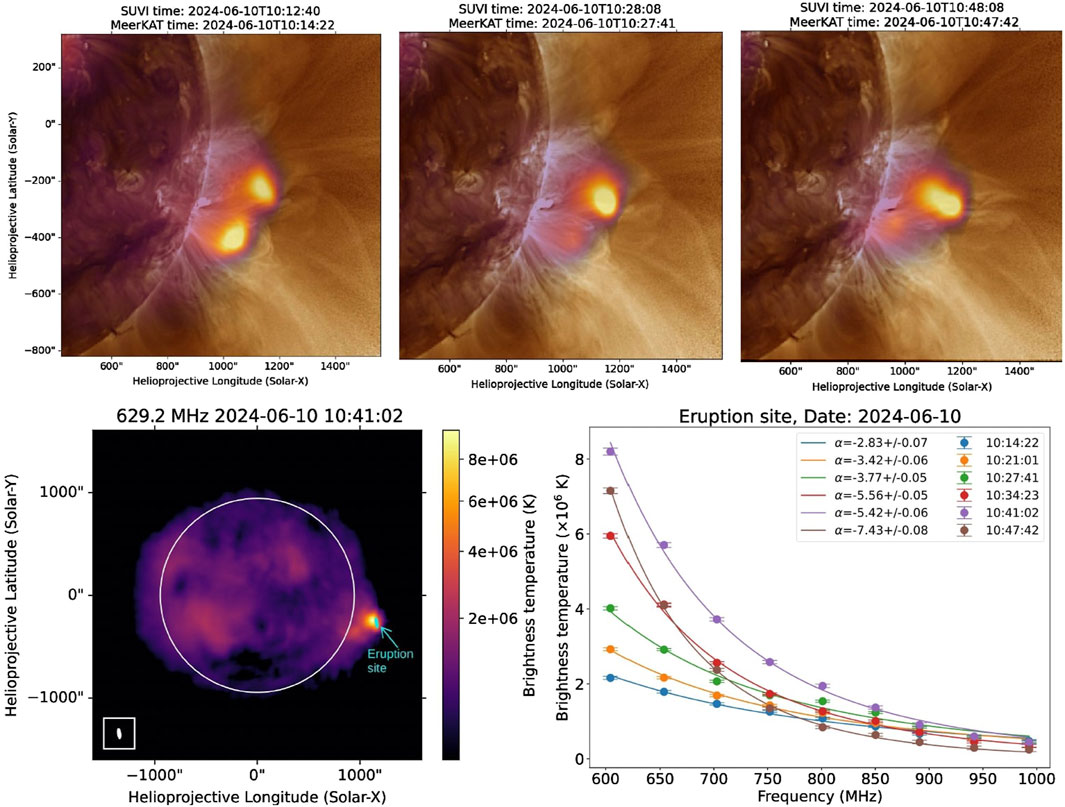
Figure 11. The top panels display overlays of MeerKAT 629 MHz radio images (in a reddish-yellow colormap) on SUVI 195 Å images. The bottom left panel shows the brightness temperature map at 629 MHz during the CME, highlighting a PSF-sized region. The corresponding spectra at various timestamps from this region are shown in the bottom right panel. Timestamps and spectral indices for each of the spectra are shown in the legend.
8 Conclusion and future works
This study has demonstrated the technical readiness of MeerKAT for carrying out well-calibrated solar observations with the telescope pointed directly at the Sun. Despite being originally designed for the observations of faint and distant galactic and extragalactic sources, MeerKAT can now be effectively utilized for solar science, enabled by the development of a specialized observing mode and a tailored calibration and imaging pipeline. Several technical challenges associated with solar observations–such as the need to attenuate the intense solar flux density to get the signal to lie within the linear range of the receivers, perform reliable flux density calibration using internal noise diodes, and account for the sidereal drift of the Sun during the observation–have been addressed. The resulting calibrated images show strong morphological agreement with EUV observations and expectations based on simulations, validating the viability of using MeerKAT for solar radio imaging and also demonstrating the robustness of the interferometric calibration and imaging pipeline. We note that MeerKAT solar observations at the upper end of the L-band and the S-band will be affected by missing flux density issues due to the limited availability of sufficiently short baselines. Potential solutions to this issue will involve incorporating single-dish total power measurements from MeerKAT itself, or from other instruments, into the interferometric imaging process.
Nonetheless, these developments offer access to a previously underexplored observational regime, enabling high spatial and spectro-temporal resolution studies of the solar atmosphere. Even the limited observations obtained during this work highlight the valuable novel insights that can be gained into the structure and dynamics of the quiet corona, weak transient events, and large-scale eruptive phenomena such as flares and CMEs. Additionally, the polarimetric capabilities of MeerKAT hold promise for coronal magnetic field studies when combined with multi-wavelength space-based and in-situ data. Ongoing efforts to characterize and validate its polarization response for solar observations aim to support such advancements and pave the way for future breakthroughs. We hope that the work presented here will also provide motivation and guidance for commissioning the solar observing mode alongside other observing modes for the upcoming next-generation instruments like the SKA-mid (Plunkett et al., 2023).
Data availability statement
The original contributions presented in the study are included in the article/Supplementary Material, further inquiries can be directed to the corresponding author.
Author contributions
DK: Conceptualization, Formal Analysis, Investigation, Methodology, Software, Visualization, Writing – original draft, Writing – review and editing. MG: Conceptualization, Data curation, Methodology, Project administration, Validation, Writing – original draft, Writing – review and editing. DP: Writing – original draft, Writing – review and editing. AV: Conceptualization, Supervision, Visualization, Writing – original draft, Writing – review and editing. PK: Writing – original draft, Writing – review and editing, Conceptualization. DO: Writing – original draft, Writing – review and editing. SS: Writing – original draft, Writing – review and editing. SB: Data curation, Project administration, Writing – original draft, Writing – review and editing. FC: Project administration, Writing – original draft, Writing – review and editing.
Funding
The author(s) declare that financial support was received for the research and/or publication of this article. This work uses observations from MeerKAT radio telescope. MeerKAT telescope is operated by the South African Radio Astronomy Observatory, which is a facility of the National Research Foundation, an agency of the Department of Science, Technology, and Innovation. The authors acknowledge the contribution of all those who designed and built MeerKAT instrument. DK acknowledges support for this research by the NASA Living with a Star Jack Eddy Postdoctoral Fellowship Program, administered by UCAR’s Cooperative Programs for the Advancement of Earth System Science (CPAESS) under award 80NSSC22M0097. DP and DO acknowledge support from the Department of Atomic Energy, Government of India, under the project no. 12-R&D-TFR-5.02-0700. AV was supported by NASA grants 80NSSC21K1860 and 80NSSC22K0970. MG, PK, SB, and FC was supported by South African Radio Astronomy Observatory. DK gratefully acknowledges Justin Jonas and Thomas Abbott (SARAO) for their valuable feedback on the early draft of the manuscript. DK gratefully acknowledges Surajit Mondal (NJIT, USA) for useful discussions and suggestions.
Conflict of interest
The authors declare that the research was conducted in the absence of any commercial or financial relationships that could be construed as a potential conflict of interest.
Generative AI statement
The author(s) declare that Generative AI was used in the creation of this manuscript. Generative AI is used to typo and grammer corrections and verified all the changes by the authors.
Any alternative text (alt text) provided alongside figures in this article has been generated by Frontiers with the support of artificial intelligence and reasonable efforts have been made to ensure accuracy, including review by the authors wherever possible. If you identify any issues, please contact us.
Publisher’s note
All claims expressed in this article are solely those of the authors and do not necessarily represent those of their affiliated organizations, or those of the publisher, the editors and the reviewers. Any product that may be evaluated in this article, or claim that may be made by its manufacturer, is not guaranteed or endorsed by the publisher.
Supplementary material
The Supplementary Material for this article can be found online at: https://www.frontiersin.org/articles/10.3389/fspas.2025.1666743/full#supplementary-material
References
Alissandrakis, C. E. (2020). Structure of the solar atmosphere: a radio perspective. Front. Astronomy Space Sci. 7, 574460–2020. doi:10.3389/fspas.2020.574460
Alissandrakis, C. E., and Gary, D. E. (2021). Radio measurements of the magnetic field in the solar chromosphere and the corona. Front. Astronomy Space Sci. 7, 591075. doi:10.3389/fspas.2020.591075
Alissandrakis, C. E., Kundu, M. R., and Lantos, P. (1980). A model for sunspot associated emission at 6 CM wavelength. ASTRON ASTROPHYS. 82, 30–40.
Aschwanden, M. J. (2005). “Physics of the solar corona,” in An introduction with problems and solutions. 2nd edition. doi:10.1007/3-540-30766-4
Bastian, T. S. (1994). Angular scattering of solar radio emission by coronal turbulence. Astrophys. J. 426, 774. doi:10.1086/174114
Bastian, T. S., Benz, A. O., and Gary, D. E. (1998). Radio emission from solar flares. Annu. Rev. ASTRON Astr. 36, 131–188. doi:10.1146/annurev.astro.36.1.131
Bastian, T. S., Pick, M., Kerdraon, A., Maia, D., and Vourlidas, A. (2001). The coronal mass ejection of 1998 april 20: Direct imaging at radio wavelengths. Astrophysical J. 558, L65–L69. doi:10.1086/323421
Bastian, T. S., Shimojo, M., Bárta, M., White, S. M., and Iwai, K. (2022). Solar observing with the atacama large millimeter-submillimeter array. Front. Astronomy Space Sci., 9–2022. doi:10.3389/fspas.2022.977368
Bhunia, S., Carley, E. P., Oberoi, D., and Gallagher, P. T. (2023). Imaging-spectroscopy of a band-split type II solar radio burst with the Murchison Widefield Array. ASTRON ASTROPHYS. 670, A169. doi:10.1051/0004-6361/202244456
Bonmartin, J., Bouteille, A., Clavelier, B., Issartel, M. P., Kerdraon, A., Lantos, M. F., et al. (1983). The mark III Nançay radioheliograph the radioheliograph Group. Sol. Phys. 88, 383–390. doi:10.1007/BF00196201
Briggs, D. S. (1995). High fidelity interferometric imaging: robust weighting and NNLS deconvolution. Am. Astronomical Soc. Meet. Abstr. 112, 02.
Brueckner, G. E., Howard, R. A., Koomen, M. J., Korendyke, C. M., Michels, D. J., Moses, J. D., et al. (1995). The large angle spectroscopic coronagraph (LASCO). Sol. Phys. 162, 357–402. doi:10.1007/BF00733434
Butler, B. (2005). VLA Test Memo 236 How close to the Sun should we observe with the VLA?. National Radio Astronomy Observatory. Available online at: https://library.nrao.edu/public/memos/vla/test/VLAT_236.pdf.
Carley, E. P., Cecconi, B., Reid, H. A., Briand, C., Raja, K. S., Masson, S., et al. (2021). Observations of shock propagation through turbulent plasma in the solar corona. Astrophysical J. 921, 3. doi:10.3847/1538-4357/ac1acd
Chen, B., Shen, C., Gary, D. E., Reeves, K. K., Fleishman, G. D., Yu, S., et al. (2020). Measurement of magnetic field and relativistic electrons along a solar flare current sheet. Nat. Astron. 4, 1140–1147. doi:10.1038/s41550-020-1147-7
Cheung, M. C. M., Boerner, P., Schrijver, C. J., Testa, P., Chen, F., Peter, H., et al. (2015). Thermal diagnostics with the atmospheric imaging assembly on board the solar dynamics observatory: a validated method for differential emission measure inversions. Astrophysical J. 807, 143. doi:10.1088/0004-637X/807/2/143
Collier, J. D., Frank, B., Sekhar, S., and Taylor, A. R. (2021). “The IDIA PROCESSMEERKAT pipeline: fast CASA processing on a Cloud-based HPC cluster,” in 2021 XXXIVth general Assembly and scientific Symposium of the International union of radio science (URSI GASS, 4, 1–4. doi:10.23919/URSIGASS51995.2021.9560276
Commission 40: Radio astronomy (radio astronomie) (1973). Trans. Int. Astronomical Union 15, 165–167. doi:10.1017/S0251107X00031606
Culhane, J. L., Harra, L. K., James, A. M., Al-Janabi, K., Bradley, L. J., Chaudry, R. A., et al. (2007). The euv imaging spectrometer for hinode. Sol. Phys. 243, 19–61. doi:10.1007/s01007-007-0293-1
Darnel, J. M., Seaton, D. B., Bethge, C., Rachmeler, L., Jarvis, A., Hill, S. M., et al. (2022). The goes-r solar ultraviolet imager. Space weather. 20, e2022SW003044. doi:10.1029/2022sw003044
de Gasperin, F., Vink, J., McKean, J. P., Asgekar, A., Avruch, I., Bentum, M. J., et al. (2020). Cassiopeia A, Cygnus A, Taurus A, and Virgo A at ultra-low radio frequencies. ASTRON ASTROPHYS. 635, A150. doi:10.1051/0004-6361/201936844
de Villiers, M. S. (2023). MeerKAT holography measurements in the UHF, L, and S bands. Astronomical J. 165, 78. doi:10.3847/1538-3881/acabc3
de Villiers, M. S., and Cotton, W. D. (2022). Meerkat primary-beam measurements in the l band. Astronomical J. 163, 135. doi:10.3847/1538-3881/ac460a
Del Zanna, G., and Mason, H. E. (2018). Solar UV and X-ray spectral diagnostics. Living Rev. Sol. Phys. 15, 5. doi:10.1007/s41116-018-0015-3
Del Zanna, G., Bromage, B. J. I., Landi, E., and Landini, M. (2001). Solar EUV spectroscopic observations with SOHO/CDS. I. An in-flight calibration study. ASTRON ASTROPHYS. 379, 708–734. doi:10.1051/0004-6361:20011220
DePontieu, B., Title, A. M., Lemen, J. R., Kushner, G. D., Akin, D. J., Allard, B., et al. (2014). The interface region imaging spectrograph (iris). Sol. Phys. 289, 2733–2779. doi:10.1007/s11207-014-0485-y
Dewdney, P. E., Hall, P. J., Schilizzi, R. T., and Lazio, T. J. L. W. (2009). The square kilometre array. Proc. IEEE 97, 1482–1496. doi:10.1109/JPROC.2009.2021005
Dey, S., Kansabanik, D., Oberoi, D., and Mondal, S. (2025). First robust detection of linear polarization from metric solar emissions: challenging established paradigms. ApJL 988, L73. doi:10.3847/2041-8213/adef0e
Domingo, V., Fleck, B., and Poland, A. I. (1995). The SOHO mission: an Overview. Sol. Phys. 162, 1–37. doi:10.1007/BF00733425
Fleishman, G. D., Gary, D. E., Chen, B., Kuroda, N., Yu, S., and Nita, G. M. (2020). Decay of the coronal magnetic field can release sufficient energy to power a solar flare. Science 367, 278–280. doi:10.1126/science.aax6874
Fleishman, G. D., Kuznetsov, A. A., and Landi, E. (2021). Gyroresonance and free-free radio emissions from Multithermal Multicomponent plasma. Astrophys. J. 914, 52. doi:10.3847/1538-4357/abf92c
Forland, B. C., Gibson, S. E., Dove, J. B., Rachmeler, L. A., and Fan, Y. (2013). Coronal cavity Survey: morphological Clues to eruptive magnetic Topologies. Sol. Phys. 288, 603–615. doi:10.1007/s11207-013-0361-1
Fuller, J., and Gibson, S. E. (2009). A Survey of coronal cavity density Profiles. Astrophys. J. 700, 1205–1215. doi:10.1088/0004-637X/700/2/1205
Gary, D. E. (2023). New insights from imaging spectroscopy of solar radio emission. Annu. Rev. Astronomy Astrophysics 61, 427–472. doi:10.1146/annurev-astro-071221-052744
Gary, D. E., and Hurford, G. J. (1989). Solar radio burst spectral observations, particle acceleration, and Wave-particle interactions. American Geophysical Union AGU, 237–246. doi:10.1029/GM054p0237
Gary, D. E., Nita, G. M., and Sane, N. (2012). Expanded Owens Valley Solar array (EOVSA) Testbed and Prototype. Am. Astronomical Soc. Meet. Abstr. 204 (30).
Gary, D. E., Chen, B., Dennis, B. R., Fleishman, G. D., Hurford, G. J., Krucker, S., et al. (2018). Microwave and hard X-ray observations of the 2017 September 10 solar limb flare. Astrophys. J. 863, 83. doi:10.3847/1538-4357/aad0ef
Gibson, S. (2015). Coronal cavities: observations and Implications for the magnetic Environment of prominences. Cham: Springer International Publishing, 323–353. doi:10.1007/978-3-319-10416-4_13
Gibson, S. E., and Fan, Y. (2006). Coronal prominence structure and dynamics: a magnetic flux rope interpretation. J. Geophys. Res. Space Phys. 111, A12103. doi:10.1029/2006JA011871
Gupta, Y., Ajithkumar, B., Kale, H., Nayak, S., Sabhapathy, S. S. S., Sureshkumar, S., et al. (2017). The upgraded GMRT: Opening new windows on the radio universe. Curr. Sci. 113, 707–714. doi:10.18520/cs/v113/i04/707-714
Hannah, I. G., and Kontar, E. P. (2012). Differential emission measures from the regularized inversion of Hinode and SDO data. ASTRON ASTROPHYS. 539, A146. doi:10.1051/0004-6361/201117576
Jonas, J.MeerKAT Team (2016). “The MeerKAT radio telescope,” in MeerKAT science: on the Pathway to the SKA, 1. doi:10.22323/1.277.0001
Kansabanik, D., Oberoi, D., and Mondal, S. (2022). Tackling the unique challenges of low-frequency solar polarimetry with the square kilometre array low precursor: the algorithm. Astrophysical J. 932, 110. doi:10.3847/1538-4357/ac6758
Kansabanik, D., Bera, A., Oberoi, D., and Mondal, S. (2023). Tackling the unique challenges of low-frequency solar polarimetry with the square kilometre array low precursor: pipeline implementation. Astrophysical J. Suppl. Ser. 264, 47. doi:10.3847/1538-4365/acac79
Kansabanik, D., Mondal, S., and Oberoi, D. (2023). Deciphering faint Gyrosynchrotron emission from coronal mass ejection using spectropolarimetric radio imaging. ApJ 950, 164. doi:10.3847/1538-4357/acc385
Kansabanik, D., Mondal, S., and Oberoi, D. (2024). Spectropolarimetric radio imaging of faint Gyrosynchrotron emission from a CME: a possible indication of the Insufficiency of Homogeneous models. Astrophys. J. 968, 55. doi:10.3847/1538-4357/ad43e9
Kansabanik, D., Mondal, S., Oberoi, D., Chibueze, J. O., Engelbrecht, N. E., Strauss, R. D., et al. (2024). Spectroscopic imaging of the sun with meerkat: Opening a new frontier in solar physics. Astrophysical J. 961, 96. doi:10.3847/1538-4357/ad0b7f
Khan, R., and Nagaraju, K. (2022). Spectral lines in fuv and euv for diagnosing coronal magnetic field. Sol. Phys. 297, 96. doi:10.1007/s11207-022-02024-2
Kumari, A., Morosan, D. E., Mugundhan. Zhang, V., Magdalenic, J., Zucca, P., Kilpua, E. K. J., et al. (2025). On the source sizes of type II radio bursts with LOFAR. arXiv e-prints , arXiv:2507.01408doi. doi:10.48550/arXiv.2507.01408
Landi, E., and Chiuderi Drago, F. (2008). The quiet-sun differential emission measure from radio and UV measurements. Astrophys. J. 675, 1629–1636. doi:10.1086/527285
Lemen, J. R., Title, A. M., Akin, D. J., Boerner, P. F., Chou, C., Drake, J. F., et al. (2012). The atmospheric imaging assembly (AIA) on the solar dynamics observatory (SDO). Sol. Phys. 275, 17–40. doi:10.1007/s11207-011-9776-8
Lonsdale, C. J., Cappallo, R. J., Morales, M. F., Briggs, F. H., Benkevitch, L., Bowman, J. D., et al. (2009). The Murchison Widefield array: Design Overview. IEEE Proc. 97, 1497–1506. doi:10.1109/JPROC.2009.2017564
Magdalenić, J., Carley, E. P., Zucca, P., Chrysaphi, L., Vocks, C., Morosan, D. E., et al. (2020). Fine structure of a solar type ii radio burst observed by lofar. Astrophysical J. Lett. 897, L15. doi:10.3847/2041-8213/ab9abc
Mancuso, S., Giordano, S., Barghini, D., and Telloni, D. (2020). Differential rotation of the solar corona: a new data-adaptive multiwavelength approach. ASTRON ASTROPHYS. 644, A18. doi:10.1051/0004-6361/202039094
Marqué, C. (2004). Radio metric observations of quiescent filament cavities. Astrophys. J. 602, 1037–1050. doi:10.1086/381085
Mason, J. P., Chamberlin, P. C., Seaton, D., Burkepile, J., Colaninno, R., Dissauer, K., et al. (2021). SunCET: the sun coronal ejection tracker Concept. J. Space Weather Space Clim. 11, 20. doi:10.1051/swsc/2021004
McCauley, P. I., Cairns, I. H., White, S. M., Mondal, S., Lenc, E., Morgan, J., et al. (2019). The low-frequency solar corona in circular polarization. Sol. Phys. 294, 106. doi:10.1007/s11207-019-1502-y
Mohan, A. (2021a). Discovery of correlated evolution in solar noise storm source parameters: insights on magnetic field dynamics during a Microflare. Astrophysical Journall 909, L1. doi:10.3847/2041-8213/abe70a
Mohan, A. (2021b). Characterising coronal turbulence using snapshot imaging of radio bursts in 80-200 mhz. Astronomy Astrophysics 655, A77. doi:10.1051/0004-6361/202142029
Mohan, A., and Oberoi, D. (2017). 4D data Cubes from radio-interferometric spectroscopic snapshot imaging. Sol. Phys. 292, 168. doi:10.1007/s11207-017-1193-1
Mohan, A., Mondal, S., Oberoi, D., and Lonsdale, C. J. (2019). Evidence for Super-Alfvénic Oscillations in solar type III radio burst sources. Astrophysical J. 875, 98. doi:10.3847/1538-4357/ab0ae5
Mondal, S. (2021). A Search for the counterparts of quiet-sun radio transients in extreme ultraviolet data. Sol. Phys. 296, 131. doi:10.1007/s11207-021-01877-3
Mondal, S., Oberoi, D., and Mohan, A. (2020a). First radio evidence for impulsive heating contribution to the quiet solar corona. Astrophysical Journall 895, L39. doi:10.3847/2041-8213/ab8817
Mondal, S., Oberoi, D., and Vourlidas, A. (2020b). Estimation of the physical parameters of a CME at high coronal heights using low-frequency radio observations. Astrophysical J. 893, 28. doi:10.3847/1538-4357/ab7fab
Mondal, S., Kansabanik, D., Oberoi, D., and Dey, S. (2024). New insights into type-i solar noise storms from high angular resolution spectroscopic imaging with the upgraded giant metrewave radio telescope. Astrophysical J. 975, 122. doi:10.3847/1538-4357/ad77c2
Mondal, S., Zhang, P., Kansabanik, D., Oberoi, D., and Pearce, G. (2025). Observation and modeling of small spatial structures of solar radio noise storms using the uGMRT. Sol. Phys. 300, 109. doi:10.1007/s11207-025-02519-8
Morosan, D. E., Räsänen, J. E., Kumari, A., Kilpua, E. K. J., Bisi, M. M., Dabrowski, B., et al. (2022). Exploring the circular polarisation of low–frequency solar radio bursts with lofar. Sol. Phys. 297, 47. doi:10.1007/s11207-022-01976-9
Müller, D., Nicula, B., Felix, S., Verstringe, F., Bourgoignie, B., Csillaghy, A., et al. (2017). JHelioviewer. Time-dependent 3D visualisation of solar and heliospheric data. ASTRON ASTROPHYS. 606, A10. doi:10.1051/0004-6361/201730893
Nakajima, H., Nishio, M., Enome, S., Shibasaki, K., Takano, T., Hanaoka, Y., et al. (1994). The Nobeyama radioheliograph. IEEE Proc. 82, 705–713. doi:10.1109/5.284737
Nindos, A. (2020). Incoherent solar radio emission. Front. Astronomy Space Sci. 7, 57. doi:10.3389/fspas.2020.00057
Oberoi, D., Bisoi, S. K., Sasikumar Raja, K., Kansabanik, D., Mohan, A., Mondal, S., et al. (2023). Preparing for solar and heliospheric science with the SKAO: an Indian perspective. J. Astrophysics Astronomy 44, 40. doi:10.1007/s12036-023-09917-z
Offringa, A. R., McKinley, B., Hurley-Walker, N., Briggs, F. H., Wayth, R. B., Kaplan, D. L., et al. (2014). WSCLEAN: an implementation of a fast, generic wide-field imager for radio astronomy. Mon. Notices R. Astronomical Soc. 444, 606–619. doi:10.1093/mnras/stu1368
Parenti, S. (2014). Solar prominences: observations. Living Rev. Sol. Phys. 11, 1. doi:10.12942/lrsp-2014-1
Perley, R. A., and Butler, B. J. (2017). An accurate flux density scale from 50 mhz to 50 ghz. Astrophysical J. Suppl. Ser. 230, 7. doi:10.3847/1538-4365/aa6df9
Perley, R., Napier, P., Jackson, J., Butler, B., Carlson, B., Fort, D., et al. (2009). The expanded Very large array. IEEE Proc. 97, 1448–1462. doi:10.1109/JPROC.2009.2015470
Pesnell, W. D., Thompson, B. J., and Chamberlin, P. C. (2012). The solar dynamics observatory (SDO). Sol. Phys. 275, 3–15. doi:10.1007/s11207-011-9841-3
Pick, M., and Vilmer, N. (2008). Sixty-five years of solar radioastronomy: flares, coronal mass ejections and sun–earth connection. Astronomy Astrophysics Rev. 16, 1–153. doi:10.1007/s00159-008-0013-x
Plunkett, A., Hacar, A., Moser-Fischer, L., Petry, D., Teuben, P., Pingel, N., et al. (2023). Data combination: interferometry and single-dish imaging in radio astronomy. Publ. Astronomical Soc. Pac. 135, 034501. doi:10.1088/1538-3873/acb9bd
Rahman, M. M., McCauley, P. I., and Cairns, I. H. (2019). On the relative brightness of coronal holes at low frequencies. Sol. Phys. 294, 7. doi:10.1007/s11207-019-1396-8
Raymond, J. C., and Doyle, J. G. (1981). The energy balance in coronal holes and average quiet-sun regions. Astrophys. J. 247, 686–691. doi:10.1086/159080
Rocklin, M. (2015). “Dask: parallel computation with blocked algorithms and task scheduling,” in Proceedings of the 14th Python in science conference. Editors K. Huff, and J. Bergstra, 130–136.
Samboco, V. G., Heywood, I., and Smirnov, O. (2024). SolarKAT: solar imaging pipeline for MeerKAT. Astrophys. Source Code Libr. Rec. ascl 2401, 013.
Santander-Vela, J., Bartolini, M., Miccolis, M., and Rees, N. (2021). From SKA to SKAO: early progress in the SKAO construction. 18th International Conference on Accelerator and Large Experimental Physics Control Systems held 14-22 October. 14–20. doi:10.18429/JACoW-ICALEPCS2021-MOAL03
Sharma, R., and Oberoi, D. (2020). Propagation effects in quiet sun observations at meter wavelengths. Astrophysical J. 903, 126. doi:10.3847/1538-4357/abb949
Sharma, R., Oberoi, D., and Arjunwadkar, M. (2018). Quantifying weak nonthermal solar radio emission at low radio frequencies. Astrophysical J. 852, 69. doi:10.3847/1538-4357/aa9d96
Shestov, S. V., Zhukov, A. N., Inhester, B., Dolla, L., and Mierla, M. (2021). Expected performances of the proba-3/aspiics solar coronagraph: simulated data. A&A 652, A4. doi:10.1051/0004-6361/202140467
Shimojo, M., Bastian, T. S., Kameno, S., and Hales, A. S. (2024). Observing the sun with the atacama large millimeter/submillimeter array (ALMA): polarization observations at 3 mm. Sol. Phys. 299, 20. doi:10.1007/s11207-024-02265-3
Singh, J., Ramesh, R., Prasad, B. R., Priyal, V. M., Raja, K. S., Venkata, S. N., et al. (2025). Visible emission line coronagraph (VELC) on board aditya-L1. Sol. Phys. 300, 66. doi:10.1007/s11207-025-02477-1
Sundaram, G. A. S., and Subramanian, K. R. (2004). Spectrum of solar type I continuum noise storm in the 50-80 MHz band and plasma characteristics in the associated source region. Astrophys. J. 605, 948–959. doi:10.1086/382582
The CASA Team Bean, B., Bhatnagar, S., Castro, S., Meyer, J. D., Emonts, B., et al. (2022). Casa, the common astronomy software applications for radio astronomy. Publ. Astronomical Soc. Pac. 134, 114501. doi:10.1088/1538-3873/ac9642
Tingay, S. J., Goeke, R., Bowman, J. D., Emrich, D., Ord, S. M., Mitchell, D. A., et al. (2013). The Murchison Widefield array: the square kilometre array precursor at low radio frequencies, Publ. Astron. Soc. Aust. 30, e007. doi:10.1017/pasa.2012.007
Tripathi, D., Ramaprakash, A. N., Padinhatteeri, S., Sarkar, J., Burse, M., Tyagi, A., et al. (2025). The solar ultraviolet imaging telescope on board aditya-L1. Sol. Phys. 300, 30. doi:10.1007/s11207-025-02423-1
van Haarlem, M. P., Wise, M. W., Gunst, A. W., Heald, G., McKean, J. P., Hessels, J. W. T., et al. (2013). LOFAR: the LOw-Frequency ARray. Astronomy Astrophysics 556, A2. doi:10.1051/0004-6361/201220873
Vocks, C., Mann, G., Breitling, F., Bisi, M. M., Dkabrowski, B., Fallows, R., et al. (2018). LOFAR observations of the quiet solar corona. ASTRON ASTROPHYS. 614, A54. doi:10.1051/0004-6361/201630067
Vourlidas, A., and Bastian, T. S. (1996). Multiband vla observations of solar active regions: implications for the distribution of coronal plasma. Astrophysical J. 466, 1039. doi:10.1086/177574
Vourlidas, A., Carley, E. P., and Vilmer, N. (2020). Radio observations of coronal mass ejections: space weather aspects. Front. Astronomy Space Sci. 7, 43. doi:10.3389/fspas.2020.00043
Zhang, J., Kundu, M. R., White, S. M., Dere, K. P., and Newmark, J. S. (2001). Reconciling extreme-ultraviolet and radio observations of the sun’s corona. Astrophys. J. 561, 396–405. doi:10.1086/323212
Zhang, P., Zucca, P., Kozarev, K., Carley, E., Wang, C., Franzen, T., et al. (2022). Imaging of the quiet sun in the frequency range of 20-80 MHz. Astrophysical J. 932, 17. doi:10.3847/1538-4357/ac6b37
Keywords: solar radio emissions, solar corona, spectroscopic snapshot images, calibration methods, solar observations, automated calibration, imaging pipeline, solar images
Citation: Kansabanik D, Gouws M, Patra D, Vourlidas A, Kotzé P, Oberoi D, Shaik SB, Buchner S and Camilo F (2025) Solar observation with MeerKAT: demonstration of technical readiness and initial science highlights. Front. Astron. Space Sci. 12:1666743. doi: 10.3389/fspas.2025.1666743
Received: 16 July 2025; Accepted: 25 August 2025;
Published: 19 September 2025.
Edited by:
Patrick Antolin, Northumbria University, United KingdomReviewed by:
Sven Wedemeyer, University of Oslo, NorwayMasumi Shimojo, National Astronomical Observatory of Japan (NAOJ), Japan
Copyright © 2025 Kansabanik, Gouws, Patra, Vourlidas, Kotzé, Oberoi, Shaik, Buchner and Camilo. This is an open-access article distributed under the terms of the Creative Commons Attribution License (CC BY). The use, distribution or reproduction in other forums is permitted, provided the original author(s) and the copyright owner(s) are credited and that the original publication in this journal is cited, in accordance with accepted academic practice. No use, distribution or reproduction is permitted which does not comply with these terms.
*Correspondence: Devojyoti Kansabanik, ZGV2b2p5b3RpOTZAZ21haWwuY29t, ZGthbnNhYmFuaWtAdWNhci5lZHU=