 Federico Tosi
 Alessandro Mura
 Francesca Zambon
- Istituto Nazionale di Astrofisica – Istituto di Astrofisica e Planetologia Spaziali (INAF-IAPS), Rome, Italy
Understanding Io’s volcanic heat flow distribution is critical to constraining its internal structure and tidal heating mechanisms, including the debated presence of a global magma ocean. Recent analyses based on Juno/JIRAM M-band data suggest latitudinal variations in thermal emission consistent with magma ocean models. We critically assess these conclusions by addressing three key limitations in the JIRAM M-band dataset and its interpretation. First, we note that saturation effects in the JIRAM M-band imager detector, if not discussed and treated in detail, may systematically underestimate radiance from Io’s hot spots. Cross-calibration with JIRAM spectrometer data reveals non-linearity above certain values, which argues for double checking with spectrometer data whenever possible. Second, we show that using M-band integrated radiance as a direct proxy for total thermal emission is physically inconsistent without independent temperature constraints, as the spectral-to-total radiance ratio varies strongly with temperature. Reliance on M-band data alone introduces systematic biases in estimating total power outputs and spatial heat flow distributions. Third, rigorous statistical testing finds no robust correlation between latitude and spectral radiance density across multiple binning schemes. The observed latitudinal trends are highly sensitive to model-informed thresholds and dominated by a small number of bright hot spots, indicating insufficient empirical support for claimed polar heat flux asymmetries. Taken together, these findings caution against overinterpreting JIRAM M-band data in isolation and highlight the need for multi-wavelength, multi-instrument analyses with transparent data treatment to robustly constrain Io’s volcanic heat flow and internal heating models. We recommend future studies incorporate comprehensive spectral data and explicitly account for detector saturation and temperature effects to improve the physical reliability of volcanic power estimates on Io.
1 Introduction
Jupiter’s moon Io stands out as the most volcanically active body in the Solar System, exhibiting an average global surface heat flux exceeding 2 W/m2—roughly 30 times greater than Earth’s geothermal output (Veeder et al., 1994; Lainey et al., 2009). This extraordinary thermal emission is primarily the result of tidal heating, a process whereby gravitational interactions with Jupiter, along with orbital resonances involving Europa and Ganymede, continuously deform Io’s interior. The resulting mechanical flexing generates internal frictional heat, which fuels extensive and persistent volcanic activity across the moon’s surface.
The spatial distribution of this heat flow may offer critical insight into the structure and dynamics of Io’s interior, particularly the depth at which tidal energy is dissipated. Several conceptual models have been proposed to describe how and where this dissipation occurs, each yielding distinct predictions for the latitudinal pattern of surface heat emission:
1. Asthenospheric Heating: If tidal dissipation occurs predominantly in a low-viscosity asthenosphere, surface heat flow is expected to peak at equatorial and mid-latitudes, with minimal flux near the poles (Segatz et al., 1988).
2. Deep Mantle Heating: If tidal dissipation occurs primarily in the deep, viscous mantle, surface heat flux is expected to peak near the poles in a degree-2 pattern, with minima near the sub- and anti-Jovian points (Segatz et al., 1988).
3. Magma Ocean Model: A global subsurface magma ocean may redistribute tidal heat laterally and reduce the correlation between surface volcanism and interior heat sources. However, polar surface emission may remain limited due to lithospheric conditions that inhibit magma ascent—a factor not inherently addressed by magma ocean models, but likely crucial to explaining observed asymmetries (Tyler et al., 2015; Matsuyama et al., 2022; see also the workshop report by de Kleer et al., 2019).
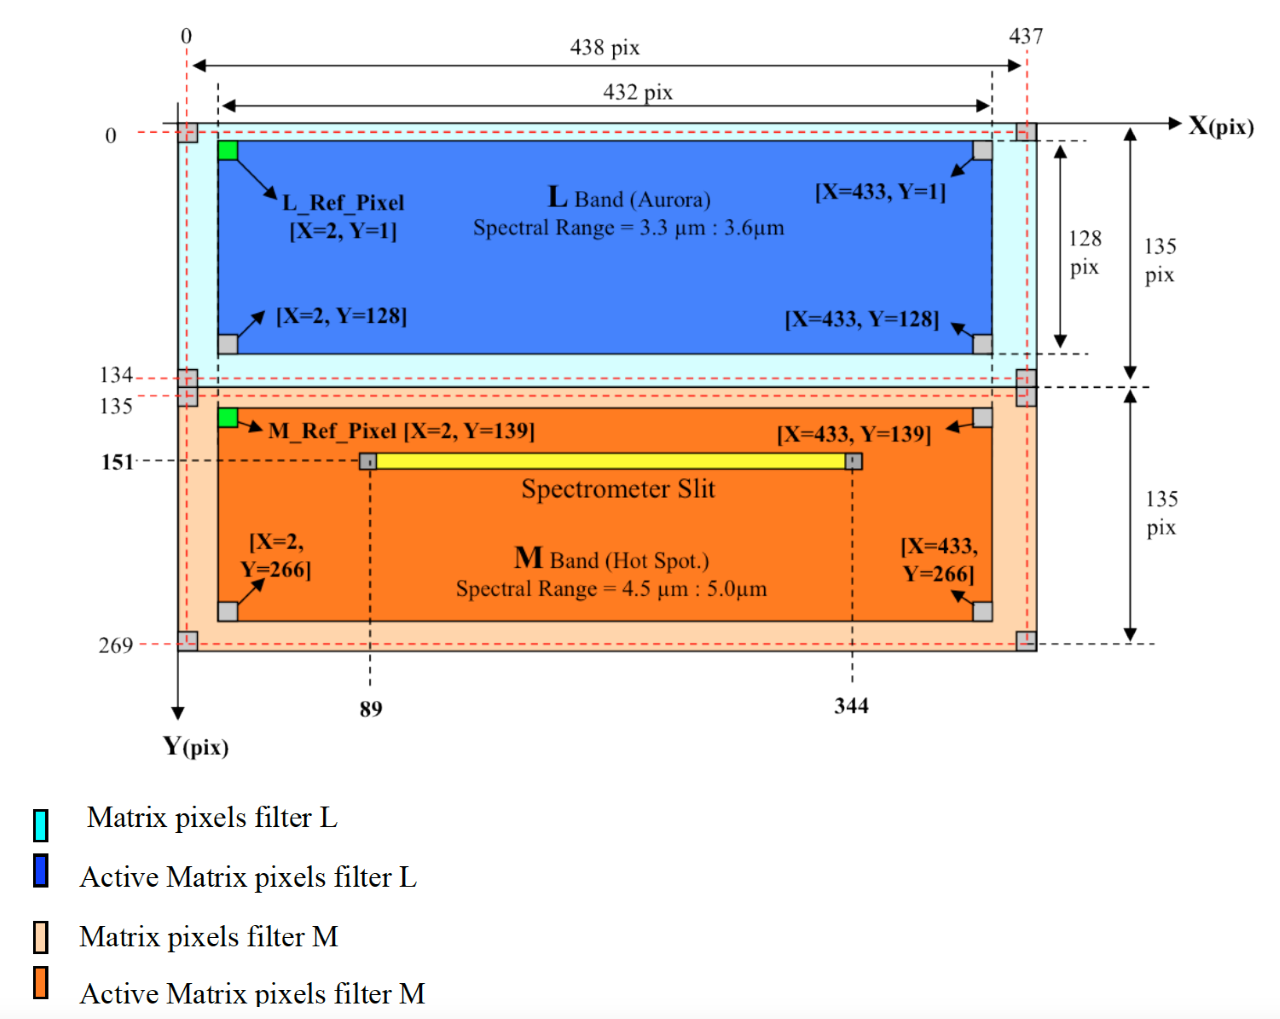
These models differ not only in depth but in how efficiently they transfer energy to the surface, with important implications for the spatial pattern of heat flow. Volcanic activity on Io was first revealed by Voyager imaging in 1979 (Morabito et al., 1979; Carr et al., 1979; Strom et al., 1979) and later investigated extensively by Galileo observations (Lopes-Gautier et al., 1999; McEwen et al., 2000; Radebaugh et al., 2001). Subsequent ground-based campaigns, using facilities such as Keck, the NASA Infrared Telescope Facility and the Large Binocular Telescope, further monitored Io’s thermal emission and volcanic variability (e.g., de Pater et al., 2004; de Kleer et al., 2014; de Kleer and de Pater, 2016; de Kleer et al., 2021). Among the instruments capable of providing such data, the Jovian Infrared Auroral Mapper (JIRAM) aboard NASA’s Juno spacecraft offers unique observational capabilities. JIRAM is a dual-channel spectro-imager aboard NASA’s Juno spacecraft, which entered orbit around Jupiter in July 2016 (Bolton et al., 2017; Adriani et al., 2017). JIRAM was originally designed to investigate Jupiter’s atmosphere and auroral regions, not the Galilean moons. As Juno’s highly elliptical orbit around Jupiter evolved, the equatorial crossings occurred at progressively smaller radial distances. This orbital evolution enabled closer approaches to the Galilean satellites, making them targets of opportunity. The instrument includes an imager with two infrared bands—L (centered at 3.45 µm) and M (centered at 4.78 µm)—and a slit spectrometer covering the 2.0–5.0 µm range. Both channels share a common telescope and employ a de-spinning mirror to counteract the spacecraft’s rotation; both imaging filters (L and M) have a field of view of 5.87° × 1.74 ° (432 × 128 pixels). The M-band imager, with a field of view of 5.87 ° × 1.74 ° (432 × 128 pixels), is particularly sensitive to thermal emission from Io’s volcanic activity. The spectrometer provides high-resolution spectral data along a 256-pixel slit located within the M-band’s field of view. Regular calibration using onboard sources and sky observations ensures stable instrument performance over time.
Analyses of JIRAM data have yielded valuable insights into the spatial distribution of radiance, contributing to the ongoing effort to distinguish between competing models of internal heating. However, interpreting infrared imagery in the M-band as a proxy for total volcanic heat output presents significant challenges. Factors such as detector saturation—particularly in the presence of bright, high-temperature sources—can lead to systematic underestimation of emission intensity. Moreover, using radiance at a single narrow band as a stand-in for total thermal emission introduces biases, especially for cooler or partially resolved hot spots that contribute substantially to the moon’s total energy budget. In addition, the inference of latitudinal trends can be sensitive to the assumptions made during data reduction, such as latitude binning schemes (i.e., grouping the data into latitude intervals of various widths) to test for possible correlations with volcanic radiance density and statistical treatment of spatial variability.
To address these complexities, this study undertakes a comprehensive reexamination of the JIRAM M-band dataset, with a focus on refining the treatment of instrumental limitations and assessing the robustness of previously reported spatial patterns.
The paper is organized into three sections. Section 2 examines detector saturation in the JIRAM M-band channel and its impact on radiance retrievals. Section 3 evaluates the limitations of using M-band radiance as a proxy for total thermal emission, with particular attention to unresolved and low-temperature components. Section 4 reassesses the statistical basis for proposed latitudinal radiance trends, testing the robustness of previously reported correlations. Together, these analyses aim to provide a more physically consistent framework for interpreting Io’s heat flow from JIRAM data.
2 Detector saturation and its impact on radiance retrievals from JIRAM M-band data
In recent years, JIRAM has enabled high-resolution infrared observations of Io’s volcanic activity. The M-band imager is particularly well-suited for detecting high-temperature hot spots. However, due to the detector’s limited dynamic range, which is challenged by the extreme variability of the radiance emitted by Io’s hot spots, M-band data are susceptible to saturation effects when observing intense thermal sources. These effects, if uncorrected, may introduce significant underestimations in derived radiance values—potentially biasing both localized measurements and global heat flow estimates.
This challenge is not unique to any one study but is intrinsic to the use of high-gain imaging systems in environments with extreme dynamic range. As a representative example, we examine the approach taken by Davies et al. (2024a), who analyze Io’s volcanic activity using publicly available JIRAM data. Their study is a valuable contribution and illustrates both the scientific potential of the dataset and the practical difficulties in managing detector non-linearity.
In their analysis, Davies et al. (2024a) acknowledge the limitations imposed by detector saturation and describe the application of pixel-level thresholds to flag “saturated” detections. The term “saturation” is admittedly imprecise in this context: while the detector may not hard clip until values exceed 16,000 Digital Numbers (DN), data beyond approximately 12,000 DN are clearly affected by nonlinearity and lie outside the range where calibration is well-characterized (Mura et al., 2020). The Supplementary Figure S3 from Davies et al. (2024a) would suggest that JIRAM data with exposure time up to 1 s are considered in the dataset. Based on the M-band’s nominal responsivity of 2 × 10⁶ DN m2 sr W−1 s-1 and the calibration function y = 0.0073 × t-1 (where t is the integration time in s), this corresponds to 14,600 DN, well into the nonlinear regime. In the caption, Davies et al. (2024a) specify that thresholds are applied based on radiance levels approximately 5%–18% below the upper limit of JIRAM’s calibrated response, but do not provide any equivalent threshold value in terms of DN. This required us to derive the corresponding DN values independently, which we report for clarity. We deduce the 5% threshold corresponds to an M-band radiance of 0.00694 W m−2 sr−1 for a 1 s exposure or 13,900 DN, while the 18% threshold corresponds to an M-band radiance of 0.00615 W m−2 sr−1 for a 1 s exposure, or 12,300 DN. Pixels exceeding this level were used to flag entire hot spot detections as “saturated,” which were then excluded from the primary radiance dataset Table 1 in Davies et al., 2024a).
In a second paper, Davies et al. (2024b) generate saturation masks for each JIRAM observation to identify and flag pixels exceeding a predefined radiance threshold, i.e., equivalent to an M-band radiance of 0.00584 W m−2 sr−1 for a 1 s exposure, or 12,000 DN. For temperature retrieval, only spectral radiance values that remain below this saturation limit are utilized.
Pettine et al. (2024) account for JIRAM data saturation by implementing a tiered approach. They exclude any volcano measurements from images containing pixels above 15,000 DN to avoid fully saturated data. Where possible, they also preferentially discard measurements with pixel values exceeding 12,000 DN, due to the camera’s non-linear response beyond this threshold. However, since some brighter volcanoes consistently include pixels in the 12,000–15,000 DN range, they apply a doubling correction to the radiance in this range—based on empirical analysis showing the instrument’s response is halved—to recover accurate brightness.
On the other hand, Perry et al. (2025) apply an approach to handle JIRAM detector nonlinearity above 12,300 DN by using two image versions—one excluding and one including affected pixels. Hot spot data typically exclude these pixels unless it creates gaps, in which case the full data are used with caution.
While several authors describe excluding detections containing “nonlinear/saturated” pixels, sometimes poor documentation is provided in different papers about how these thresholds were applied during image summation, or how partially saturated images were treated. In the absence of statistics quantifying how many detections were excluded—or how many retained detections include pixels in the 12,000–14,000 DN range—the effectiveness of the saturation screening remains difficult to evaluate. This lack of explicit reporting is common to all recent JIRAM-based studies (Davies et al., 2024a; Davies et al., 2024b; Pettine et al., 2024; Perry et al., 2025), making it challenging to compare results across datasets or to fully assess the robustness of the derived radiance values.
To independently assess this issue, we compared M-band DN values with co-located data from the JIRAM spectrometer, using observations from Juno orbits five to 43. JIRAM’s de-spinning mirror suddenly stopped working after orbit 43, which makes it impossible to apply this double check from that point onwards and reinforces the need to do it for the dataset available up to orbit 43. The entrance slit of the JIRAM spectrometer subsystem is co-located within the field of view of the M-band filter of the imaging subsystem1. However, the responsivity of the spectrometer is much lower than that of the imager—averaging ∼16,000 DN m2 μm sr W−1 s-1 between 4.54 and 5.01 µm, compared to ∼2,000,000 DN m2 sr W−1 s-1 for the imager. The spectrometer always uses a 1 s integration time, and its saturation threshold in spectral radiance is therefore 12,000/16,000 = 0.75 W m-2 sr−2 µm-1, or ∼0.36 W m-2 sr−1 when integrated over the M-band range. This threshold is well above all values shown in Supplementary Figure S3 of Davies et al. (2024a), and its higher linearity makes the spectrometer a useful and independent cross-calibration tool.
To cross-check JIRAM M-band imager and spectrometer, we used Io data acquired simultaneously by the M-band imager and the spectrometer. For each co-observed pixel, we calculated the spectrometer’s integrated radiance by summing its signal from 4.54 to 5.01 µm and multiplying by the average spectral sampling step (0.009 µm). We then adjusted this value by multiplying it by the imager integration time, yielding the radiance the M-band imager should have measured in a linear regime.
As shown in Figure 1, the comparison reveals a distinct departure from linearity beginning at ∼12,000 DN, with underestimation increasing substantially at higher DN values. Our analysis suggests that 360 detections in the available dataset include pixels above 12,000 DN, with over 286 exceeding 14,000 DN. A filtering of M-band images based on exposure time would be too simplistic, since even data acquired with times <0.20 s fall into the nonlinear regime. Saturated data arise from the most intense hot spots, i.e., those that contribute most to the total heat flow.
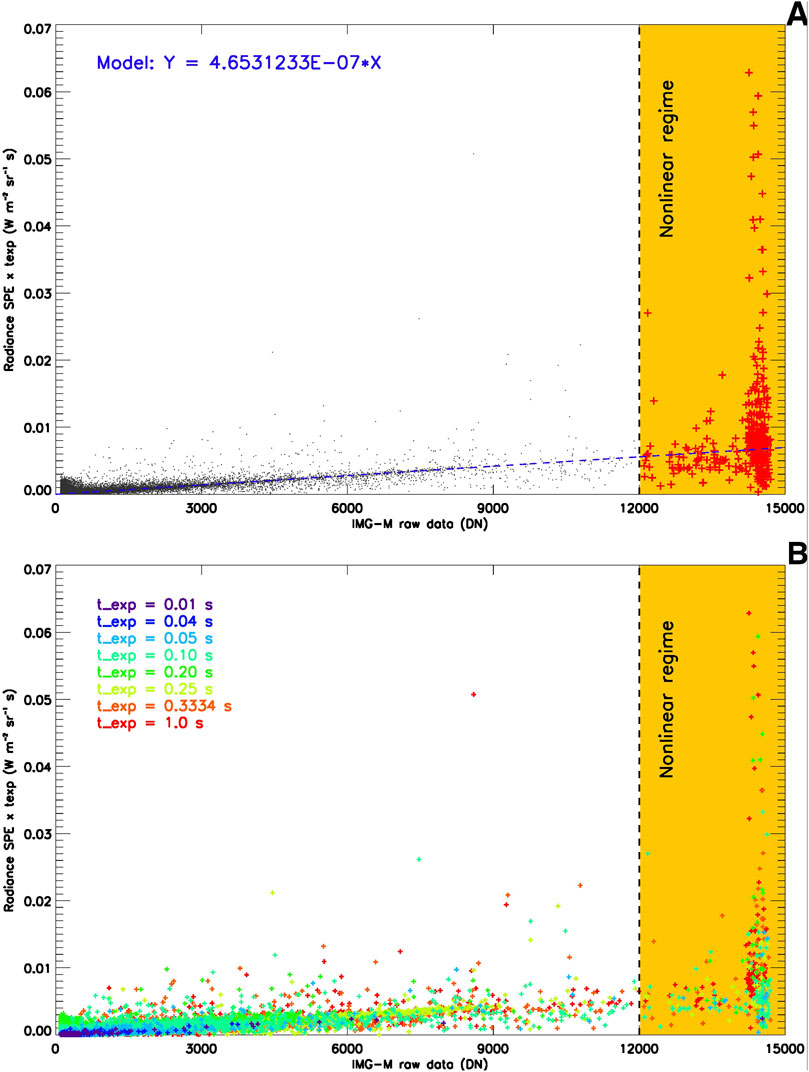
Figure 1. Data from Io during Juno orbits 5–43 (A) Radiance measured by the JIRAM spectrometer (integrated over the M-band passband) versus DN values from the M-band imager. We exclude points with DN ≤ 100 that could refer to residual sky background pixels falling within the target’s clipping mask. Points above 12,000 DN are highlighted as red crosses over a yellow background. The blue dashed line indicates the expected linear relationship. (B) Same as (A), except data points are all crosses colored according to the exposure time. The isolated point at x ≈ 8600, y ≈ 0.05 is a spurious outlier with no statistical or physical significance. Such anomalies can arise from transient detector spikes caused, for instance, by energetic particle hits.
A first attempt at empirical correction of partially saturated pixels was presented in Pettine et al. (2024), based on cross-calibration with JIRAM spectrometer data. However, the scatter in this relationship is substantial, cautioning against its use as a standardized procedure. At present, no robust algorithm exists, and spectrometer data remain the most reliable option for quantifying Io’s volcanic power output.
To be clear, the core concern is not about prior usage, but about physical limitations of the instrument itself and the need for consistent treatment of saturation effects to ensure scientific reliability: if JIRAM data are used without correction or validation, the resulting radiance estimates may be lower limits at best. Importantly, the Planetary Data System (PDS) archive does not provide documentation of the detector’s nonlinear and saturation thresholds, nor explicit guidance on how to identify and treat affected pixels. As a result, users cannot rely on the PDS alone to recognize when radiance values fall outside the instrument’s calibrated range. This makes dedicated studies—such as the present work—essential to establish transparent criteria and ensure consistent treatment of JIRAM data across different analyses.
The use of JIRAM data—even when conservative thresholding is applied—must therefore be approached with care, particularly for quantitative analysis of thermal emission from Io’s most energetic volcanic sources. If such data are used without correction for saturation or cross-validation with other channels, the resulting radiance estimates must be considered lower bounds. Moreover, if saturation disproportionately affects the brightest or most persistent hot spots, this introduces a spatial bias into any global heat flow estimate.
To improve the reliability of derived radiance estimates, we recommend a revised approach incorporating:
• Routine cross-calibration with the JIRAM spectrometer up to orbit 43;
• Clear reporting of how many detections are excluded due to saturation;
• Expanded flagging of near-saturation conditions that may lead to underestimation.
By treating saturation as an instrument-wide constraint rather than a study-specific oversight, one can strengthen the scientific utility of JIRAM data and reduce the risk of systematic errors in analyses of Io’s volcanic heat budget.
3 Limitations of M-band radiance as a proxy for total thermal emission
The analysis of volcanic activity on Io from infrared data often relies on radiance measurements in narrow spectral bands, particularly around 4.8 µm, where many thermal signals are strong and instrument sensitivity is favorable. In the absence of full spectral coverage, such narrow-band data have previously served as a convenient proxy for estimating the total thermal power emitted by hot spots (e.g., Davies et al., 2011; Davies and Veeder, 2023). However, this simplification introduces a strong, temperature-dependent degeneracy that limits the physical reliability of any derived global heat flow or comparative trends.
The underlying issue is fundamental: the total radiance emitted by a blackbody is a strong function of temperature (∝ T4), while the spectral radiance at 4.8 µm depends on where the thermal emission curve intersects that specific wavelength. As shown in Figure 2, the ratio between the total blackbody radiance and the radiance measured in the JIRAM M-band filter varies markedly across the range of temperatures relevant for Io’s volcanic activity. To construct this figure, we calculated the ratio for temperatures between 180 K and 1600 K in 1 K increments. At each temperature, we computed two integrals of the Planck function: one over the full thermal infrared spectrum (approximated from 0 to 106 μm) to represent the total emitted radiance, and the other over the wavelength range corresponding to the full width at half maximum (FWHM) of the JIRAM M-band filter (4.54–5.02 µm). The plotted curve shows the ratio of these two quantities as a function of temperature. Restricting the analysis to plausible surface and lava temperatures in hot spots (e.g., 550–1150 K), the value of this ratio is between about 13.5 and 17.5. However, over the full range of temperatures inferred from JIRAM spectrometer data—including cooler, spatially unresolved hot spots—the ratio can increase by more than one order of magnitude.
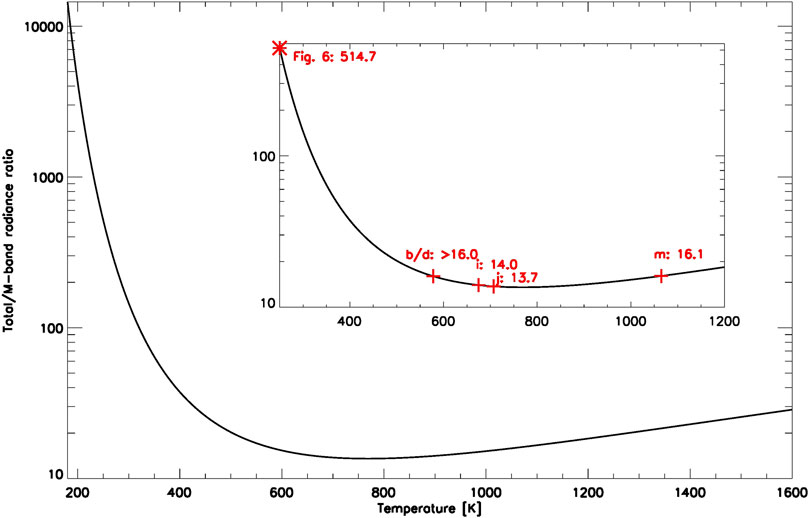
Figure 2. Ratio of total blackbody radiance to JIRAM M-band radiance as a function of temperature. The lower limit (180 K) reflects JIRAM’s in-flight noise threshold. The inset highlights the 250–1200 K range, where most JIRAM data cluster. Red crosses mark radiance maxima from panels tagged as m, i, j, and b/d in Figure 3 of Mura et al. (2020); for b/d, the 5.01 µm sensitivity limit is conservatively used. The red asterisk indicates a 250 K temperature from Figure 6 of Mura et al. (2020), typical of low-resolution (>100 km/px) JIRAM spectrometer data.
This means that identical 4.8-µm radiance values can correspond to significantly different total radiance outputs depending on the hot spot’s temperature. Without an independent temperature constraint—such as that provided by the JIRAM spectrometer—the inferred total power remains poorly constrained. This problem is especially acute for lower-resolution detections, where spatial blending artificially lowers the effective temperature and shifts emission toward longer wavelengths, reducing the apparent spectral peak. In such cases, using M-band data alone leads to consistent underestimation of total power output. This analysis is not intended to introduce new physics, but to illustrate the extent of the variability in the 4.8-µm/total emission ratio over plausible surface temperatures, highlighting why any conversion factor must carry significant uncertainty.
While Davies et al. (2024b) addressed saturation limits by integrating JIRAM with longer-wavelength datasets, our focus here is narrower: to clarify the limitations of M-band imaging when used in isolation, and to outline the conditions under which its use as a thermal proxy is physically reliable.
Although M-band (4.8-µm) radiance has been used as an empirical proxy for total thermal emission in planetary volcanology, the tables and figures in Davies et al. (2024a) report values exclusively in this band, without applying corrections or uncertainty estimates to reflect the known variability in the total-to-M-band radiance ratio. As a result, the figures used in regional and global comparisons inherit this unquantified and systematic bias. While this method has been employed in previous studies (e.g., Davies et al., 2011; de Kleer et al., 2021; Davies and Veeder, 2023; Zambon et al., 2023; Pettine et al., 2024), its validity must be evaluated based on physical consistency rather than precedent.
It is worth emphasizing that our complementary critique, which applies generally to all recent works based solely on JIRAM M-band data, aims to highlight their common limitations by quantifying how the variability of the 4.8-µm/total ratio affects imaging-only datasets—where such constraints are unavailable and uncertainties are often not propagated—and to outline methodological improvements for future investigations of Io’s volcanic heat flow.
Previous thermal mapping efforts (e.g., Veeder et al., 2009; 2011; 2012; 2015; Davies et al., 2015; 2024b) explicitly combined narrow-band radiance with additional spectral or thermophysical constraints to include cooler volcanic surfaces not detectable by JIRAM. Based on two-temperature, two-area fits to Galileo NIMS spectra, Davies and Veeder (2023) developed an empirical relationship between the M-band spectral radiance measured by JIRAM and the total thermal power emitted by hot spots on Io (y = 23.702x0.8838, where y is the total thermal emission in GW and x is the 4.8-µm spectral power in GW/µm). By analyzing a large dataset of Galileo/NIMS observations, they found a strong statistical correlation for hot spots within a temperature range of roughly 400–600 K. This relationship allows them to estimate total thermal emission from narrow-band radiance alone, which is particularly useful in cases where more detailed temperature-area model fits are unavailable. Their method acknowledges limitations for cooler hot spots below 300 K and suggests updating the estimates when additional spectral or area information becomes available.
The empirical relation from Davies and Veeder (2023) is statistically justified within the above temperature range. However, its application for broader inference is limited by two factors: appreciable scatter within this range and JIRAM’s inherent detection biases, which systematically exclude cooler or unresolved components. Consequently, while this relation provides a practical and useful workaround for deriving first-order estimates of individual sources, its use as a fixed conversion factor for aggregated populations is problematic. Without propagating its intrinsic dispersion and correcting for observational biases, such an approach can systematically skew regional or global comparisons.
The availability of high-quality, co-aligned spectrometer data from JIRAM up to orbit 43 highlights the need for re-evaluation using improved datasets and methodologies—and if necessary—to replace such approximations with physically consistent estimates, which should leverage the full spectral capabilities of instruments like JIRAM, enabling improved quantification of volcanic thermal emission and heat flow on Io.
Importantly, while one may argue that the total-to-M-band radiance ratio variation across the 550–1150 K range may be modest compared to other sources of variation (such as temporal changes and latitudinal asymmetries), it remains a systematic effect that propagates through any total radiance estimates based on M-band data alone. More critically, if low-temperature components dominate specific regions (e.g., polar areas where cooler, smaller, or unresolved hot spots may be more common), this temperature-radiance degeneracy could spatially bias the inferred distribution of heat flow, distorting geophysical interpretations.
Early evidence for lava lake structures on Io came from ground-based and Galileo-era studies of Loki Patera, interpreted as a lava lake with a resurfacing crust (Rathbun et al., 2002; Lopes et al., 2004), with Matson et al. (2006) providing a model for its crustal overturn. Additional paterae were later proposed as candidate lava lakes (Lopes et al., 2004). However, during the Juno prime mission the typical spatial resolution of JIRAM data of Io was 50–150 km/px, insufficient to resolve features such as lava lakes with tens-of-kilometers hot rings. Only since 2023, in the Juno extended mission, JIRAM observations at progressively higher resolution have demonstrated that many of Io’s paterae host lava lakes with a characteristic morphology consisting of a hot lava ring surrounding a thicker, cooler central crust (Mura et al., 2024a; Mura et al., 2025). In fact, Mura et al. (2025) report about fifty such lava lakes. In these systems, the bulk of the thermal emission arises from the cooler crust, which is largely invisible in the 5-µm radiance, making narrow-band estimates particularly unreliable.
This systematic underestimation is illustrated by the case of Chors Patera (Figure 3A), which highlights the limitations of M-band-based estimates in the presence of unresolved or low-temperature components. As detailed in Mura et al. (2024a), “the inner part of the patera […] has a uniform radiance of 40 mW sr−1 m-2, which accounts for only 25% of the total M-band emitted power (1 GW).” In other words, from the analysis of the JIRAM data it turns out that the hot ring contributes 75% while the coldest part of the lake contributes 25% to the M-band-derived power (the 1 GW value being rounded to the nearest integer). The 40 mW sr−1 m-2 value corresponds to a thermal brightness of 227 K at 4.78 µm, which is the center of the M-band. At the inferred crustal brightness temperature of 227 K, the radiant emittance of a blackbody is 150.566 W/m2.
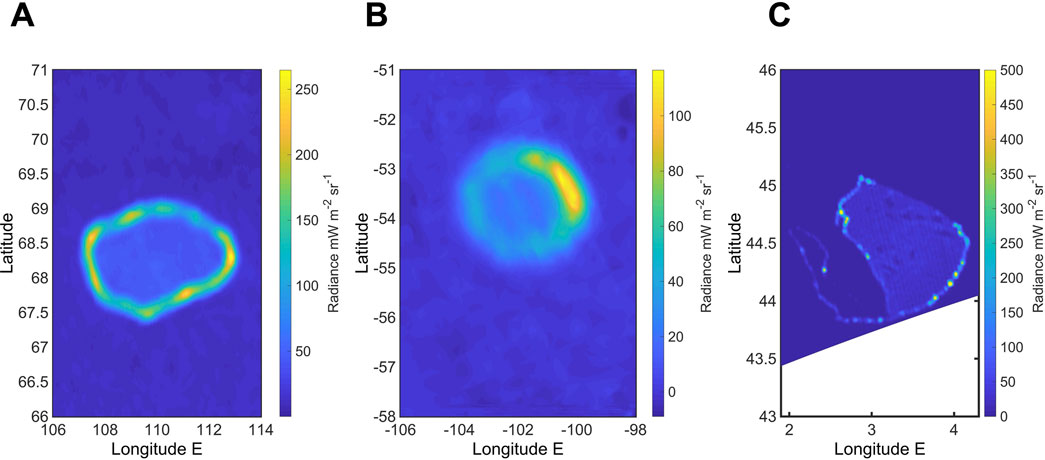
Figure 3. Thermal emission in the M-band (4.78 µm) and analysis of three lava lakes on Io: (A) Chors Patera, (B) Catha Patera, and (C) Pfu1063. For each lake, the vast majority of the total thermal emission originates from the low-temperature crust, which is severely underestimated by standard M-band measurements.
According to USGS data for Chors Patera, the feature spans from 69.11°N to 67.46°N in latitude, and from 247.04°E to 252.78°E in longitude. This corresponds to a latitudinal extent of 1.65° and a longitudinal extent of 5.74°, translating to approximately 52 × 68 km, or a total surface area of about 2800 km2. Using this area and the radiant emittance, we derive the total power emitted by the crust alone would be ∼420 GW, assuming a blackbody surface. Yet, the observed M-band power is only 1 GW—implying a discrepancy by a factor of ∼420, far greater than the typical empirical ratios (∼15–20) often used to scale M-band values to total thermal emission (Figures 4, 5).
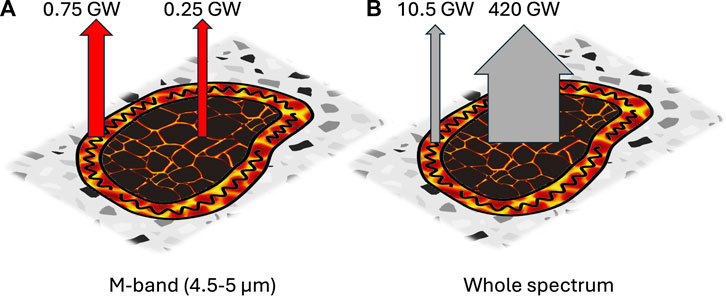
Figure 4. Power output from both the crust and the ring of Chors patera. The (A) panel shows contributions within the M-band, while the (B) panel shows the total power across all wavelengths.
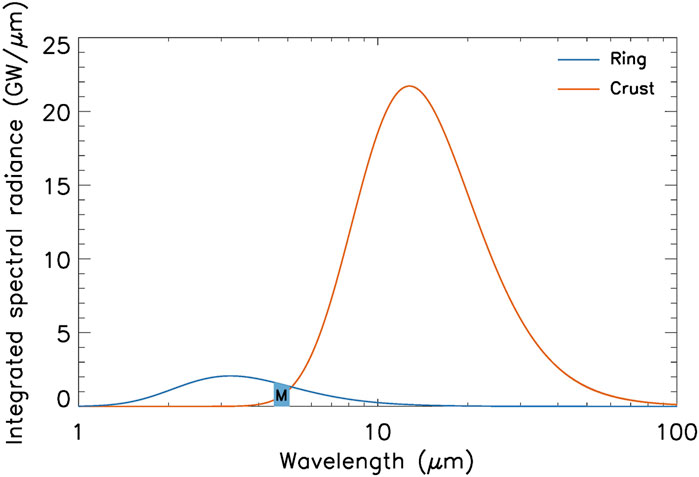
Figure 5. Same concept as Figure 4 for Chors Patera in terms of spectral radiance integrated over the solid angle and the emitting surface area (that is, spectral power). The orange curve represents the blackbody emission of the entire lake assuming a crustal brightness temperature of 227 K, while the blue curve is the thermal emission of the hot ring alone assuming a temperature of 900 K, an emissivity of 0.6, and a M-band-integrated power of 0.75 GW. The M-band (highlighted as a light blue trapezoid with the ‘M’ letter) captures only a minor portion of the total emission of the crust.
Although the hot lava ring’s exact temperature and area are unknown, its thermal emission can be estimated as follows. Based on the analysis in Mura et al. (2024a), we adopt a representative temperature of 900 K and an emissivity of 0.6 for molten lava (Ramsey et al., 2019). These values determine the total-to-M-band radiance ratio, which is approximately 14 at 900 K (see Figure 2). Since the hot ring accounts for 75% of the observed 1 GW in the M-band, the total power emitted by the ring is estimated as 0.75 × 14 = 10.5 GW. This is still a small fraction of the total emission expected from the cooler crustal component of the patera.
The stark deviation between 420 as the real scaling factor between the M-band and the total, and the usual factor of 15–20, underscores how temperature-driven spectral effects can overwhelm narrow-band approaches, making reliable power assessments from M-band data alone very challenging for lava lakes.
To verify that the case of Chors Patera is not peculiar but representative of a broader class of volcanic systems, we extended our analysis to other lava lakes. In particular, we examined Catha Patera and Pfu1063, both of which are included in Figure 1 of Mura et al. (2025). These examples confirm that the systematic underestimation of low-temperature components in the M-band is not unique to Chors, but recurs across multiple sites.
Catha Patera (Figure 3B) shows a nearly null background and a relatively uniform central crust, except for a diagonal stripe, which is an instrumental artifact due to the odd–even effect on the detector. By stacking all the available data, thereby improving the SNR, we obtain the total M-band power is 0.71 GW, while the average radiance of the crust is 0.022 W m-2 sr−1 in the same band. The total crustal power can be estimated from the reported lake size2, giving 0.23 GW. This is slightly overestimated, as part of the lake is occupied by a “lava ring” rather than crust. Alternatively, extracting the crust emission directly from the data yields 0.17 GW, slightly underestimated due to partial obscuration by the ring (the JIRAM point spread function is broader than the ring width). In summary, the crust emits about 0.2 GW in the M-band, i.e., one-quarter to one-third of the total, consistent with the case of Chors. The average crust radiance of 0.022 W m-2 sr−1 corresponds to a thermal brightness of 217 K, for which a blackbody emits 125.7 W m-2 over the full spectrum. Multiplying by the crustal area gives 414 GW. The ratio between bolometric (414 GW) and M-band emission (0.71 GW) is therefore ∼600—significantly larger than the factor of 420 found for Chors Patera.
For Pfu1063, Figure 3C shows that the crust emits only in the northeastern portion, while the southwestern area is colder and falls below the JIRAM Noise Equivalent Radiance (NER). The total M-band power, integrated from the data, is 0.12 GW. The hottest part of the crust has an average radiance of 0.0304 W m-2 sr−1, corresponding to 222 K and a blackbody radiant emittance of 137.7 W m-2 over the full spectrum. The emitting crustal area is 7 × 10⁸ m2, yielding a total power of ∼100 GW. The ratio between bolometric and M-band emission is therefore ∼800, even higher than in the previous case.
These examples show that the case of Chors Patera is far from isolated. On the contrary, it reflects a common phenomenon, with conversion factors between M-band output and total power sometimes even higher than those calculated for Chors. One potential counter-argument is that the central crustal regions of these lakes might correspond to mixtures of subpixel fractures exposing hot lava, surrounded by much colder crust (<200 K). However, this is unlikely: such fractures would produce a uniform radiance field rather than distinct rings, and thermal models combined with observational constraints indicate that crustal temperatures below ∼200 K are physically implausible. More realistic values of >200–250 K, consistent with resurfacing cycles of a few years as observed at Loki (de Kleer and de Pater, 2017) and Amaterasu Patera (Mura et al., 2025), support our interpretation that M-band data systematically underestimate the contribution of cooler crustal components. In summary, this analysis confirms that the crust generates most of the total emission due to its larger surface area, but this is largely undetectable in the M band. Our assessment demonstrates that relying solely on M-band radiance leads to a severe underestimation of cooler components, highlighting the critical need for independent temperature data.
Beyond this, Mura et al. (2025) report that paterae can transition between configurations—with or without prominent ring features—suggesting cyclic or episodic behavior, possibly analogous to Loki Patera (Rathbun et al., 2002). JIRAM images of the same patera at different times (see Mura et al., 2025; Figures 3A,B) reveal significant variations in crustal temperature, implying the system is not in thermal equilibrium. The crust likely cools while deeper magma heats the base—a dynamic interaction akin to a cooling lid over an active reservoir. This dynamic invalidates single-epoch power measurements as reliable indicators of endogenic heating from Io’s interior, unless they are framed within a broader temporal and morphological context, including full spectral modeling and multi-epoch coverage.
It is critical to note that this case study is not intended to provide new estimates of total output—which were already constrained by area-based methods to ∼320 GW for Chors Patera, 759 GW for Catha Patera, and only 13 GW for Pfu1063 (Davies et al., 2024b)—but rather to analyze, for the first time, these paterae as resolved lava lakes with hot-ring morphology in JIRAM images, moving beyond their previous appearance only as entries in global summary tables. It is equally important to stress that this critique concerns only the use of narrow-band radiance as a proxy for total emission. The updated census of 266 hot spots reported by Davies et al. (2024a) represents a valuable contribution to the mapping of Io’s volcanism, largely independent of radiance calibration and probably conservative given the absence of higher-resolution data. However, while M-band integrated radiance provides useful constraints on volcanic activity, its use as a proxy for total thermal emission is inherently limited, physically incomplete and potentially misleading when temperature is not independently constrained. The JIRAM dataset, by design, provides both spectrally resolved and imaging data. Therefore, future analyses should incorporate the full spectral information to retrieve accurate blackbody fits and total radiance estimates—both to reduce bias and to fully leverage the instrument’s capabilities. This naturally applies to future mission concepts to Io, which should ideally host multi-wavelength instrumentation covering a spectral range as broad as possible, including the mid-infrared longward of 5 µm which is key to properly capture the thermal emission of features cooler than a few hundred K.
4 On the statistical basis for latitudinal radiance trends
One of the key interpretations presented in earlier work (e.g., Rathbun et al., 2018; Davies et al., 2024a) is that Io’s lower latitudes emit more 4.8-µm spectral radiance than the polar regions, with an asymmetry between the north and south poles. This conclusion is based on a latitudinal division at ±60°, which is said to align with tidal heating models predicting increased heat flux above those latitudes (e.g., Segatz et al., 1988; Ross et al., 1990). While this threshold may have a theoretical motivation, the strength of the result ultimately depends on the empirical data and how robust the spatial trends are to the assumptions used in the analysis.
To test whether the latitudinal trend is statistically supported by the dataset alone—independently of any model assumptions—we computed the correlation between absolute latitude and spectral radiance density (i.e., radiance normalized by bin surface area), using various angular bin sizes. Let us consider an angular bin of size x (i.e., n latitude values in steps of x degrees), and calculate the spectral radiance density for the spherical zone included in ±x° of absolute latitude. For each bin, we computed the spectral radiance density by dividing the maximum M-band unsaturated spectral radiance values reported by Davies et al. (2024a) by the surface area of the corresponding latitude band, combining the northern and southern hemispheres due to symmetry in absolute latitude. For simplicity, we consider Io to be spherical in shape. The area of a spherical zone is calculated as: A = 2πR2 (sinϕ1 - sinϕ2), where R is the mean radius of Io equal to 1821.6 km, and ϕ1 and ϕ2 are the bounding latitude values.
Once we obtained arrays of latitude bin centers and corresponding radiance densities, we computed the Pearson correlation coefficient between the two arrays. This coefficient reflects the linear association between absolute latitude and radiance density. To determine whether this correlation is statistically significant, we compared the absolute value of the correlation coefficient against critical values from hypothesis testing (for 90% and 95% confidence levels), considering the degrees of freedom as the number of bins minus two3. This analysis was repeated across a wide range of bin sizes—from 1° to 30° (Table 1).
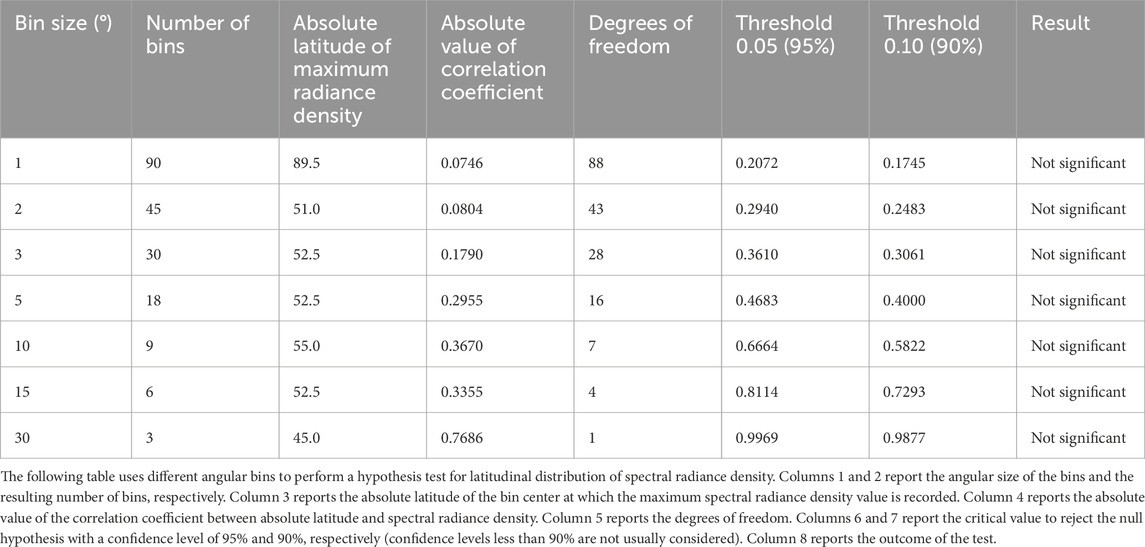
Table 1. Hypothesis test on different angular bins.
Briefly, no statistically robust correlation exists between spectral radiance density and absolute latitude, regardless of how the data are binned or analyzed. At large bin sizes (e.g., 30°), the effective sample size is extremely small (n = 3, df = 1), making any apparent correlation (e.g., r ≈ 0.77) statistically meaningless. With so few degrees of freedom, neither the presence nor the absence of a trend can be considered significant, since even exact tests place the critical |r| far above observed values. This limitation further justifies focusing on unbinned data and finer bins, all of which consistently show no robust trend with latitude.
This lack of significance arises from a fundamental property of Io: total radiance is heavily concentrated in a small number of hot spots. Using the data from Davies et al. (2024a), it turns out that about 50% of the spectral radiance originates from just 6% of the sources—or 17 hot spots out of 266 (Figure 6).
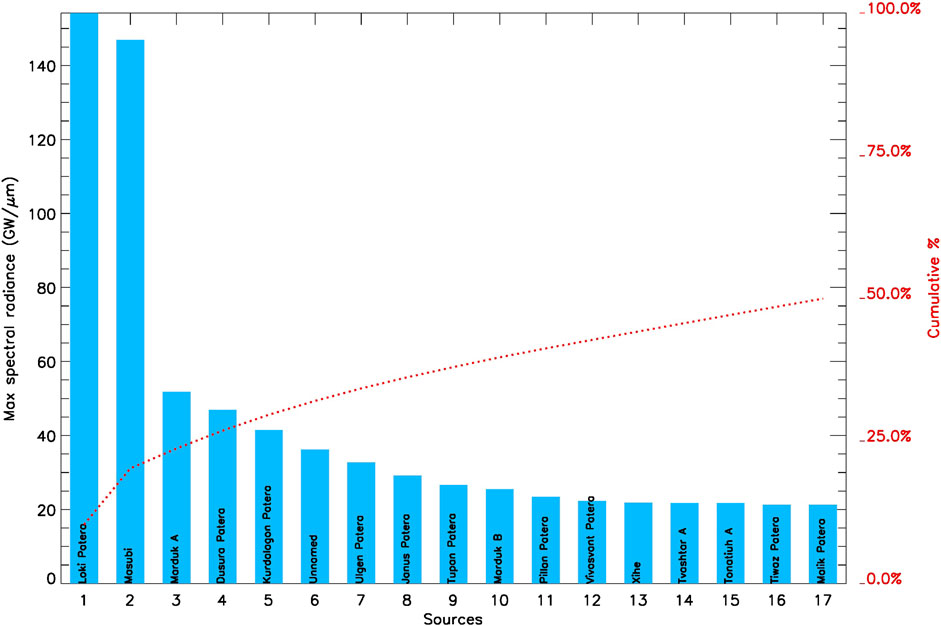
Figure 6. Maximum M-band spectral radiance of the 17 most powerful sources on Io, from Davies et al. (2024a). The dotted red curve shows the corresponding cumulative percentage, which adds up to about 50% of the entire observed radiance.
This indicates that apparent regional differences are highly sensitive to the location of just a few extremely bright sources, and do not necessarily reflect broader geophysical patterns. As a result, dividing the satellite into latitudinal zones and comparing integrated or average radiance values becomes unreliable.
Davies et al. (2024a) used 60° latitude to discriminate between high and low latitudes by pointing to its consistency with theoretical tidal heating models and prior studies. However, using a model to define the division, and then pointing to observed agreement with that same model as evidence, introduces circular logic. Pettine et al. (2024) also note that any separation between equatorial and polar regions is somewhat arbitrary, and results may change if the separation latitude of 60° is changed. A more informative approach is to explore how empirical results change when the threshold is varied independently of the models.
To evaluate the robustness of the conclusions from Davies et al. (2024a), we analyzed the same dataset in terms of both unsaturated and saturated 4.8-μm integrated spectral radiance, but explored alternative latitude thresholds at 50° and 40°. The results are summarized in Table 2.
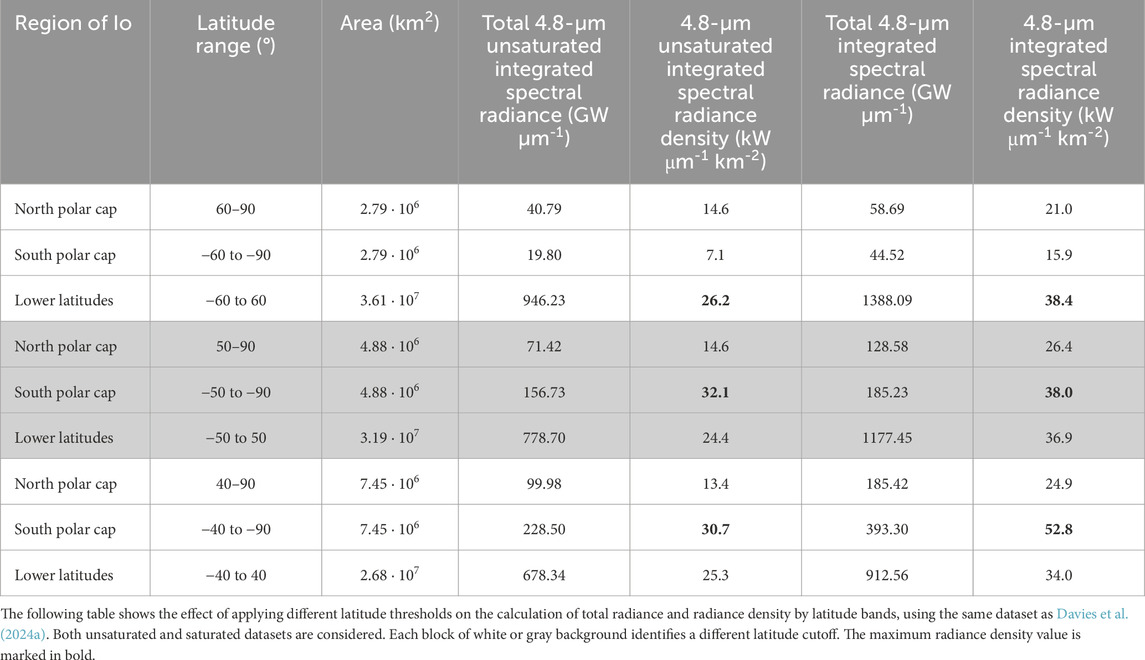
Table 2. Effect of different thresholds on the latitudinal distribution of spectral radiance.
As can be seen, for thresholds set at 50° and 40° instead of 60°, substantially greater values of total radiance and radiance density are found in the south polar cap compared to the north polar cap, a result that however may be affected by the lower spatial resolution of the JIRAM data obtained at the southern hemisphere up to orbit 43, compared to those that covered the northern hemisphere.
In this regard, we consider that a shift of only 5°—from 60° to 55°—is too limited to test robustness, as it covers a very small surface fraction and may not capture genuine sensitivity in the distribution. In contrast, shifting the boundary to 50°, which gives less unbalanced areas to polar and non-polar regions, does result in a reversed asymmetry. This sensitivity underscores that the apparent latitudinal trends are controlled by a small subset of extremely bright hot spots (≈6% of sources producing ∼50% of the overall observed M-band radiance), which makes the results highly dependent on threshold placement and therefore unsuitable as a robust discriminator among interior heating models.
This demonstrates that the latitudinal trends are not robust to reasonable changes in threshold and that the conclusions are highly sensitive to model-informed binning choices, especially in the presence of a small, skewed sample.
In summary, while the use of a 60° cut-off may align with model expectations, it does not yield a statistically significant trend in the observed radiance data and is not robust to alternative—but still physically reasonable—thresholds. A more agnostic, data-driven approach is required to avoid overstating the strength of observational support for specific tidal heating models. We stress that our analysis does not attempt to directly confirm or refute the existence of a global magma ocean on Io. Rather, it evaluates the statistical robustness of the latitudinal emission patterns. Our goal is to clarify the strength of the statistical evidence underpinning such interpretations, rather than to adjudicate among interior-heating scenarios per se.
5 Discussion
Our reassessment of Juno/JIRAM M-band data reveals significant methodological and instrumental limitations that undermine the robustness of inferred volcanic heat flow patterns on Io. Collectively, these limitations call into question the degree to which current near-infrared datasets can reliably constrain models of internal heating and volcanic distribution—especially those invoking specific tidal dissipation scenarios or a global magma ocean.
A primary limitation stems from detector saturation effects, which disproportionately affect high-intensity hot spots. Nonlinear effects/saturation above 12,000 DN effectively truncates the signal from Io’s most thermally energetic features, leading to a potential systematic underestimation of spectral radiance. On the JIRAM side, this issue is best addressed by incorporating the full JIRAM data (i.e., imager plus spectrometer), as the spectrometer’s broader wavelength coverage provides more accurate constraints on hot spot temperatures and total radiance. Compounding this issue is the widespread use of M-band (4.8-µm) spectral radiance as a proxy for total thermal power output. In the absence of temperature constraints, such conversions fail to account for the significant contributions of cooler regions, particularly at higher latitudes. A detailed analysis of individual volcanic features, such as Chors Patera, Catha Patera and Pfu1063, further highlights the limitations of relying solely on M-band proxies. The crustal component of such paterae emits at relatively low brightness temperatures, contributing significantly to the total thermal output, yet only marginally to the M-band signal. Consequently, the total power emitted by the crust is underestimated by more than two orders of magnitude when inferred from M-band radiance alone. This discrepancy illustrates the strong temperature dependence of power estimates and the limited ability of M-band data to capture low-temperature emissions. Moreover, the temporal variability of the system (e.g., Mura et al., 2024b) adds further complexity: observations show that paterae can transition between states with and without a hot lava ring, indicating dynamic, non-equilibrium processes similar to those observed in other complex volcanic systems. Variations in crust temperature between successive observations confirm that these systems are not in thermal equilibrium. Therefore, isolated or infrequent measurements cannot reliably constrain the heat injected into the volcanic system over time.
The interpretive framework becomes even more fragile when considering the extreme skewness of the dataset. More than half of the total recorded radiance originates from fewer than twenty spatially clustered sources, reducing the effectiveness of traditional latitudinal binning. In fact, modest changes in binning thresholds—such as shifting the boundary between “equatorial” and “polar” from 60° to 50° latitude—can invert observed trends. This suggests that the apparent latitudinal dependencies of heat flow are not statistically robust, but rather emerge from methodological artifacts and sample sparsity.
These findings must be situated within the broader context of geophysical constraints. Recent work by Park et al. (2025), which integrated Doppler tracking from the Juno and Galileo spacecraft with high-precision astrometry, argues convincingly against the presence of a global magma ocean on Io. Their modeling, which incorporates Io’s gravity field, moment of inertia, and observed librations, demonstrates that such an ocean would produce geophysical signatures inconsistent with observed data. Crucially, this example highlights the danger of overinterpreting narrow-band infrared observations without incorporating independent measurements of Io’s internal structure.
These considerations underscore the importance of continuous temporal monitoring and physically consistent temperature-area modeling to accurately quantify Io’s volcanic energy budget, and highlight a critical need for a paradigm shift in the study of Io’s thermal and volcanic dynamics. Single-instrument analyses—especially those limited to narrow spectral windows—are no longer sufficient. Instead, a systems-level approach is required, integrating infrared spectroscopy, gravity science, and surface deformation data. Methodologically, future analyses should move away from arbitrary spatial binning and adopt spatially continuous approaches. For example, kernel density estimation (KDE) can provide a smooth, non-parametric estimate of where radiance values are clustered, while geostatistical interpolation methods (e.g., kriging) can reconstruct continuous emission fields based on spatial autocorrelation. Both approaches would avoid the artifacts introduced by arbitrary latitude binning and better capture the true distribution of thermal emission.
On the JIRAM side, cross-calibration between JIRAM’s imager and spectrometer up to orbit 43 could reduce saturation-induced biases and enable more accurate temperature retrievals. Looking ahead, detectors capable of linear response up to 20,000 DN and with dynamic exposure adjustment would help preserve signal fidelity across Io’s wide thermal range. However, even spectrometer data up to 5 µm cannot fully capture cooler, widespread thermal anomalies. Expanding spectral coverage beyond 5 µm is vital to detect and quantify lower-temperature emissions that are currently invisible to near-infrared instrumentation. While the James Webb Space Telescope (JWST) has this capability, the spatial resolution it can achieve on the Galilean moons is sufficient to allow for broadly regional characterization; however, it would not be able to adequately resolve the polar regions, for which the ideal observatory is still a spacecraft capable of close, periodic encounters.
Future mission concepts to Io such as the Io Volcanic Explorer (e.g., Hamilton et al., 2025) represent a promising avenue for overcoming current limitations. By coordinating high-resolution infrared measurements with gravity mapping, radar altimetry, and potentially in situ plume analysis, these missions could enable joint inversions of heat flow, topography, and interior structure. Incorporating constraints from Park et al.‘s rheological models into such inversions may allow researchers to test whether deep-mantle tidal heating mechanisms can simultaneously explain both observed emission patterns and geophysical properties. Ultimately, understanding Io’s extraordinary volcanic activity demands treating its surface processes not as isolated phenomena, but as expressions of a dynamic and interconnected geophysical system.
6 Summary and conclusion
This study critically re-evaluates the use of Juno/JIRAM M-band data to map Io’s volcanic heat flow and test models of internal structure, including the existence of a global magma ocean. We identify key limitations in the current approach: significant detector saturation in the imager data, physically inconsistent radiance-to-power conversions without temperature constraints, and a lack of statistical robustness in inferred latitudinal patterns. These issues collectively challenge the robustness of conclusions drawn from M-band data alone and highlight the need for integrated, multi-instrument analyses. It is important to stress that our critique is not intended to diminish the value of past analyses based on M-band radiance, which have provided crucial insights into Io’s volcanism. Our goal is to provide a systematic synthesis of their common limitations and to suggest methodological improvements that can support stronger analyses in the future. For example, our review highlights that, in light of recent discoveries of lava lakes with complex thermal structures, future investigations should move beyond narrow-band proxies and adopt multi-wavelength, higher-resolution, and physically consistent approaches to fully capture Io’s volcanic heat flow. By systematically quantifying the limitations of current methodologies, this study clarifies the scope and reliability of existing M-band results, ensuring that past conclusions can be interpreted with appropriate caution. At the same time, it introduces original methodological elements that offer new perspectives on radiance calibration, statistical evaluation, and the distribution of volcanic activity. These contributions both demonstrate the added value of critical reassessments and provide a framework that prepares the community to fully exploit future high-resolution, multi-wavelength datasets of Io, thereby advancing our capacity to test competing models of volcanic heat flow and interior dynamics.
Recent geophysical studies further challenge the plausibility of a global magma ocean, reinforcing the importance of reconciling infrared observations with independent measurements of gravity and interior structure. Our findings underscore the need for future missions equipped with broader spectral coverage, improved detector capabilities, and coordinated measurement strategies to provide a more comprehensive and accurate understanding of Io’s heat flow and interior dynamics.
Moving forward, progress will depend on a systems-level approach that combines thermal, structural, and dynamical data. Upcoming mission concepts offer a unique opportunity to realize this vision, transforming our understanding of tidal heating, mantle dynamics, and volcanic expression on the most volcanically active body in the Solar System.
Author contributions
FT: Conceptualization, Formal Analysis, Investigation, Methodology, Software, Supervision, Visualization, Writing – original draft. AM: Conceptualization, Formal Analysis, Funding acquisition, Methodology, Project administration, Supervision, Validation, Writing – review and editing. FZ: Data curation, Investigation, Writing – review and editing.
Funding
The author(s) declare that financial support was received for the research and/or publication of this article. This work is funded by the Italian Space Agency (ASI), ASI–INAF Addendum no. 2016-23-H.3-2023 to grant 2016-23-H.0. Support of the Juno Science and Operations Teams is gratefully acknowledged.
Conflict of interest
The authors declare that the research was conducted in the absence of any commercial or financial relationships that could be construed as a potential conflict of interest.
The author AM declared that they were an editorial board member of Frontiers, at the time of submission. This had no impact on the peer review process and the final decision.
The reviewer RK declared a past co-authorship [Mass supply from Io to Jupiter’s magnetosphere] with the author AM to the handling editor.
Generative AI statement
The author(s) declare that no Generative AI was used in the creation of this manuscript.
Any alternative text (alt text) provided alongside figures in this article has been generated by Frontiers with the support of artificial intelligence and reasonable efforts have been made to ensure accuracy, including review by the authors wherever possible. If you identify any issues, please contact us.
Publisher’s note
All claims expressed in this article are solely those of the authors and do not necessarily represent those of their affiliated organizations, or those of the publisher, the editors and the reviewers. Any product that may be evaluated in this article, or claim that may be made by its manufacturer, is not guaranteed or endorsed by the publisher.
Footnotes
1Jovian InfraRed Auroral Mapper (JIRAM, 2024) Instrument Description, Planetary Data System (PDS). https://pds-atmospheres.nmsu.edu/data_and_services/atmospheres_data/JUNO/images/thumbnail_JIRAM_Focal_Plane.png
2https://planetarynames.wr.usgs.gov/Feature/1075; diameter 65 km, area 3.3 × 10⁹ m2
3Critical Values for Pearson’s Correlation Coefficient, 2024http://commres.net/wiki/_media/correlationtable.pdf
References
Adriani, A., Filacchione, G., Di Iorio, T., Turrini, D., Noschese, R., Cicchetti, A., et al. (2017). JIRAM, the jovian infrared auroral mapper. Space Sci. Rev. 213 (1–4), 393–446. doi:10.1007/s11214-014-0094-y
Bolton, S. J., Lunine, J., Stevenson, D., Connerney, J. E. P., Levin, S., Owen, T. C., et al. (2017). The juno mission. Space Sci. Rev. 213 (1–4), 5–37. doi:10.1007/s11214-017-0429-6
Carr, M. H., Masursky, H., Strom, R. G., and Terrile, R. J. (1979). Volcanic features of Io. Nature 280, 729–733. doi:10.1038/280729a0
Critical Values for Pearson’s Correlation Coefficient (2024). Critical values for pearson’s correlation coefficient. Available online at: http://commres.net/wiki/_media/correlationtable.pdf.
Davies, A. G., and Veeder, G. J. (2023). Near infrared spectral radiance at multiple wavelengths from io’s volcanoes 1: the low spatial resolution night-time galileo NIMS data set. J. Geophys. Res. Planets 128 (8), e2023JE007839. doi:10.1029/2023JE007839
Davies, A. G., Keszthelyi, L., and McEwen, A. S. (2011). Estimating eruption temperature from thermal emission spectra of lava fountain activity in the erta’ale (ethiopia) volcano lava Lake: implications for observing Io’s volcanoes. Geophys. Res. Lett. 38 (21), L21308. doi:10.1029/2011GL049418
Davies, A. G., Veeder, G. J., Matson, D. L., and Johnson, T. V. (2015). Map of Io’s volcanic heat flow. Icarus 262, 67–78. doi:10.1016/j.icarus.2015.08.003
Davies, A. G., Perry, J. E., Williams, D. A., and Nelson, D. M. (2024a). Io’s polar volcanic thermal emission indicative of magma ocean and shallow tidal heating models. Nat. Astron. 8 (1), 94–100. doi:10.1038/s41550-023-02123-5
Davies, A. G., Perry, J. E., Williams, D. A., Veeder, G. J., and Nelson, D. M. (2024b). New global map of io’s volcanic thermal emission and discovery of hemispherical dichotomies. Planet. Sci. J. 5 (5), 121. doi:10.3847/PSJ/ad4346
de Kleer, K., and de Pater, I. (2016). Time variability of Io’s volcanic activity from near-IR adaptive optics observations on 100 nights in 2013-2015. Icarus 280, 378–404. doi:10.1016/j.icarus.2016.06.019
de Kleer, K., and de Pater, I. (2017). Io’s loki patera: modeling of three brightening events in 2013–2016. Icarus 289, 181–198. doi:10.1016/j.icarus.2017.01.038
de Kleer, K., de Pater, I., Davies, A. G., and Ádámkovics, M. (2014). Near-infrared monitoring of Io and detection of a violent outburst on 29 August 2013. Icarus 242, 352–364. doi:10.1016/j.icarus.2014.06.006
de Kleer, K., Park, R., and McEwen, A. (2019). Tidal heating: lessons from Io and the jovian system. Final Report for the Keck Institute for Space Studies. Available online at: https://kiss.caltech.edu/final_reports/Tidal_Heating_final_report.pdf.
de Kleer, K., Skrutskie, M., Leisenring, J., Davies, A. G., Conrad, A., de Pater, I., et al. (2021). Resolving io’s volcanoes from a mutual event observation at the large binocular telescope. Planet. Sci. J. 2 (6), 227. doi:10.3847/PSJ/ac28fe
de Pater, I., Marchis, F., Macintosh, B. A., Roe, H. G., Le Mignant, D., Graham, J. R., et al. (2004). Keck AO observations of Io in and out of eclipse. Icarus 169 (1), 250–263. doi:10.1016/j.icarus.2003.08.025
Hamilton, C. W., McEwen, A. S., Keszthelyi, L., Carter, L. M., Davies, A. G., de Kleer, K., et al. (2025). Comparing NASA discovery and new frontiers class mission concepts for the Io volcano observer. Planet. Sci. J. 6 (6), 134. doi:10.3847/PSJ/adcab0
JIRAM (2024). Jovian InfraRed auroral mapper (JIRAM) instrument description. Planet. Data Syst. (PDS). Available online at: https://pds-atmospheres.nmsu.edu/data_and_services/atmospheres_data/JUNO/images/thumbnail_JIRAM_Focal_Plane.png.
Lainey, V., Arlot, J.-E., Karatekin, Ö., and van Hoolst, T. (2009). Strong tidal dissipation in Io and Jupiter from astrometric observations. Nature 459 (7249), 957–959. doi:10.1038/nature08108
Lopes, R., Kamp, L. W., Smythe, W. D., Mouginis-Mark, P., Kargel, J., Radebaugh, J., et al. (2004). Lava Lakes on io: observations of Io's volcanic activity from galileo NIMS during the 2001 fly-bys. Icarus 169 (1), 140–174. doi:10.1016/j.icarus.2003.11.013
Lopes-Gautier, R., McEwen, A. S., Smythe, W. B., Geissler, P. E., Kamp, L., Davies, A. G., et al. (1999). Active volcanism on io: global distribution and variations in activity. Icarus 140 (2), 243–264. doi:10.1006/icar.1999.6129
Matson, D. L., Davies, A. G., Veeder, G. J., Rathbun, J. A., Johnson, T. V., and Castillo, J. C. (2006). Io: Loki patera as a magma sea. J. Geophys. Res. 111 (E9), E09002. doi:10.1029/2006JE002703
Matsuyama, I. N., Steinke, T., and Nimmo, F. (2022). Tidal heating in Io. Elements 18 (6), 374–378. doi:10.2138/gselements.18.6.374
McEwen, A. S., Belton, M. J. S., Breneman, H. H., Fagents, S. A., Geissler, P., Greeley, R., et al. (2000). Galileo at io: results from high-resolution imaging. Science 288 (5469), 1193–1198. doi:10.1126/science.288.5469.1193
Morabito, L. A., Synnott, S. P., Kupferman, P. N., and Collins, S. A. (1979). Discovery of currently active extraterrestrial volcanism. Science 204 (4396), 972. doi:10.1126/science.204.4396.972
Mura, A., Adriani, A., Tosi, F., Lopes, R. M. C., Sindoni, G., Filacchione, G., et al. (2020). Infrared observations of Io from juno. Icarus 341, 113607. doi:10.1016/j.icarus.2019.113607
Mura, A., Tosi, F., Zambon, F., Lopes, R. M. C., Mouginis-Mark, P. J., Becker, H., et al. (2024a). Hot rings on Io observed by Juno/JIRAM. Commun. Earth & Environ. 5 (1), 340. doi:10.1038/s43247-024-01486-5
Mura, A., Zambon, F., Tosi, F., Lopes, R. M. C., Rathbun, J., Pettine, M., et al. (2024b). The temporal variability of Io’s hotspots. Front. Astron. Space Sci. 11, 1369472. doi:10.3389/fspas.2024.1369472
Mura, A., Tosi, F., Zambon, F., Lopes, R. M. C., Mouginis-Mark, P. J., Radebaugh, J., et al. (2025). Widespread occurrence of lava Lakes on Io observed from juno. J. Geophys. Res. Planets 130 (2), 2024JE008723. doi:10.1029/2024JE008723
Park, R. S., Jacobson, R. A., Gomez Casajus, L., Nimmo, F., Ermakov, A. I., Keane, J. T., et al. (2025). Io’s tidal response precludes a shallow magma ocean. Nature 638 (8049), 69–73. doi:10.1038/s41586-024-08442-5
Perry, J. E., Davies, A. G., Williams, D. A., and Nelson, D. M. (2025). Hot spot detections and volcanic changes on Io during the juno epoch: orbits PJ5 to PJ55. Planet. Sci. J. 6 (4), 84. doi:10.3847/PSJ/adbae3
Pettine, M., Imbeah, S., Rathbun, J., Hayes, A., Lopes, R. M. C., Mura, A., et al. (2024). JIRAM observations of volcanic flux on io: distribution and comparison to tidal heat flow models. Geophys. Res. Lett. 51 (17), e2023GL105782. doi:10.1029/2023GL105782
Radebaugh, J., Keszthelyi, L. P., McEwen, A. S., Turtle, E. P., Jaeger, W., and Milazzo, M. (2001). Paterae on Io: a new type of volcanic caldera? J. Geophys. Res. 106 (E12), 33005–33020. doi:10.1029/2000JE001406
Ramsey, M. S., Chevrel, M. O., Coppola, D., and Harris, A. (2019). The influence of emissivity on the thermo-rheological modeling of the channelized lava flows at Tolbachik volcano. Ann. Geophys. 62 (2), VO222. doi:10.4401/ag-8077
Rathbun, J. A., Spencer, J. R., Davies, A. G., Howell, R. R., and Wilson, L. (2002). Loki, Io: a periodic volcano. Geophys. Res. Lett. 29 (10), 1443. doi:10.1029/2002GL014747
Rathbun, J. A., Lopes, R. M. C., and Spencer, J. R. (2018). The global distribution of active Ionian volcanoes and implications for tidal heating models. Astronomical J. 156 (5), 207. doi:10.3847/1538-3881/aae370
Ross, M. N., Schubert, G., Spohn, T., and Gaskell, R. W. (1990). Internal structure of Io and the global distribution of its topography. Icarus 85 (2), 309–325. doi:10.1016/0019-1035(90)90119-T
Segatz, M., Spohn, T., Ross, M. N., and Schubert, G. (1988). Tidal dissipation, surface heat flow, and figure of viscoelastic models of Io. Icarus 75 (2), 187–206. doi:10.1016/0019-1035(88)90001-2
Strom, R. G., Terrile, R. J., Masursky, H., and Hansen, C. (1979). Volcanic eruption plumes on Io. Nature 280 (5725), 733–736. doi:10.1038/280733a0
Tyler, R. H., Henning, W. G., and Hamilton, C. W. (2015). Tidal heating in a magma ocean within Jupiter’s moon Io. Astrophysical J. Suppl. Ser. 218 (2), 22. doi:10.1088/0067-0049/218/2/22
Veeder, G. J., Matson, D. L., Johnson, T. V., Blaney, D. L., and Goguen, J. D. (1994). Io’s heat flow from infrared radiometry: 1983-1993. J. Geophys. Res. 99 (E8), 17095–17162. doi:10.1029/94JE00637
Veeder, G. J., Davies, A. G., Matson, D. L., and Johnson, T. V. (2009). Io: heat flow from dark volcanic fields. Icarus 204 (1), 239–253. doi:10.1016/j.icarus.2009.06.027
Veeder, G. J., Davies, A. G., Williams, D. A., Matson, D. L., Johnson, T. V., and Radebaugh, J. (2011). Io: heat flow from dark paterae. Icarus 212 (1), 236–261. doi:10.1016/j.icarus.2010.09.026
Veeder, G. J., Davies, A. G., Matson, D. L., Johnson, T. V., Williams, D. A., and Radebaugh, J. (2012). Io: volcanic thermal sources and global heat flow. Icarus 219 (2), 701–722. doi:10.1016/j.icarus.2012.04.004
Veeder, G. J., Davies, A. G., Matson, D. L., Johnson, T. V., Williams, D. A., and Radebaugh, J. (2015). Io: heat flow from small volcanic features. Icarus 245, 379–410. doi:10.1016/j.icarus.2014.07.028
Keywords: Io volcanism, tidal heating models, Juno mission, infrared spectroscopy, detector saturation, statistical geophysics
Citation: Tosi F, Mura A and Zambon F (2025) Re-evaluating Io’s volcanic heat flow: critical limitations in Juno/JIRAM M-band analysis. Front. Astron. Space Sci. 12:1668185. doi: 10.3389/fspas.2025.1668185
Received: 17 July 2025; Accepted: 22 September 2025;
Published: 05 November 2025.
Edited by:
Josep M. Trigo-Rodríguez, Spanish National Research Council (CSIC), SpainReviewed by:
Jianguo Yan, Wuhan University, ChinaRyoichi Koga, Nagoya City University Graduate School of Medical Sciences, Aichi, Japan
Copyright © 2025 Tosi, Mura and Zambon. This is an open-access article distributed under the terms of the Creative Commons Attribution License (CC BY). The use, distribution or reproduction in other forums is permitted, provided the original author(s) and the copyright owner(s) are credited and that the original publication in this journal is cited, in accordance with accepted academic practice. No use, distribution or reproduction is permitted which does not comply with these terms.
*Correspondence: Federico Tosi, ZmVkZXJpY28udG9zaUBpbmFmLml0