 Huayu Zhao1,2
 Huigen Yang2*
 Xinming Chen1Zanyang Xing1
 Zejun Hu2Dehong Huang2Bin Li2Beichen Zhang2
 Jianjun Liu2
- 1Shandong Key Laboratory of Optical Astronomy and Solar-Terrestrial Environment, School of Space Science and Technology, Institute of Space Sciences, Shandong University, Weihai, Shandong, China
- 2MNR Key Laboratory for Polar Science, Polar Research Institute of China, Shanghai, China
In this study, we present in-situ observations and global MHD simulations of a clockwise-rotating magnetospheric vortex in the dawnside magnetosphere, accompanied by a conjugate clockwise equivalent ionospheric currents (EICs) vortex following a positive solar wind dynamic pressure pulse. When the pressure pulse reached the magnetosphere, the THEMIS spacecraft located in the dawnside region has observed significant plasma velocity perturbations. Minimum variance analysis (MVA) revealed that these perturbations corresponded to a clockwise-rotating flow vortex. Simultaneously, a conjugate clockwise ionospheric current vortex was detected in the EICs system near the THEMIS magnetic footpoint. These coordinated space- and ground-based observations indicate that the magnetospheric clockwise flow vortex induced by the dynamic pressure pulse is coupled to the ionosphere, producing a corresponding clockwise EICs vortex. Furthermore, global MHD simulations reveal the presence of clockwise and counterclockwise vortices in the dawnside and duskside magnetosphere, respectively, supporting the hypothesis that a dawnside dynamic pressure pulse can generate a clockwise magnetospheric plasma flow vortex.
1 Introduction
The solar wind dynamic pressure pulse plays an important role in the solar wind–magnetosphere–ionosphere coupling system, transferring energy and momentum from the solar wind into the magnetosphere-ionosphere system. These pressure pulses can induce various phenomena within the system, such as generating ultra-low frequency (ULF) waves (e.g., Nopper et al., 1982; Cahill et al., 1990; Shi et al., 2013), affecting magnetic field variations in geosynchronous orbit (e.g., Wing et al., 2002; Borodkova et al., 2005; Wang et al., 2007), regulating energetic particle populations (e.g., Lessard et al., 1999; Zong et al., 2007), causing both global and localized auroral luminosity variations (e.g., Zhou and Tsurutani, 1999; Meurant et al., 2003; Yang et al., 2011, 2013; Liou and Sibeck, 2014), and generating plasma flow vortices in the magnetosphere and ionosphere through field-aligned currents (FACs) (e.g., Glassmeier and Untiedt, 1989; Samsonov and Sibeck, 2013; Shi et al., 2014).
Vortex structures are common and important phenomena in physics and have been observed across various regions, including the heliosphere (e.g., Burlaga, 1990), magnetosphere (e.g., Glassmeier and Untiedt, 1989; Samsonov and Sibeck, 2013; Shi et al., 2014; Zhao et al., 2016), and ionosphere (e.g., Hones et al., 1978; Glassmeier and Untiedt, 1989; Fujita et al., 2003a, Fujita et al., 2003b; Murr et al., 2002; Motoba et al., 2003; Sibeck et al., 2003; Juusola et al., 2010; Jin et al., 2023). Observations of plasma flow vortices in the ionosphere have been reported on the dayside using ground-based magnetometer arrays and SuperDARN radar (e.g., Friis-Christensen et al., 1988; Yahnin and Moretto, 1996; Lyatsky et al., 1999; Motoba et al., 2003; Sibeck et al., 2003; Juusola et al., 2010; Jin et al., 2023). Magnetospheric vortices have also been studied through satellite observations (e.g., Hones et al., 1978; Hasegawa et al., 2004; Keiling et al., 2009; Lui et al., 2010; Tian et al., 2010) and MHD simulations (e.g., El-Alaoui et al., 2010; Wang et al., 2010; Sun et al., 2011, 2012; Shi et al., 2013; Samsonov and Sibeck, 2013; Shi et al., 2014; Zhao et al., 2016). Sibeck, (1990) proposed a conceptual model in which a positive solar wind dynamic pressure pulse compresses the magnetosphere and generates plasma flow vortices near the magnetopause. Araki (1994) modified this model and suggested that positive solar wind dynamic pressure pulse can generate a pair of clockwise and counterclockwise vortices on the dawnside and duskside magnetosphere, respectively. These magnetospheric vortices are then connected to corresponding ionospheric vortices via FACs. Samsonov and Sibeck. (2013) extended this scenario, proposing that the pressure pulse launches a fast magnetosonic wave directed toward the inner magnetosphere. An Ampère force at the wave front accelerates plasma along the wave path, and upon encountering boundaries such as the plasmapause or ionosphere, the wave reflects. This process of wave penetration and reflection forms the basis for vortex generation.
Shi et al. (2014) presented the first in-situ observations of a clockwise magnetospheric vortex following a positive solar wind dynamic pressure pulse in the duskside magnetosphere, and proposed that the vortex’s rotational direction was consistent with the prediction by Sibeck, (1990). Shi et al. (2020) then summarized previous work and concluded that a positive solar wind dynamic pressure pulse can generate clockwise and counterclockwise magnetospheric vortices in the dawnside and duskside magnetosphere, respectively. However, to date, no observational evidence from the dawnside magnetosphere has confirmed this theory. The theory proposes that a positive solar wind dynamic pressure pulse can generate fast magnetosonic waves that propagate inside the magnetosphere. These waves are reflected upon encountering the inner boundary, such as the ionosphere or plasmapause. An Ampère force is produced at the leading edge of the fast-mode waves, which accelerates plasma along the propagation direction of the waves. The combined effects of wave penetration and reflection form a magnetospheric vortex structure. This mechanism further implies that a positive solar wind dynamic pressure pulse can generate clockwise and counterclockwise magnetospheric vortices in the dawnside and duskside magnetosphere, respectively. Yu and Ridley, (2009) used global MHD simulations and reported the occurrence of upward and downward FACs in the dawnside magnetosphere following a positive dynamic pressure pulse. These FACs were attributed to the sudden commencement (SC), in which the upward and downward FACs correspond to the preliminary impulse (PI) and main impulse (MI) phases, respectively. The upward FACs associated with the PI phase in the dawnside magnetosphere were further interpreted as being related to the displacement current, while the downward FACs correspond to a clockwise magnetospheric vortex. On the other hand, Wang et al. (2010) investigated magnetic field responses to dynamic pressure pulses and found clockwise and counterclockwise plasma flow vortices in the dawnside and duskside magnetosphere by using MHD simulations, respectively. But they did not present any in-situ observations of magnetospheric vortices. Furthermore, no confirmed in-situ observations of dawnside magnetospheric vortices triggered by a positive dynamic pressure pulse have been reported to date. It remains uncertain whether such pulses can indeed generate vortices in the dawnside magnetosphere, and if so, what the sense of rotation of these vortices would be.
In this study, we report direct in-situ observations of a dawnside magnetospheric vortex in response to a positive solar wind dynamic pressure pulse. The dataset is presented in Section 2, observational results are described in Section 3, and the discussion and conclusions are provided in Section 4.
2 Materials and methods
To identify positive solar wind dynamic pressure pulses, interplanetary data from the WIND satellite (Farrell et al., 1995; Gloeckler et al., 1995) and the OMNI database were utilized in this study. The three components of the magnetic field and plasma velocity within the magnetosphere were obtained from the fluxgate magnetometer (Auster et al., 2008) and electrostatic analyzer (McFadden et al., 2008) onboard the THEMIS satellites, respectively. The H-component of the magnetic field and EICs were derived from the ground-based magnetometer arrays. The ground magnetometer arrays used in this study include: CANMOS (Canadian Magnetic Observatory System), CARISMA (Canadian Array for Real time Investigations of Magnetic Activity) (Mann et al., 2008), GIMA (Geophysical Institute Magnetometer Array), Technical University of Denmark (DTU) Magnetometer Ground Stations in Greenland, MACCS (Magnetometer Array for Cusp and Cleft Studies) (Engebretson et al., 1995), the STEP (Solar-Terrestrial Energy Program) magnetometer array, and THEMIS GMAG (Time History of Events and Macroscale Interactions During Substorms Ground Magnetometers) (Russell et al., 2008).
3 Results
3.1 Event 1: 22 March 2011
On 22 March 2011, a clear positive solar wind dynamic pressure pulse (from 2.6 nPa to 4.8 nPa) was detected by the WIND satellite (located at (213.10, 93.55, 21.57) Re in GSM coordinates) at 13:02:35 UT, as shown in Figure 1a. The solar wind speed increased from 331.9 to 362.3 km/s, while the solar wind density increased from 13.7 to 26.1 cm-3, as shown in Figure 1c. The solar wind dynamic pressure changes solely induced by the speed increase is approximately 0.48 nPa, whereas that solely attributed to the density increase is about 2.28 nPa. The solar wind velocity and density perturbations shown in Figures 1b,c indicate that the pressure pulse was primarily induced by an increase in solar wind density. The time delay for this pressure pulse to propagate from the location of the WIND satellite to the magnetosphere was approximately 4,165 s. This time shift was calculated using the satellite’s position and the solar wind velocity observed by WIND, and it was also compared with the time shift derived from the OMNI data. The 1-min time-resolution solar wind data from the OMNI database also showed a clear positive dynamic pressure pulse at 14:12:00 UT, as illustrated in Figure 1e. Following the arrival of the pulse at the magnetosphere, the SYM-H index recorded a distinct increase, indicating that the magnetosphere experienced a compression event. During this compression, the x- and y-components of the interplanetary magnetic field (IMF) remained consistently negative and positive, respectively. The z-component of the IMF briefly turned negative before switching back to positive, as shown in Figure 1d. In this event, the AE index remained below 110 nT (not shown in the figure), suggesting that no substorm occurred during the compression of the magnetosphere by the positive dynamic pressure pulse.
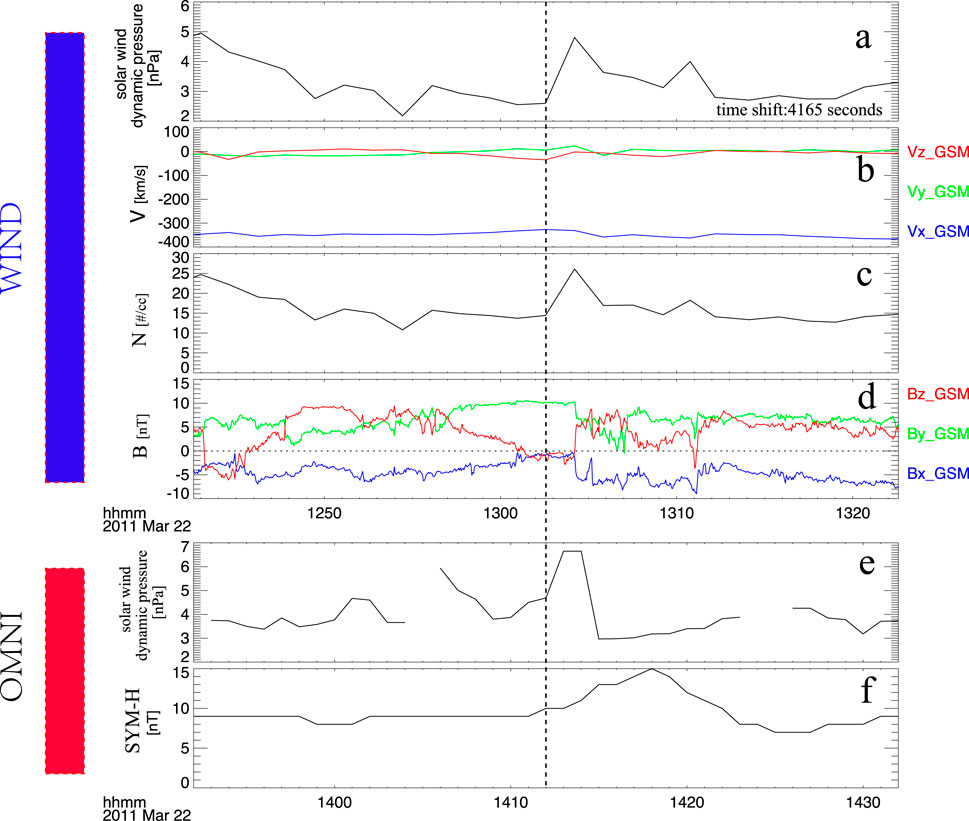
Figure 1. Solar wind and IMF parameters derived from the WIND satellite and OMNI database for the 09 March 2017 event. (a) Solar wind dynamic pressure from WIND. (b) Three components of solar wind velocity in GSM coordinates. (c) Solar wind density. (d) Three components of the interplanetary magnetic field (IMF) in GSM coordinates. (e) Solar wind dynamic pressure from the OMNI database. (f) SYM-H index derived from the OMNI database. The black dashed line indicates the time of the negative solar wind dynamic pressure pulse.
The THEMIS-E satellite was located inside the magnetosphere during its compression by a positive solar wind dynamic pressure pulse, as shown in Figure 2. Prior to the impact of the pressure pulse, the magnetospheric plasma flow velocity exhibited only small-scale perturbations and showed no clear oscillatory features, as shown in Figure 2a. According to the SYM-H index shown in Figure 1f, the initial compression of the magnetosphere occurred at 14:12 UT, reaching its maximum extent at 14:18 UT. As illustrated in Figure 2b, all three components of the magnetic field showed a marked increase following the arrival of the pressure pulse. Concurrently, both electron and ion densities experienced a clear enhancement, as shown in Figures 2c–f. These increases in magnetic field strength and plasma density confirm that the magnetosphere was compressed by the positive dynamic pressure pulse, consistent with the SYM-H index variations. Following the arrival of the pulse, the amplitude of magnetospheric plasma flow velocity increased and displayed a distinct bipolar signature, as shown in Figure 2a. Keiling et al. (2009) proposed that such bipolar signatures in plasma velocity are indicative of plasma flow vortices. To further investigate this feature, we applied the MVA method to the mass flux (ρv), following established techniques (e.g., Sonnerup and Scheible (1998); Zong et al., 2009). To determine the orientation of boundaries and establish a local LMN coordinate system, this technique identifies three mutually perpendicular directions corresponding to the maximum, intermediate, and minimum variance of a vector field, such as the magnetic field or plasma flow. In the LMN system, the N direction (minimum variance) is interpreted as the boundary normal, while L and M lie in the boundary plane. Projecting plasma or magnetic field data onto this coordinate system allows for a clearer understanding of flow patterns and vortex structures. For example, ρVL, ρVM, and ρVN represent the mass flux components along the L, M, and N directions, respectively, allowing the flow pattern and vortex motion to be analyzed relative to the boundary. In MVA, the reliability of the derived normal direction depends on how well defined the minimum variance direction is relative to the intermediate and maximum variance directions. This reliability is quantitatively assessed using the eigenvalue ratios of the variance matrix. Specifically, the ratio of the intermediate to minimum eigenvalues (λ2/λ3) serves as an indicator of the uncertainty cone around the minimum variance (normal) direction. A larger λ2/λ3 ratio implies that the minimum variance direction is well separated from the intermediate one, indicating a more reliable and well-determined normal vector. Conversely, a small λ2/λ3 ratio suggests that the eigenvalues are not well separated, meaning the uncertainty in the normal direction is large and the MVA result should be interpreted with caution. This criterion, originally proposed by Sonnerup and Scheible (1998), is routinely applied to MVA performed on both magnetic field (MVAB) and mass flux (MVAρv) data to evaluate the robustness of the derived boundary or vortex orientation. In MVA, the components ρVl, ρVm, and ρVn represent the maximum, intermediate, and minimum variance directions of the mass flux, respectively. Figure 3 presents the MVA results based on the mass flux observed by the THEMIS-E satellite after the impact of the pressure pulse. Figure 3a shows the maximum and intermediate variance components between 14:18 and 14:27 UT. The large-scale rotational pattern observed in these components indicates that the bipolar plasma flow signature resulted from the satellite passing through a plasma flow vortex. The reason is that a vortex is characterized by a rotational motion in a plane combined with convergence or divergence along the perpendicular direction. In the LMN coordinate system, the L–M plane represents the boundary plane, so rotation within this plane indicates circulating flow. Furthermore, the red “s” and blue “e” markers in the figure indicate that the vortex exhibited clockwise rotation. Figure 3b shows the maximum and minimum variance components between the same time duration as Figure 3a. To confirm the three-dimensional vortex structure, we also examine the N-component. In a typical vortex, the N-component varies continuously and systematically as the flow circulates: for example, along the L direction, N first increases and then decreases (or vice versa), corresponding to an upward and downward motion through the vortex center. This behavior is often approximately sinusoidal and is synchronized with the rotation in the L–M plane. Therefore, the combination of coherent L–M rotation and systematic N variations provides strong evidence for the presence of a vortex.
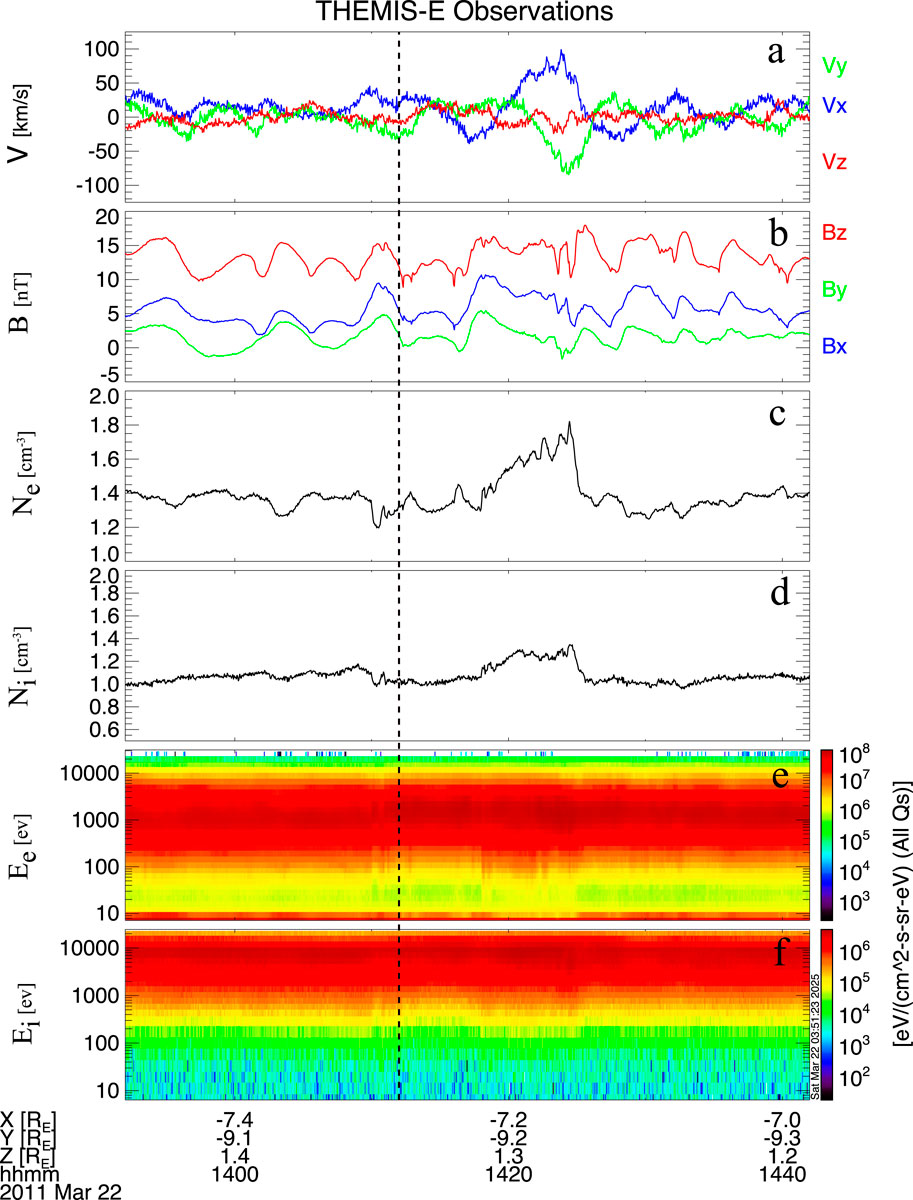
Figure 2. Observations of magnetospheric perturbations from the THEMIS-E satellite. (a) Three components of magnetospheric plasma flow velocity in GSM coordinates. (b) X, Y, and Z components of the magnetic field in GSM coordinates. (c,d) Electron and ion density profiles. (e,f) Electron and ion energy flux.
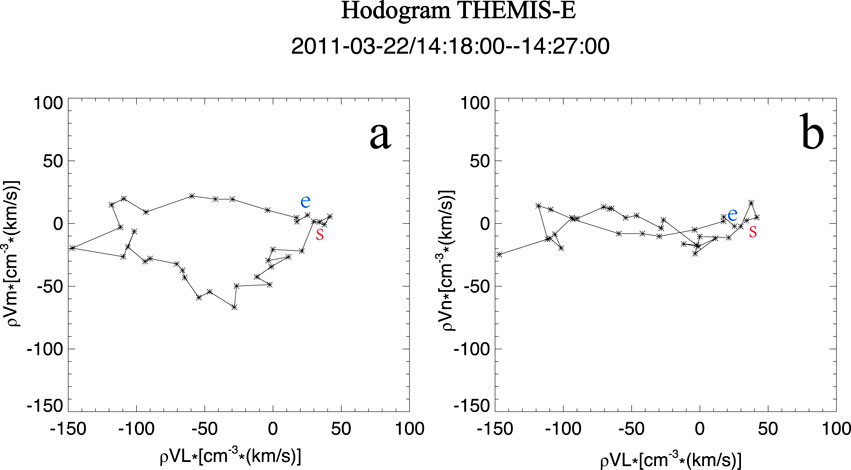
Figure 3. The hodogram derived from the MVA method illustrates the characteristics of the plasma flow vortex in the minimum variance coordinate system. ρVl, ρVm, and ρVn represent the maximum, intermediate, and minimum variance directions in the MVA coordinate system, respectively. Panel (a) shows the hodogram in the maximum–intermediate variance plane, while panel (b) presents the maximum–minimum variance components, demonstrating the rotational flow structure.
Shi et al. (2014) proposed that magnetospheric vortices can generate corresponding ionospheric vortices via FACs, implying a mirror relationship between the two. Therefore, ionospheric vortices can be used to indirectly study the characteristics of magnetospheric plasma vortices triggered by solar wind pressure pulses. To establish this magnetosphere-ionosphere connection, we traced the footpoint of the THEMIS-E satellite from the magnetosphere to the ionosphere in the Northern Hemisphere using the T04 magnetic field model, with realistic solar wind and IMF inputs. The footpoint was located between 3 and 4 magnetic local time (MLT), over North America (Figure 4). Based on the T04 model, the magnetospheric vortex was located on the dawnside. Since the satellite footpoint was over North America, we utilized ground-based magnetometer arrays in this region to calculate the EICs during the presence of the magnetospheric vortex. The spherical elementary current systems (SECS) method, developed in the late 1990s and widely applied to the International Monitor for Auroral Geomagnetic Effects (IMAGE) ground magnetometer array Amm and Viljanen, 1999), is employed in this study. The SECS technique defines two elementary current systems: a divergence-free system representing horizontal ionospheric currents confined within the ionosphere, and a curl-free system whose divergence corresponds to currents normal to the ionospheric surface. Assuming uniform ionospheric conductance, the divergence-free and curl-free current density components correspond to the Hall and Pedersen current density components, respectively. By superposing these two systems with appropriate weighting factors, any vector field on a spherical surface can be reconstructed. Weygand et al. (2011) further applied this method to ground magnetometer arrays in North America to derive equivalent ionospheric currents (EICs). Following Amm and Viljanen (1999) and Weygand et al. (2011), we apply the SECS method to ground magnetic field observations in North America to reproduce the EICs in this study. Figure 5 shows the time series of EICs near the footpoint of the THEMIS-E satellite between 14:16 and 14:27 UT. The black vectors represent the EICs, and the blue dot marks the satellite footpoint. At 14:16 UT, no EIC vortex was observed near the THEMIS-E footpoint, and no EIC vortices were detected in the noon sector. At 14:18 UT, the magnitude of the EICs increased, and a distinct clockwise vortex appeared near Hudson Bay (located at 8–9 MLT). Subsequently, the EIC vortex propagated westward and passed over the THEMIS-E footpoint.
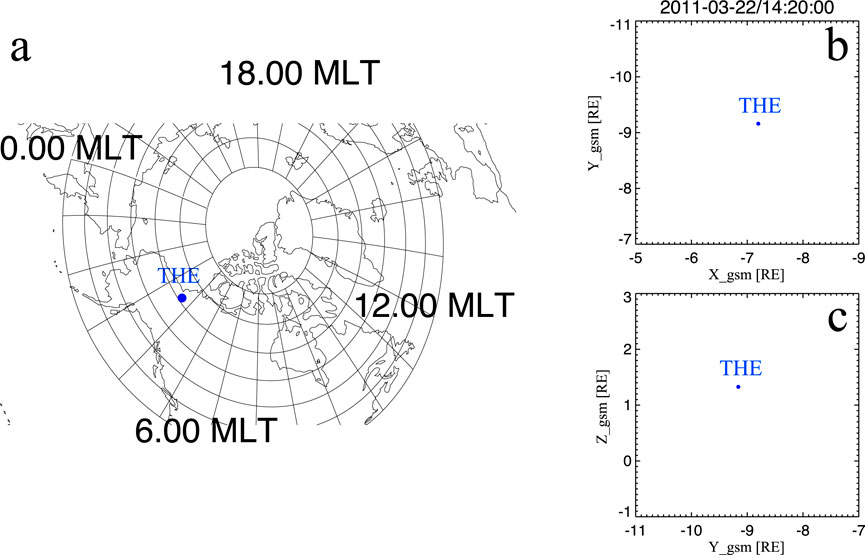
Figure 4. The footpoint of the THEMIS-E satellite in the altitude-adjusted corrected geomagnetic coordinates (AACGM) in the Northern Hemisphere. The blue solid dot represents the location of the THEMIS-E satellite footpoint. (a) Footpoint location of THEMIS-E mapped to the ground. (b,c) Positions of THEMIS-E in the GSM coordinate system shown in the xy and yz planes, respectively.
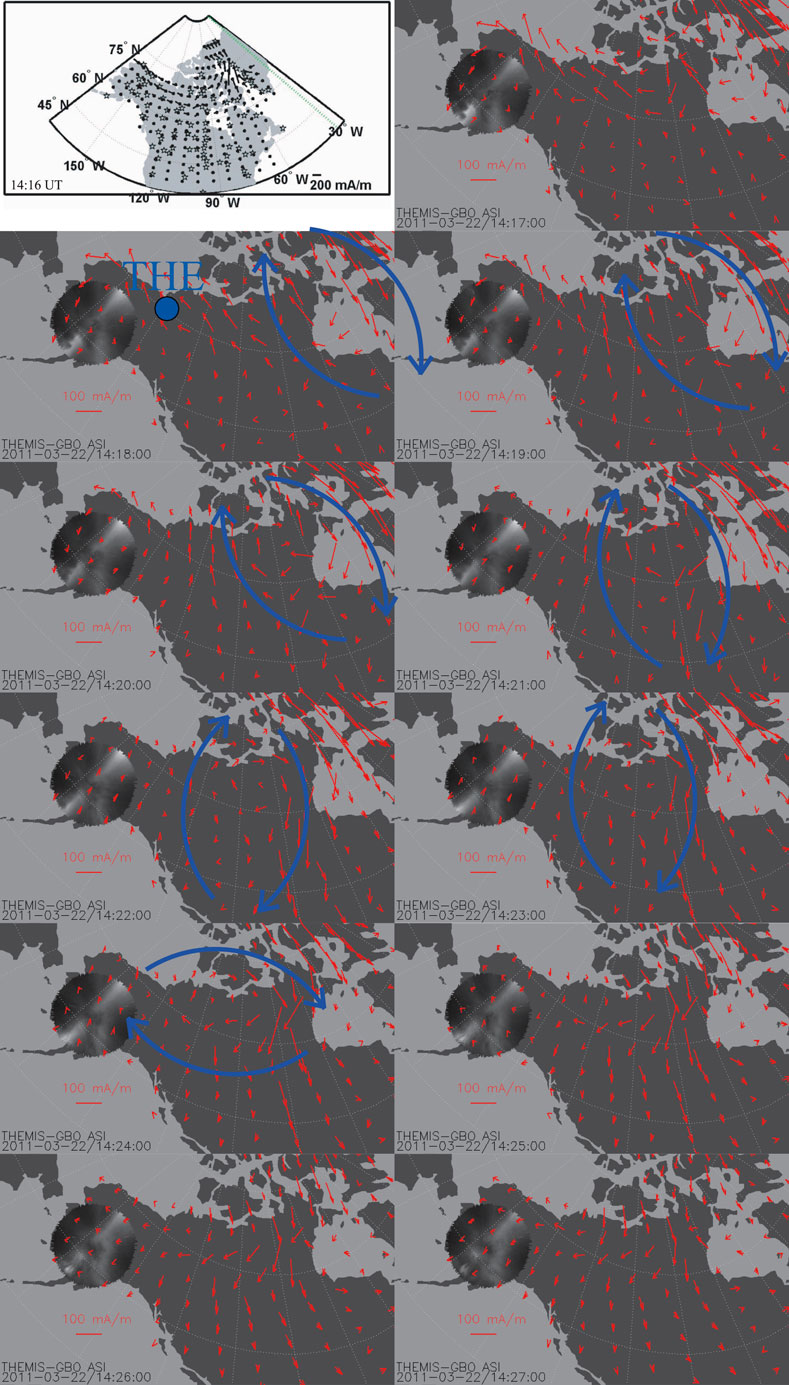
Figure 5. Time series of equivalent ionospheric currents (EICs) near the footpoint of the THEMIS satellite in the Northern Hemisphere. The stars in the 14:16 UT image correspond to the ground magnetometers used in this case. The blue solid dot indicates the footpoint of the THEMIS-E satellite. The magnitude of the EICs is represented by the length of the vectors, with the reference scale shown in the lower left corner. The blue vectors indicate the eic
Figure 6 shows the results of a piecewise parabolic method with a Lagrangian ramp global MHD simulation model (e.g., Hu et al., 2007). Realistic solar wind and interplanetary magnetic field conditions were used as inputs to simulate the magnetospheric response to a positive solar wind dynamic pressure pulse. At the same time, we used an empirical model (e.g., Shue et al., 1998) to estimate the variation in the magnetospheric shape in response to the positive solar wind dynamic pressure pulse. The subsolar magnetopause was located at approximately 10.8 Re along the X-axis in GSM coordinates before the pulse and moved inward to about 9.9 Re afterward. The empirical estimation indicates a magnetopause displacement of about 1 Re, which is consistent with the results obtained from the global MHD simulation. As shown in Figure 6, clockwise and counterclockwise magnetospheric vortices were generated in the dawnside and duskside magnetosphere, respectively. The global MHD simulation results indicate that these vortices propagated together and had similar radii of about 5–10 Re, consistent with previous observations and simulations (e.g., Shi et al., 2014; Zhao et al., 2016). The maximum vortex rotation speed reached ∼250 km/s, larger than the ∼100 km/s observed by THEMIS-E. This difference arises because the THEMIS-E satellite was located inside the magnetosphere, while the maximum vortex speed occurred near the magnetopause in the simulation. THEMIS-E was located at (−7.2, −9.2, 1.3) Re in GSM coordinates, where the simulated vortex speed was ∼100 km/s, consistent with in-situ observations. Together, the in-situ measurements and global MHD results demonstrate that a positive solar wind dynamic pressure pulse can generate a clockwise magnetospheric vortex on the dawnside, which is coupled to a clockwise EIC vortex via downward FACs.
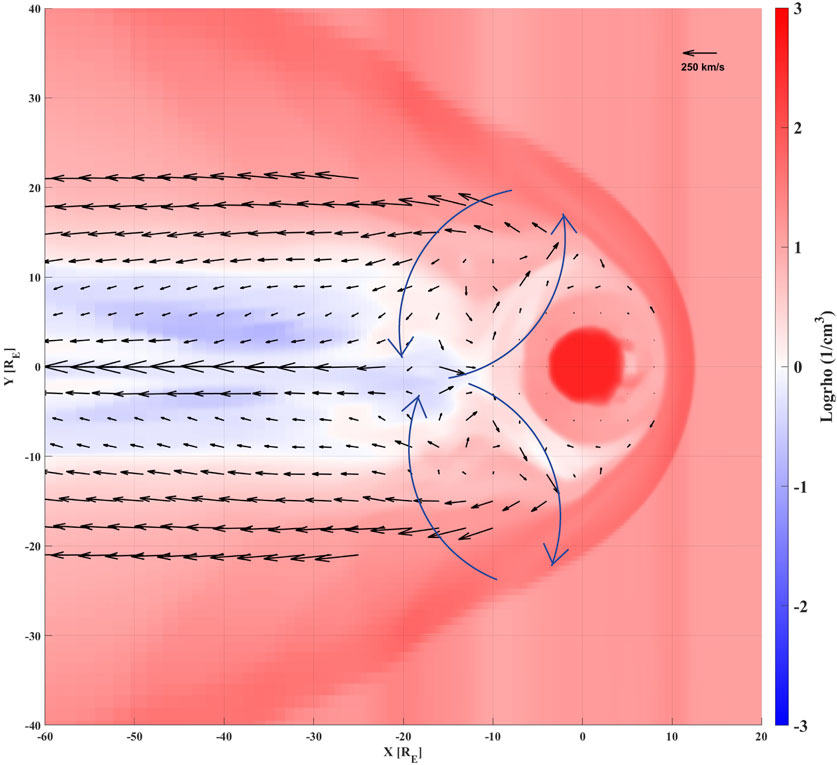
Figure 6. The global MHD simulation results. The arrows represent plasma velocities, and the background color represents plasma density. The blue vectors show the two clockwise and counterclockwise magnetospheric vortices in dawnside and duskside magnetosphere, respectively.
3.2 Event 2: 1 April 2011
On 1 April 2011, a positive solar wind dynamic pressure pulse (increasing from 1.5 nPa to 6.5 nPa) was detected at 16:26 UT. Following its arrival at the magnetosphere, the SYM-H index clearly increased from 4 nT to 22 nT. At that time, the THEMIS-E satellite was located in the dawnside magnetosphere at (−6.3, −8.4, 1.6) Re in GSM coordinates, where it observed the magnetospheric response to the compression caused by the dynamic pressure pulse, as shown in Figure 7. The total magnetic field increased significantly after the pulse, indicating that the magnetosphere underwent compression. Simultaneous enhancements in electron and ion densities further confirm this compression. In addition, the magnetospheric plasma flow velocity exhibited a clear bipolar signature, suggesting that a magnetospheric vortex passed over the THEMIS-E satellite (e.g., Keiling et al., 2009). To further analyze this event, we applied the minimum variance analysis (MVA) method to the plasma mass flux observed by THEMIS-E, and the results are shown in Figure 8. Figure 8a presents the maximum (ρVl) and intermediate (ρVm) variance components, while Figure 8b shows the maximum (ρVl) and minimum (ρVn) variance components. Between 16:30 and 16:36 UT, a large-scale rotational pattern is evident in the maximum and intermediate variance components, indicating that the bipolar plasma flow signature resulted from the satellite traversing a plasma flow vortex. Moreover, the red “s” and blue “e” markers in the figure denote the start and end of the vortex, respectively, showing that the vortex exhibited clockwise rotation.
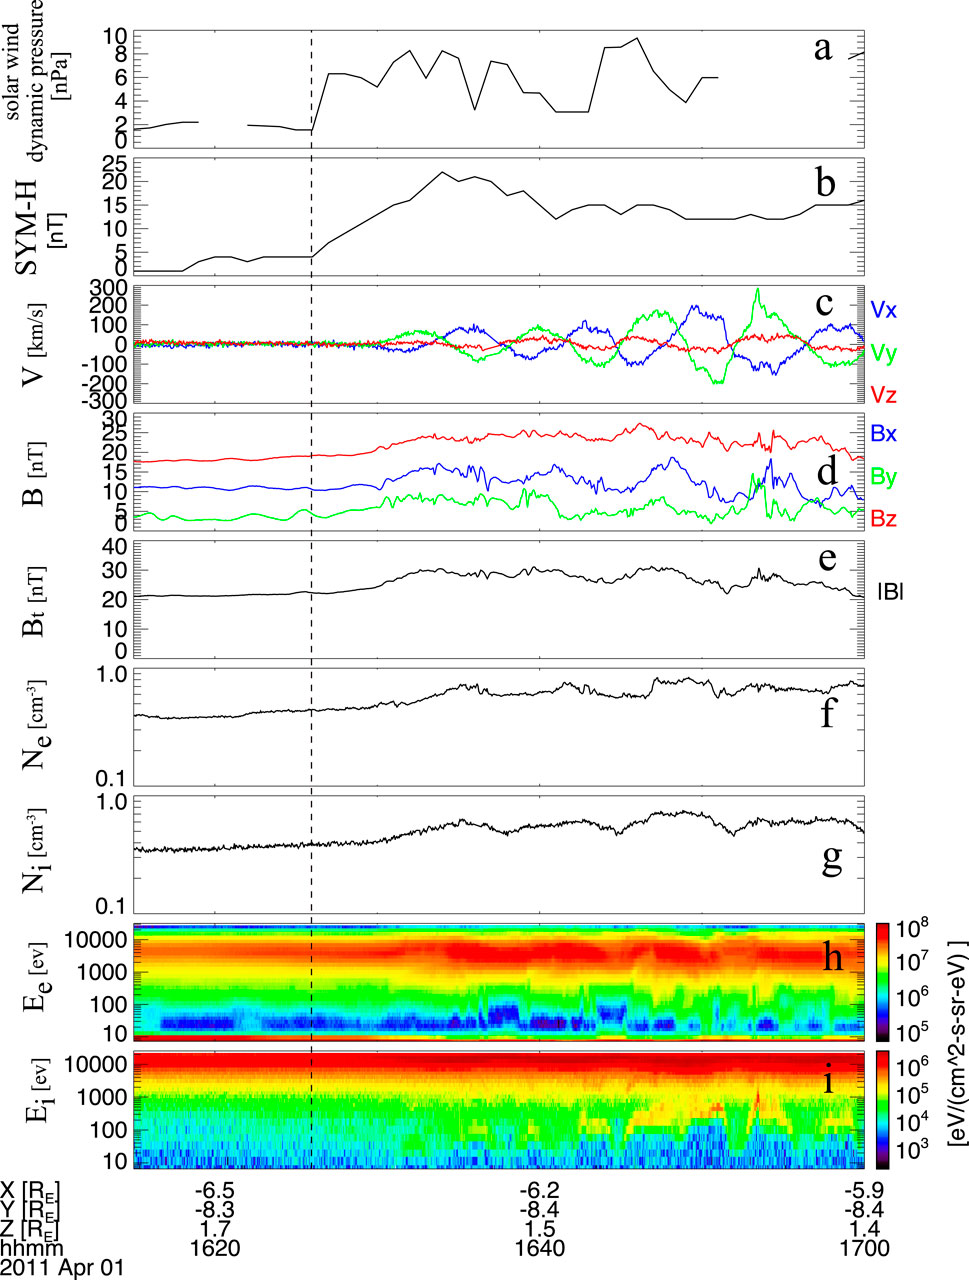
Figure 7. Solar wind and interplanetary magnetic field observations from the OMNI database, together with magnetospheric observations from the THEMIS-E satellite. (a) Solar wind dynamic pressure. (b) SYM-H index. (c) Three components of magnetospheric plasma flow velocity. (d) Three components of the magnetic field in GSM coordinates. (e) The total magnetic fields. (f,g) Electron and ion densities. (h,i) Electron and ion energy fluxes.
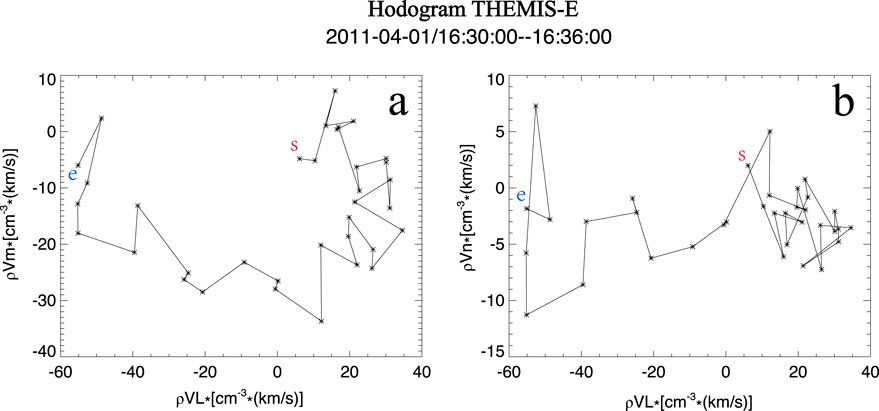
Figure 8. Hodogram results derived from the minimum variance analysis method, similar to those in Figure 3 but for the case on 1 April 2011. Panel (a) shows the hodogram in the maximum–intermediate variance plane, while panel (b) presents the maximum–minimum variance components, demonstrating the rotational flow structure.
4 Discussion
In this paper, we present observations of a magnetospheric flow vortex in the dawnside magnetosphere on 22 March 2011, following an increase in solar wind dynamic pressure. Minimum variance analysis indicates that the plasma flow vortex exhibited clockwise rotation. Additionally, a clockwise-rotating ionospheric current vortex was detected in the EICs system near the footpoint of the THEMIS satellite. These observations suggest that a positive solar wind dynamic pressure pulse can generate a plasma flow vortex in the dawnside magnetosphere, and that the magnetospheric vortex can also be reproduced by global MHD simulations.
With limited joint observation opportunities, other cases, such as 01 April 2011, have been found that are consistent with the results presented in this work. These similar observations suggest that the clockwise plasma flow vortex in the dawnside magnetosphere induced by a positive solar wind dynamic pressure pulse is not an isolated incident.
The WIND satellite observations indicate that the z-component of the IMF remained positive before and after the positive solar wind dynamic pressure pulse, but turned negative for approximately 3 min during the increase in solar wind dynamic pressure from 2.6 nPa to 4.8 nPa. However, the z-component of the IMF remained positive when the magnetospheric vortex was observed. To exclude the influence of magnetotail reconnection, we carefully examined the AE index (not shown in the figure) before and after the dynamic pressure pulse. The AE index remained below 110 nT, suggesting that no substorm onset occurred during this period. Keiling et al. (2009) and Yao et al. (2012) proposed that magnetotail reconnection can also generate plasma flow vortices in the nightside magnetosphere, where the earthward bursty bulk flows (BBFs) resulting from reconnection can divert and form a pair of vortices—clockwise on the dawnside and counterclockwise on the duskside. In the current case, the AE index was well below 200 nT, further indicating that no substorm activity was recorded during the time when the clockwise plasma flow vortex was observed by the THEMIS-E satellite. Thus, the AE index supports the interpretation that the dawnside magnetospheric vortex was generated by the positive solar wind dynamic pressure pulse rather than by magnetotail reconnection. Figure 5 also presents the time series of EICs in North America near the footpoint of the magnetospheric vortex. The EIC vortex did not initially appear near the midnight sector. The green dashed line in Figure 5 represents the 12 MLT meridian, showing that the observed clockwise EIC vortex was located in the dawn sector and is therefore more likely associated with the dynamic pressure pulse than with magnetotail reconnection. Both the AE index and the vortex location indicate that the dawnside clockwise magnetospheric vortex was induced by the positive solar wind dynamic pressure pulse. The generation mechanism of the magnetospheric vortex is also linked to external sources. Previous studies have suggested that variations in the IMF can directly drive plasma flow vortices and ULF waves (e.g., Walker et al., 2006; El-Alaoui et al., 2009; Nedie et al., 2012), with the z-component of the IMF often being consistent with the field line resonance (FLR) frequency (Nedie et al., 2012). Shi et al. (2014) showed via wavelet analysis that the frequency of the x-component of the IMF was close to the FLR observed by satellites, implying a connection between IMF variations and ULF wave generation. However, in the present case, we carefully examined the frequency spectra of all three IMF components during the observation period (Bx: 3.5 mHz, By: 3.0 mHz, Bz: 2.8 mHz) and found that none of them matched the frequency of the observed magnetospheric oscillation (1.5 mHz). This indicates that the plasma flow vortex and associated ULF waves were not driven by IMF variations in this event. Therefore, we conclude that the clockwise magnetospheric vortex observed in this case was primarily induced by the positive solar wind dynamic pressure pulse. Regarding the period of plasma flow oscillations, Sibeck (1990) and Shi et al. (2013) proposed that the compression and subsequent decompression of the magnetosphere following a dynamic pressure enhancement can lead to the generation of plasma flow vortices. In this case, the positive solar wind dynamic pressure pulse likely generated fast magnetosonic waves within the magnetosphere, and an Ampère force was produced at the front of the fast-mode waves (e.g., Lin, 2001; Samsonov et al., 2010; Wang et al., 2010; Samsonov and Sibeck, 2013). These fast magnetosonic waves propagated from the magnetopause toward the inner magnetosphere and were reflected by inner boundaries such as the plasmapause or ionosphere. The interaction between wave penetration and reflection forms the fundamental structure of the observed clockwise magnetospheric vortex. In the first case, the magnetospheric vortex was observed by the THEMIS satellite at 03–04 MLT. Whether the magnetospheric vortex associated with a positive dynamic pressure pulse can extend to 0 MLT remains uncertain. Previous studies have generally proposed that magnetospheric vortices are generated on the dayside magnetosphere and then propagate tailward, without specifying their exact starting or ending locations (e.g., Sibeck, 1990; Shi et al., 2014; Zhao et al., 2016). In our MHD simulation, the magnetospheric vortex disappeared beyond approximately 20 Re, suggesting that such vortices associated with positive solar wind dynamic pressure pulses may not form beyond this distance in the magnetotail. This may be attributed to the weakening or disappearance of fast magnetosonic wave reflection, although this remains speculative. Furthermore, we have identified two additional cases in which the magnetospheric vortices also disappeared beyond 20 Re. A more detailed quantitative analysis of this behavior will be presented in future work. The observed bipolar signature in the magnetospheric plasma flow velocity could also potentially be attributed to transient field-aligned flows or boundary motions. To examine these possibilities, we performed a MVA on the plasma flow data, which indicates that the bipolar signature is strongly associated with a magnetospheric flow vortex. Moreover, the EICs vortex supports this interpretation, as it propagated tailward together with the magnetospheric vortex, suggesting a coupled system. In addition, ground magnetometer data from the IMAGE array in the duskside magnetosphere were used to derive EICs. A counterclockwise EIC vortex was detected around 16 MLT (not shown in the manuscript), consistent with the global MHD simulation results. Both the EICs and simulation results therefore support the conclusion that the observed bipolar plasma flow velocity signature originates from a magnetospheric plasma flow vortex.
Sibeck, (1990) proposed that a positive solar wind dynamic pressure pulse can generate plasma flow vortices near the magnetopause. Building upon this, Araki (1994) introduced a simple model to explain the FACs in the prenoon and postnoon sectors of the dayside magnetosphere following a pressure pulse. In this model, upward and downward FACs occur in the prenoon and postnoon magnetosphere during the PI phase, and their directions reverse during the MI phase of a sudden commencement. Previous work has indicated that the FACs in PI phase was attributed to the mode conversion from fast magnetosonic wave generated by sudden compression of the dayside magnetosphere to the Alfvén wave (e.g., Tamao, 1964; Fujita et al., 2003a), and the induced dusk-to-dawn electric field following the sudden compression is considered as the source that gives rise to the FACs during PI phase in some other studies (e.g., Moretto et al., 2000; Yu and Ridley, 2009). For the FACs associated with the MI phase, earlier studies suggested that they are induced by plasma flow vortices (e.g., Yu and Ridley, 2009; Tian et al., 2016), indicating that the downward FACs during the MI phase are related to clockwise magnetospheric vortices in dawnside magnetosphere. Shi et al. (2020) reviewed previous observations and concluded that, following a positive solar wind dynamic pressure pulse, magnetospheric vortices tend to rotate clockwise in the dawnside sector and counterclockwise in the duskside sector. Conversely, a negative dynamic pressure pulse produces opposite rotation directions. Therefore, the clockwise-rotating magnetospheric vortex observed in this study is consistent with the models and predictions of Araki (1994) and Shi et al. (2020). Previous studies have demonstrated that magnetospheric flow vortices are closely coupled to ionospheric vortices through FACs, with upward and downward FACs modulating auroral luminosity. For instance, Zhao et al. (2019) presented a case study showing that a negative solar wind dynamic pressure pulse can generate a counterclockwise magnetospheric vortex, wherein the associated upward FACs enhance auroral emissions. In contrast, the downward FACs would lead to a reduction in auroral luminosity. In the present study, the all-sky camera was not operating near the footpoint of the THEMIS satellite. In future work, we will identify additional events to investigate whether a clockwise magnetospheric vortex can cause a decrease in auroral luminosity.
5 Conclusion
In this study, we present in situ observations and global simulations of a clockwise-rotating magnetospheric vortex in the dawnside magnetosphere, accompanied by a conjugate EIC vortex following a positive solar wind dynamic pressure pulse. The magnetospheric vortex exhibited a clockwise rotation consistent with the predictions of Sibeck, (1990) and Shi et al. (2020). Furthermore, the observed magnetospheric vortex appears to be connected to the ionospheric vortex through downward FACs. While our results provide valuable insights into the magnetosphere–ionosphere coupling process driven by dynamic pressure pulses, we acknowledge that this study is based on only two events, which limits its statistical significance. In future work, we plan to conduct a comprehensive statistical analysis to better understand the coupled magnetosphere–ionosphere response to solar wind dynamic pressure variations.
Data availability statement
Publicly available datasets were analyzed in this study. This data can be found here: https://cdaweb.gsfc.nasa.gov.
Author contributions
HZ: Conceptualization, Data curation, Formal Analysis, Funding acquisition, Investigation, Methodology, Project administration, Resources, Software, Supervision, Validation, Visualization, Writing – original draft, Writing – review and editing. HY: Funding acquisition, Writing – review and editing. XC: Software, Writing – review and editing. ZX: Software, Writing – review and editing. ZH: Data curation, Writing – review and editing. DH: Data curation, Writing – review and editing. BL: Data curation, Writing – review and editing. BZ: Resources, Writing – review and editing. JL: Resources, Writing – review and editing.
Funding
The author(s) declare that financial support was received for the research and/or publication of this article. This research was funded by Natural Science Foundation of Shanghai, grant number 21DZ1206100. This work was supported by the National Natural Science Foundation of China (42130210) and the Basic Research Project (DLCGZJYY-2024-038-02).
Acknowledgments
We are very grateful to NASA THEMIS contract NAS5-02099; J. Bonnell and F.S. Mozer for the use of the EFI data; C.W. Carlson and J.P. McFadden for the use of the ESA data; K.H. Glassmeier, U. Auster, and W. Baumjohann for the use of FGM data provided under the lead of the Technical University of Braunschweig and with financial support through the German Ministry for Economy and Technology and the German Center for Aviation and Space (DLR) under contract 50 OC 0302; S. Mende and C.T. Russell for the use of the GMAG data and NSF for support through grant AGS-1004814 and data provided by the Geophysical Institute Magnetometer Array operated by the Geophysical Institute, University of Alaska. We would like to thank J. M. Weygand for his help with the results of the equivalent ionospheric currents. The equivalent ionospheric currents also used data from MACCs, McMAC, STEP, AUTUMN, CARISMA, CANMOS, USGS, and magnetometer data from DTU. All THEMIS data can be obtained from http://themis.ssl.berkeley.edu/data/themis/. And the authors would like to thank CDAWeb for providing the Wind data.
Conflict of interest
The authors declare that the research was conducted in the absence of any commercial or financial relationships that could be construed as a potential conflict of interest.
Generative AI statement
The author(s) declare that no Generative AI was used in the creation of this manuscript.
Any alternative text (alt text) provided alongside figures in this article has been generated by Frontiers with the support of artificial intelligence and reasonable efforts have been made to ensure accuracy, including review by the authors wherever possible. If you identify any issues, please contact us.
Publisher’s note
All claims expressed in this article are solely those of the authors and do not necessarily represent those of their affiliated organizations, or those of the publisher, the editors and the reviewers. Any product that may be evaluated in this article, or claim that may be made by its manufacturer, is not guaranteed or endorsed by the publisher.
References
Amm, O., and Viljanen, A. (1999). Ionospheric disturbance magnetic field continuation from the ground to the ionosphere using spherical elementary current systems. Earth Planets Space 51, 431–440. doi:10.1186/bf03352247
Araki, T. (1994). “A physical model of the geomagnetic sudden commencement,” in Solar. wind sources of magnetospheric ultra-low-frequency waves, 183–200. doi:10.1029/GM081p0183
Auster, H. U., Glassmeier, K. H., Magnes, W., Aydogar, O., Baumjohann, W., Constantinescu, D., et al. (2008). The THEMIS fluxgate magnetometer. Space Sci. Rev. 141 (1–4), 235–264. doi:10.1007/s11214-008-9365-9
Borodkova, N. L., Zastenker, G. N., Riazantseva, M., and Richardson, J. D. (2005). Large. and sharp solar wind dynamic pressure variations as a source of geomagnetic field disturbances at the geosynchronous orbit. Planet. Space Sci. 53, 25–32. doi:10.1016/j.pss.2004.09.025
Burlaga, L. F. (1990). A heliospheric vortex street? J. Geophys. Res. 95 (A4), 4333–4336. doi:10.1029/JA095iA04p04333
Cahill, L. J., Lin, N. G., Waite, J. H., Engebretson, M. J., and Sugiura, M. (1990). Toroidal standing waves excited by a storm sudden commencement: DE 1 observations. J. Geophys. Res. 95 (A6), 7857–7867. doi:10.1029/JA095iA06p07857
El-Alaoui, M., Ashour-Abdalla, M., Walker, R. J., Peroomian, V., Richard, R. L., Angelopoulos, V., et al. (2009). Substorm evolution as revealed by THEMIS satellites and a global MHD simulation. J. Geophys. Res. 114, A08221. doi:10.1029/2009JA014133
El-Alaoui, M., Ashour-Abdalla, M., Richard, R. L., Goldstein, M. L., Weygand, J. M., and Walker, R. J. (2010). Global magnetohydrodynamic simulation of reconnection and turbulence in the plasma sheet. J. Geophys. Res. 115, A12236. doi:10.1029/2010JA015653
Engebretson, M. J., Hughes, W. J., Alford, J. L., Zesta, E., Cahill, L. J., Arnoldy, R. L., et al. (1995). MACCS observations of the spatial extent of broadband ULF magnetic pulsations at cusp/cleft latitudes. J. Geophys. Res. 100 (19), 371–386. doi:10.1029/95JA00768
Farrell, W. M., Thompson, R. F., Lepping, R. P., and Byrnes, J. B. (1995). A method of calibrating magnetometers on a spinning spacecraft. IEEE Trans. Magn. 31 (2), 966–972. doi:10.1109/20.364770
Friis-Christensen, E., McHenry, M., Clauer, C., and Vennerstr.m, S. (1988). Ionospheric traveling convection vortices observed near the polar cleft: a triggered response to sudden changes in the solar wind. Geophys. Res. Lett. 15 (3), 253–256. doi:10.1029/GL015i003p00253
Fujita, S., Tanaka, T., Kikuchi, T., Fujimoto, K., Hosokawa, K., and Itonaga, M. (2003a). A numerical simulation of the geomagnetic sudden commencement: 1. Generation of the field-aligned current associated with the preliminary impulse. J. Geophys. Res. 108 (A12), 2002JA009407. doi:10.1029/2002JA009407
Fujita, S., Tanaka, T., Kikuchi, T., Fujimoto, K., and Itonaga, M. (2003b). A numerical simulation of the geomagnetic sudden commencement: 2. Plasma processes in the main impulse. J. Geophys. Res. 108 (A12), 2002JA009763. doi:10.1029/2002JA009763
Fujita, S., Tanaka, T., Kikuchi, T., and Tsunomura, S. (2004). A numerical simulation of a negative sudden impulse. Earth Planets Space 56, 463–472. doi:10.1186/bf03352499
Glassmeier, K.-H., and Untiedt, J. (1989). Ground-based and satellite observations of traveling magnetospheric convection twin vortices. J. Geophys. Res. 94 (A3), 2520–2528. doi:10.1029/JA094iA03p02520
Gloeckler, G., Balsiger, H., Brgi, A., Bochsler, P., Fisk, L. A., Galvin, A. B., et al. (1995). The solar WIND and suprathermal ion composition investigation on the WIND spacecraft. Space Sci. Rev. 71 (1–4), 79–124. doi:10.1007/bf00751327
Hasegawa, H., Fujimoto, M., Phan, T.-D., Rème, H., Balogh, A., Dunlop, M. W., et al. (2004). Transport of solar wind into Earth’s magnetosphere through rolled-up Kelvin-Helmholtz vortices. Nature 430, 755–758. doi:10.1038/nature02799
Hones, E. W., Paschmann, G., Bame, S. J., Asbridge, J. R., Sckopke, N., and Schindler, K. (1978). Vortices in magnetospheric plasma flow. Geophys. Res. Lett. 5 (12), 1059–1062. doi:10.1029/GL005i012p01059
Hu, Y. Q., Guo, X. C., and Wang, C. (2007). On the ionospheric and reconnection potentials of the Earth: results from global MHD simulations. J. Geophys. Res. 112, A07215. doi:10.1029/2006JA012145
Jin, Y., Moen, J. I., Spicher, A., Liu, J., Clausen, L. B. N., and Miloch, W. J. (2023). Ionospheric flow vortex induced by the sudden decrease in the solar wind dynamic pressure. J. Geophys. Res. Space Phys. 128, e2023JA031690. doi:10.1029/2023JA031690
Juusola, L., Andreeova, K., Amm, O., Kauristie, K., Milan, S. E., Palmroth, M., et al. (2010). Effects of a solar wind dynamic pressure increase in the magnetosphere and in the ionosphere. Ann. Geophys. 28 (10), 1945–1959. doi:10.5194/angeo-28-1945-2010
Keiling, A., Angelopoulos, V., Runov, A., Weygand, J., Apatenkov, S. V., Mende, S., et al. (2009). Substorm current wedge driven by plasma flow vortices: THEMIS observations. J. Geophys. Res. 114, A00C22. doi:10.1029/2009JA014114
Lessard, M. R., Hudson, M. K., Anderson, B. J., Arnoldy, R. L., Luhr, H., Reeves, G. D., et al. (1999). Evidence for a global disturbance with monochromatic pulsations and energetic electron bunching. J. Geophys. Res. 104, 7011–7023. doi:10.1029/1998JA900155
Lin, Y. (2001). Global hybrid simulation of the dayside reconnection layer and associated field-aligned currents. J. Geophys. Res. 106 (A11), 25451–25465. doi:10.1029/2000JA000184
Liou, K., and Sibeck, D. G. (2014). Study of a global auroral Pc5 pulsation event with concurrent ULF waves. Geophys. Res. Lett. 41, 6547–6555. doi:10.1002/2014GL060755
Lui, A. T. Y., Spanswick, E., Donovan, E. F., Liang, J., Liu, W. W., LeContel, O., et al. (2010). A transient narrow poleward extrusion from the diffuse aurora and the concurrent magnetotail activity. J. Geophys. Res. 115, A10210. doi:10.1029/2010JA015449
Lyatsky, W. B., Sofko, G. J., Kustov, A. V., Andre, D., Hughes, W. J., and Murr, D. (1999). Traveling convection vortices as seen by the SuperDARN HF radars. J. Geophys. Res. 104 (A2), 2591–2601. doi:10.1029/1998JA900007
Mann, I. R., Milling, D. K., Rae, I. J., Ozeke, L. G., Kale, A., Kale, Z. C., et al. (2008). The upgraded CARISMA magnetometer array in the THEMIS Era. Space Sci. Rev. 141, 413–451. doi:10.1007/s11214-008-9457-6
McFadden, J. P., Carlson, C. W., Larson, D., Ludlam, M., Abiad, R., Elliott, B., et al. (2008). The THEMIS ESA plasma instrument and in-flight calibration. Space Sci. Rev. 141 (1–4), 277–302. doi:10.1007/978-0-387-89820-9_13
Meurant, M., Gérard, J., Hubert, B., Coumans, V., Blockx, C., Østgaard, N., et al. (2003). Dynamics of global scale electron and proton precipitation induced by a solar wind pressure pulse. Geophys. Res. Lett. 30 (20), 2003GL018017. doi:10.1029/2003GL018017
Moretto, T., Ridley, A. J., Engebretson, M. J., and Rasmussen, O. (2000). High-latitude ionospheric response to a sudden impulse event during northward IMF conditions. J. Geophys. Res. 105 (A2), 2521–2531. doi:10.1029/1999JA900475
Motoba, T., Kikuchi, T., Okuzawa, T., and Yumoto, K. (2003). Dynamical response of the magnetosphere-ionosphere system to a solar wind dynamic pressure oscillation. J. Geophys. Res. 108 (A5), 2002JA009696. doi:10.1029/2002JA009696
Murr, D. L., Hughes, W. J., Rodger, A. S., Zesta, E., Frey, H. U., and Weatherwax, A. T. (2002). Conjugate observations of traveling convection vortices: The field-aligned current system. J. Geophys. Res. 107 (A10), 1306. doi:10.1029/2002JA009456
Nedie, A. Z., Rankin, R., and Fenrich, F. R. (2012). SuperDARN observations of the driver wave associated with FLRs. J. Geophys. Res. 117, A06232. doi:10.1029/2011JA017387
Nopper, R. W., Hughes, W. J., Maclennan, C. G., and McPherton, R. L. (1982). Impulse-excited pulsations during the July 29, 1977, event. J. Geophys. Res. 87, 5911–5916. doi:10.1029/JA087iA08p05911
Russell, C. T., Chi, P. J., Dearborn, D. J., Ge, Y. S., Kuo-Tiong, B., Means, J. D., et al. (2008). THEMIS ground-based magnetometers. Space Sci. Rev. 141, 389–412. doi:10.1007/s11214-008-9337-0
Samsonov, A. A., and Sibeck, D. G. (2013). Large-scale flow vortices following a magnetospheric sudden impulse. J. Geophys. Res. Space Phys. 118, 3055–3064. doi:10.1002/jgra.50329
Samsonov, A. A., Sibeck, D. G., and Yu, Y.-Q. (2010). Transient changes in magnetospheric-ionospheric currents caused by the passage of an interplanetary shock: Northward interplanetary magnetic field case. J. Geophys. Res. 115, A05207. doi:10.1029/2009JA014751
Shi, Q. Q., Hartinger, M., Angelopoulos, V., Zong, Q., Zhou, X., Zhou, X., et al. (2013). THEMIS observations of ULF wave excitation in the nightside plasma sheet during sudden impulse events. J. Geophys. Res. Space Phys. 118, 284–298. doi:10.1029/2012JA017984
Shi, Q. Q., Hartinger, M., Angelopoulos, V., Tian, A., Fu, S., Zong, Q., et al. (2014). Solar wind pressure pulse-driven magnetospheric vortices and their global consequences. J. Geophys. Res. Space Phys. 119, 4274–4280. doi:10.1002/2013JA019551
Shi, Q. Q., Shen, X.-C., Tian, A. M., Degeling, A. W., Zong, Q., Fu, S. Y., et al. (2020). “Magnetosphere response to solar wind dynamic pressure change,” in Dayside magnetosphere interactions, 77–97. doi:10.1002/9781119509592.ch5
Shue, J.-H., Song, P., Russell, C. T., Steinberg, J. T., Chao, J. K., Zastenker, G., et al. (1998). Magnetopause location under extreme solar wind conditions. J. Geophys. Res. 103 (A8), 17691–17700. doi:10.1029/98JA01103
Sibeck, D. G. (1990). A model for the transient magnetospheric response to sudden solar wind dynamic pressure variations. J. Geophys. Res. 95 (A4), 3755–3771. doi:10.1029/JA095iA04p03755
Sibeck, D. G., Trivedi, N. B., Zesta, E., Decker, R. B., Singer, H. J., Szabo, A., et al. (2003). Pressure-pulse interaction with the magnetosphere and ionosphere. J. Geophys. Res. 108 (A2), 2002JA009675. doi:10.1029/2002JA009675
Sonnerup, B. U. O., and Scheible, M. (1998). Minimum and maximum variance analysis, in Analysis Methods for Multi-Spacecraft Data, edited by G. Paschmann, and P. W. Daly 185–220. Space Agency, Bern.
Sun, T. R., Wang, C., Li, H., and Guo, X. C. (2011). Nightside geosynchronous magnetic field response to interplanetary shocks: Model results. J. Geophys. Res. 116, A04216. doi:10.1029/2010JA016074
Sun, T. R., Wang, C., and Wang, Y. (2012). Different Bz response regions in the nightside magnetosphere after the arrival of an interplanetary shock: Multipoint observations compared with MHD simulations. J. Geophys. Res. 117, A05227. doi:10.1029/2011JA017303
Tamao, T. (1964). A hydromagnetic interpretation of geomagnetic SSC. Rep. Ionos. Space Res. Jpn. 18, 18–31.
Tian, A. M., Zong, Q. G., Wang, Y. F., Shi, Q. Q., Fu, S. Y., and Pu, Z. Y. (2010). A series of plasma flow vortices in the tail plasma sheet associated with solar wind pressure enhancement. J. Geophys. Res. 115, A09204. doi:10.1029/2009JA014989
Tian, A. M., Shen, X. C., Shi, Q. Q., Tang, B. B., Nowada, M., Zong, Q. G., et al. (2016). Dayside magnetospheric and ionospheric responses to solar wind pressure increase: Multispacecraft and ground observations. J. Geophys. Res. Space Phys. 121 (11), 813–830. doi:10.1002/2016JA022459
Walker, R. J., Ashour-Abdalla, M., El Alaoui, M., and Coroniti, F. V. (2006). Magnetospheric convection during prolonged intervals with southward interplanetary magnetic field. J. Geophys. Res. 111, A10219. doi:10.1029/2005JA011541
Wang, C., Liu, J. B., Huang, Z. H., and Richardson, J. D. (2007). Response of the magnetic field in the geosynchronous orbit to solar wind dynamic pressure pulses. J. Geophys. Res. 112, A12210. doi:10.1029/2007JA012664
Wang, C., Sun, T. R., Guo, X. C., and Richardson, J. D. (2010). Case study of nightside magnetospheric magnetic field response to interplanetary shocks. J. Geophys. Res. 115, A10247. doi:10.1029/2010JA015451
Weygand, J. M., Amm, O., Viljanen, A., Angelopoulos, V., Murr, D., Engebretson, M. J., et al. (2011). Application and validation of the spherical elementary currents systems technique for deriving ionospheric equivalent currents with the North American and Greenland ground magnetometer arrays. J. Geophys. Res. 116. doi:10.1029/2010JA016177
Wing, S., Sibeck, D. G., Wiltberger, M., and Singer, H. (2002). Geosynchronous magnetic field temporal response to solar wind and IMF variations. J. Geophys. Res. 107 (A8), 1222. doi:10.1029/2001JA009156
Yahnin, A., and Moretto, T. (1996). Travelling convection vortices in the ionosphere map to the central plasma sheet. Ann. Geophys. 14, 1025–1031. doi:10.1007/s00585-996-1025-3
Yang, Y. F., Lu, J. Y., Wang, J.-S., Peng, Z., Qian, Q., and Xiao, Y. (2011). Different response of dayside auroras to increases in solar wind dynamic pressure. J. Geophys. Res. 116, A08314. doi:10.1029/2010JA016385
Yang, Y. F., Lu, J. Y., Wang, J.-S., Peng, Z., and Zhou, L. (2013). Influence of interplanetary magnetic field and solar wind on auroral brightness in different regions. J. Geophys. Res. Space Phys. 118, 209–217. doi:10.1029/2012JA017727
Yao, Z. H., Pu, Z. Y., Fu, S. Y., Angelopoulos, V., Kubyshkina, M., Xing, X., et al. (2012). Mechanism of substorm current wedge formation: THEMIS observations. Geophys. Res. Lett. 39, L13102. doi:10.1029/2012GL052055
Yu, Y., and Ridley, A. J. (2009). The response of the magnetosphere-ionosphere system to a sudden dynamic pressure enhancement under southward IMF conditions. Ann. Geophys. 27, 4391–4407. doi:10.5194/angeo-27-4391-2009
Zhao, H. Y., Shen, X. C., Tang, B. B., Tian, A. M., Shi, Q. Q., Weygand, J. M., et al. (2016). Magnetospheric vortices and their global effect after a solar wind dynamic pressure decrease. J. Geophys. Res. Space Phys. 121, 1071–1077. doi:10.1002/2015JA021646
Zhao, H., Zhou, X.-Z., Zong, Q.-G., Weygand, J. M., Shi, Q., Liu, Y., et al. (2019). Small-scale aurora associated with magnetospheric flow vortices after a solar wind dynamic pressure decrease. J. Geophys. Res. Space Phys. 124, 3303–3311. doi:10.1029/2018JA026234
Zhou, X., and Tsurutani, B. T. (1999). Rapid intensification and propagation of the dayside aurora: Large scale interplanetary pressure pulses (fast shocks). Geophys. Res. Lett. 26, 1097–1100. doi:10.1029/1999GL900173
Zong, Q.-G., Zhou, X., Li, X., Song, P., Fu, S. Y., Baker, D. N., et al. (2007). Ultralow frequency modulation of energetic particles in the dayside magnetosphere. Geophys. Res. Lett. 34, L12105. doi:10.1029/2007GL029915
Keywords: dynamic pressure pulse, vortex, field-aligned currents, equivalent ionospheric currents, EICs vortex
Citation: Zhao H, Yang H, Chen X, Xing Z, Hu Z, Huang D, Li B, Zhang B and Liu J (2025) Magnetospheric and ionospheric vortices response to positive solar wind dynamic pressure pulse. Front. Astron. Space Sci. 12:1679345. doi: 10.3389/fspas.2025.1679345
Received: 04 August 2025; Accepted: 17 October 2025;
Published: 31 October 2025.
Edited by:
Boyi Wang, Harbin Institute of Technology, Shenzhen, ChinaReviewed by:
Ram Singh, Instituto Geofisico del Peru, PeruWaqar Younas, Boston University, United States
Tian Zhang, Kyoto University, Japan
Copyright © 2025 Zhao, Yang, Chen, Xing, Hu, Huang, Li, Zhang and Liu. This is an open-access article distributed under the terms of the Creative Commons Attribution License (CC BY). The use, distribution or reproduction in other forums is permitted, provided the original author(s) and the copyright owner(s) are credited and that the original publication in this journal is cited, in accordance with accepted academic practice. No use, distribution or reproduction is permitted which does not comply with these terms.
*Correspondence: Huigen Yang, eWFuZ2h1aWdlbkBwcmljLm9yZy5jbg==